Charleston, TN Map & Demographics
Charleston Map
Charleston Overview
$26,401
PER CAPITA INCOME
$77,206
AVG FAMILY INCOME
$64,792
AVG HOUSEHOLD INCOME
36.3%
WAGE / INCOME GAP [ % ]
63.7¢/ $1
WAGE / INCOME GAP [ $ ]
$12,982
FAMILY INCOME DEFICIT
0.35
INEQUALITY / GINI INDEX
641
TOTAL POPULATION
336
MALE POPULATION
305
FEMALE POPULATION
110.16
MALES / 100 FEMALES
90.77
FEMALES / 100 MALES
48.3
MEDIAN AGE
3.3
AVG FAMILY SIZE
2.6
AVG HOUSEHOLD SIZE
308
LABOR FORCE [ PEOPLE ]
57.2%
PERCENT IN LABOR FORCE
2.3%
UNEMPLOYMENT RATE
Charleston Zip Codes
Charleston Area Codes
Income in Charleston
Income Overview in Charleston
Per Capita Income in Charleston is $26,401, while median incomes of families and households are $77,206 and $64,792 respectively.
| Characteristic | Number | Measure |
| Per Capita Income | 641 | $26,401 |
| Median Family Income | 162 | $77,206 |
| Mean Family Income | 162 | $74,951 |
| Median Household Income | 248 | $64,792 |
| Mean Household Income | 248 | $66,356 |
| Income Deficit | 162 | $12,982 |
| Wage / Income Gap (%) | 641 | 36.27% |
| Wage / Income Gap ($) | 641 | 63.73¢ per $1 |
| Gini / Inequality Index | 641 | 0.35 |
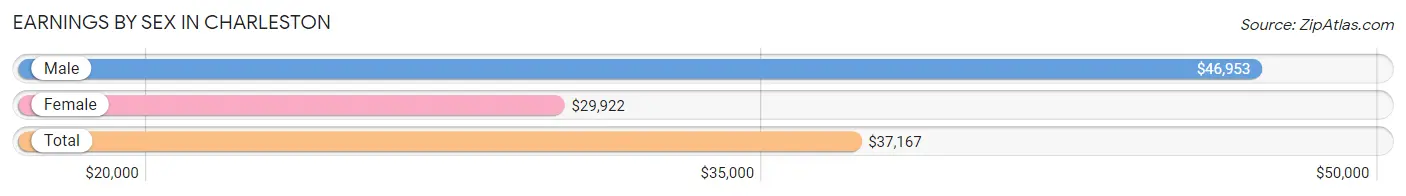
Earnings by Sex in Charleston
Average Earnings in Charleston are $37,167, $46,953 for men and $29,922 for women, a difference of 36.3%.
| Sex | Number | Average Earnings |
| Male | 173 (54.7%) | $46,953 |
| Female | 143 (45.3%) | $29,922 |
| Total | 316 (100.0%) | $37,167 |
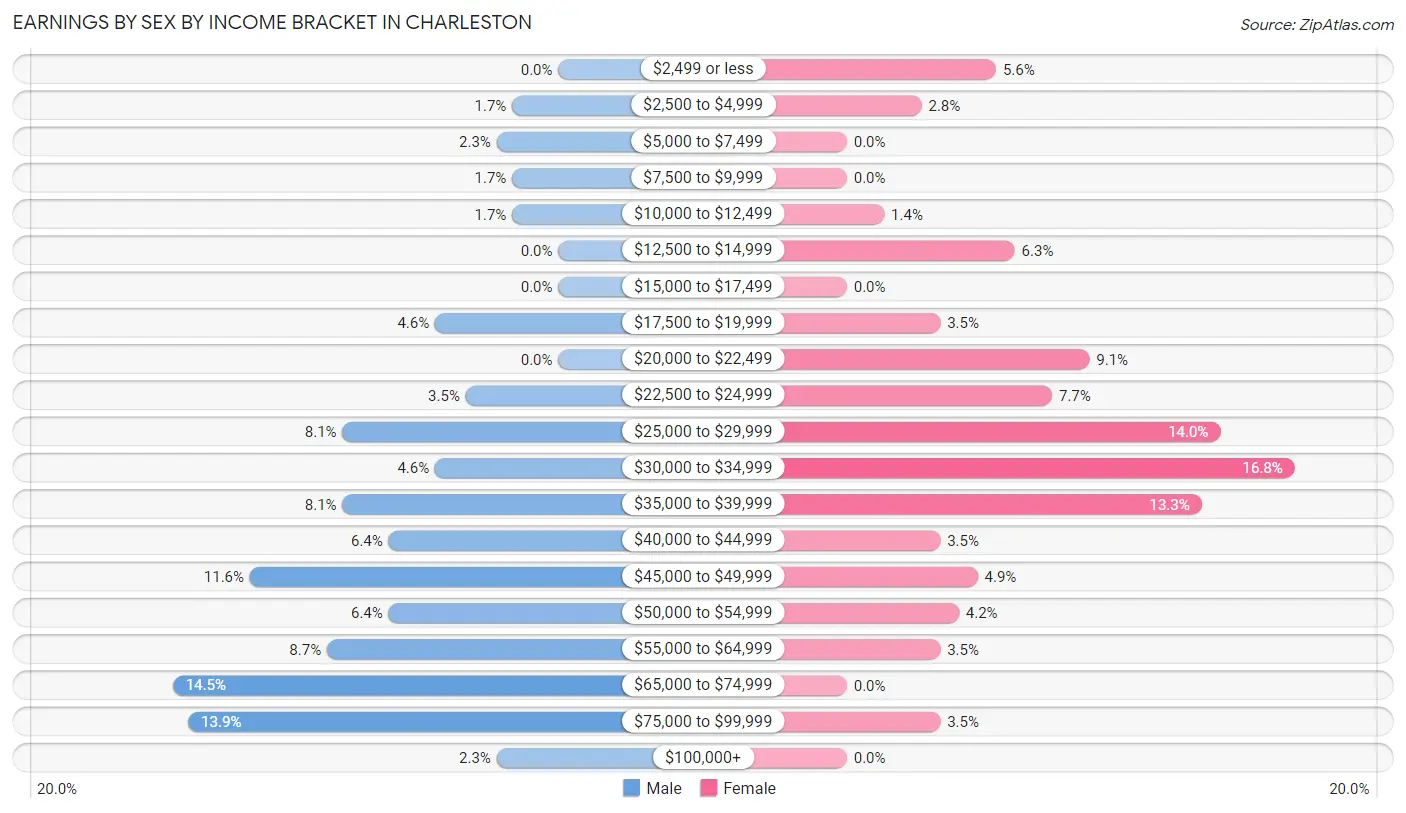
Earnings by Sex by Income Bracket in Charleston
The most common earnings brackets in Charleston are $65,000 to $74,999 for men (25 | 14.4%) and $30,000 to $34,999 for women (24 | 16.8%).
| Income | Male | Female |
| $2,499 or less | 0 (0.0%) | 8 (5.6%) |
| $2,500 to $4,999 | 3 (1.7%) | 4 (2.8%) |
| $5,000 to $7,499 | 4 (2.3%) | 0 (0.0%) |
| $7,500 to $9,999 | 3 (1.7%) | 0 (0.0%) |
| $10,000 to $12,499 | 3 (1.7%) | 2 (1.4%) |
| $12,500 to $14,999 | 0 (0.0%) | 9 (6.3%) |
| $15,000 to $17,499 | 0 (0.0%) | 0 (0.0%) |
| $17,500 to $19,999 | 8 (4.6%) | 5 (3.5%) |
| $20,000 to $22,499 | 0 (0.0%) | 13 (9.1%) |
| $22,500 to $24,999 | 6 (3.5%) | 11 (7.7%) |
| $25,000 to $29,999 | 14 (8.1%) | 20 (14.0%) |
| $30,000 to $34,999 | 8 (4.6%) | 24 (16.8%) |
| $35,000 to $39,999 | 14 (8.1%) | 19 (13.3%) |
| $40,000 to $44,999 | 11 (6.4%) | 5 (3.5%) |
| $45,000 to $49,999 | 20 (11.6%) | 7 (4.9%) |
| $50,000 to $54,999 | 11 (6.4%) | 6 (4.2%) |
| $55,000 to $64,999 | 15 (8.7%) | 5 (3.5%) |
| $65,000 to $74,999 | 25 (14.4%) | 0 (0.0%) |
| $75,000 to $99,999 | 24 (13.9%) | 5 (3.5%) |
| $100,000+ | 4 (2.3%) | 0 (0.0%) |
| Total | 173 (100.0%) | 143 (100.0%) |
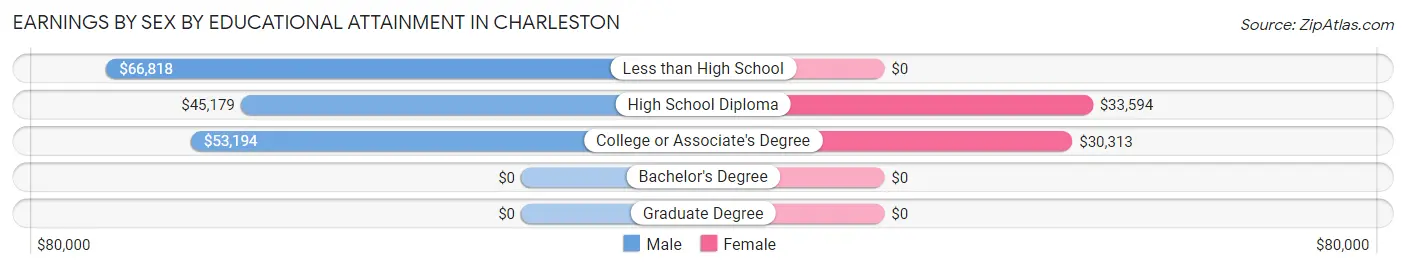
Earnings by Sex by Educational Attainment in Charleston
Average earnings in Charleston are $51,250 for men and $30,833 for women, a difference of 39.8%. Men with an educational attainment of less than high school enjoy the highest average annual earnings of $66,818, while those with high school diploma education earn the least with $45,179. Women with an educational attainment of high school diploma earn the most with the average annual earnings of $33,594, while those with college or associate's degree education have the smallest earnings of $30,313.
| Educational Attainment | Male Income | Female Income |
| Less than High School | $66,818 | $0 |
| High School Diploma | $45,179 | $33,594 |
| College or Associate's Degree | $53,194 | $30,313 |
| Bachelor's Degree | - | - |
| Graduate Degree | - | - |
| Total | $51,250 | $30,833 |
Family Income in Charleston
Family Income Brackets in Charleston
According to the Charleston family income data, there are 52 families falling into the $75,000 to $99,999 income range, which is the most common income bracket and makes up 32.1% of all families.
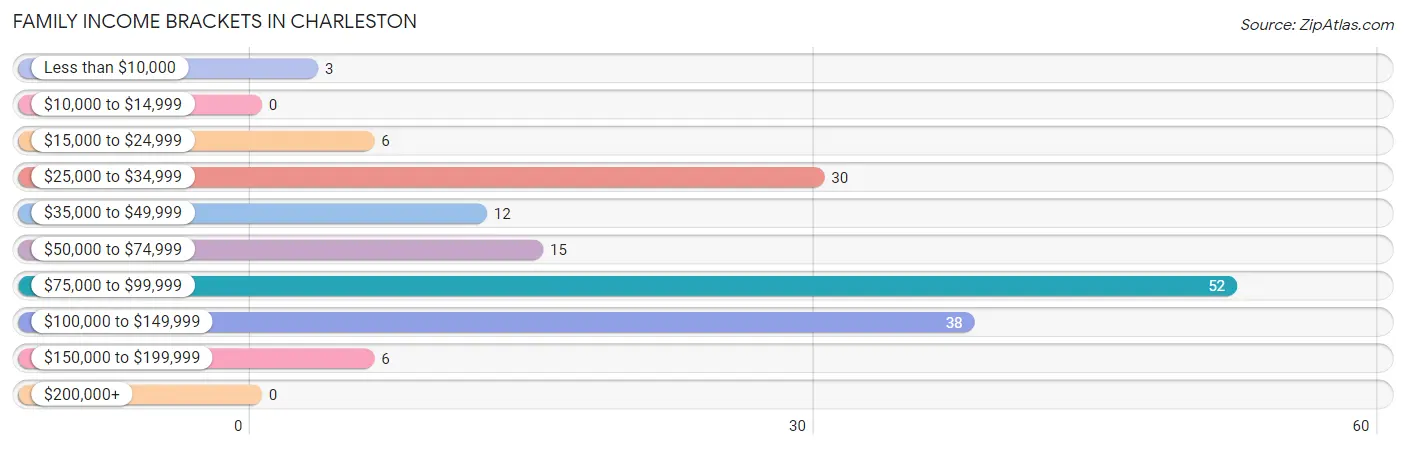
| Income Bracket | # Families | % Families |
| Less than $10,000 | 3 | 1.9% |
| $10,000 to $14,999 | 0 | 0.0% |
| $15,000 to $24,999 | 6 | 3.7% |
| $25,000 to $34,999 | 30 | 18.5% |
| $35,000 to $49,999 | 12 | 7.4% |
| $50,000 to $74,999 | 15 | 9.3% |
| $75,000 to $99,999 | 52 | 32.1% |
| $100,000 to $149,999 | 38 | 23.5% |
| $150,000 to $199,999 | 6 | 3.7% |
| $200,000+ | 0 | 0.0% |
Family Income by Famaliy Size in Charleston
2-person families (60 | 37.0%) account for the highest median family income in Charleston with $89,167 per family, while 2-person families (60 | 37.0%) have the highest median income of $44,584 per family member.
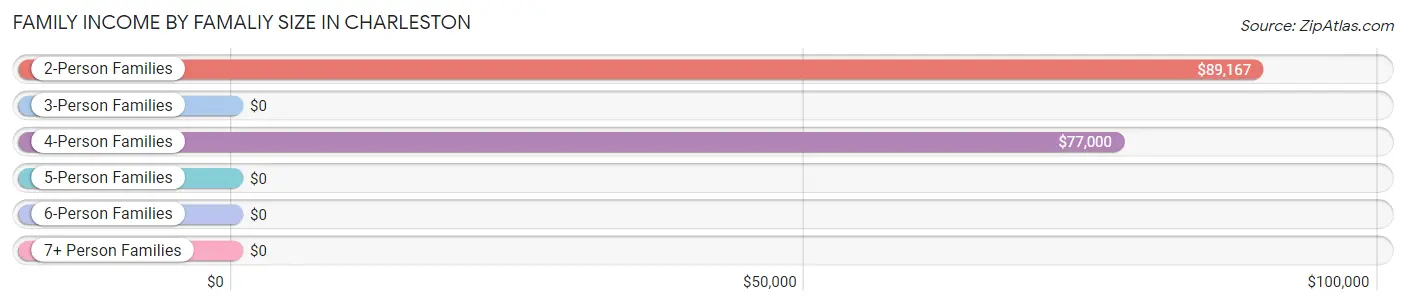
| Income Bracket | # Families | Median Income |
| 2-Person Families | 60 (37.0%) | $89,167 |
| 3-Person Families | 46 (28.4%) | $0 |
| 4-Person Families | 40 (24.7%) | $77,000 |
| 5-Person Families | 0 (0.0%) | $0 |
| 6-Person Families | 13 (8.0%) | $0 |
| 7+ Person Families | 3 (1.8%) | $0 |
| Total | 162 (100.0%) | $77,206 |
Family Income by Number of Earners in Charleston
The median family income in Charleston is $77,206, with families comprising 3+ earners (17) having the highest median family income of $101,250, while families with no earners (33) have the lowest median family income of $33,869, accounting for 10.5% and 20.4% of families, respectively.
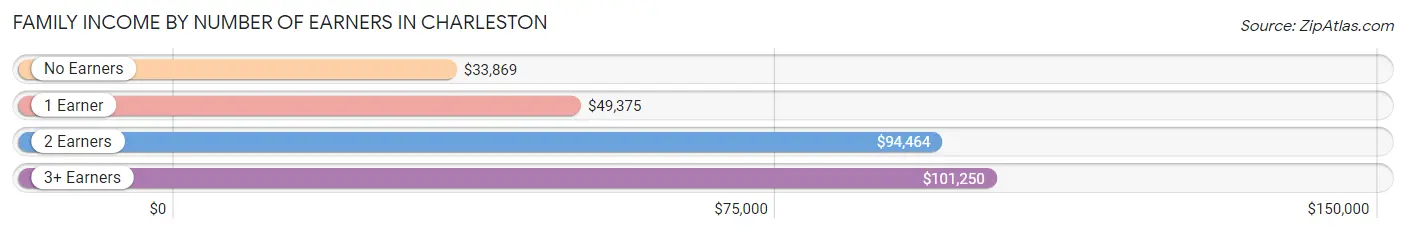
| Number of Earners | # Families | Median Income |
| No Earners | 33 (20.4%) | $33,869 |
| 1 Earner | 39 (24.1%) | $49,375 |
| 2 Earners | 73 (45.1%) | $94,464 |
| 3+ Earners | 17 (10.5%) | $101,250 |
| Total | 162 (100.0%) | $77,206 |
Household Income in Charleston
Household Income Brackets in Charleston
With 48 households falling in the category, the $75,000 to $99,999 income range is the most frequent in Charleston, accounting for 19.4% of all households.
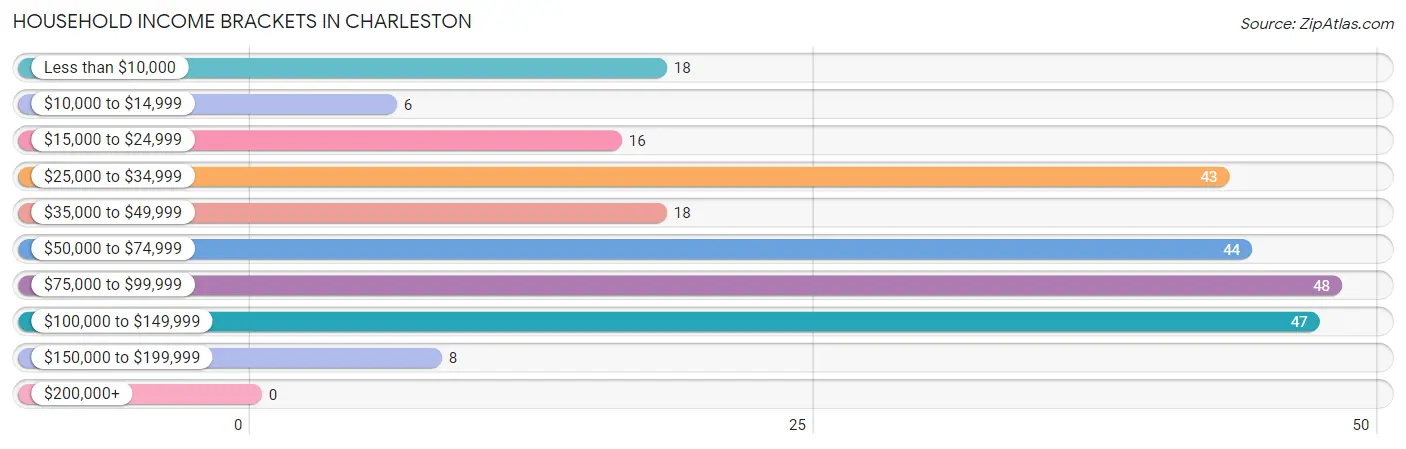
| Income Bracket | # Households | % Households |
| Less than $10,000 | 18 | 7.3% |
| $10,000 to $14,999 | 6 | 2.4% |
| $15,000 to $24,999 | 16 | 6.5% |
| $25,000 to $34,999 | 43 | 17.3% |
| $35,000 to $49,999 | 18 | 7.3% |
| $50,000 to $74,999 | 44 | 17.7% |
| $75,000 to $99,999 | 48 | 19.4% |
| $100,000 to $149,999 | 47 | 19.0% |
| $150,000 to $199,999 | 8 | 3.2% |
| $200,000+ | 0 | 0.0% |
Household Income by Householder Age in Charleston
The median household income in Charleston is $64,792, with the highest median household income of $78,333 found in the 45 to 64 years age bracket for the primary householder. A total of 112 households (45.2%) fall into this category. Meanwhile, the 65+ years age bracket for the primary householder has the lowest median household income of $34,167, with 76 households (30.6%) in this group.
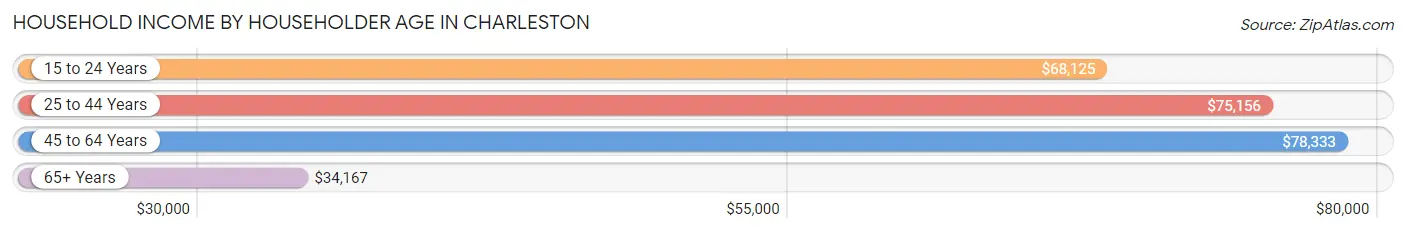
| Income Bracket | # Households | Median Income |
| 15 to 24 Years | 7 (2.8%) | $68,125 |
| 25 to 44 Years | 53 (21.4%) | $75,156 |
| 45 to 64 Years | 112 (45.2%) | $78,333 |
| 65+ Years | 76 (30.6%) | $34,167 |
| Total | 248 (100.0%) | $64,792 |
Poverty in Charleston
Income Below Poverty by Sex and Age in Charleston
With 10.7% poverty level for males and 12.8% for females among the residents of Charleston, 75 year old and over males and 75 year old and over females are the most vulnerable to poverty, with 11 males (34.4%) and 9 females (81.8%) in their respective age groups living below the poverty level.
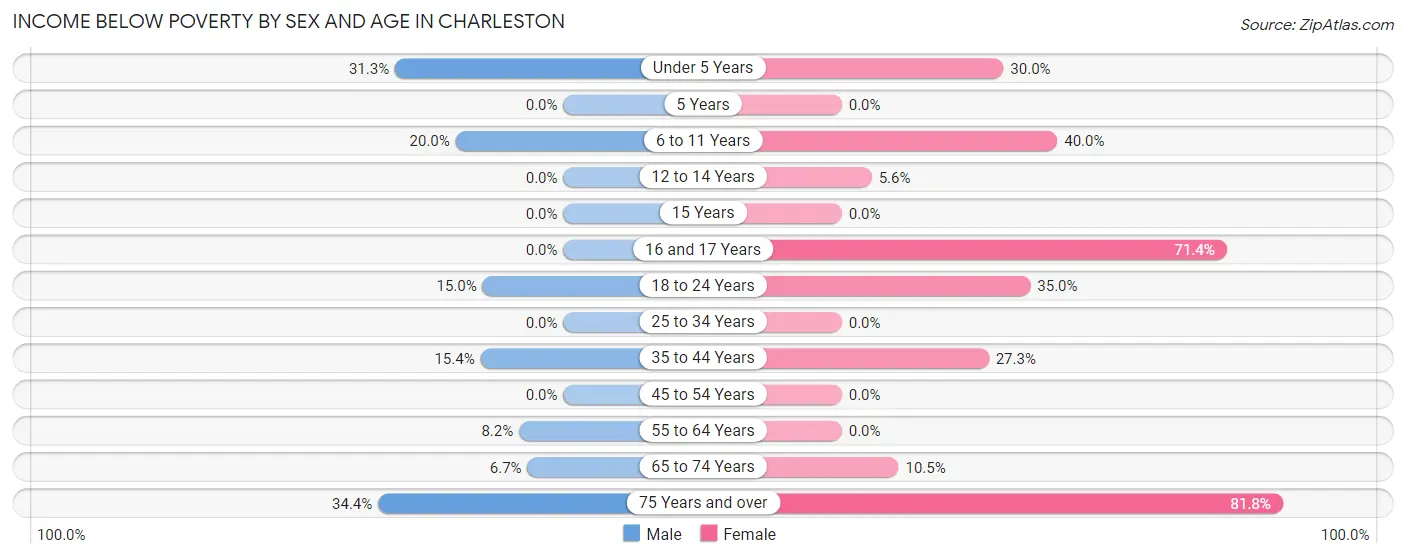
| Age Bracket | Male | Female |
| Under 5 Years | 5 (31.2%) | 3 (30.0%) |
| 5 Years | 0 (0.0%) | 0 (0.0%) |
| 6 to 11 Years | 5 (20.0%) | 6 (40.0%) |
| 12 to 14 Years | 0 (0.0%) | 1 (5.6%) |
| 15 Years | 0 (0.0%) | 0 (0.0%) |
| 16 and 17 Years | 0 (0.0%) | 5 (71.4%) |
| 18 to 24 Years | 3 (15.0%) | 7 (35.0%) |
| 25 to 34 Years | 0 (0.0%) | 0 (0.0%) |
| 35 to 44 Years | 4 (15.4%) | 6 (27.3%) |
| 45 to 54 Years | 0 (0.0%) | 0 (0.0%) |
| 55 to 64 Years | 6 (8.2%) | 0 (0.0%) |
| 65 to 74 Years | 2 (6.7%) | 2 (10.5%) |
| 75 Years and over | 11 (34.4%) | 9 (81.8%) |
| Total | 36 (10.7%) | 39 (12.8%) |
Income Above Poverty by Sex and Age in Charleston
According to the poverty statistics in Charleston, males aged 5 years and females aged 5 years are the age groups that are most secure financially, with 100.0% of males and 100.0% of females in these age groups living above the poverty line.
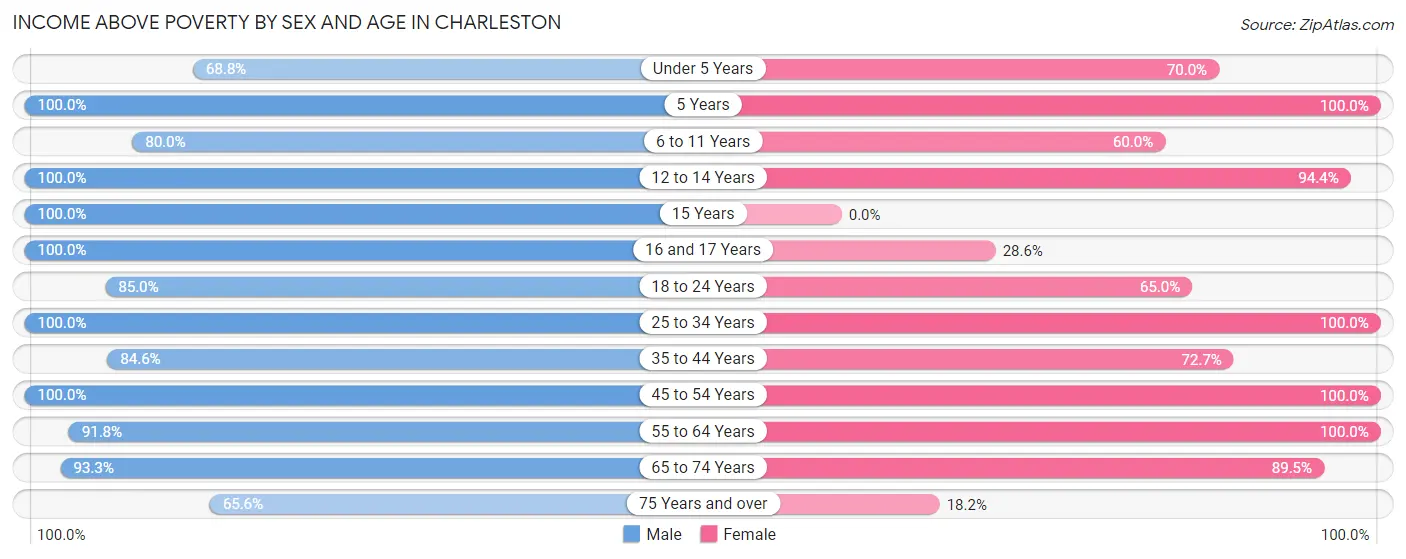
| Age Bracket | Male | Female |
| Under 5 Years | 11 (68.8%) | 7 (70.0%) |
| 5 Years | 9 (100.0%) | 3 (100.0%) |
| 6 to 11 Years | 20 (80.0%) | 9 (60.0%) |
| 12 to 14 Years | 4 (100.0%) | 17 (94.4%) |
| 15 Years | 3 (100.0%) | 0 (0.0%) |
| 16 and 17 Years | 3 (100.0%) | 2 (28.6%) |
| 18 to 24 Years | 17 (85.0%) | 13 (65.0%) |
| 25 to 34 Years | 24 (100.0%) | 45 (100.0%) |
| 35 to 44 Years | 22 (84.6%) | 16 (72.7%) |
| 45 to 54 Years | 71 (100.0%) | 45 (100.0%) |
| 55 to 64 Years | 67 (91.8%) | 90 (100.0%) |
| 65 to 74 Years | 28 (93.3%) | 17 (89.5%) |
| 75 Years and over | 21 (65.6%) | 2 (18.2%) |
| Total | 300 (89.3%) | 266 (87.2%) |
Income Below Poverty Among Married-Couple Families in Charleston
The poverty statistics for married-couple families in Charleston show that 8.3% or 11 of the total 133 families live below the poverty line. Families with 3 or 4 children have the highest poverty rate of 50.0%, comprising of 6 families. On the other hand, families with 5 or more children have the lowest poverty rate of 0.0%, which includes 0 families.
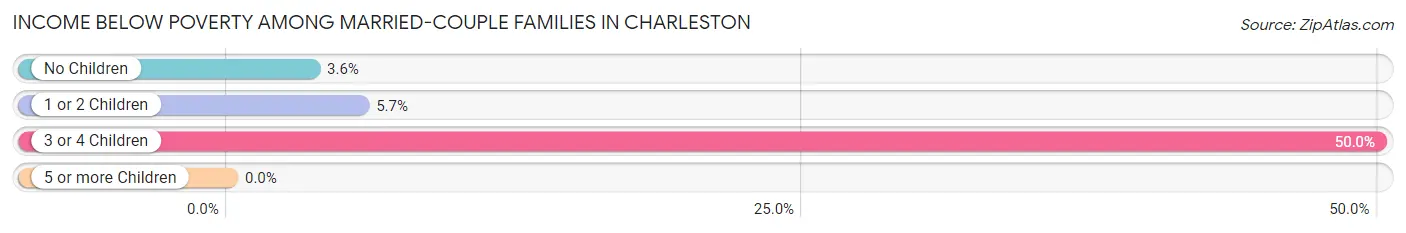
| Children | Above Poverty | Below Poverty |
| No Children | 81 (96.4%) | 3 (3.6%) |
| 1 or 2 Children | 33 (94.3%) | 2 (5.7%) |
| 3 or 4 Children | 6 (50.0%) | 6 (50.0%) |
| 5 or more Children | 2 (100.0%) | 0 (0.0%) |
| Total | 122 (91.7%) | 11 (8.3%) |
Income Below Poverty Among Single-Parent Households in Charleston
| Children | Single Father | Single Mother |
| No Children | 0 (0.0%) | 0 (0.0%) |
| 1 or 2 Children | 0 (0.0%) | 0 (0.0%) |
| 3 or 4 Children | 0 (0.0%) | 0 (0.0%) |
| 5 or more Children | 0 (0.0%) | 0 (0.0%) |
| Total | 0 (0.0%) | 0 (0.0%) |
Income Below Poverty Among Married-Couple vs Single-Parent Households in Charleston
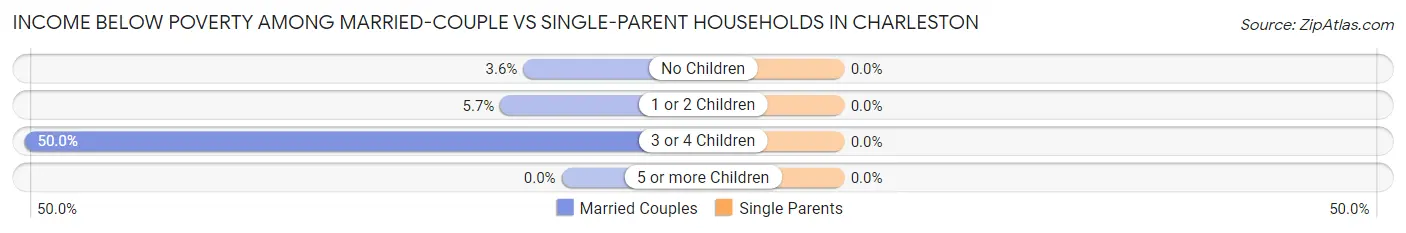
| Children | Married-Couple Families | Single-Parent Households |
| No Children | 3 (3.6%) | 0 (0.0%) |
| 1 or 2 Children | 2 (5.7%) | 0 (0.0%) |
| 3 or 4 Children | 6 (50.0%) | 0 (0.0%) |
| 5 or more Children | 0 (0.0%) | 0 (0.0%) |
| Total | 11 (8.3%) | 0 (0.0%) |
Race in Charleston
The most populous races in Charleston are White / Caucasian (521 | 81.3%), Black / African American (57 | 8.9%), and Two or more Races (49 | 7.6%).
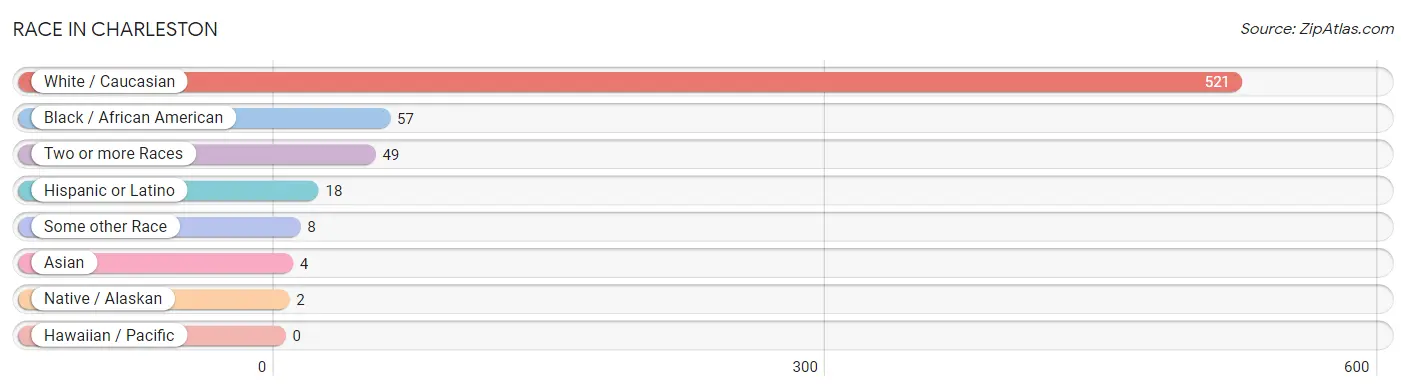
| Race | # Population | % Population |
| Asian | 4 | 0.6% |
| Black / African American | 57 | 8.9% |
| Hawaiian / Pacific | 0 | 0.0% |
| Hispanic or Latino | 18 | 2.8% |
| Native / Alaskan | 2 | 0.3% |
| White / Caucasian | 521 | 81.3% |
| Two or more Races | 49 | 7.6% |
| Some other Race | 8 | 1.3% |
| Total | 641 | 100.0% |
Ancestry in Charleston
The most populous ancestries reported in Charleston are Irish (86 | 13.4%), English (77 | 12.0%), American (54 | 8.4%), German (52 | 8.1%), and Dutch (11 | 1.7%), together accounting for 43.7% of all Charleston residents.
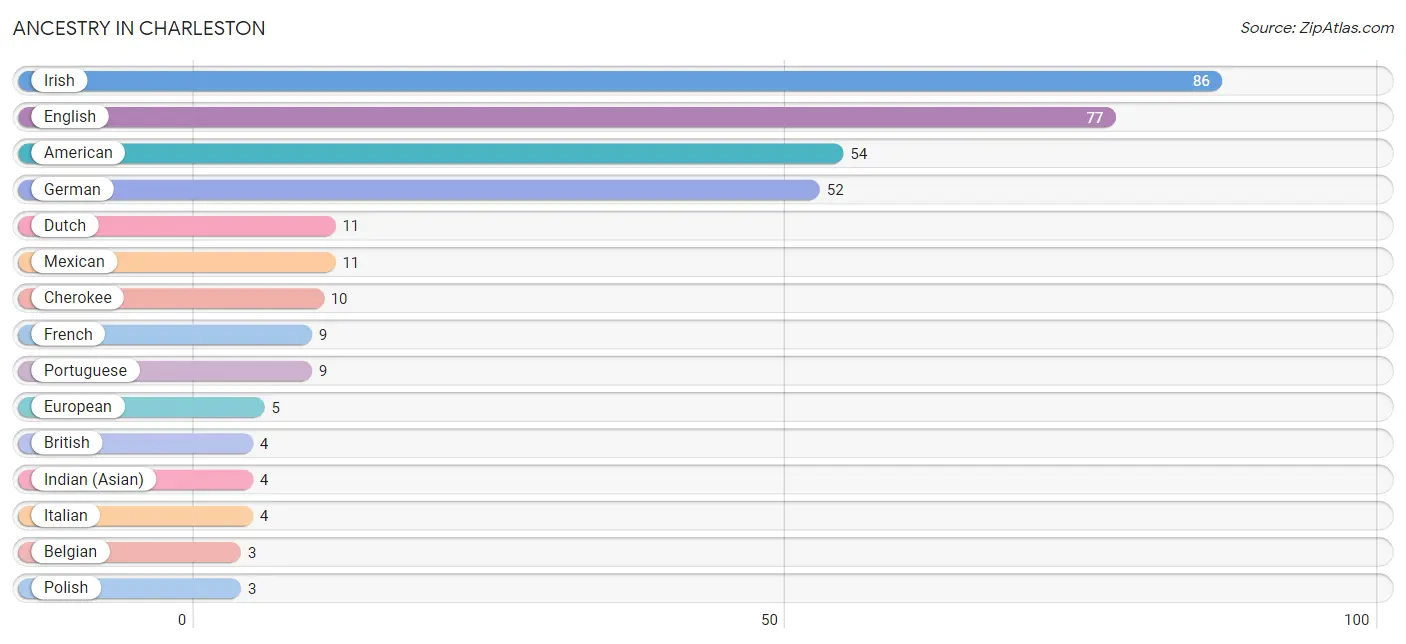
| Ancestry | # Population | % Population |
| American | 54 | 8.4% |
| Belgian | 3 | 0.5% |
| British | 4 | 0.6% |
| Central American | 2 | 0.3% |
| Central American Indian | 2 | 0.3% |
| Cherokee | 10 | 1.6% |
| Dutch | 11 | 1.7% |
| English | 77 | 12.0% |
| European | 5 | 0.8% |
| French | 9 | 1.4% |
| German | 52 | 8.1% |
| Greek | 2 | 0.3% |
| Guatemalan | 2 | 0.3% |
| Indian (Asian) | 4 | 0.6% |
| Irish | 86 | 13.4% |
| Italian | 4 | 0.6% |
| Mexican | 11 | 1.7% |
| Polish | 3 | 0.5% |
| Portuguese | 9 | 1.4% |
| Sri Lankan | 3 | 0.5% | View All 20 Rows |
Immigrants in Charleston
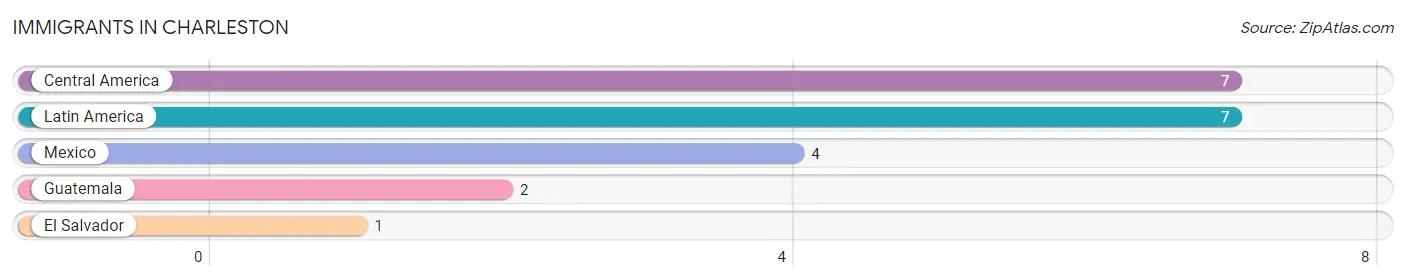
The most numerous immigrant groups reported in Charleston came from Central America (7 | 1.1%), Latin America (7 | 1.1%), Mexico (4 | 0.6%), Guatemala (2 | 0.3%), and El Salvador (1 | 0.2%), together accounting for 3.3% of all Charleston residents.
| Immigration Origin | # Population | % Population |
| Central America | 7 | 1.1% |
| El Salvador | 1 | 0.2% |
| Guatemala | 2 | 0.3% |
| Latin America | 7 | 1.1% |
| Mexico | 4 | 0.6% | View All 5 Rows |
Sex and Age in Charleston
Sex and Age in Charleston
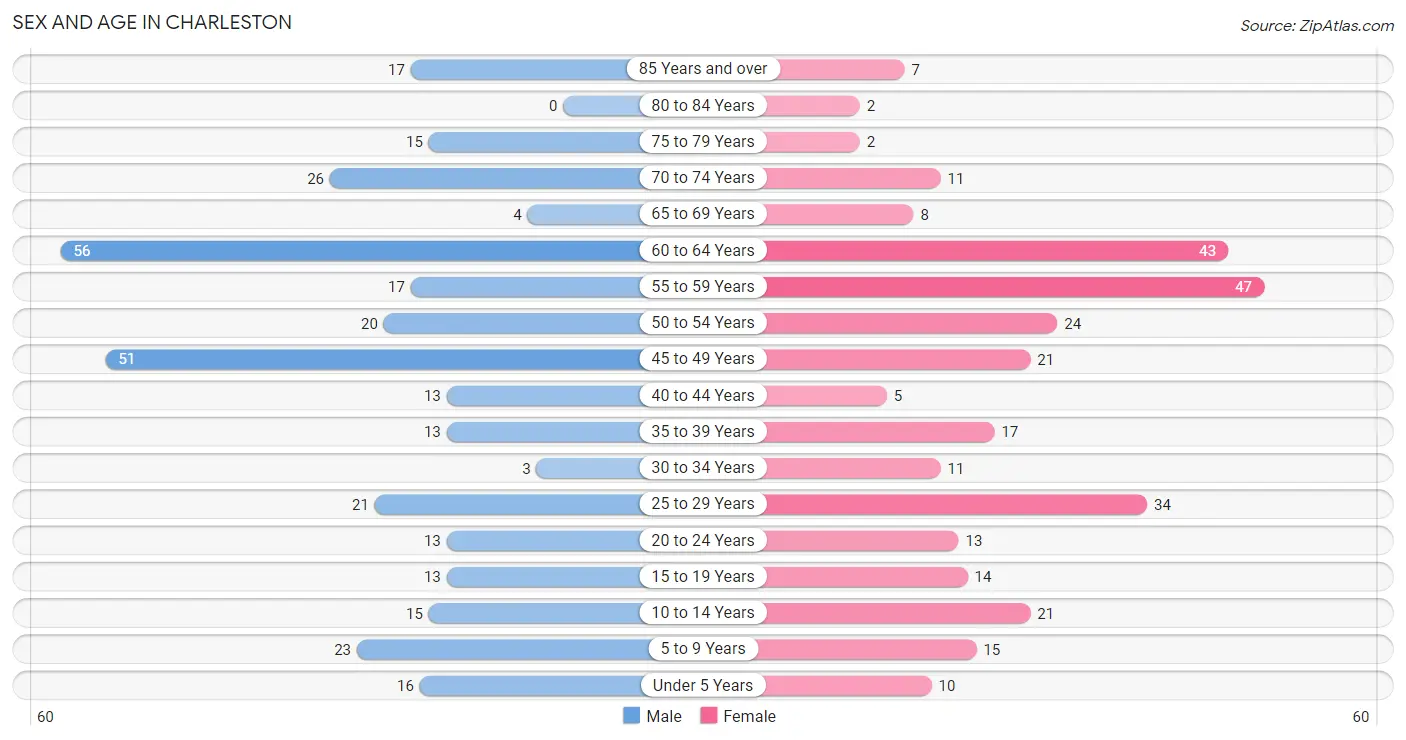
The most populous age groups in Charleston are 60 to 64 Years (56 | 16.7%) for men and 55 to 59 Years (47 | 15.4%) for women.
| Age Bracket | Male | Female |
| Under 5 Years | 16 (4.8%) | 10 (3.3%) |
| 5 to 9 Years | 23 (6.9%) | 15 (4.9%) |
| 10 to 14 Years | 15 (4.5%) | 21 (6.9%) |
| 15 to 19 Years | 13 (3.9%) | 14 (4.6%) |
| 20 to 24 Years | 13 (3.9%) | 13 (4.3%) |
| 25 to 29 Years | 21 (6.2%) | 34 (11.2%) |
| 30 to 34 Years | 3 (0.9%) | 11 (3.6%) |
| 35 to 39 Years | 13 (3.9%) | 17 (5.6%) |
| 40 to 44 Years | 13 (3.9%) | 5 (1.6%) |
| 45 to 49 Years | 51 (15.2%) | 21 (6.9%) |
| 50 to 54 Years | 20 (5.9%) | 24 (7.9%) |
| 55 to 59 Years | 17 (5.1%) | 47 (15.4%) |
| 60 to 64 Years | 56 (16.7%) | 43 (14.1%) |
| 65 to 69 Years | 4 (1.2%) | 8 (2.6%) |
| 70 to 74 Years | 26 (7.7%) | 11 (3.6%) |
| 75 to 79 Years | 15 (4.5%) | 2 (0.7%) |
| 80 to 84 Years | 0 (0.0%) | 2 (0.7%) |
| 85 Years and over | 17 (5.1%) | 7 (2.3%) |
| Total | 336 (100.0%) | 305 (100.0%) |
Families and Households in Charleston
Median Family Size in Charleston
The median family size in Charleston is 3.32 persons per family, with single female/mother families (13 | 8.0%) accounting for the largest median family size of 4.31 persons per family. On the other hand, married-couple families (133 | 82.1%) represent the smallest median family size with 3.23 persons per family.
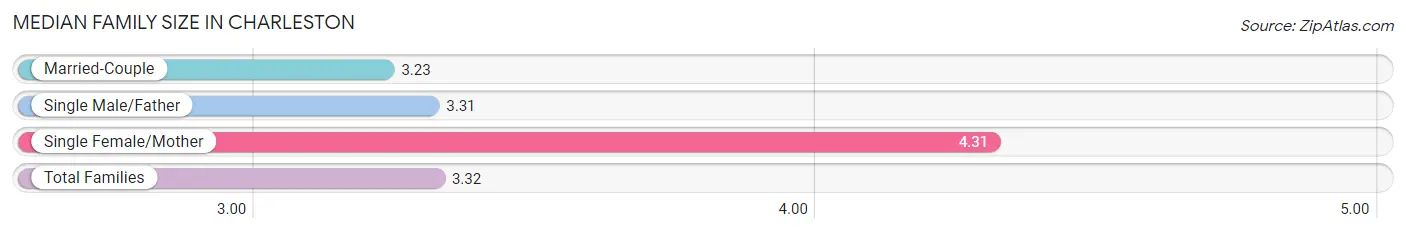
| Family Type | # Families | Family Size |
| Married-Couple | 133 (82.1%) | 3.23 |
| Single Male/Father | 16 (9.9%) | 3.31 |
| Single Female/Mother | 13 (8.0%) | 4.31 |
| Total Families | 162 (100.0%) | 3.32 |
Median Household Size in Charleston
The median household size in Charleston is 2.58 persons per household, with single female/mother households (13 | 5.2%) accounting for the largest median household size of 4.46 persons per household. non-family households (86 | 34.7%) represent the smallest median household size with 1.05 persons per household.
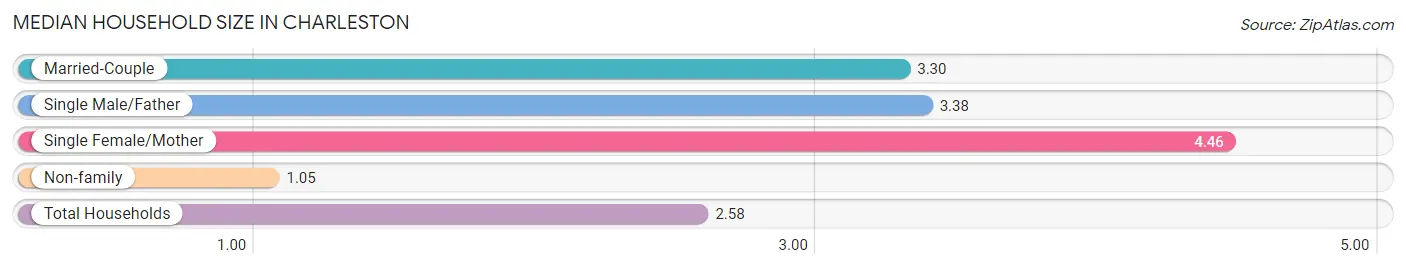
| Household Type | # Households | Household Size |
| Married-Couple | 133 (53.6%) | 3.30 |
| Single Male/Father | 16 (6.5%) | 3.38 |
| Single Female/Mother | 13 (5.2%) | 4.46 |
| Non-family | 86 (34.7%) | 1.05 |
| Total Households | 248 (100.0%) | 2.58 |
Household Size by Marriage Status in Charleston
Out of a total of 248 households in Charleston, 162 (65.3%) are family households, while 86 (34.7%) are nonfamily households. The most numerous type of family households are 2-person households, comprising 59, and the most common type of nonfamily households are 1-person households, comprising 82.
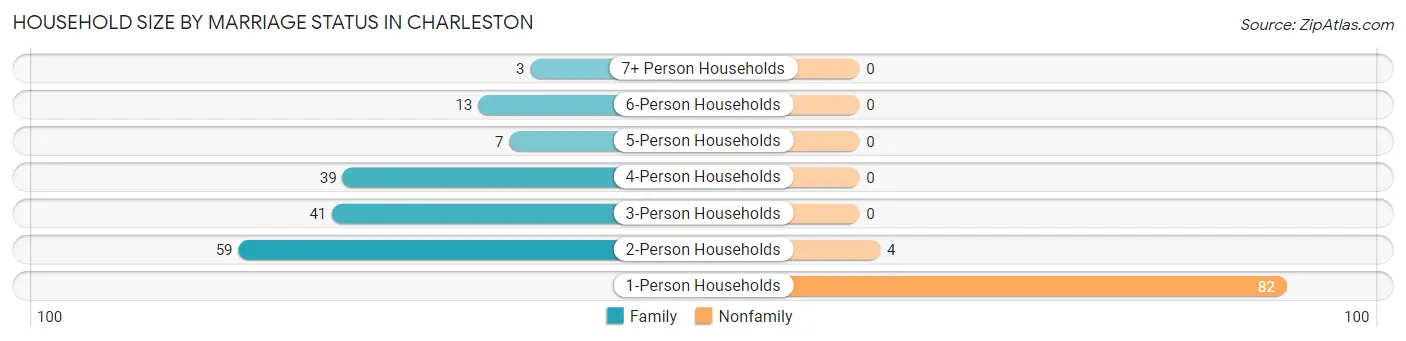
| Household Size | Family Households | Nonfamily Households |
| 1-Person Households | - | 82 (33.1%) |
| 2-Person Households | 59 (23.8%) | 4 (1.6%) |
| 3-Person Households | 41 (16.5%) | 0 (0.0%) |
| 4-Person Households | 39 (15.7%) | 0 (0.0%) |
| 5-Person Households | 7 (2.8%) | 0 (0.0%) |
| 6-Person Households | 13 (5.2%) | 0 (0.0%) |
| 7+ Person Households | 3 (1.2%) | 0 (0.0%) |
| Total | 162 (65.3%) | 86 (34.7%) |
Female Fertility in Charleston
Fertility by Age in Charleston
Average fertility rate in Charleston is 45.0 births per 1,000 women. Women in the age bracket of 35 to 50 years have the highest fertility rate with 100.0 births per 1,000 women. Women in the age bracket of 35 to 50 years acount for 100.0% of all women with births.
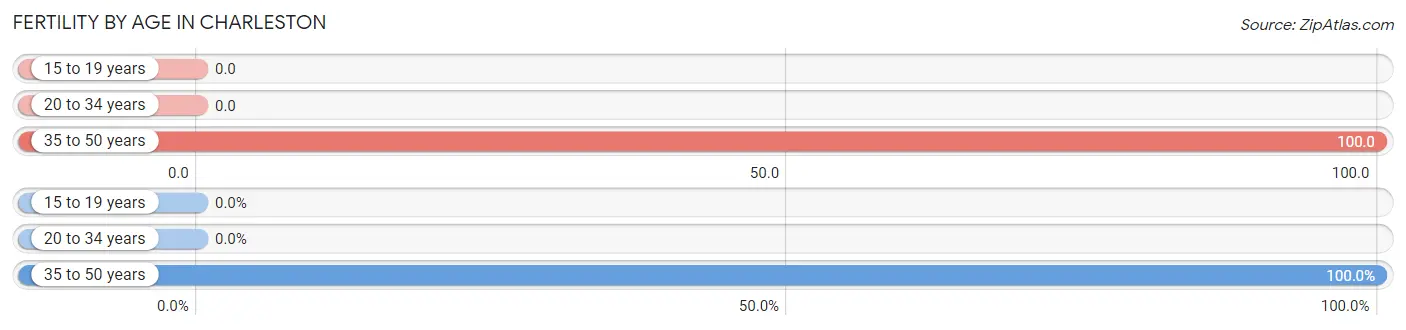
| Age Bracket | Women with Births | Births / 1,000 Women |
| 15 to 19 years | 0 (0.0%) | 0.0 |
| 20 to 34 years | 0 (0.0%) | 0.0 |
| 35 to 50 years | 6 (100.0%) | 100.0 |
| Total | 6 (100.0%) | 45.0 |
Fertility by Age by Marriage Status in Charleston
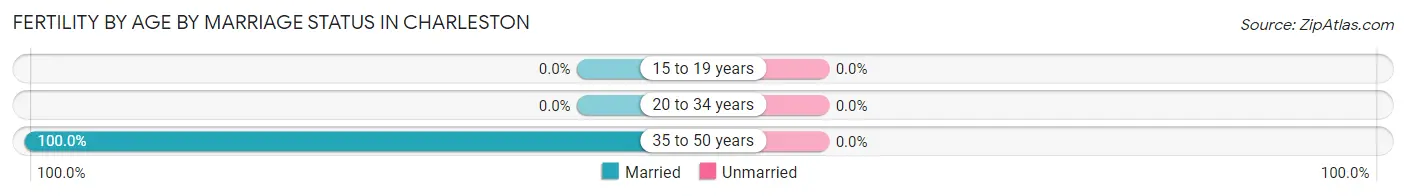
| Age Bracket | Married | Unmarried |
| 15 to 19 years | 0 (0.0%) | 0 (0.0%) |
| 20 to 34 years | 0 (0.0%) | 0 (0.0%) |
| 35 to 50 years | 6 (100.0%) | 0 (0.0%) |
| Total | 6 (100.0%) | 0 (0.0%) |
Fertility by Education in Charleston
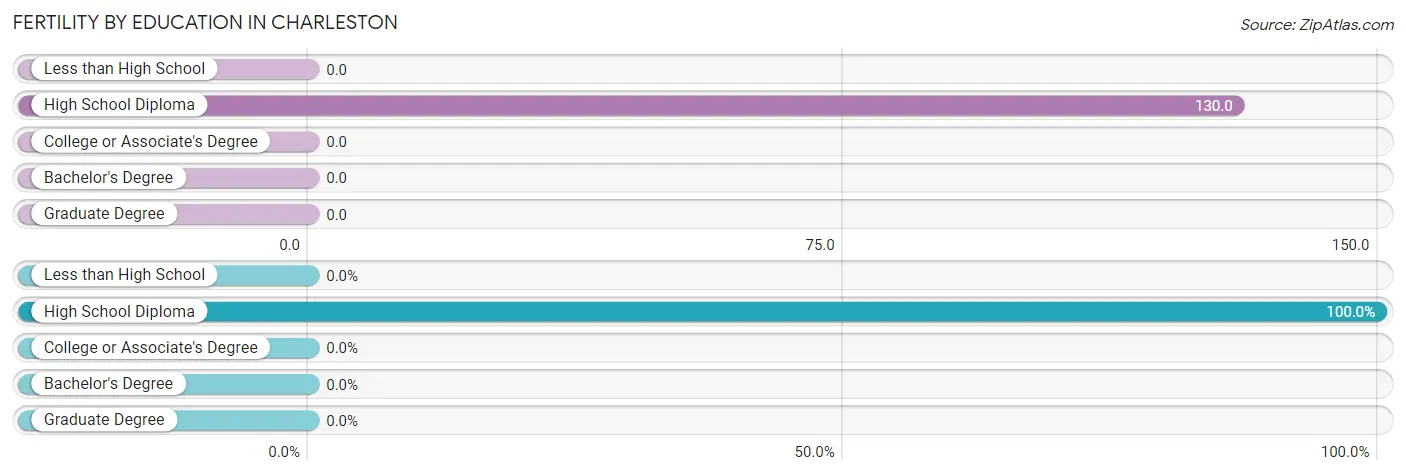
| Educational Attainment | Women with Births | Births / 1,000 Women |
| Less than High School | 0 (0.0%) | 0.0 |
| High School Diploma | 6 (100.0%) | 130.0 |
| College or Associate's Degree | 0 (0.0%) | 0.0 |
| Bachelor's Degree | 0 (0.0%) | 0.0 |
| Graduate Degree | 0 (0.0%) | 0.0 |
| Total | 6 (100.0%) | 45.0 |
Fertility by Education by Marriage Status in Charleston
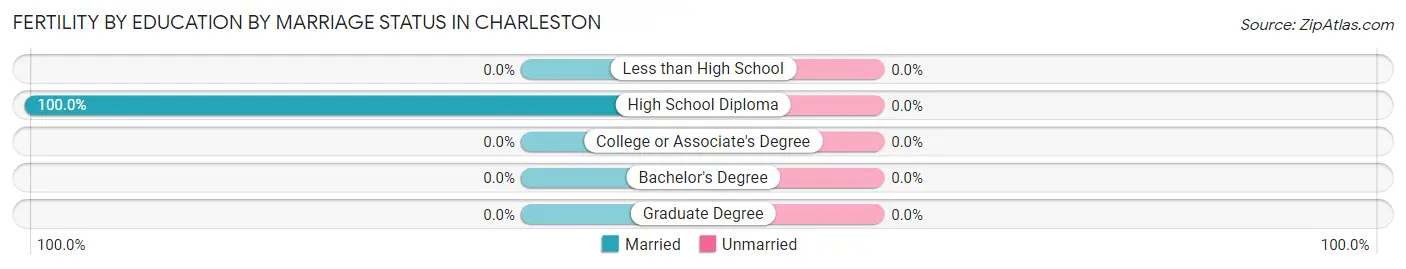
| Educational Attainment | Married | Unmarried |
| Less than High School | 0 (0.0%) | 0 (0.0%) |
| High School Diploma | 6 (100.0%) | 0 (0.0%) |
| College or Associate's Degree | 0 (0.0%) | 0 (0.0%) |
| Bachelor's Degree | 0 (0.0%) | 0 (0.0%) |
| Graduate Degree | 0 (0.0%) | 0 (0.0%) |
| Total | 6 (100.0%) | 0 (0.0%) |
Employment Characteristics in Charleston
Employment by Class of Employer in Charleston
Among the 294 employed individuals in Charleston, private company employees (227 | 77.2%), federal government employees (26 | 8.8%), and self-employed (not incorporated) (15 | 5.1%) make up the most common classes of employment.
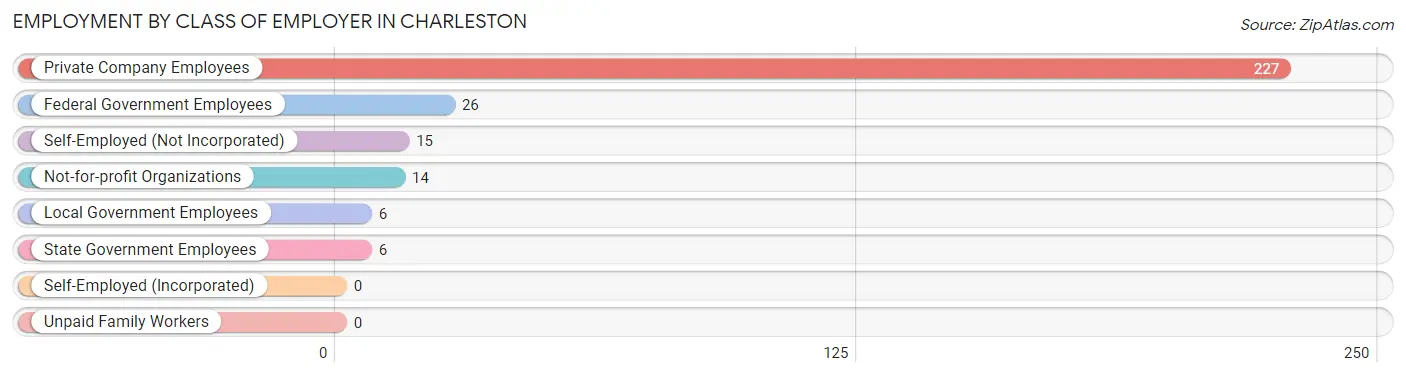
| Employer Class | # Employees | % Employees |
| Private Company Employees | 227 | 77.2% |
| Self-Employed (Incorporated) | 0 | 0.0% |
| Self-Employed (Not Incorporated) | 15 | 5.1% |
| Not-for-profit Organizations | 14 | 4.8% |
| Local Government Employees | 6 | 2.0% |
| State Government Employees | 6 | 2.0% |
| Federal Government Employees | 26 | 8.8% |
| Unpaid Family Workers | 0 | 0.0% |
| Total | 294 | 100.0% |
Employment Status by Age in Charleston
According to the labor force statistics for Charleston, out of the total population over 16 years of age (538), 57.2% or 308 individuals are in the labor force, with 2.3% or 7 of them unemployed. The age group with the highest labor force participation rate is 45 to 54 years, with 88.8% or 103 individuals in the labor force. Within the labor force, the 65 to 74 years age range has the highest percentage of unemployed individuals, with 100.0% or 2 of them being unemployed.
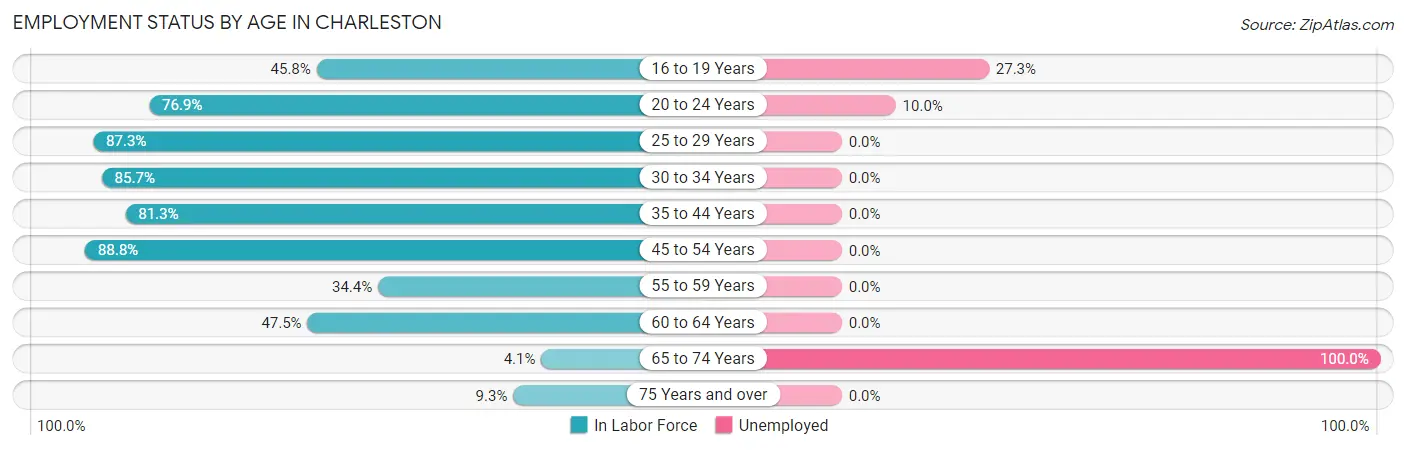
| Age Bracket | In Labor Force | Unemployed |
| 16 to 19 Years | 11 (45.8%) | 3 (27.3%) |
| 20 to 24 Years | 20 (76.9%) | 2 (10.0%) |
| 25 to 29 Years | 48 (87.3%) | 0 (0.0%) |
| 30 to 34 Years | 12 (85.7%) | 0 (0.0%) |
| 35 to 44 Years | 39 (81.3%) | 0 (0.0%) |
| 45 to 54 Years | 103 (88.8%) | 0 (0.0%) |
| 55 to 59 Years | 22 (34.4%) | 0 (0.0%) |
| 60 to 64 Years | 47 (47.5%) | 0 (0.0%) |
| 65 to 74 Years | 2 (4.1%) | 2 (100.0%) |
| 75 Years and over | 4 (9.3%) | 0 (0.0%) |
| Total | 308 (57.2%) | 7 (2.3%) |
Employment Status by Educational Attainment in Charleston
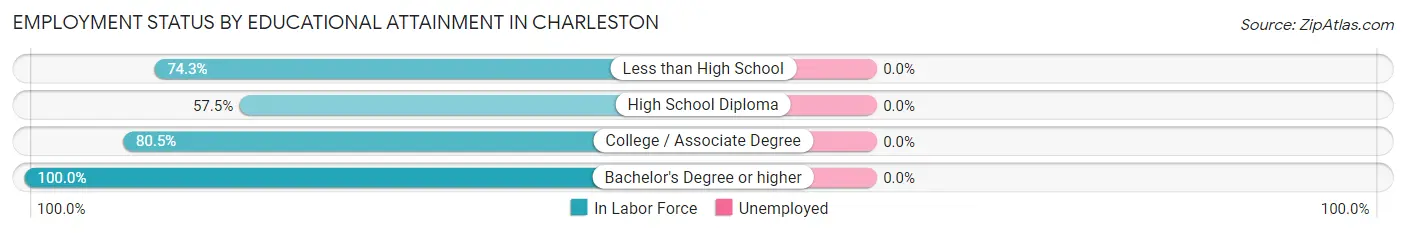
| Educational Attainment | In Labor Force | Unemployed |
| Less than High School | 26 (74.3%) | 0 (0.0%) |
| High School Diploma | 126 (57.5%) | 0 (0.0%) |
| College / Associate Degree | 95 (80.5%) | 0 (0.0%) |
| Bachelor's Degree or higher | 24 (100.0%) | 0 (0.0%) |
| Total | 271 (68.4%) | 0 (0.0%) |
Employment Occupations by Sex in Charleston
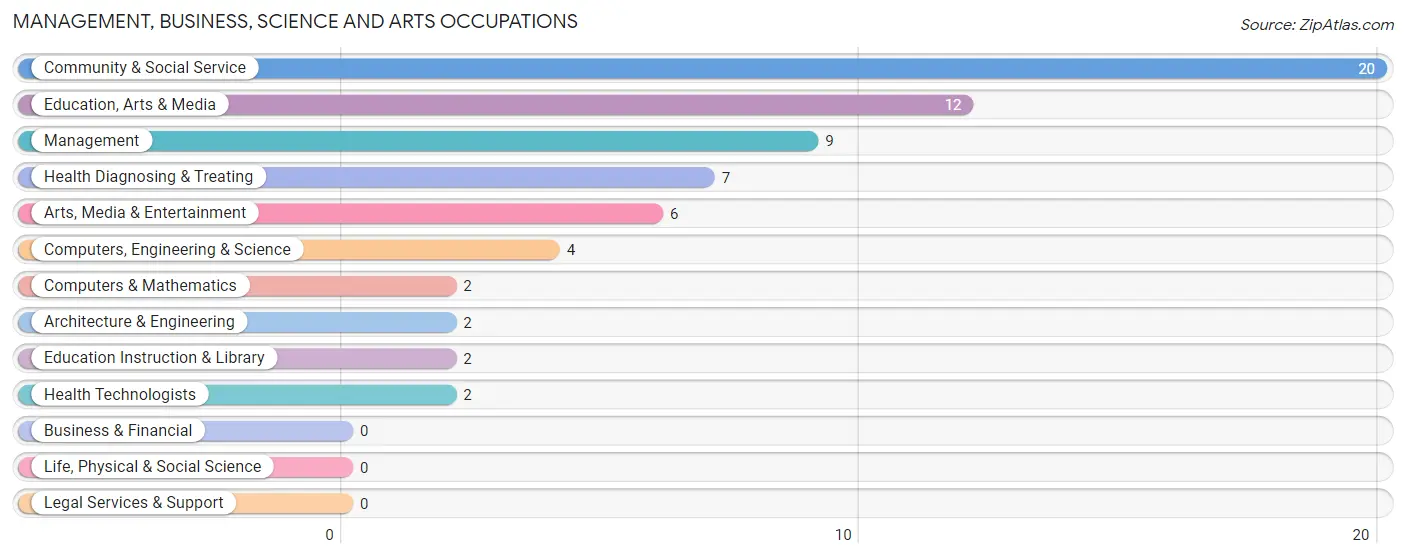
Management, Business, Science and Arts Occupations
The most common Management, Business, Science and Arts occupations in Charleston are Community & Social Service (20 | 6.6%), Education, Arts & Media (12 | 4.0%), Management (9 | 3.0%), Health Diagnosing & Treating (7 | 2.3%), and Arts, Media & Entertainment (6 | 2.0%).
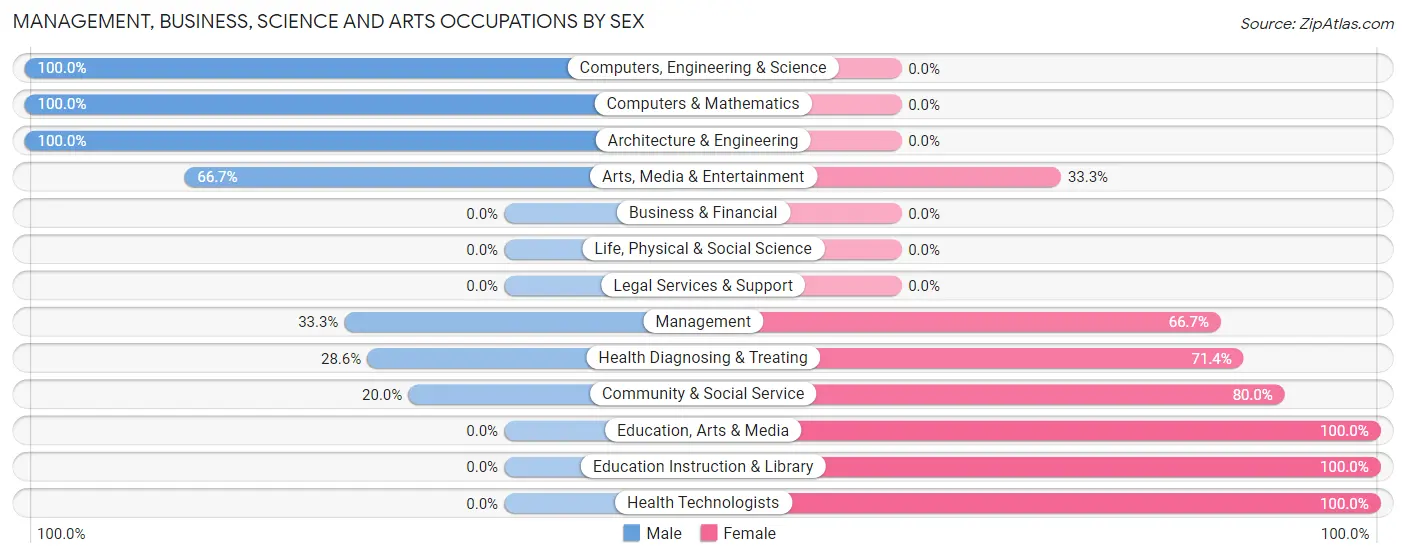
Management, Business, Science and Arts Occupations by Sex
Within the Management, Business, Science and Arts occupations in Charleston, the most male-oriented occupations are Computers, Engineering & Science (100.0%), Computers & Mathematics (100.0%), and Architecture & Engineering (100.0%), while the most female-oriented occupations are Education, Arts & Media (100.0%), Education Instruction & Library (100.0%), and Health Technologists (100.0%).
| Occupation | Male | Female |
| Management | 3 (33.3%) | 6 (66.7%) |
| Business & Financial | 0 (0.0%) | 0 (0.0%) |
| Computers, Engineering & Science | 4 (100.0%) | 0 (0.0%) |
| Computers & Mathematics | 2 (100.0%) | 0 (0.0%) |
| Architecture & Engineering | 2 (100.0%) | 0 (0.0%) |
| Life, Physical & Social Science | 0 (0.0%) | 0 (0.0%) |
| Community & Social Service | 4 (20.0%) | 16 (80.0%) |
| Education, Arts & Media | 0 (0.0%) | 12 (100.0%) |
| Legal Services & Support | 0 (0.0%) | 0 (0.0%) |
| Education Instruction & Library | 0 (0.0%) | 2 (100.0%) |
| Arts, Media & Entertainment | 4 (66.7%) | 2 (33.3%) |
| Health Diagnosing & Treating | 2 (28.6%) | 5 (71.4%) |
| Health Technologists | 0 (0.0%) | 2 (100.0%) |
| Total (Category) | 13 (32.5%) | 27 (67.5%) |
| Total (Overall) | 168 (55.8%) | 133 (44.2%) |
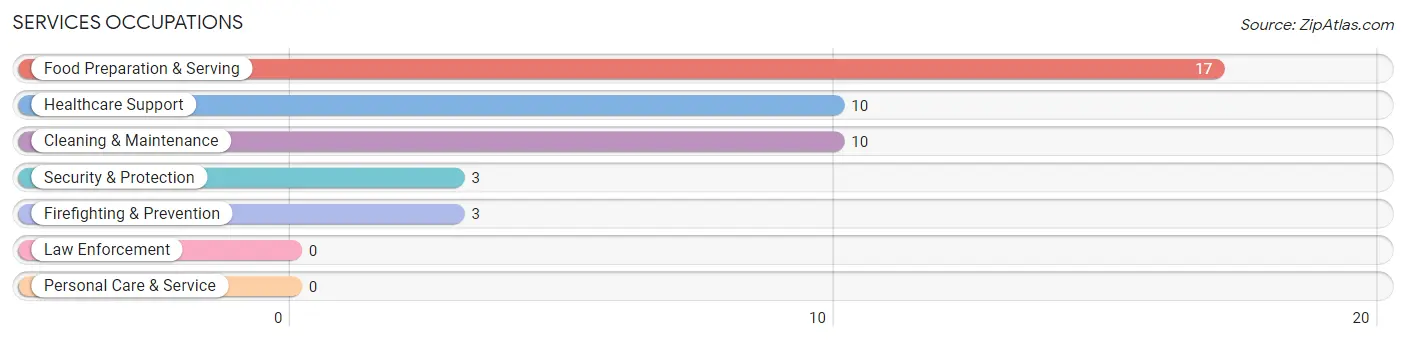
Services Occupations
The most common Services occupations in Charleston are Food Preparation & Serving (17 | 5.7%), Healthcare Support (10 | 3.3%), Cleaning & Maintenance (10 | 3.3%), Security & Protection (3 | 1.0%), and Firefighting & Prevention (3 | 1.0%).
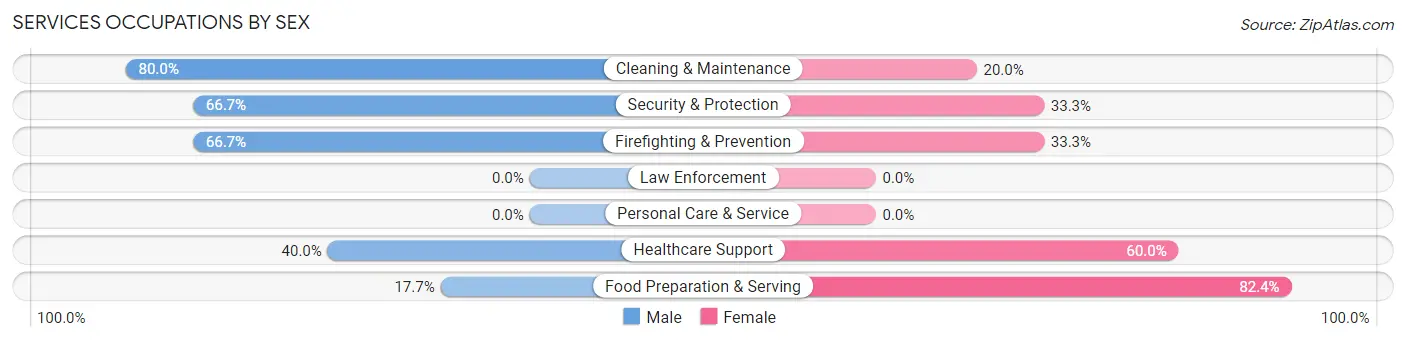
Services Occupations by Sex
Within the Services occupations in Charleston, the most male-oriented occupations are Cleaning & Maintenance (80.0%), Security & Protection (66.7%), and Firefighting & Prevention (66.7%), while the most female-oriented occupations are Food Preparation & Serving (82.4%), Healthcare Support (60.0%), and Security & Protection (33.3%).
| Occupation | Male | Female |
| Healthcare Support | 4 (40.0%) | 6 (60.0%) |
| Security & Protection | 2 (66.7%) | 1 (33.3%) |
| Firefighting & Prevention | 2 (66.7%) | 1 (33.3%) |
| Law Enforcement | 0 (0.0%) | 0 (0.0%) |
| Food Preparation & Serving | 3 (17.6%) | 14 (82.4%) |
| Cleaning & Maintenance | 8 (80.0%) | 2 (20.0%) |
| Personal Care & Service | 0 (0.0%) | 0 (0.0%) |
| Total (Category) | 17 (42.5%) | 23 (57.5%) |
| Total (Overall) | 168 (55.8%) | 133 (44.2%) |
Sales and Office Occupations
The most common Sales and Office occupations in Charleston are Office & Administration (25 | 8.3%), and Sales & Related (12 | 4.0%).
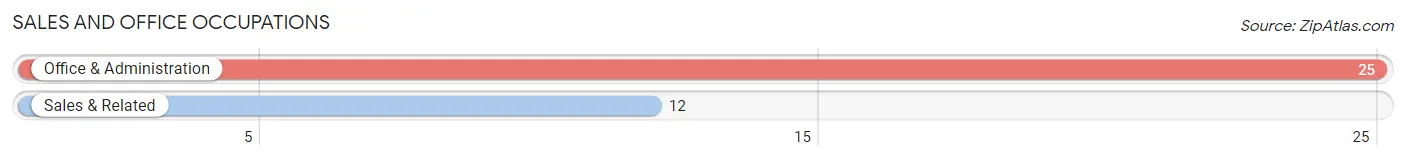
Sales and Office Occupations by Sex
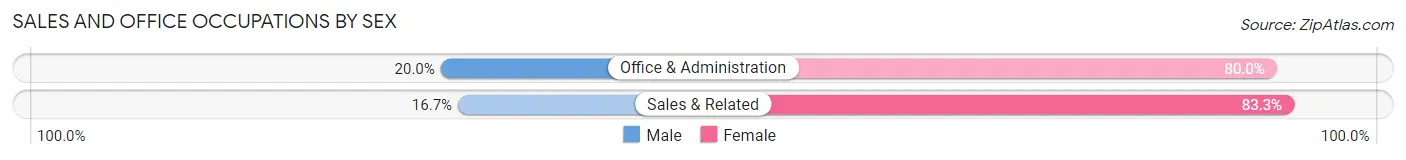
| Occupation | Male | Female |
| Sales & Related | 2 (16.7%) | 10 (83.3%) |
| Office & Administration | 5 (20.0%) | 20 (80.0%) |
| Total (Category) | 7 (18.9%) | 30 (81.1%) |
| Total (Overall) | 168 (55.8%) | 133 (44.2%) |
Natural Resources, Construction and Maintenance Occupations
The most common Natural Resources, Construction and Maintenance occupations in Charleston are Installation, Maintenance & Repair (25 | 8.3%), and Construction & Extraction (15 | 5.0%).
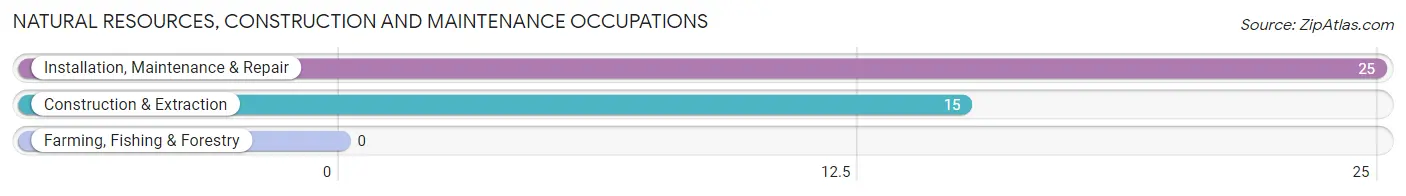
Natural Resources, Construction and Maintenance Occupations by Sex
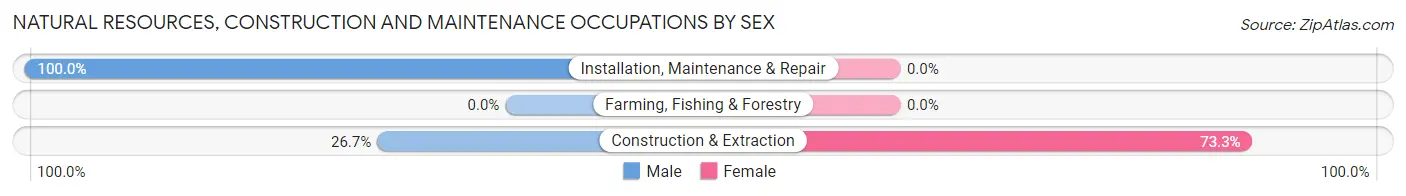
| Occupation | Male | Female |
| Farming, Fishing & Forestry | 0 (0.0%) | 0 (0.0%) |
| Construction & Extraction | 4 (26.7%) | 11 (73.3%) |
| Installation, Maintenance & Repair | 25 (100.0%) | 0 (0.0%) |
| Total (Category) | 29 (72.5%) | 11 (27.5%) |
| Total (Overall) | 168 (55.8%) | 133 (44.2%) |
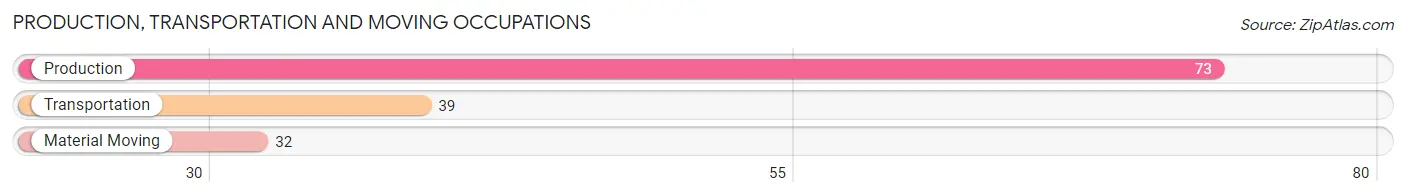
Production, Transportation and Moving Occupations
The most common Production, Transportation and Moving occupations in Charleston are Production (73 | 24.2%), Transportation (39 | 13.0%), and Material Moving (32 | 10.6%).
Production, Transportation and Moving Occupations by Sex
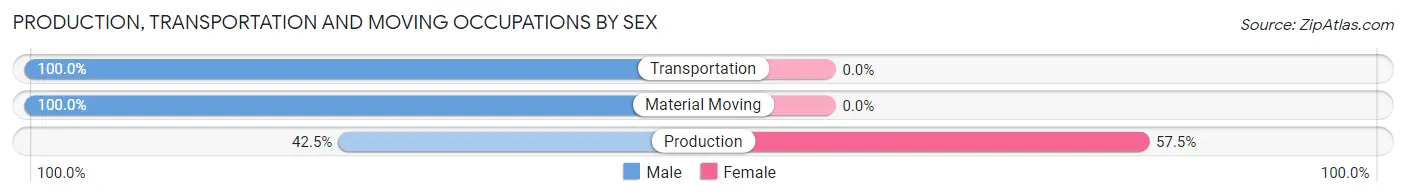
| Occupation | Male | Female |
| Production | 31 (42.5%) | 42 (57.5%) |
| Transportation | 39 (100.0%) | 0 (0.0%) |
| Material Moving | 32 (100.0%) | 0 (0.0%) |
| Total (Category) | 102 (70.8%) | 42 (29.2%) |
| Total (Overall) | 168 (55.8%) | 133 (44.2%) |
Employment Industries by Sex in Charleston
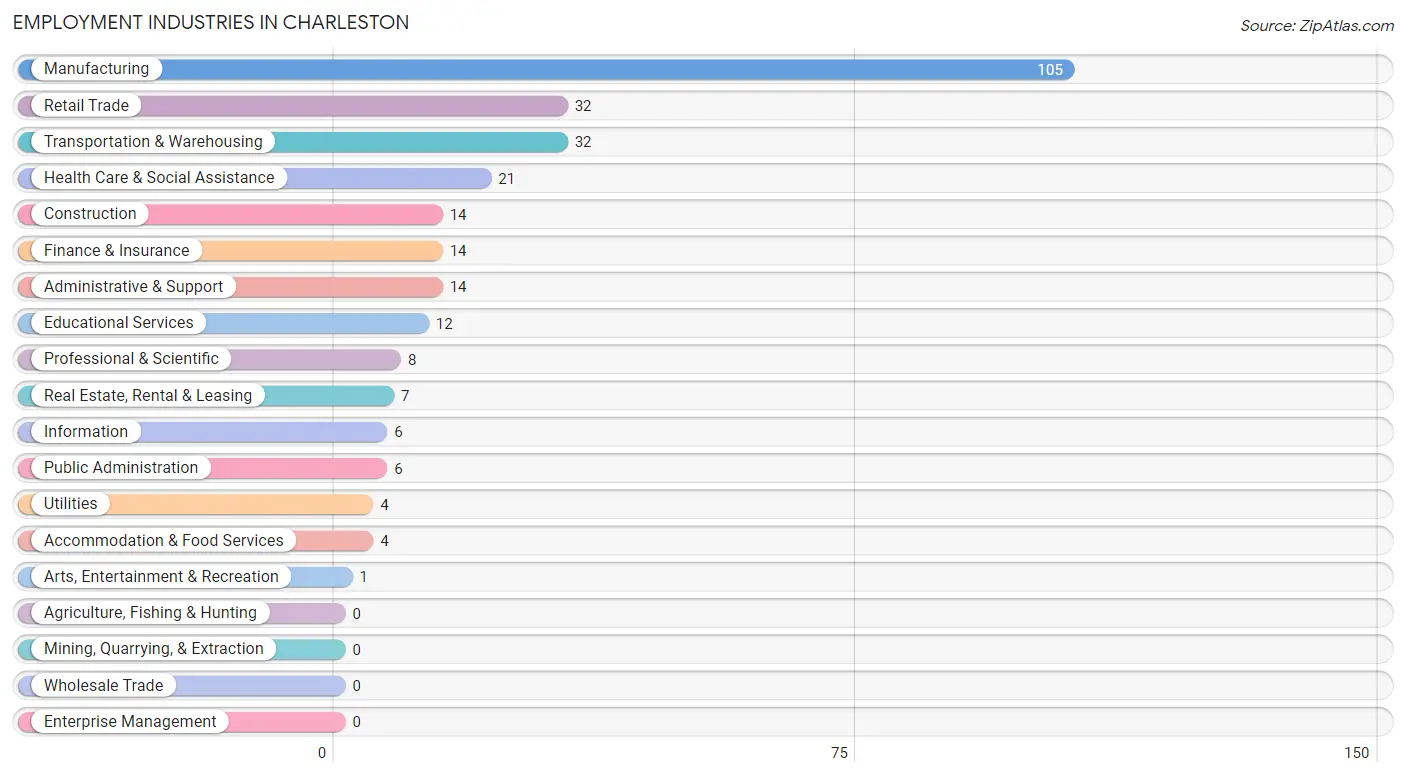
Employment Industries in Charleston
The major employment industries in Charleston include Manufacturing (105 | 34.9%), Retail Trade (32 | 10.6%), Transportation & Warehousing (32 | 10.6%), Health Care & Social Assistance (21 | 7.0%), and Construction (14 | 4.6%).
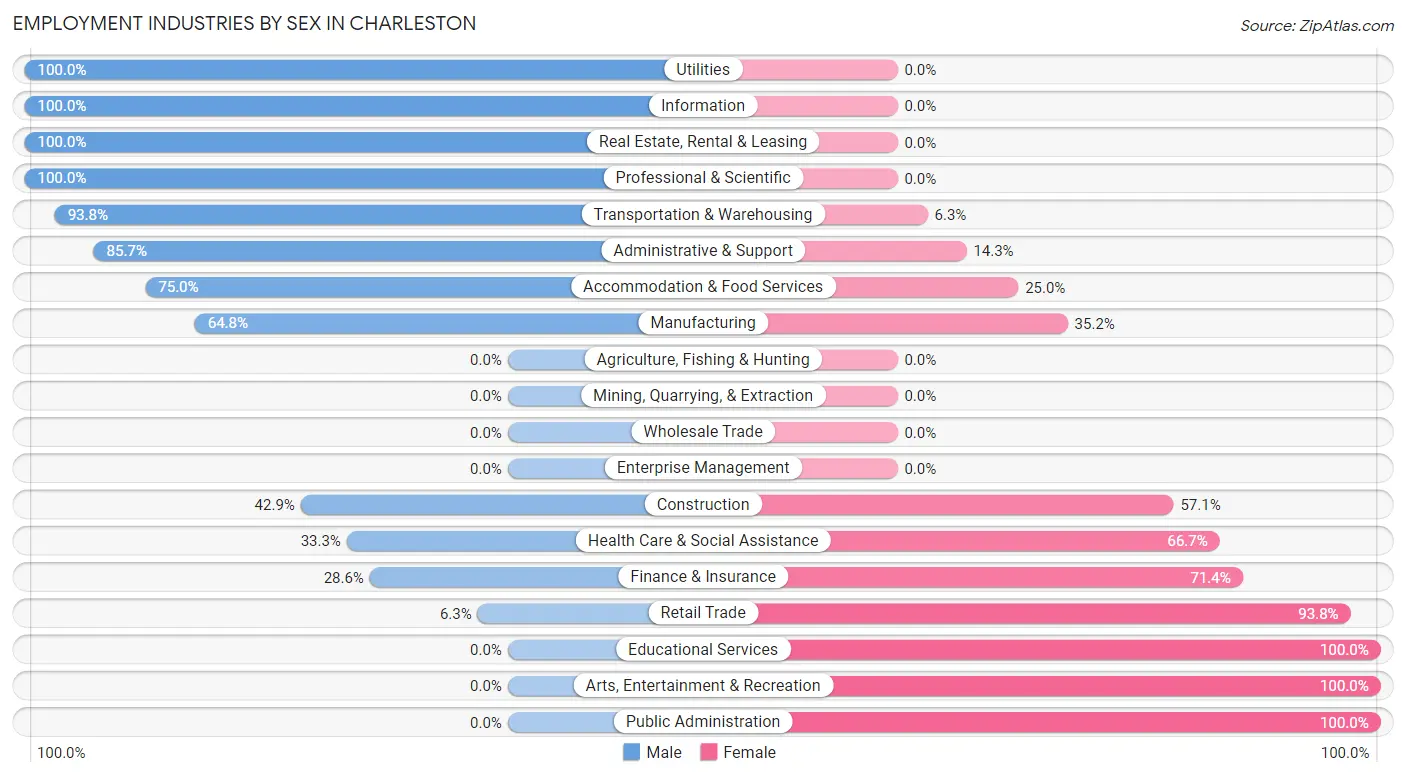
Employment Industries by Sex in Charleston
The Charleston industries that see more men than women are Utilities (100.0%), Information (100.0%), and Real Estate, Rental & Leasing (100.0%), whereas the industries that tend to have a higher number of women are Educational Services (100.0%), Arts, Entertainment & Recreation (100.0%), and Public Administration (100.0%).
| Industry | Male | Female |
| Agriculture, Fishing & Hunting | 0 (0.0%) | 0 (0.0%) |
| Mining, Quarrying, & Extraction | 0 (0.0%) | 0 (0.0%) |
| Construction | 6 (42.9%) | 8 (57.1%) |
| Manufacturing | 68 (64.8%) | 37 (35.2%) |
| Wholesale Trade | 0 (0.0%) | 0 (0.0%) |
| Retail Trade | 2 (6.2%) | 30 (93.8%) |
| Transportation & Warehousing | 30 (93.8%) | 2 (6.2%) |
| Utilities | 4 (100.0%) | 0 (0.0%) |
| Information | 6 (100.0%) | 0 (0.0%) |
| Finance & Insurance | 4 (28.6%) | 10 (71.4%) |
| Real Estate, Rental & Leasing | 7 (100.0%) | 0 (0.0%) |
| Professional & Scientific | 8 (100.0%) | 0 (0.0%) |
| Enterprise Management | 0 (0.0%) | 0 (0.0%) |
| Administrative & Support | 12 (85.7%) | 2 (14.3%) |
| Educational Services | 0 (0.0%) | 12 (100.0%) |
| Health Care & Social Assistance | 7 (33.3%) | 14 (66.7%) |
| Arts, Entertainment & Recreation | 0 (0.0%) | 1 (100.0%) |
| Accommodation & Food Services | 3 (75.0%) | 1 (25.0%) |
| Public Administration | 0 (0.0%) | 6 (100.0%) |
| Total | 168 (55.8%) | 133 (44.2%) |
Education in Charleston
School Enrollment in Charleston
The most common levels of schooling among the 94 students in Charleston are middle school (32 | 34.0%), high school (27 | 28.7%), and elementary school (21 | 22.3%).
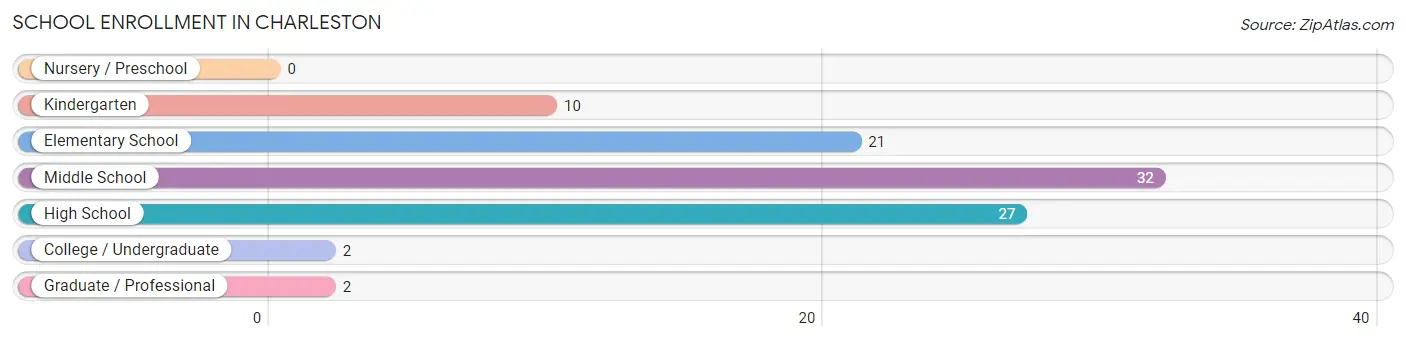
| School Level | # Students | % Students |
| Nursery / Preschool | 0 | 0.0% |
| Kindergarten | 10 | 10.6% |
| Elementary School | 21 | 22.3% |
| Middle School | 32 | 34.0% |
| High School | 27 | 28.7% |
| College / Undergraduate | 2 | 2.1% |
| Graduate / Professional | 2 | 2.1% |
| Total | 94 | 100.0% |
School Enrollment by Age by Funding Source in Charleston
Out of a total of 94 students who are enrolled in schools in Charleston, 23 (24.5%) attend a private institution, while the remaining 71 (75.5%) are enrolled in public schools. The age group of 18 to 19 year olds has the highest likelihood of being enrolled in private schools, with 8 (66.7% in the age bracket) enrolled. Conversely, the age group of 20 to 24 year olds has the lowest likelihood of being enrolled in a private school, with 2 (100.0% in the age bracket) attending a public institution.
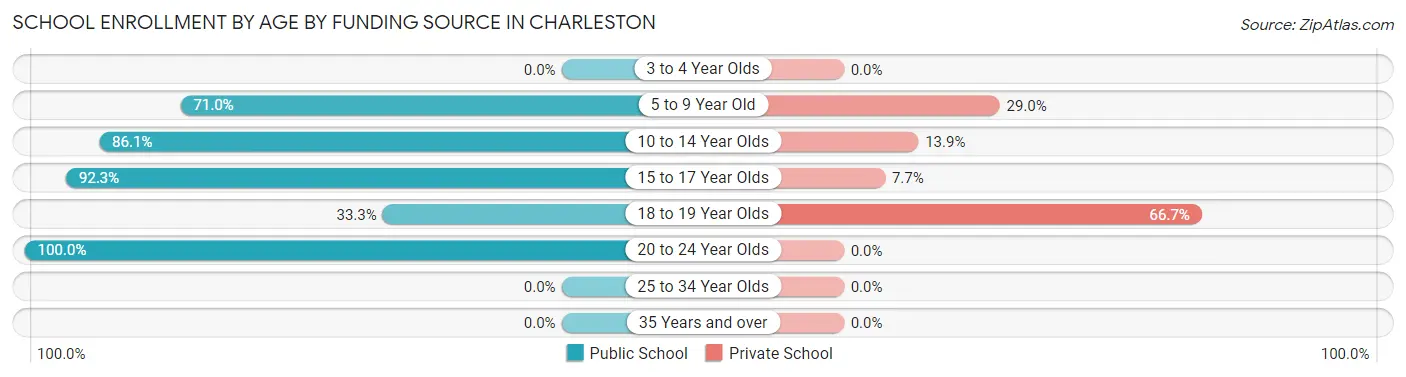
| Age Bracket | Public School | Private School |
| 3 to 4 Year Olds | 0 (0.0%) | 0 (0.0%) |
| 5 to 9 Year Old | 22 (71.0%) | 9 (29.0%) |
| 10 to 14 Year Olds | 31 (86.1%) | 5 (13.9%) |
| 15 to 17 Year Olds | 12 (92.3%) | 1 (7.7%) |
| 18 to 19 Year Olds | 4 (33.3%) | 8 (66.7%) |
| 20 to 24 Year Olds | 2 (100.0%) | 0 (0.0%) |
| 25 to 34 Year Olds | 0 (0.0%) | 0 (0.0%) |
| 35 Years and over | 0 (0.0%) | 0 (0.0%) |
| Total | 71 (75.5%) | 23 (24.5%) |
Educational Attainment by Field of Study in Charleston
Social sciences (8 | 21.6%), communications (8 | 21.6%), psychology (5 | 13.5%), education (4 | 10.8%), and visual & performing arts (4 | 10.8%) are the most common fields of study among 37 individuals in Charleston who have obtained a bachelor's degree or higher.
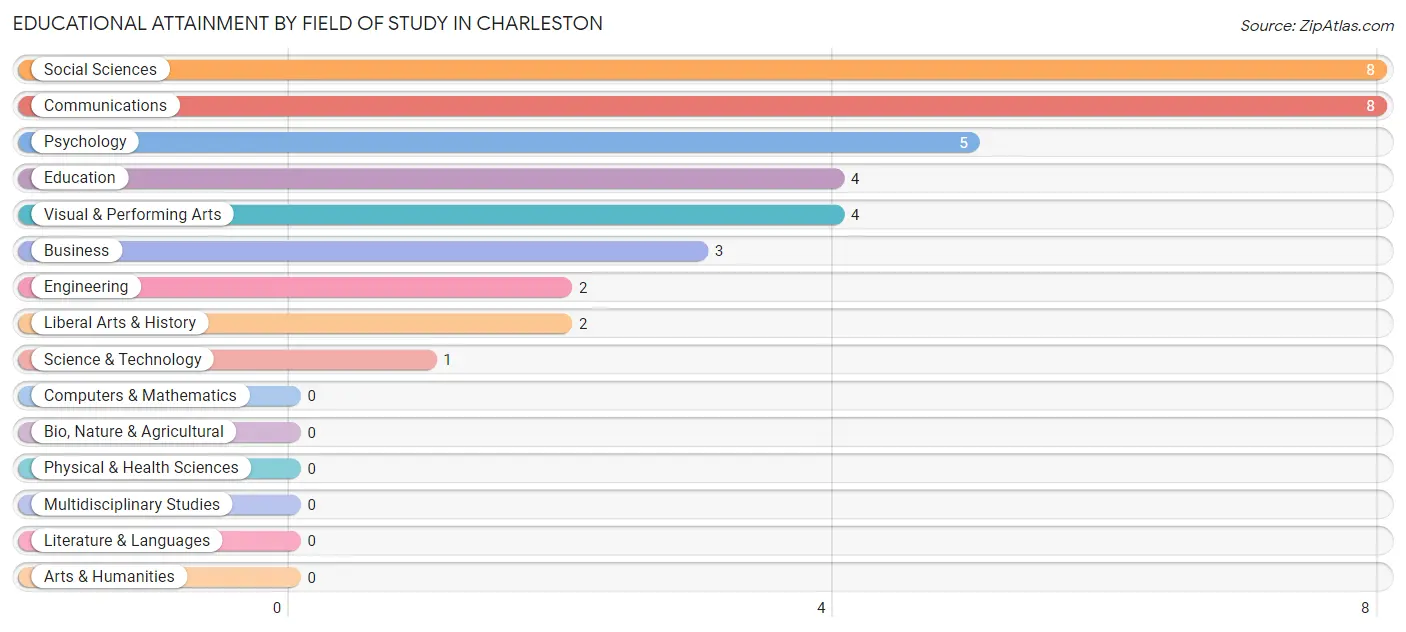
| Field of Study | # Graduates | % Graduates |
| Computers & Mathematics | 0 | 0.0% |
| Bio, Nature & Agricultural | 0 | 0.0% |
| Physical & Health Sciences | 0 | 0.0% |
| Psychology | 5 | 13.5% |
| Social Sciences | 8 | 21.6% |
| Engineering | 2 | 5.4% |
| Multidisciplinary Studies | 0 | 0.0% |
| Science & Technology | 1 | 2.7% |
| Business | 3 | 8.1% |
| Education | 4 | 10.8% |
| Literature & Languages | 0 | 0.0% |
| Liberal Arts & History | 2 | 5.4% |
| Visual & Performing Arts | 4 | 10.8% |
| Communications | 8 | 21.6% |
| Arts & Humanities | 0 | 0.0% |
| Total | 37 | 100.0% |
Transportation & Commute in Charleston
Vehicle Availability by Sex in Charleston
The most prevalent vehicle ownership categories in Charleston are males with 2 vehicles (84, accounting for 50.0%) and females with 2 vehicles (42, making up 66.7%).
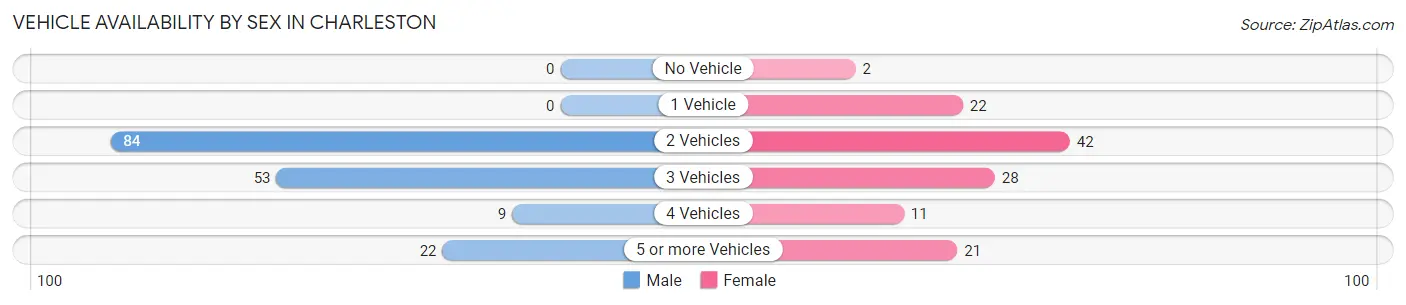
| Vehicles Available | Male | Female |
| No Vehicle | 0 (0.0%) | 2 (1.6%) |
| 1 Vehicle | 0 (0.0%) | 22 (17.5%) |
| 2 Vehicles | 84 (50.0%) | 42 (33.3%) |
| 3 Vehicles | 53 (31.6%) | 28 (22.2%) |
| 4 Vehicles | 9 (5.4%) | 11 (8.7%) |
| 5 or more Vehicles | 22 (13.1%) | 21 (16.7%) |
| Total | 168 (100.0%) | 126 (100.0%) |
Commute Time in Charleston
The most frequently occuring commute durations in Charleston are 15 to 19 minutes (78 commuters, 27.5%), 30 to 34 minutes (56 commuters, 19.7%), and 20 to 24 minutes (23 commuters, 8.1%).
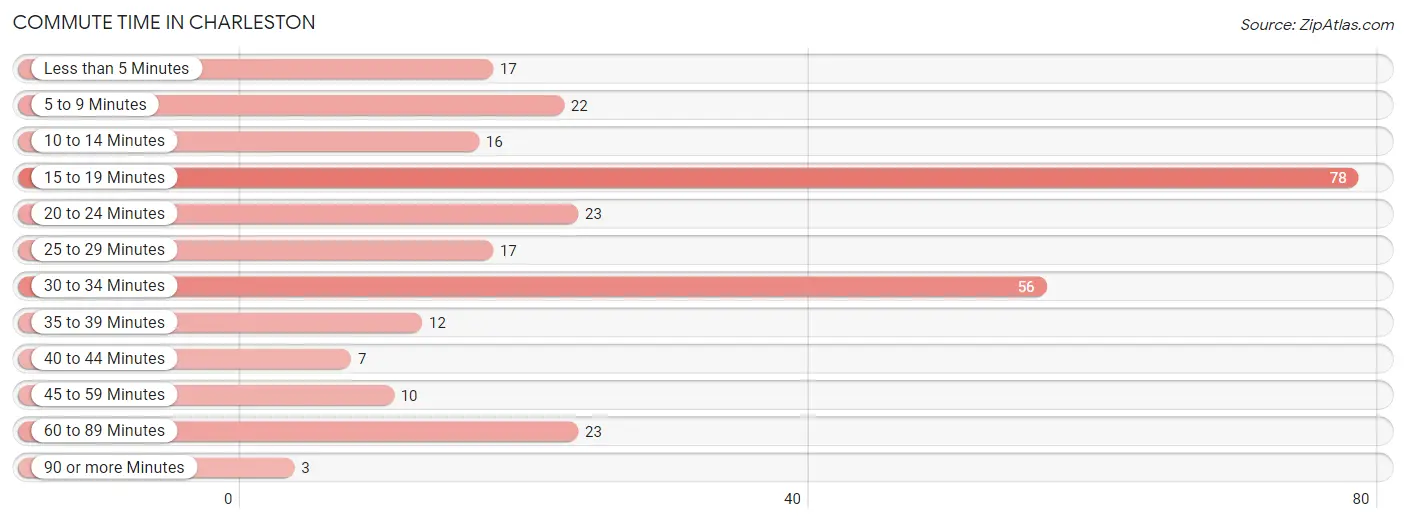
| Commute Time | # Commuters | % Commuters |
| Less than 5 Minutes | 17 | 6.0% |
| 5 to 9 Minutes | 22 | 7.7% |
| 10 to 14 Minutes | 16 | 5.6% |
| 15 to 19 Minutes | 78 | 27.5% |
| 20 to 24 Minutes | 23 | 8.1% |
| 25 to 29 Minutes | 17 | 6.0% |
| 30 to 34 Minutes | 56 | 19.7% |
| 35 to 39 Minutes | 12 | 4.2% |
| 40 to 44 Minutes | 7 | 2.5% |
| 45 to 59 Minutes | 10 | 3.5% |
| 60 to 89 Minutes | 23 | 8.1% |
| 90 or more Minutes | 3 | 1.1% |
Commute Time by Sex in Charleston
The most common commute times in Charleston are 30 to 34 minutes (43 commuters, 26.2%) for males and 15 to 19 minutes (47 commuters, 39.2%) for females.
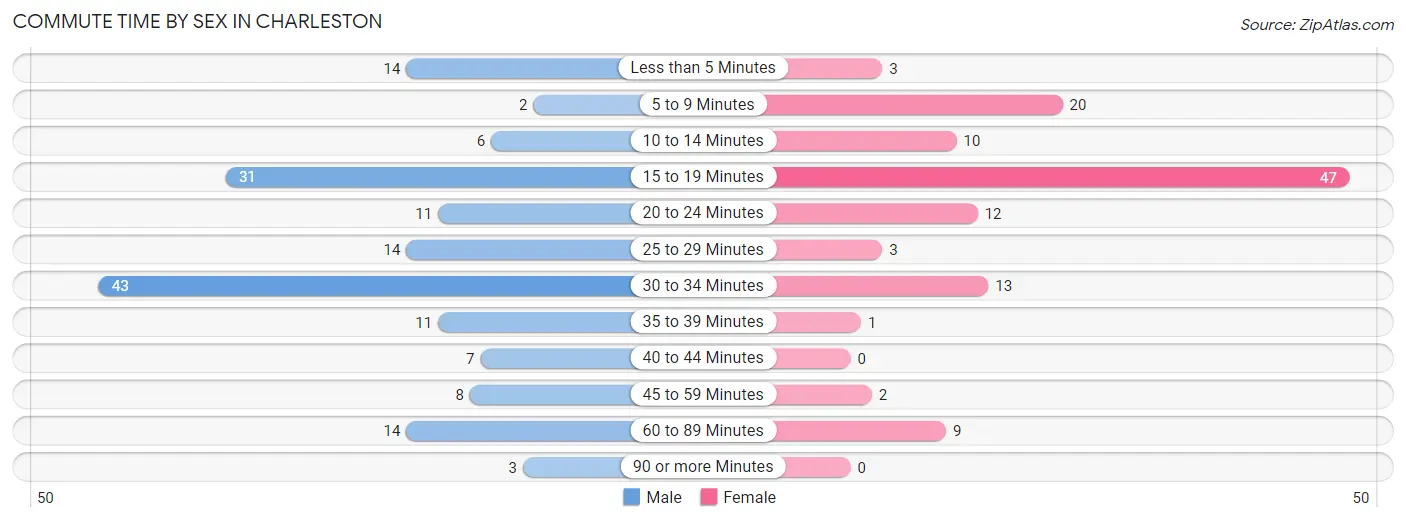
| Commute Time | Male | Female |
| Less than 5 Minutes | 14 (8.5%) | 3 (2.5%) |
| 5 to 9 Minutes | 2 (1.2%) | 20 (16.7%) |
| 10 to 14 Minutes | 6 (3.7%) | 10 (8.3%) |
| 15 to 19 Minutes | 31 (18.9%) | 47 (39.2%) |
| 20 to 24 Minutes | 11 (6.7%) | 12 (10.0%) |
| 25 to 29 Minutes | 14 (8.5%) | 3 (2.5%) |
| 30 to 34 Minutes | 43 (26.2%) | 13 (10.8%) |
| 35 to 39 Minutes | 11 (6.7%) | 1 (0.8%) |
| 40 to 44 Minutes | 7 (4.3%) | 0 (0.0%) |
| 45 to 59 Minutes | 8 (4.9%) | 2 (1.7%) |
| 60 to 89 Minutes | 14 (8.5%) | 9 (7.5%) |
| 90 or more Minutes | 3 (1.8%) | 0 (0.0%) |
Time of Departure to Work by Sex in Charleston
The most frequent times of departure to work in Charleston are 12:00 AM to 4:59 AM (34, 20.7%) for males and 7:30 AM to 7:59 AM (25, 20.8%) for females.
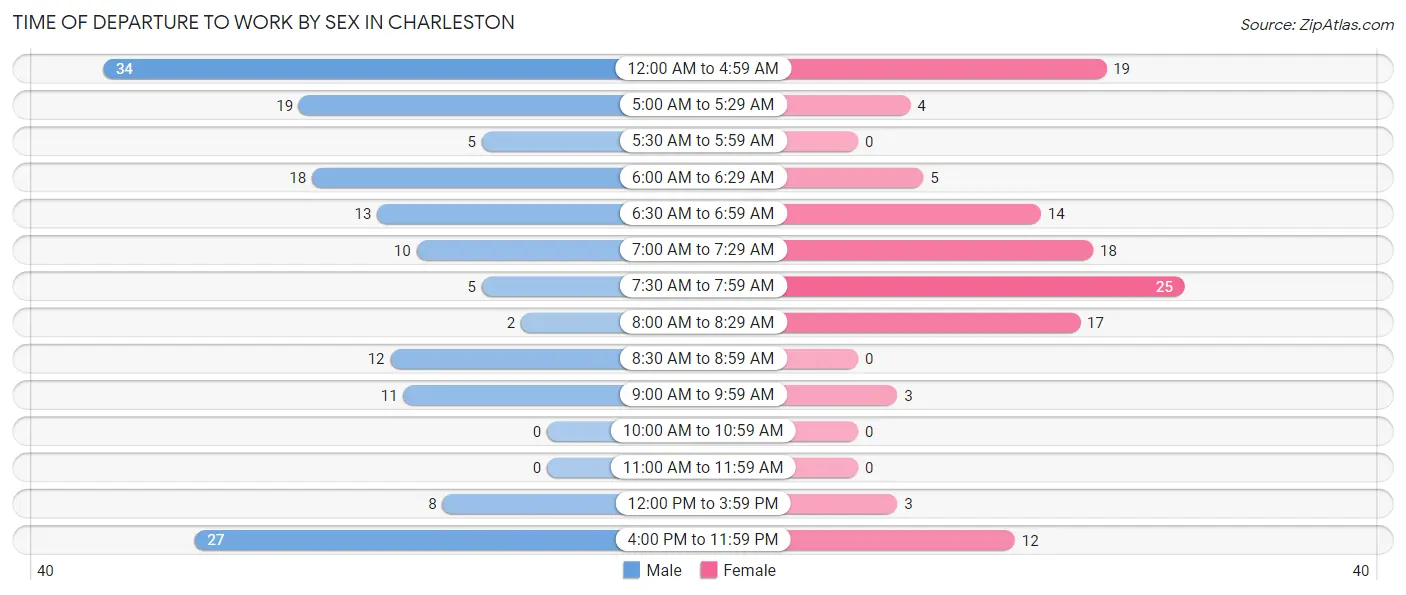
| Time of Departure | Male | Female |
| 12:00 AM to 4:59 AM | 34 (20.7%) | 19 (15.8%) |
| 5:00 AM to 5:29 AM | 19 (11.6%) | 4 (3.3%) |
| 5:30 AM to 5:59 AM | 5 (3.0%) | 0 (0.0%) |
| 6:00 AM to 6:29 AM | 18 (11.0%) | 5 (4.2%) |
| 6:30 AM to 6:59 AM | 13 (7.9%) | 14 (11.7%) |
| 7:00 AM to 7:29 AM | 10 (6.1%) | 18 (15.0%) |
| 7:30 AM to 7:59 AM | 5 (3.0%) | 25 (20.8%) |
| 8:00 AM to 8:29 AM | 2 (1.2%) | 17 (14.2%) |
| 8:30 AM to 8:59 AM | 12 (7.3%) | 0 (0.0%) |
| 9:00 AM to 9:59 AM | 11 (6.7%) | 3 (2.5%) |
| 10:00 AM to 10:59 AM | 0 (0.0%) | 0 (0.0%) |
| 11:00 AM to 11:59 AM | 0 (0.0%) | 0 (0.0%) |
| 12:00 PM to 3:59 PM | 8 (4.9%) | 3 (2.5%) |
| 4:00 PM to 11:59 PM | 27 (16.5%) | 12 (10.0%) |
| Total | 164 (100.0%) | 120 (100.0%) |
Housing Occupancy in Charleston
Occupancy by Ownership in Charleston
Of the total 248 dwellings in Charleston, owner-occupied units account for 183 (73.8%), while renter-occupied units make up 65 (26.2%).
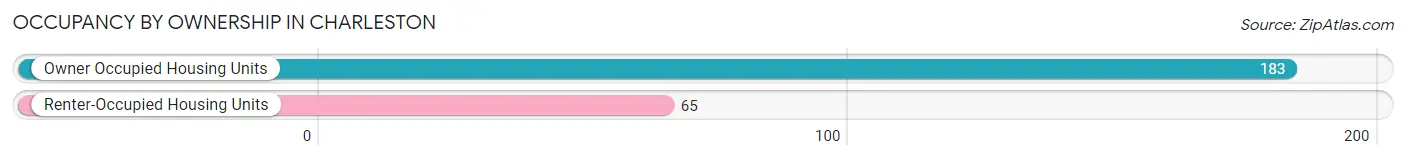
| Occupancy | # Housing Units | % Housing Units |
| Owner Occupied Housing Units | 183 | 73.8% |
| Renter-Occupied Housing Units | 65 | 26.2% |
| Total Occupied Housing Units | 248 | 100.0% |
Occupancy by Household Size in Charleston
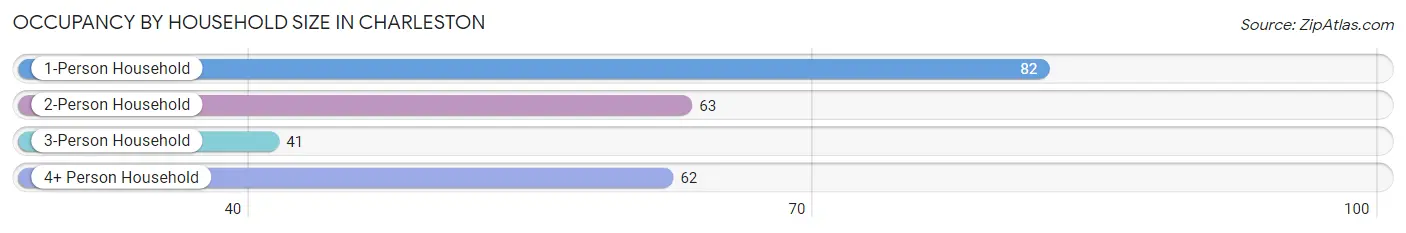
| Household Size | # Housing Units | % Housing Units |
| 1-Person Household | 82 | 33.1% |
| 2-Person Household | 63 | 25.4% |
| 3-Person Household | 41 | 16.5% |
| 4+ Person Household | 62 | 25.0% |
| Total Housing Units | 248 | 100.0% |
Occupancy by Ownership by Household Size in Charleston
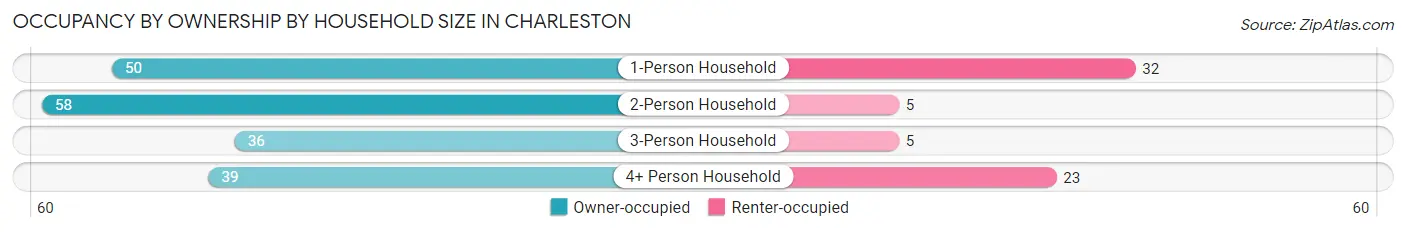
| Household Size | Owner-occupied | Renter-occupied |
| 1-Person Household | 50 (61.0%) | 32 (39.0%) |
| 2-Person Household | 58 (92.1%) | 5 (7.9%) |
| 3-Person Household | 36 (87.8%) | 5 (12.2%) |
| 4+ Person Household | 39 (62.9%) | 23 (37.1%) |
| Total Housing Units | 183 (73.8%) | 65 (26.2%) |
Occupancy by Educational Attainment in Charleston
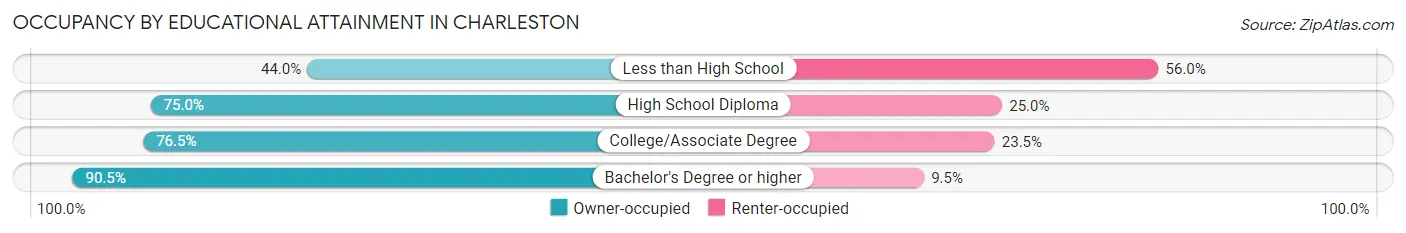
| Household Size | Owner-occupied | Renter-occupied |
| Less than High School | 11 (44.0%) | 14 (56.0%) |
| High School Diploma | 75 (75.0%) | 25 (25.0%) |
| College/Associate Degree | 78 (76.5%) | 24 (23.5%) |
| Bachelor's Degree or higher | 19 (90.5%) | 2 (9.5%) |
Occupancy by Age of Householder in Charleston
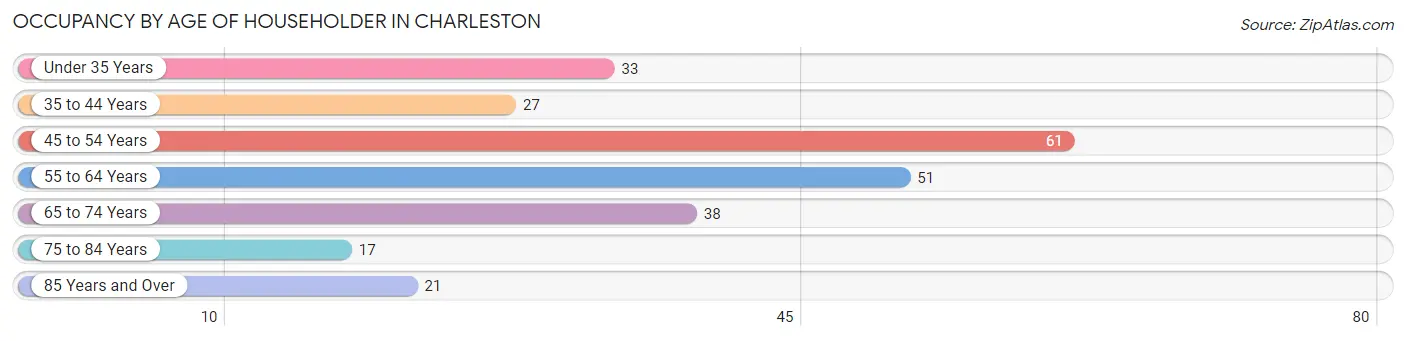
| Age Bracket | # Households | % Households |
| Under 35 Years | 33 | 13.3% |
| 35 to 44 Years | 27 | 10.9% |
| 45 to 54 Years | 61 | 24.6% |
| 55 to 64 Years | 51 | 20.6% |
| 65 to 74 Years | 38 | 15.3% |
| 75 to 84 Years | 17 | 6.9% |
| 85 Years and Over | 21 | 8.5% |
| Total | 248 | 100.0% |
Housing Finances in Charleston
Median Income by Occupancy in Charleston
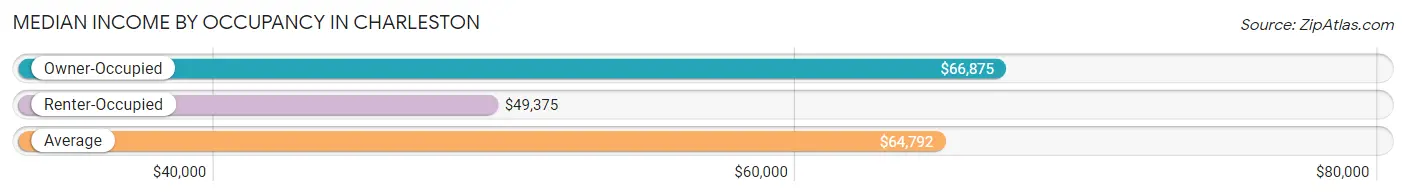
| Occupancy Type | # Households | Median Income |
| Owner-Occupied | 183 (73.8%) | $66,875 |
| Renter-Occupied | 65 (26.2%) | $49,375 |
| Average | 248 (100.0%) | $64,792 |
Occupancy by Householder Income Bracket in Charleston
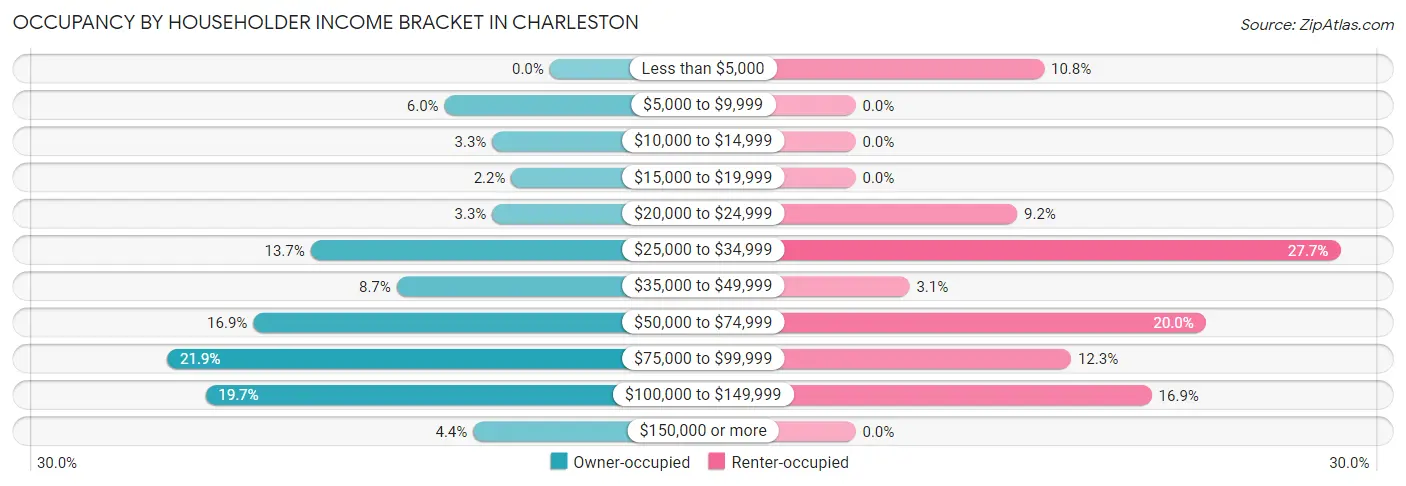
| Income Bracket | Owner-occupied | Renter-occupied |
| Less than $5,000 | 0 (0.0%) | 7 (10.8%) |
| $5,000 to $9,999 | 11 (6.0%) | 0 (0.0%) |
| $10,000 to $14,999 | 6 (3.3%) | 0 (0.0%) |
| $15,000 to $19,999 | 4 (2.2%) | 0 (0.0%) |
| $20,000 to $24,999 | 6 (3.3%) | 6 (9.2%) |
| $25,000 to $34,999 | 25 (13.7%) | 18 (27.7%) |
| $35,000 to $49,999 | 16 (8.7%) | 2 (3.1%) |
| $50,000 to $74,999 | 31 (16.9%) | 13 (20.0%) |
| $75,000 to $99,999 | 40 (21.9%) | 8 (12.3%) |
| $100,000 to $149,999 | 36 (19.7%) | 11 (16.9%) |
| $150,000 or more | 8 (4.4%) | 0 (0.0%) |
| Total | 183 (100.0%) | 65 (100.0%) |
Monthly Housing Cost Tiers in Charleston
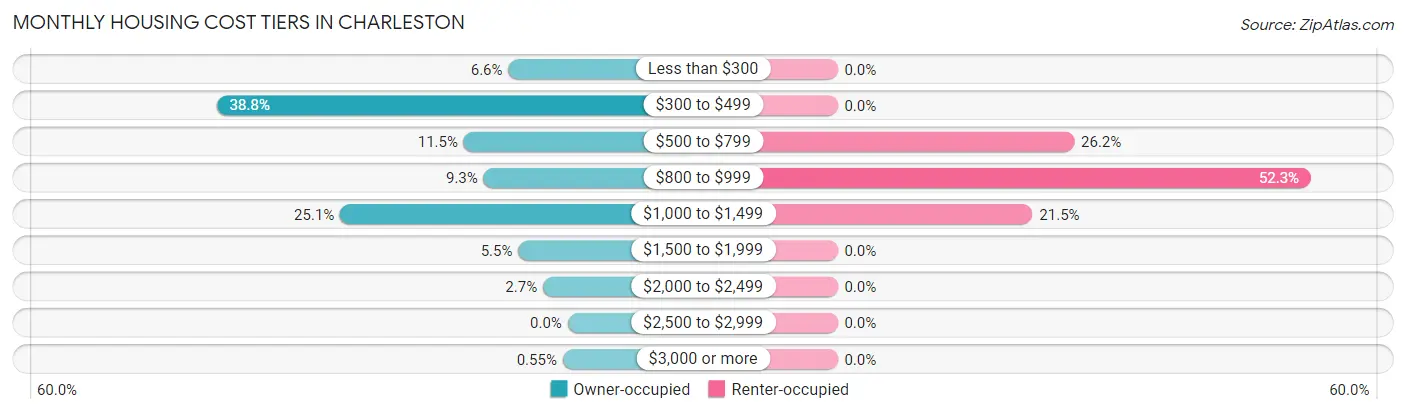
| Monthly Cost | Owner-occupied | Renter-occupied |
| Less than $300 | 12 (6.6%) | 0 (0.0%) |
| $300 to $499 | 71 (38.8%) | 0 (0.0%) |
| $500 to $799 | 21 (11.5%) | 17 (26.2%) |
| $800 to $999 | 17 (9.3%) | 34 (52.3%) |
| $1,000 to $1,499 | 46 (25.1%) | 14 (21.5%) |
| $1,500 to $1,999 | 10 (5.5%) | 0 (0.0%) |
| $2,000 to $2,499 | 5 (2.7%) | 0 (0.0%) |
| $2,500 to $2,999 | 0 (0.0%) | 0 (0.0%) |
| $3,000 or more | 1 (0.5%) | 0 (0.0%) |
| Total | 183 (100.0%) | 65 (100.0%) |
Physical Housing Characteristics in Charleston
Housing Structures in Charleston
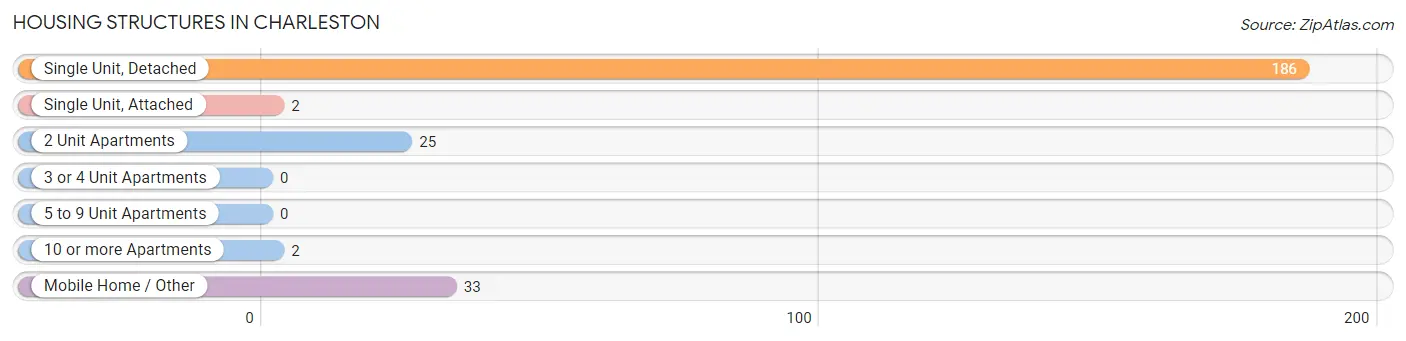
| Structure Type | # Housing Units | % Housing Units |
| Single Unit, Detached | 186 | 75.0% |
| Single Unit, Attached | 2 | 0.8% |
| 2 Unit Apartments | 25 | 10.1% |
| 3 or 4 Unit Apartments | 0 | 0.0% |
| 5 to 9 Unit Apartments | 0 | 0.0% |
| 10 or more Apartments | 2 | 0.8% |
| Mobile Home / Other | 33 | 13.3% |
| Total | 248 | 100.0% |
Housing Structures by Occupancy in Charleston
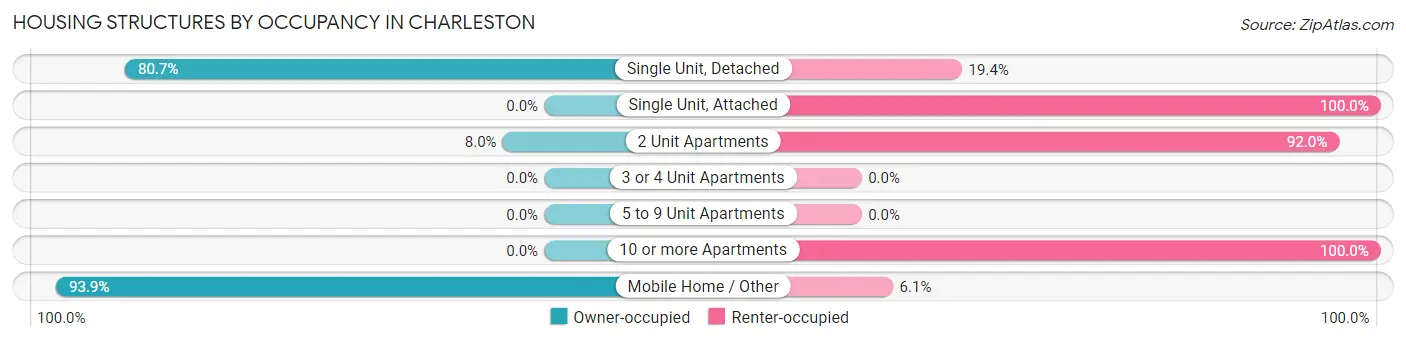
| Structure Type | Owner-occupied | Renter-occupied |
| Single Unit, Detached | 150 (80.6%) | 36 (19.4%) |
| Single Unit, Attached | 0 (0.0%) | 2 (100.0%) |
| 2 Unit Apartments | 2 (8.0%) | 23 (92.0%) |
| 3 or 4 Unit Apartments | 0 (0.0%) | 0 (0.0%) |
| 5 to 9 Unit Apartments | 0 (0.0%) | 0 (0.0%) |
| 10 or more Apartments | 0 (0.0%) | 2 (100.0%) |
| Mobile Home / Other | 31 (93.9%) | 2 (6.1%) |
| Total | 183 (73.8%) | 65 (26.2%) |
Housing Structures by Number of Rooms in Charleston
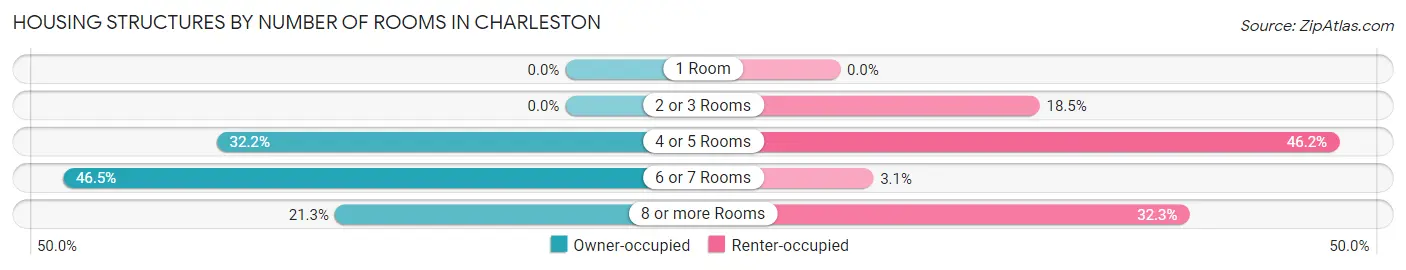
| Number of Rooms | Owner-occupied | Renter-occupied |
| 1 Room | 0 (0.0%) | 0 (0.0%) |
| 2 or 3 Rooms | 0 (0.0%) | 12 (18.5%) |
| 4 or 5 Rooms | 59 (32.2%) | 30 (46.2%) |
| 6 or 7 Rooms | 85 (46.5%) | 2 (3.1%) |
| 8 or more Rooms | 39 (21.3%) | 21 (32.3%) |
| Total | 183 (100.0%) | 65 (100.0%) |
Housing Structure by Heating Type in Charleston
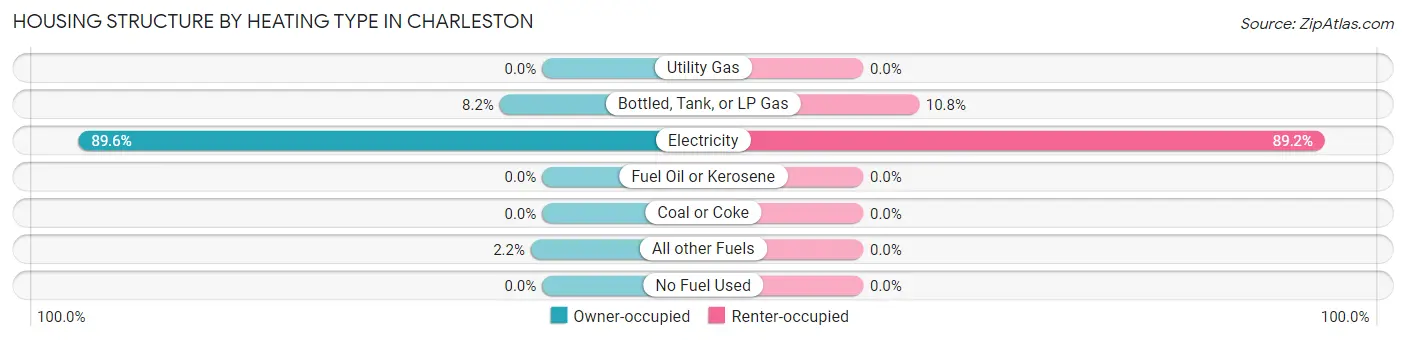
| Heating Type | Owner-occupied | Renter-occupied |
| Utility Gas | 0 (0.0%) | 0 (0.0%) |
| Bottled, Tank, or LP Gas | 15 (8.2%) | 7 (10.8%) |
| Electricity | 164 (89.6%) | 58 (89.2%) |
| Fuel Oil or Kerosene | 0 (0.0%) | 0 (0.0%) |
| Coal or Coke | 0 (0.0%) | 0 (0.0%) |
| All other Fuels | 4 (2.2%) | 0 (0.0%) |
| No Fuel Used | 0 (0.0%) | 0 (0.0%) |
| Total | 183 (100.0%) | 65 (100.0%) |
Household Vehicle Usage in Charleston
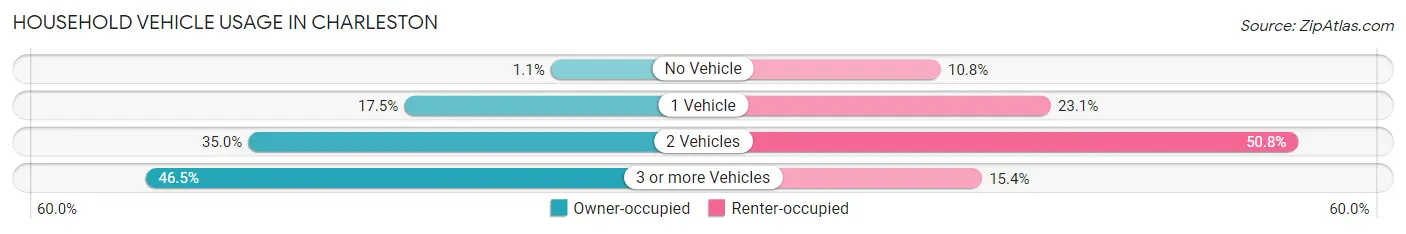
| Vehicles per Household | Owner-occupied | Renter-occupied |
| No Vehicle | 2 (1.1%) | 7 (10.8%) |
| 1 Vehicle | 32 (17.5%) | 15 (23.1%) |
| 2 Vehicles | 64 (35.0%) | 33 (50.8%) |
| 3 or more Vehicles | 85 (46.5%) | 10 (15.4%) |
| Total | 183 (100.0%) | 65 (100.0%) |
Real Estate & Mortgages in Charleston
Real Estate and Mortgage Overview in Charleston
| Characteristic | Without Mortgage | With Mortgage |
| Housing Units | 88 | 95 |
| Median Property Value | $141,000 | $164,800 |
| Median Household Income | - | - |
| Monthly Housing Costs | $343 | $1 |
| Real Estate Taxes | $391 | $10 |
Property Value by Mortgage Status in Charleston
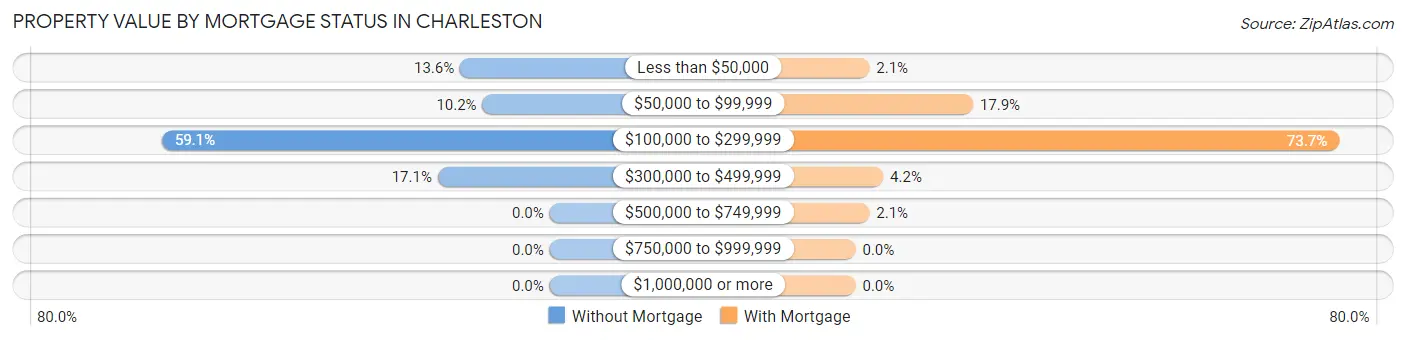
| Property Value | Without Mortgage | With Mortgage |
| Less than $50,000 | 12 (13.6%) | 2 (2.1%) |
| $50,000 to $99,999 | 9 (10.2%) | 17 (17.9%) |
| $100,000 to $299,999 | 52 (59.1%) | 70 (73.7%) |
| $300,000 to $499,999 | 15 (17.1%) | 4 (4.2%) |
| $500,000 to $749,999 | 0 (0.0%) | 2 (2.1%) |
| $750,000 to $999,999 | 0 (0.0%) | 0 (0.0%) |
| $1,000,000 or more | 0 (0.0%) | 0 (0.0%) |
| Total | 88 (100.0%) | 95 (100.0%) |
Household Income by Mortgage Status in Charleston
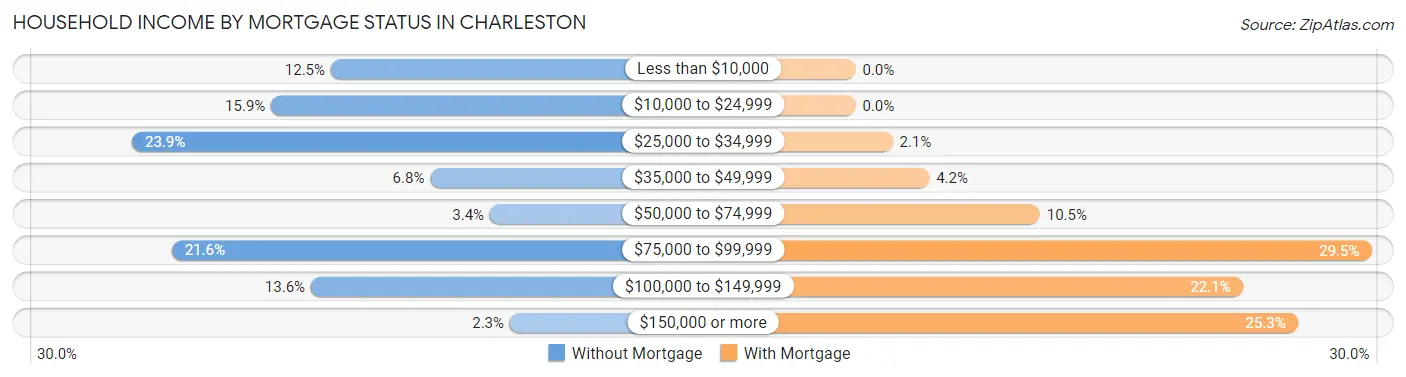
| Household Income | Without Mortgage | With Mortgage |
| Less than $10,000 | 11 (12.5%) | 0 (0.0%) |
| $10,000 to $24,999 | 14 (15.9%) | 0 (0.0%) |
| $25,000 to $34,999 | 21 (23.9%) | 2 (2.1%) |
| $35,000 to $49,999 | 6 (6.8%) | 4 (4.2%) |
| $50,000 to $74,999 | 3 (3.4%) | 10 (10.5%) |
| $75,000 to $99,999 | 19 (21.6%) | 28 (29.5%) |
| $100,000 to $149,999 | 12 (13.6%) | 21 (22.1%) |
| $150,000 or more | 2 (2.3%) | 24 (25.3%) |
| Total | 88 (100.0%) | 95 (100.0%) |
Property Value to Household Income Ratio in Charleston
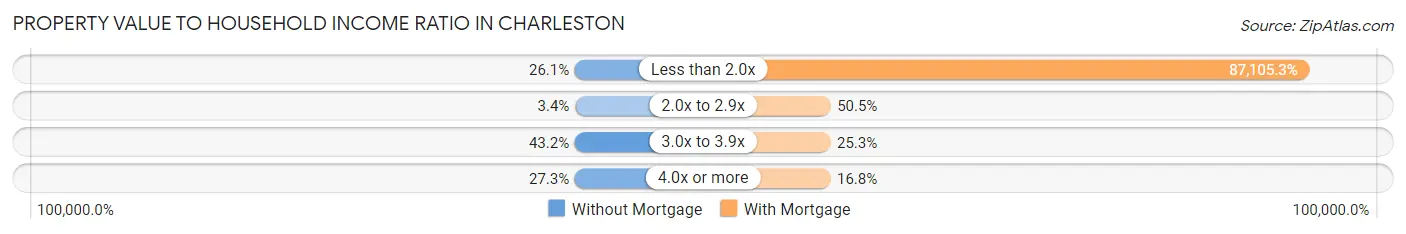
| Value-to-Income Ratio | Without Mortgage | With Mortgage |
| Less than 2.0x | 23 (26.1%) | 82,750 (87,105.3%) |
| 2.0x to 2.9x | 3 (3.4%) | 48 (50.5%) |
| 3.0x to 3.9x | 38 (43.2%) | 24 (25.3%) |
| 4.0x or more | 24 (27.3%) | 16 (16.8%) |
| Total | 88 (100.0%) | 95 (100.0%) |
Real Estate Taxes by Mortgage Status in Charleston
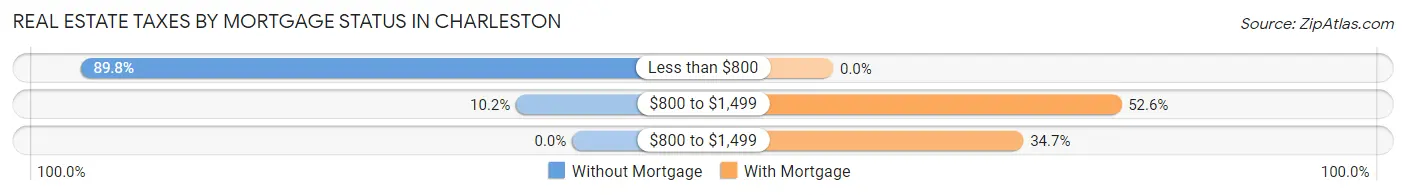
| Property Taxes | Without Mortgage | With Mortgage |
| Less than $800 | 79 (89.8%) | 0 (0.0%) |
| $800 to $1,499 | 9 (10.2%) | 50 (52.6%) |
| $800 to $1,499 | 0 (0.0%) | 33 (34.7%) |
| Total | 88 (100.0%) | 95 (100.0%) |
Health & Disability in Charleston
Health Insurance Coverage by Age in Charleston
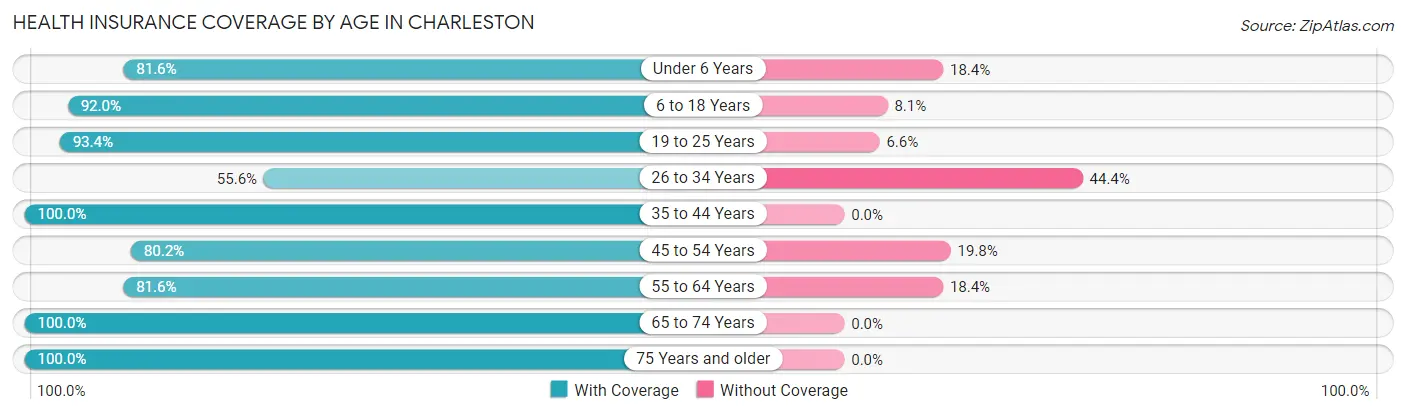
| Age Bracket | With Coverage | Without Coverage |
| Under 6 Years | 31 (81.6%) | 7 (18.4%) |
| 6 to 18 Years | 80 (91.9%) | 7 (8.1%) |
| 19 to 25 Years | 57 (93.4%) | 4 (6.6%) |
| 26 to 34 Years | 20 (55.6%) | 16 (44.4%) |
| 35 to 44 Years | 48 (100.0%) | 0 (0.0%) |
| 45 to 54 Years | 93 (80.2%) | 23 (19.8%) |
| 55 to 64 Years | 133 (81.6%) | 30 (18.4%) |
| 65 to 74 Years | 49 (100.0%) | 0 (0.0%) |
| 75 Years and older | 43 (100.0%) | 0 (0.0%) |
| Total | 554 (86.4%) | 87 (13.6%) |
Health Insurance Coverage by Citizenship Status in Charleston
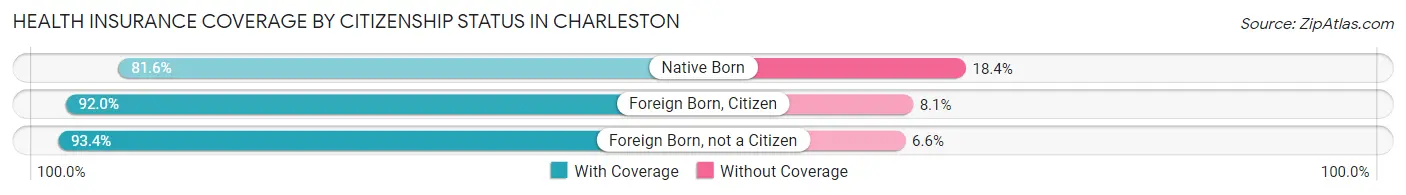
| Citizenship Status | With Coverage | Without Coverage |
| Native Born | 31 (81.6%) | 7 (18.4%) |
| Foreign Born, Citizen | 80 (91.9%) | 7 (8.1%) |
| Foreign Born, not a Citizen | 57 (93.4%) | 4 (6.6%) |
Health Insurance Coverage by Household Income in Charleston
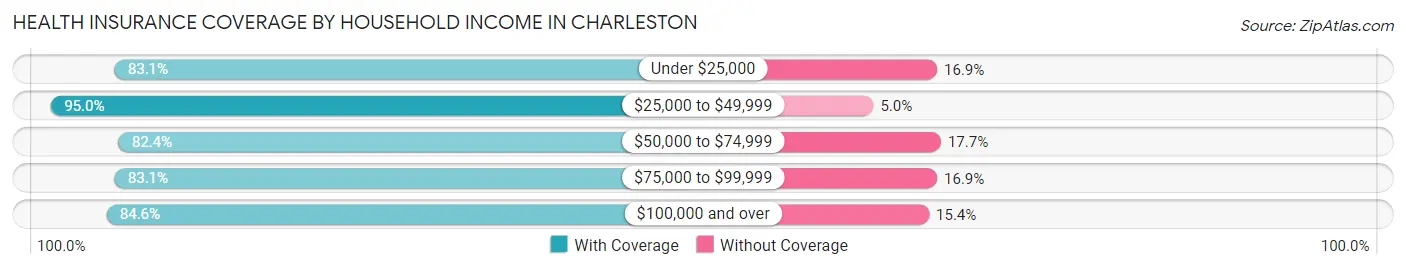
| Household Income | With Coverage | Without Coverage |
| Under $25,000 | 54 (83.1%) | 11 (16.9%) |
| $25,000 to $49,999 | 152 (95.0%) | 8 (5.0%) |
| $50,000 to $74,999 | 70 (82.4%) | 15 (17.6%) |
| $75,000 to $99,999 | 108 (83.1%) | 22 (16.9%) |
| $100,000 and over | 170 (84.6%) | 31 (15.4%) |
Public vs Private Health Insurance Coverage by Age in Charleston
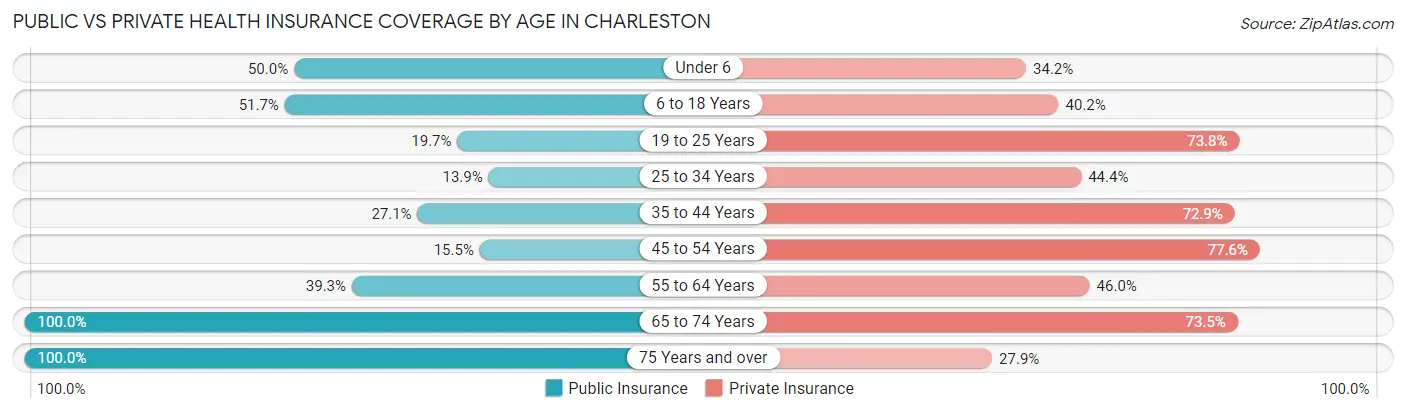
| Age Bracket | Public Insurance | Private Insurance |
| Under 6 | 19 (50.0%) | 13 (34.2%) |
| 6 to 18 Years | 45 (51.7%) | 35 (40.2%) |
| 19 to 25 Years | 12 (19.7%) | 45 (73.8%) |
| 25 to 34 Years | 5 (13.9%) | 16 (44.4%) |
| 35 to 44 Years | 13 (27.1%) | 35 (72.9%) |
| 45 to 54 Years | 18 (15.5%) | 90 (77.6%) |
| 55 to 64 Years | 64 (39.3%) | 75 (46.0%) |
| 65 to 74 Years | 49 (100.0%) | 36 (73.5%) |
| 75 Years and over | 43 (100.0%) | 12 (27.9%) |
| Total | 268 (41.8%) | 357 (55.7%) |
Disability Status by Sex by Age in Charleston
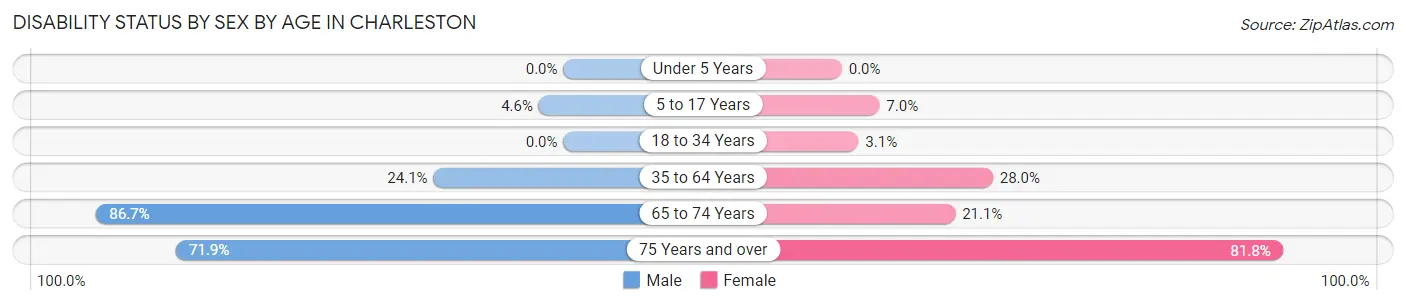
| Age Bracket | Male | Female |
| Under 5 Years | 0 (0.0%) | 0 (0.0%) |
| 5 to 17 Years | 2 (4.5%) | 3 (7.0%) |
| 18 to 34 Years | 0 (0.0%) | 2 (3.1%) |
| 35 to 64 Years | 41 (24.1%) | 44 (28.0%) |
| 65 to 74 Years | 26 (86.7%) | 4 (21.0%) |
| 75 Years and over | 23 (71.9%) | 9 (81.8%) |
Disability Class by Sex by Age in Charleston
Disability Class: Hearing Difficulty
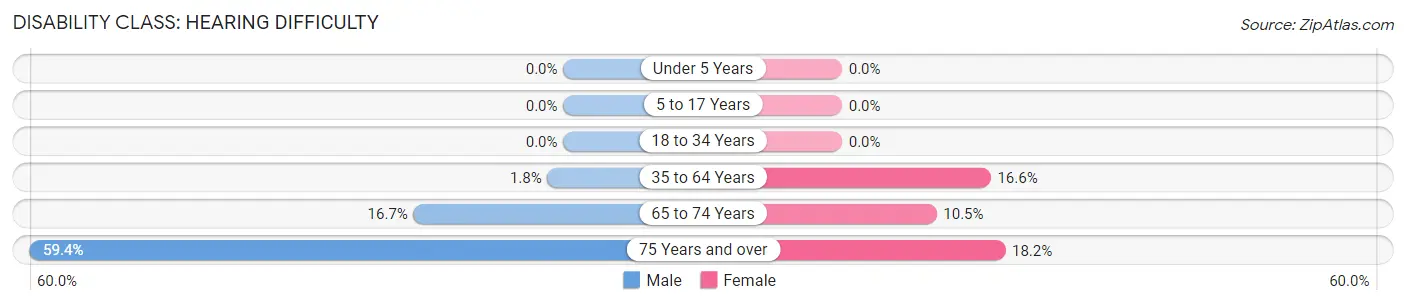
| Age Bracket | Male | Female |
| Under 5 Years | 0 (0.0%) | 0 (0.0%) |
| 5 to 17 Years | 0 (0.0%) | 0 (0.0%) |
| 18 to 34 Years | 0 (0.0%) | 0 (0.0%) |
| 35 to 64 Years | 3 (1.8%) | 26 (16.6%) |
| 65 to 74 Years | 5 (16.7%) | 2 (10.5%) |
| 75 Years and over | 19 (59.4%) | 2 (18.2%) |
Disability Class: Vision Difficulty
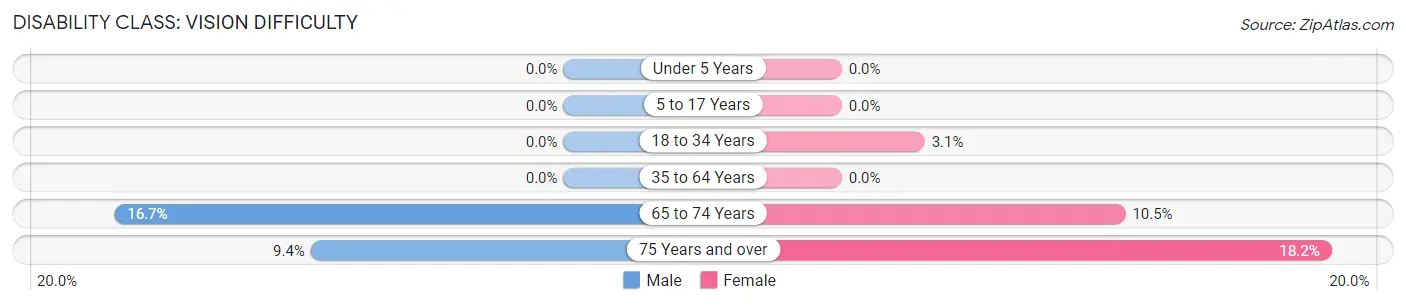
| Age Bracket | Male | Female |
| Under 5 Years | 0 (0.0%) | 0 (0.0%) |
| 5 to 17 Years | 0 (0.0%) | 0 (0.0%) |
| 18 to 34 Years | 0 (0.0%) | 2 (3.1%) |
| 35 to 64 Years | 0 (0.0%) | 0 (0.0%) |
| 65 to 74 Years | 5 (16.7%) | 2 (10.5%) |
| 75 Years and over | 3 (9.4%) | 2 (18.2%) |
Disability Class: Cognitive Difficulty
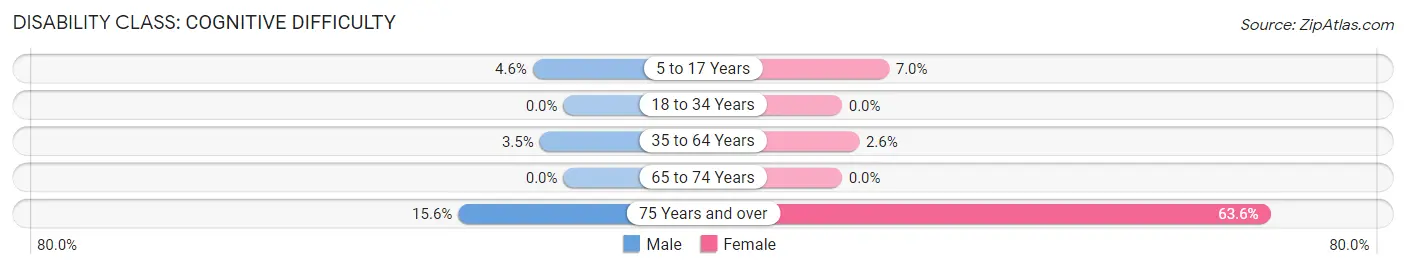
| Age Bracket | Male | Female |
| 5 to 17 Years | 2 (4.5%) | 3 (7.0%) |
| 18 to 34 Years | 0 (0.0%) | 0 (0.0%) |
| 35 to 64 Years | 6 (3.5%) | 4 (2.5%) |
| 65 to 74 Years | 0 (0.0%) | 0 (0.0%) |
| 75 Years and over | 5 (15.6%) | 7 (63.6%) |
Disability Class: Ambulatory Difficulty
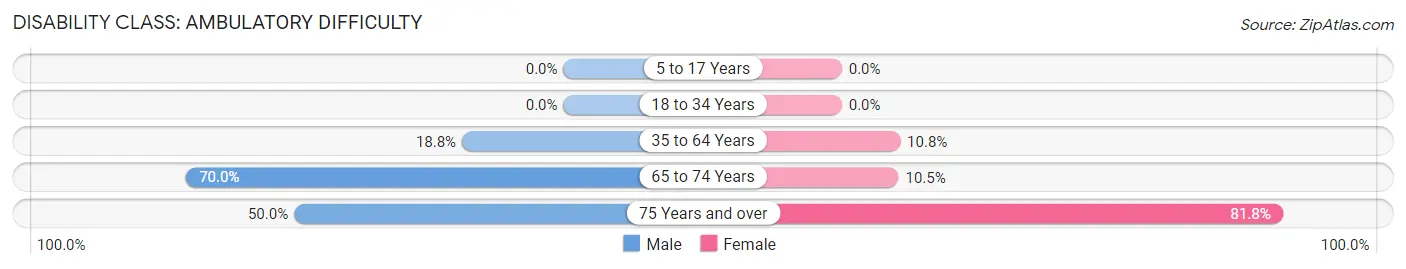
| Age Bracket | Male | Female |
| 5 to 17 Years | 0 (0.0%) | 0 (0.0%) |
| 18 to 34 Years | 0 (0.0%) | 0 (0.0%) |
| 35 to 64 Years | 32 (18.8%) | 17 (10.8%) |
| 65 to 74 Years | 21 (70.0%) | 2 (10.5%) |
| 75 Years and over | 16 (50.0%) | 9 (81.8%) |
Disability Class: Self-Care Difficulty
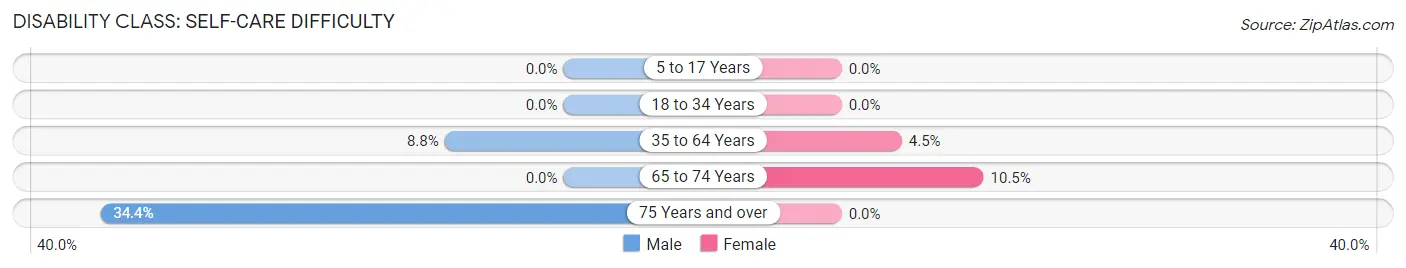
| Age Bracket | Male | Female |
| 5 to 17 Years | 0 (0.0%) | 0 (0.0%) |
| 18 to 34 Years | 0 (0.0%) | 0 (0.0%) |
| 35 to 64 Years | 15 (8.8%) | 7 (4.5%) |
| 65 to 74 Years | 0 (0.0%) | 2 (10.5%) |
| 75 Years and over | 11 (34.4%) | 0 (0.0%) |
Technology Access in Charleston
Computing Device Access in Charleston
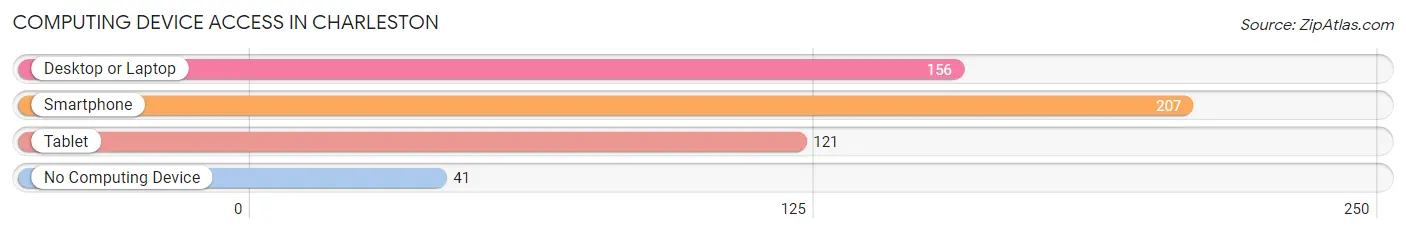
| Device Type | # Households | % Households |
| Desktop or Laptop | 156 | 62.9% |
| Smartphone | 207 | 83.5% |
| Tablet | 121 | 48.8% |
| No Computing Device | 41 | 16.5% |
| Total | 248 | 100.0% |
Internet Access in Charleston
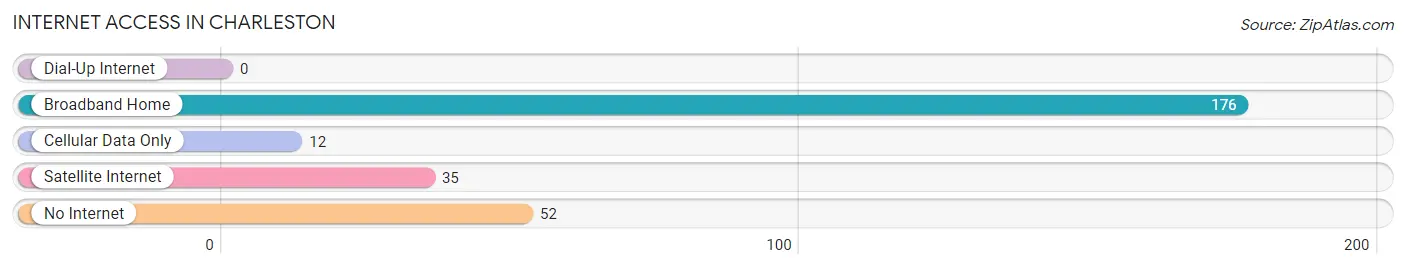
| Internet Type | # Households | % Households |
| Dial-Up Internet | 0 | 0.0% |
| Broadband Home | 176 | 71.0% |
| Cellular Data Only | 12 | 4.8% |
| Satellite Internet | 35 | 14.1% |
| No Internet | 52 | 21.0% |
| Total | 248 | 100.0% |
Charleston Summary
Charleston is a small town located in Bradley County, Tennessee. It is situated in the foothills of the Appalachian Mountains and is part of the Chattanooga metropolitan area. The town has a population of approximately 4,000 people and is known for its rural charm and friendly atmosphere.
History
The area that is now Charleston was first settled in the early 1800s by a group of settlers from North Carolina. The town was originally known as "Charlestown" and was named after Charles B. Walker, a prominent local landowner. The town was officially incorporated in 1875 and was the first incorporated town in Bradley County.
In the late 1800s, the town experienced a period of growth and development. The railroad arrived in 1887, bringing with it new businesses and industries. The town also became a popular tourist destination, with many visitors coming to enjoy the scenic beauty of the Appalachian Mountains.
In the early 1900s, the town experienced a period of decline. The railroad was abandoned and many businesses closed. However, the town was able to survive and eventually began to experience a period of growth and revitalization in the late 20th century.
Geography
Charleston is located in the foothills of the Appalachian Mountains in eastern Tennessee. The town is situated at the intersection of US Highway 11 and State Route 308. The town is surrounded by rolling hills and is located near the Hiwassee River.
The climate in Charleston is humid subtropical, with hot summers and mild winters. The average annual temperature is around 60 degrees Fahrenheit. The town receives an average of 48 inches of precipitation per year.
Economy
The economy of Charleston is largely based on agriculture and tourism. The town is home to several farms, which produce a variety of crops, including corn, soybeans, and hay. The town is also home to several tourist attractions, including the Hiwassee River, the Appalachian Trail, and the Cherokee National Forest.
The town is also home to several small businesses, including restaurants, shops, and other services. The town is also home to several manufacturing companies, including a furniture factory and a plastics factory.
Demographics
As of the 2010 census, the population of Charleston was 4,000. The racial makeup of the town was 95.3% White, 1.2% African American, 0.3% Native American, 0.3% Asian, 0.1% Pacific Islander, and 2.7% from other races. The median household income was $35,000 and the median family income was $41,000.
Conclusion
Charleston is a small town located in Bradley County, Tennessee. It is situated in the foothills of the Appalachian Mountains and is part of the Chattanooga metropolitan area. The town has a population of approximately 4,000 people and is known for its rural charm and friendly atmosphere. The economy of Charleston is largely based on agriculture and tourism, and the town is home to several small businesses, manufacturing companies, and tourist attractions. The town has a diverse population, with a median household income of $35,000 and a median family income of $41,000.
Common Questions
What is Per Capita Income in Charleston?
Per Capita income in Charleston is $26,401.
What is the Median Family Income in Charleston?
Median Family Income in Charleston is $77,206.
What is the Median Household income in Charleston?
Median Household Income in Charleston is $64,792.
What is Income or Wage Gap in Charleston?
Income or Wage Gap in Charleston is 36.3%.
Women in Charleston earn 63.7 cents for every dollar earned by a man.
What is Family Income Deficit in Charleston?
Family Income Deficit in Charleston is $12,982.
Families that are below poverty line in Charleston earn $12,982 less on average than the poverty threshold level.
What is Inequality or Gini Index in Charleston?
Inequality or Gini Index in Charleston is 0.35.
What is the Total Population of Charleston?
Total Population of Charleston is 641.
What is the Total Male Population of Charleston?
Total Male Population of Charleston is 336.
What is the Total Female Population of Charleston?
Total Female Population of Charleston is 305.
What is the Ratio of Males per 100 Females in Charleston?
There are 110.16 Males per 100 Females in Charleston.
What is the Ratio of Females per 100 Males in Charleston?
There are 90.77 Females per 100 Males in Charleston.
What is the Median Population Age in Charleston?
Median Population Age in Charleston is 48.3 Years.
What is the Average Family Size in Charleston
Average Family Size in Charleston is 3.3 People.
What is the Average Household Size in Charleston
Average Household Size in Charleston is 2.6 People.
How Large is the Labor Force in Charleston?
There are 308 People in the Labor Forcein in Charleston.
What is the Percentage of People in the Labor Force in Charleston?
57.2% of People are in the Labor Force in Charleston.
What is the Unemployment Rate in Charleston?
Unemployment Rate in Charleston is 2.3%.