Fairview, TN Map & Demographics
Fairview Map
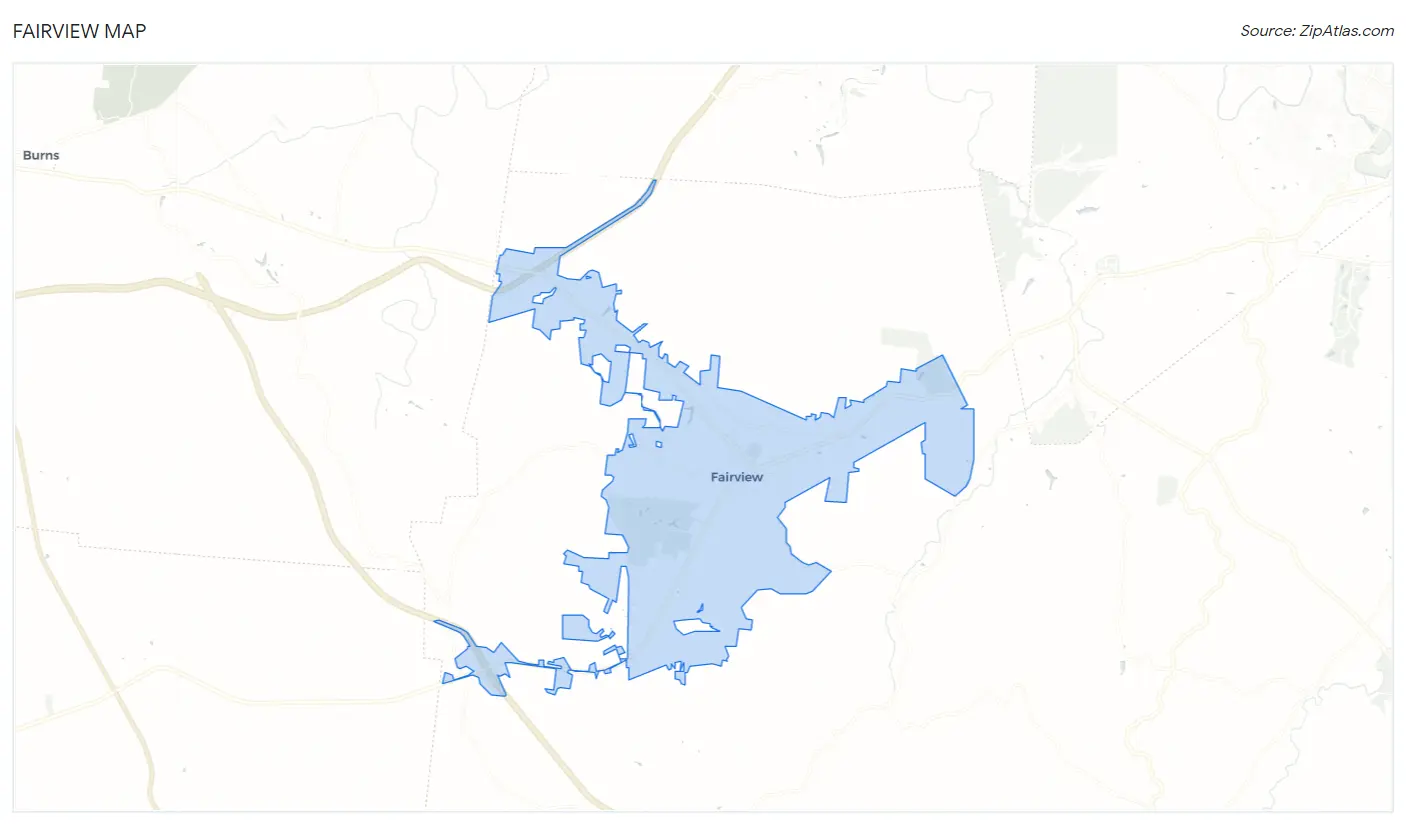
Fairview Overview
$35,439
PER CAPITA INCOME
$93,989
AVG FAMILY INCOME
$82,344
AVG HOUSEHOLD INCOME
29.3%
WAGE / INCOME GAP [ % ]
70.7¢/ $1
WAGE / INCOME GAP [ $ ]
$10,862
FAMILY INCOME DEFICIT
0.36
INEQUALITY / GINI INDEX
9,519
TOTAL POPULATION
4,936
MALE POPULATION
4,583
FEMALE POPULATION
107.70
MALES / 100 FEMALES
92.85
FEMALES / 100 MALES
34.9
MEDIAN AGE
3.2
AVG FAMILY SIZE
2.6
AVG HOUSEHOLD SIZE
5,078
LABOR FORCE [ PEOPLE ]
68.1%
PERCENT IN LABOR FORCE
2.4%
UNEMPLOYMENT RATE
Fairview Zip Codes
Fairview Area Codes
Income in Fairview
Income Overview in Fairview
Per Capita Income in Fairview is $35,439, while median incomes of families and households are $93,989 and $82,344 respectively.
| Characteristic | Number | Measure |
| Per Capita Income | 9,519 | $35,439 |
| Median Family Income | 2,543 | $93,989 |
| Mean Family Income | 2,543 | $103,156 |
| Median Household Income | 3,602 | $82,344 |
| Mean Household Income | 3,602 | $92,958 |
| Income Deficit | 2,543 | $10,862 |
| Wage / Income Gap (%) | 9,519 | 29.29% |
| Wage / Income Gap ($) | 9,519 | 70.71¢ per $1 |
| Gini / Inequality Index | 9,519 | 0.36 |
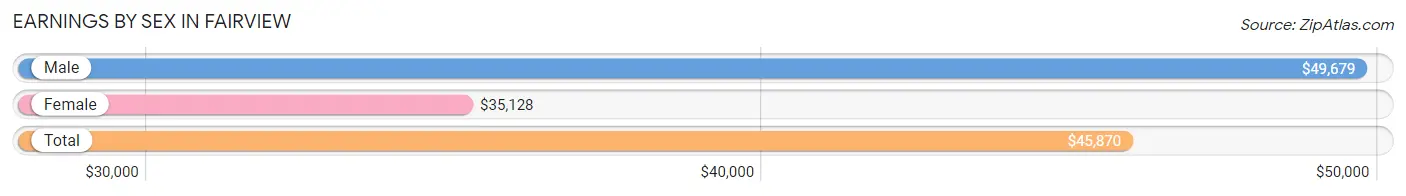
Earnings by Sex in Fairview
Average Earnings in Fairview are $45,870, $49,679 for men and $35,128 for women, a difference of 29.3%.
| Sex | Number | Average Earnings |
| Male | 2,744 (51.4%) | $49,679 |
| Female | 2,596 (48.6%) | $35,128 |
| Total | 5,340 (100.0%) | $45,870 |
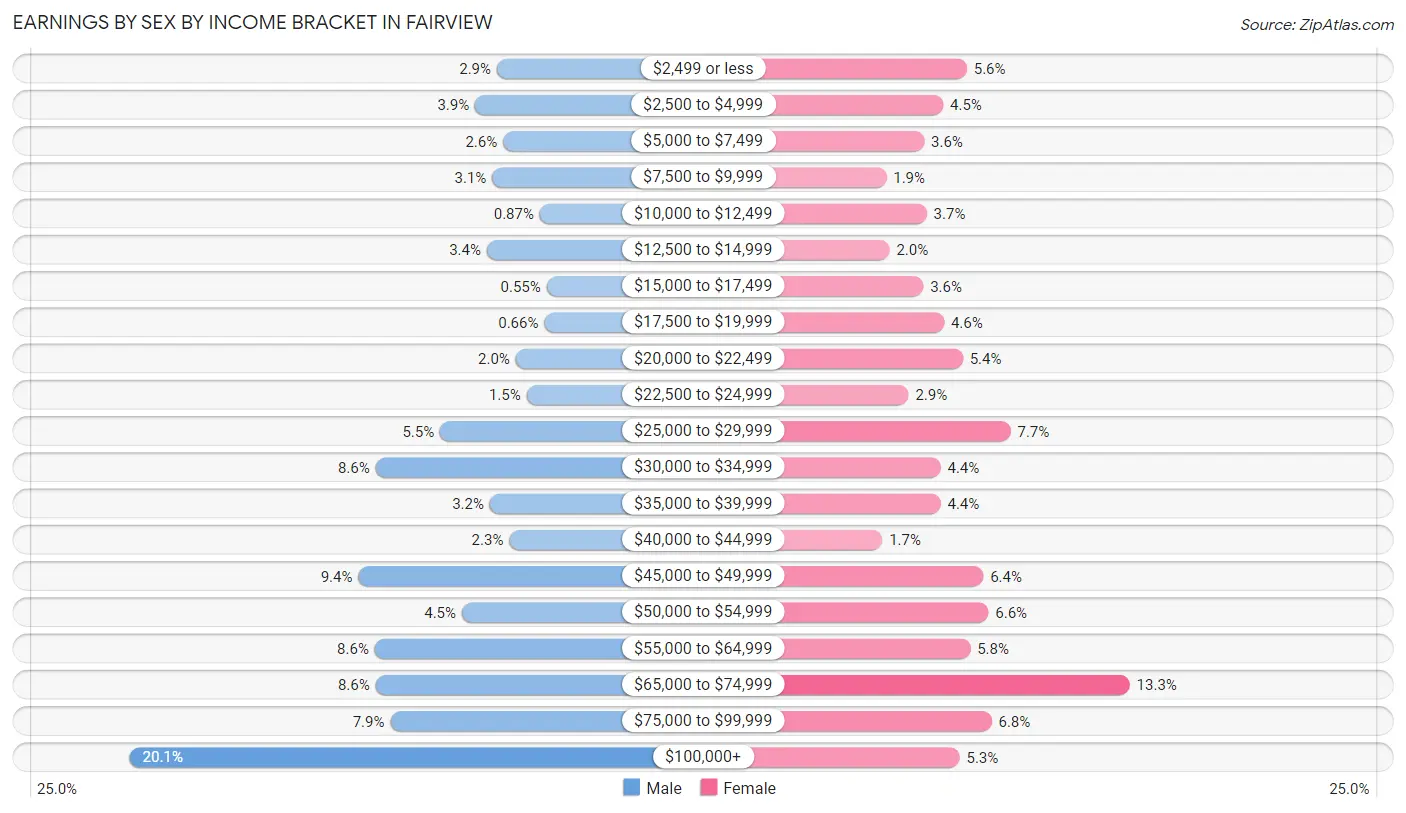
Earnings by Sex by Income Bracket in Fairview
The most common earnings brackets in Fairview are $100,000+ for men (551 | 20.1%) and $65,000 to $74,999 for women (344 | 13.3%).
| Income | Male | Female |
| $2,499 or less | 79 (2.9%) | 146 (5.6%) |
| $2,500 to $4,999 | 107 (3.9%) | 117 (4.5%) |
| $5,000 to $7,499 | 71 (2.6%) | 94 (3.6%) |
| $7,500 to $9,999 | 85 (3.1%) | 48 (1.8%) |
| $10,000 to $12,499 | 24 (0.9%) | 97 (3.7%) |
| $12,500 to $14,999 | 92 (3.4%) | 52 (2.0%) |
| $15,000 to $17,499 | 15 (0.5%) | 93 (3.6%) |
| $17,500 to $19,999 | 18 (0.7%) | 118 (4.5%) |
| $20,000 to $22,499 | 55 (2.0%) | 141 (5.4%) |
| $22,500 to $24,999 | 41 (1.5%) | 75 (2.9%) |
| $25,000 to $29,999 | 152 (5.5%) | 199 (7.7%) |
| $30,000 to $34,999 | 235 (8.6%) | 114 (4.4%) |
| $35,000 to $39,999 | 88 (3.2%) | 114 (4.4%) |
| $40,000 to $44,999 | 63 (2.3%) | 43 (1.7%) |
| $45,000 to $49,999 | 257 (9.4%) | 166 (6.4%) |
| $50,000 to $54,999 | 124 (4.5%) | 172 (6.6%) |
| $55,000 to $64,999 | 236 (8.6%) | 150 (5.8%) |
| $65,000 to $74,999 | 235 (8.6%) | 344 (13.3%) |
| $75,000 to $99,999 | 216 (7.9%) | 176 (6.8%) |
| $100,000+ | 551 (20.1%) | 137 (5.3%) |
| Total | 2,744 (100.0%) | 2,596 (100.0%) |
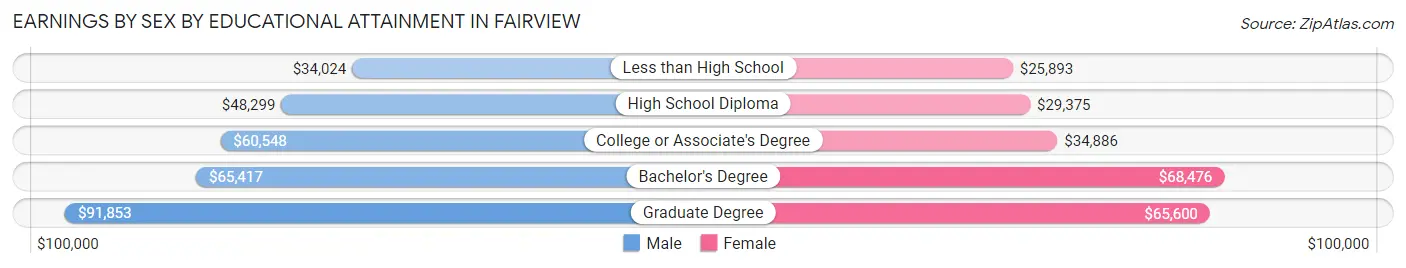
Earnings by Sex by Educational Attainment in Fairview
Average earnings in Fairview are $55,972 for men and $47,331 for women, a difference of 15.4%. Men with an educational attainment of graduate degree enjoy the highest average annual earnings of $91,853, while those with less than high school education earn the least with $34,024. Women with an educational attainment of bachelor's degree earn the most with the average annual earnings of $68,476, while those with less than high school education have the smallest earnings of $25,893.
| Educational Attainment | Male Income | Female Income |
| Less than High School | $34,024 | $25,893 |
| High School Diploma | $48,299 | $29,375 |
| College or Associate's Degree | $60,548 | $34,886 |
| Bachelor's Degree | $65,417 | $68,476 |
| Graduate Degree | $91,853 | $65,600 |
| Total | $55,972 | $47,331 |
Family Income in Fairview
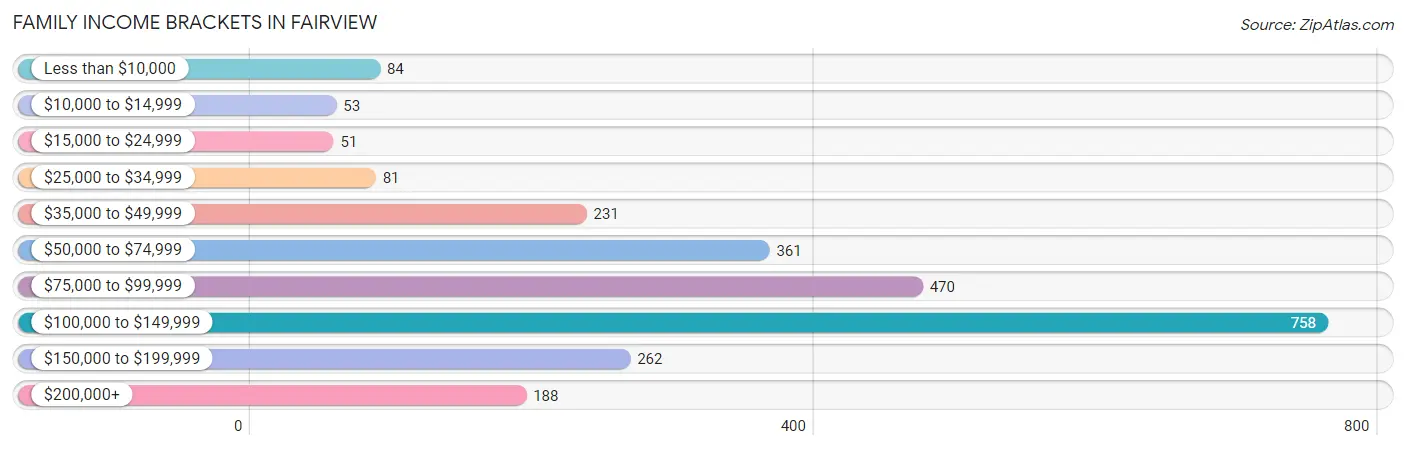
Family Income Brackets in Fairview
According to the Fairview family income data, there are 758 families falling into the $100,000 to $149,999 income range, which is the most common income bracket and makes up 29.8% of all families. Conversely, the $15,000 to $24,999 income bracket is the least frequent group with only 51 families (2.0%) belonging to this category.
| Income Bracket | # Families | % Families |
| Less than $10,000 | 84 | 3.3% |
| $10,000 to $14,999 | 53 | 2.1% |
| $15,000 to $24,999 | 51 | 2.0% |
| $25,000 to $34,999 | 81 | 3.2% |
| $35,000 to $49,999 | 231 | 9.1% |
| $50,000 to $74,999 | 361 | 14.2% |
| $75,000 to $99,999 | 470 | 18.5% |
| $100,000 to $149,999 | 758 | 29.8% |
| $150,000 to $199,999 | 262 | 10.3% |
| $200,000+ | 188 | 7.4% |
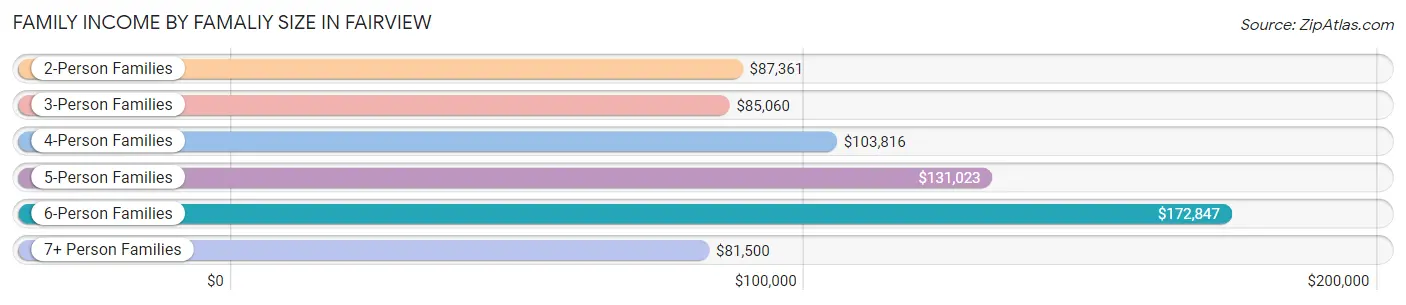
Family Income by Famaliy Size in Fairview
6-person families (31 | 1.2%) account for the highest median family income in Fairview with $172,847 per family, while 2-person families (1,166 | 45.9%) have the highest median income of $43,680 per family member.
| Income Bracket | # Families | Median Income |
| 2-Person Families | 1,166 (45.9%) | $87,361 |
| 3-Person Families | 561 (22.1%) | $85,060 |
| 4-Person Families | 508 (20.0%) | $103,816 |
| 5-Person Families | 201 (7.9%) | $131,023 |
| 6-Person Families | 31 (1.2%) | $172,847 |
| 7+ Person Families | 76 (3.0%) | $81,500 |
| Total | 2,543 (100.0%) | $93,989 |
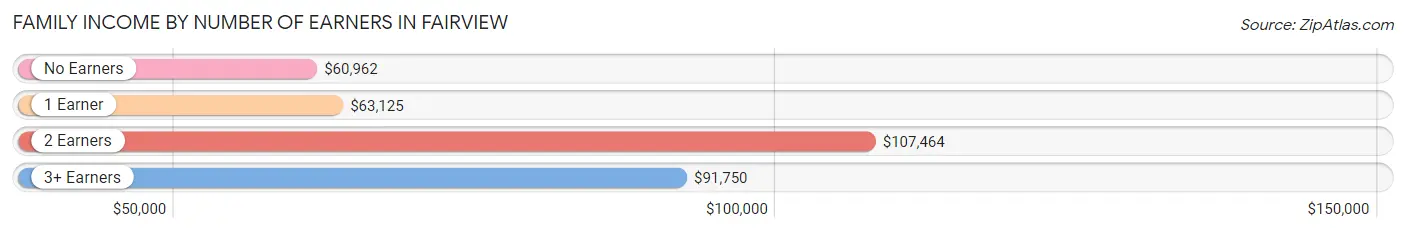
Family Income by Number of Earners in Fairview
The median family income in Fairview is $93,989, with families comprising 2 earners (1,349) having the highest median family income of $107,464, while families with no earners (250) have the lowest median family income of $60,962, accounting for 53.0% and 9.8% of families, respectively.
| Number of Earners | # Families | Median Income |
| No Earners | 250 (9.8%) | $60,962 |
| 1 Earner | 752 (29.6%) | $63,125 |
| 2 Earners | 1,349 (53.0%) | $107,464 |
| 3+ Earners | 192 (7.5%) | $91,750 |
| Total | 2,543 (100.0%) | $93,989 |
Household Income in Fairview
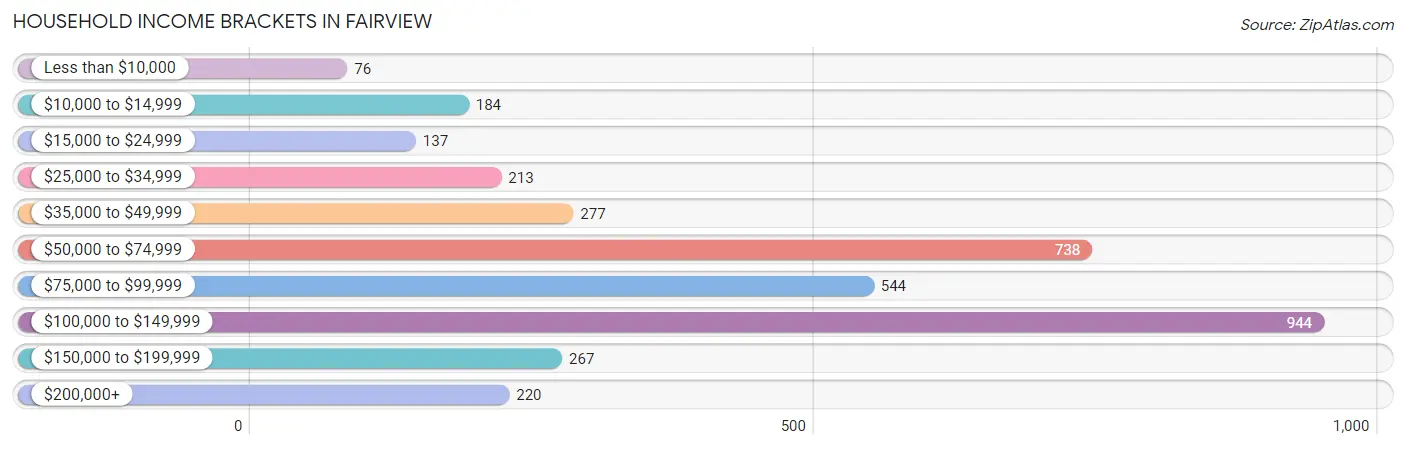
Household Income Brackets in Fairview
With 944 households falling in the category, the $100,000 to $149,999 income range is the most frequent in Fairview, accounting for 26.2% of all households. In contrast, only 76 households (2.1%) fall into the less than $10,000 income bracket, making it the least populous group.
| Income Bracket | # Households | % Households |
| Less than $10,000 | 76 | 2.1% |
| $10,000 to $14,999 | 184 | 5.1% |
| $15,000 to $24,999 | 137 | 3.8% |
| $25,000 to $34,999 | 213 | 5.9% |
| $35,000 to $49,999 | 277 | 7.7% |
| $50,000 to $74,999 | 738 | 20.5% |
| $75,000 to $99,999 | 544 | 15.1% |
| $100,000 to $149,999 | 944 | 26.2% |
| $150,000 to $199,999 | 267 | 7.4% |
| $200,000+ | 220 | 6.1% |
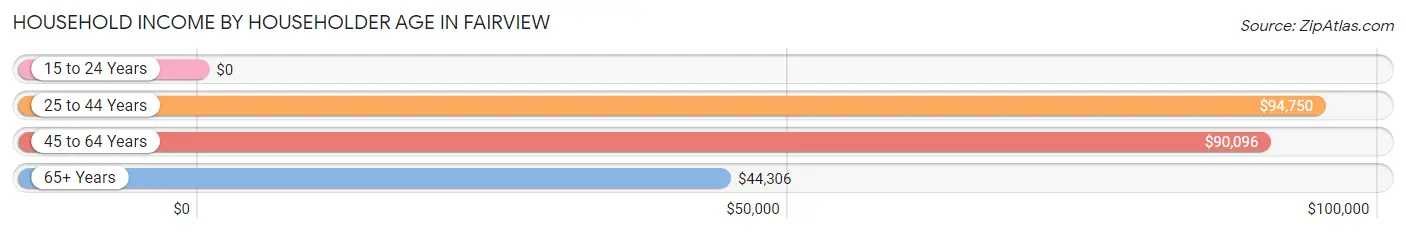
Household Income by Householder Age in Fairview
The median household income in Fairview is $82,344, with the highest median household income of $94,750 found in the 25 to 44 years age bracket for the primary householder. A total of 1,386 households (38.5%) fall into this category. Meanwhile, the 15 to 24 years age bracket for the primary householder has the lowest median household income of $0, with 92 households (2.5%) in this group.
| Income Bracket | # Households | Median Income |
| 15 to 24 Years | 92 (2.5%) | $0 |
| 25 to 44 Years | 1,386 (38.5%) | $94,750 |
| 45 to 64 Years | 1,297 (36.0%) | $90,096 |
| 65+ Years | 827 (23.0%) | $44,306 |
| Total | 3,602 (100.0%) | $82,344 |
Poverty in Fairview
Income Below Poverty by Sex and Age in Fairview
With 12.1% poverty level for males and 10.5% for females among the residents of Fairview, 5 year old males and 6 to 11 year old females are the most vulnerable to poverty, with 32 males (47.8%) and 89 females (24.3%) in their respective age groups living below the poverty level.
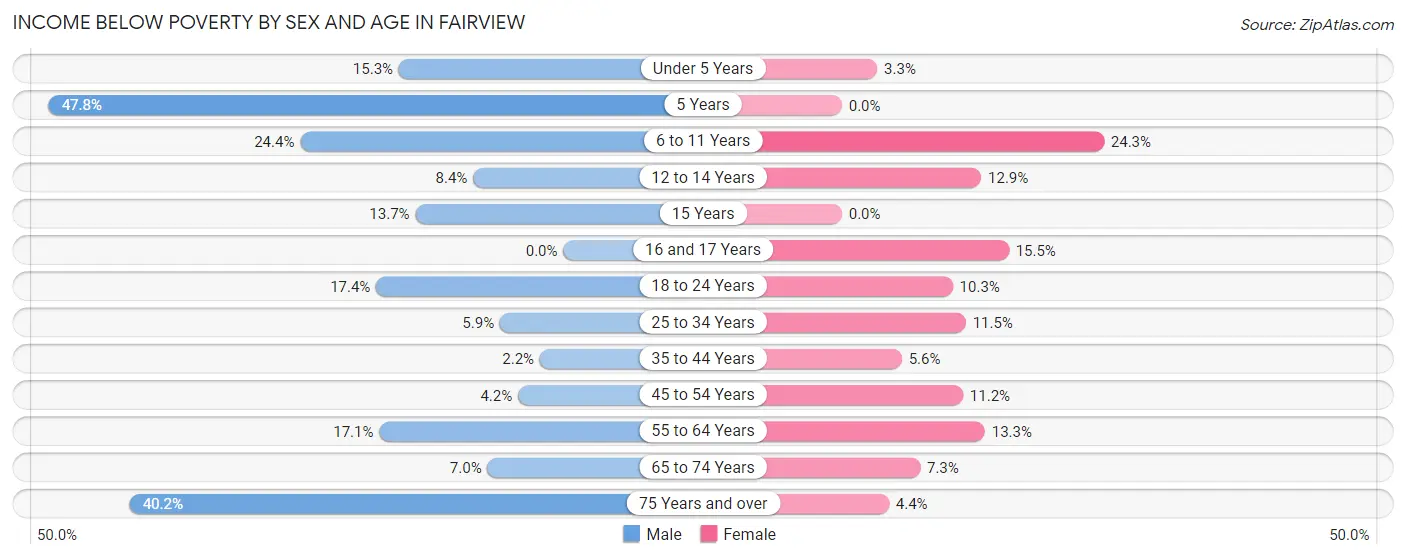
| Age Bracket | Male | Female |
| Under 5 Years | 56 (15.3%) | 9 (3.3%) |
| 5 Years | 32 (47.8%) | 0 (0.0%) |
| 6 to 11 Years | 105 (24.4%) | 89 (24.3%) |
| 12 to 14 Years | 18 (8.4%) | 15 (12.9%) |
| 15 Years | 21 (13.7%) | 0 (0.0%) |
| 16 and 17 Years | 0 (0.0%) | 33 (15.5%) |
| 18 to 24 Years | 103 (17.4%) | 46 (10.3%) |
| 25 to 34 Years | 48 (5.9%) | 62 (11.5%) |
| 35 to 44 Years | 11 (2.2%) | 42 (5.6%) |
| 45 to 54 Years | 26 (4.2%) | 59 (11.2%) |
| 55 to 64 Years | 83 (17.1%) | 86 (13.3%) |
| 65 to 74 Years | 30 (7.0%) | 27 (7.3%) |
| 75 Years and over | 66 (40.2%) | 11 (4.4%) |
| Total | 599 (12.1%) | 479 (10.5%) |
Income Above Poverty by Sex and Age in Fairview
According to the poverty statistics in Fairview, males aged 16 and 17 years and females aged 5 years are the age groups that are most secure financially, with 100.0% of males and 100.0% of females in these age groups living above the poverty line.
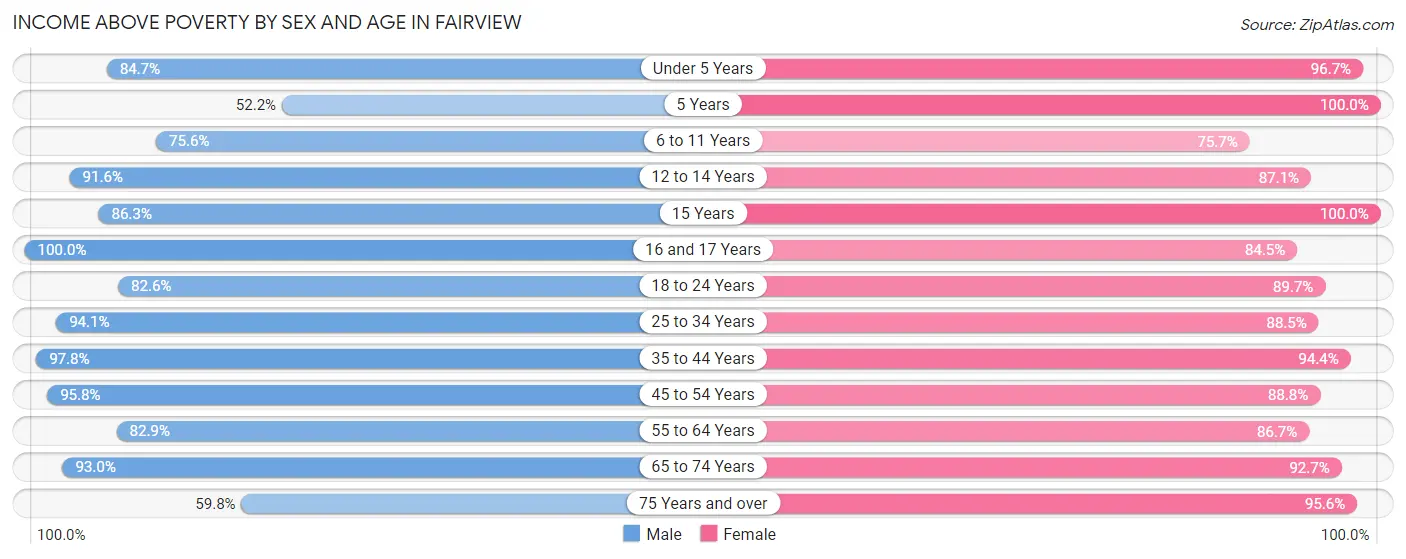
| Age Bracket | Male | Female |
| Under 5 Years | 311 (84.7%) | 265 (96.7%) |
| 5 Years | 35 (52.2%) | 24 (100.0%) |
| 6 to 11 Years | 325 (75.6%) | 277 (75.7%) |
| 12 to 14 Years | 197 (91.6%) | 101 (87.1%) |
| 15 Years | 132 (86.3%) | 49 (100.0%) |
| 16 and 17 Years | 93 (100.0%) | 180 (84.5%) |
| 18 to 24 Years | 490 (82.6%) | 401 (89.7%) |
| 25 to 34 Years | 768 (94.1%) | 477 (88.5%) |
| 35 to 44 Years | 496 (97.8%) | 714 (94.4%) |
| 45 to 54 Years | 593 (95.8%) | 466 (88.8%) |
| 55 to 64 Years | 403 (82.9%) | 562 (86.7%) |
| 65 to 74 Years | 396 (93.0%) | 345 (92.7%) |
| 75 Years and over | 98 (59.8%) | 241 (95.6%) |
| Total | 4,337 (87.9%) | 4,102 (89.5%) |
Income Below Poverty Among Married-Couple Families in Fairview
The poverty statistics for married-couple families in Fairview show that 4.8% or 97 of the total 2,031 families live below the poverty line. Families with 5 or more children have the highest poverty rate of 100.0%, comprising of 21 families. On the other hand, families with 1 or 2 children have the lowest poverty rate of 0.0%, which includes 0 families.
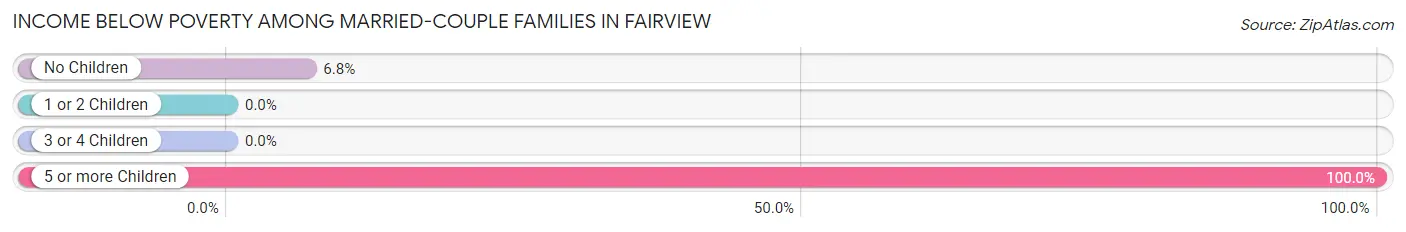
| Children | Above Poverty | Below Poverty |
| No Children | 1,038 (93.2%) | 76 (6.8%) |
| 1 or 2 Children | 762 (100.0%) | 0 (0.0%) |
| 3 or 4 Children | 134 (100.0%) | 0 (0.0%) |
| 5 or more Children | 0 (0.0%) | 21 (100.0%) |
| Total | 1,934 (95.2%) | 97 (4.8%) |
Income Below Poverty Among Single-Parent Households in Fairview
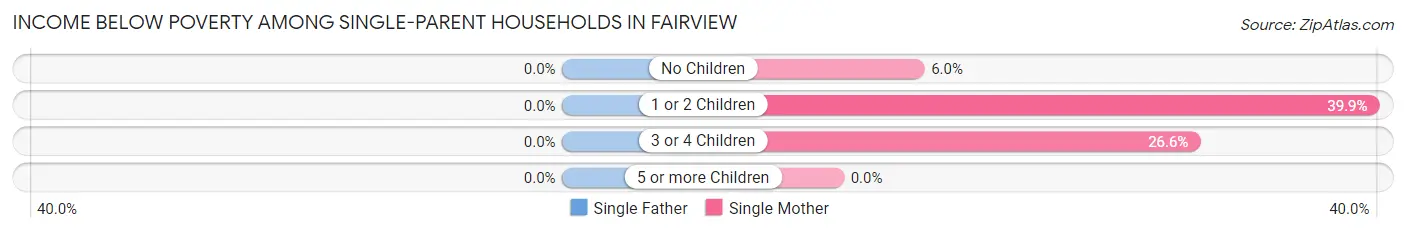
| Children | Single Father | Single Mother |
| No Children | 0 (0.0%) | 9 (6.0%) |
| 1 or 2 Children | 0 (0.0%) | 89 (39.9%) |
| 3 or 4 Children | 0 (0.0%) | 17 (26.6%) |
| 5 or more Children | 0 (0.0%) | 0 (0.0%) |
| Total | 0 (0.0%) | 115 (26.3%) |
Income Below Poverty Among Married-Couple vs Single-Parent Households in Fairview
The poverty data for Fairview shows that 97 of the married-couple family households (4.8%) and 115 of the single-parent households (22.5%) are living below the poverty level. Within the married-couple family households, those with 5 or more children have the highest poverty rate, with 21 households (100.0%) falling below the poverty line. Among the single-parent households, those with 1 or 2 children have the highest poverty rate, with 89 household (33.3%) living below poverty.
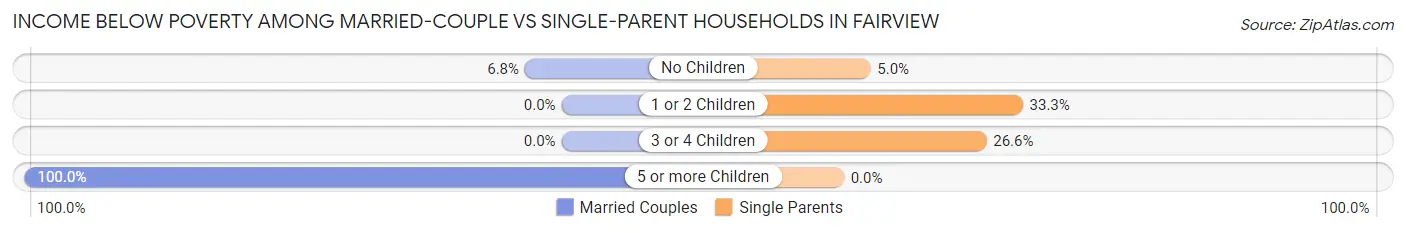
| Children | Married-Couple Families | Single-Parent Households |
| No Children | 76 (6.8%) | 9 (5.0%) |
| 1 or 2 Children | 0 (0.0%) | 89 (33.3%) |
| 3 or 4 Children | 0 (0.0%) | 17 (26.6%) |
| 5 or more Children | 21 (100.0%) | 0 (0.0%) |
| Total | 97 (4.8%) | 115 (22.5%) |
Race in Fairview
The most populous races in Fairview are White / Caucasian (8,059 | 84.7%), Hispanic or Latino (1,178 | 12.4%), and Two or more Races (776 | 8.2%).
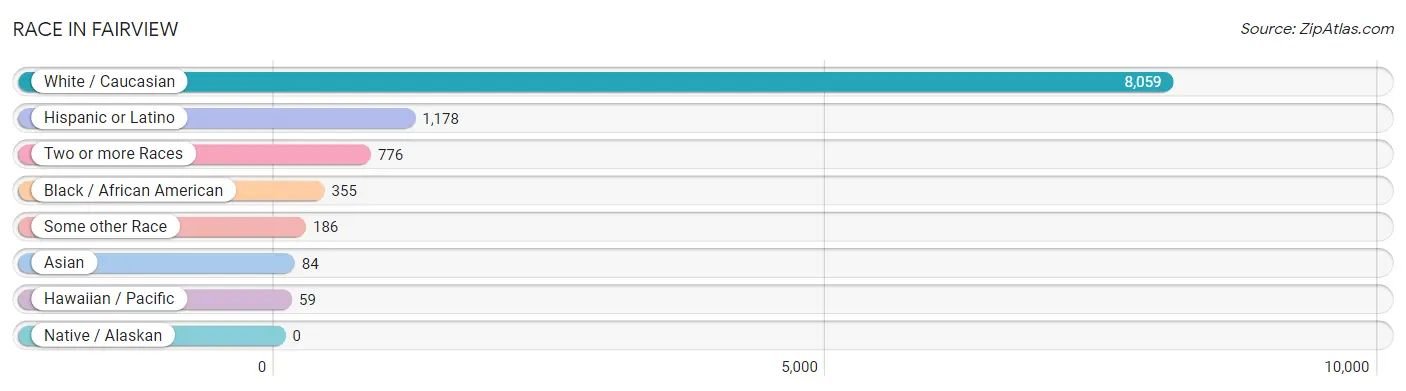
| Race | # Population | % Population |
| Asian | 84 | 0.9% |
| Black / African American | 355 | 3.7% |
| Hawaiian / Pacific | 59 | 0.6% |
| Hispanic or Latino | 1,178 | 12.4% |
| Native / Alaskan | 0 | 0.0% |
| White / Caucasian | 8,059 | 84.7% |
| Two or more Races | 776 | 8.2% |
| Some other Race | 186 | 1.9% |
| Total | 9,519 | 100.0% |
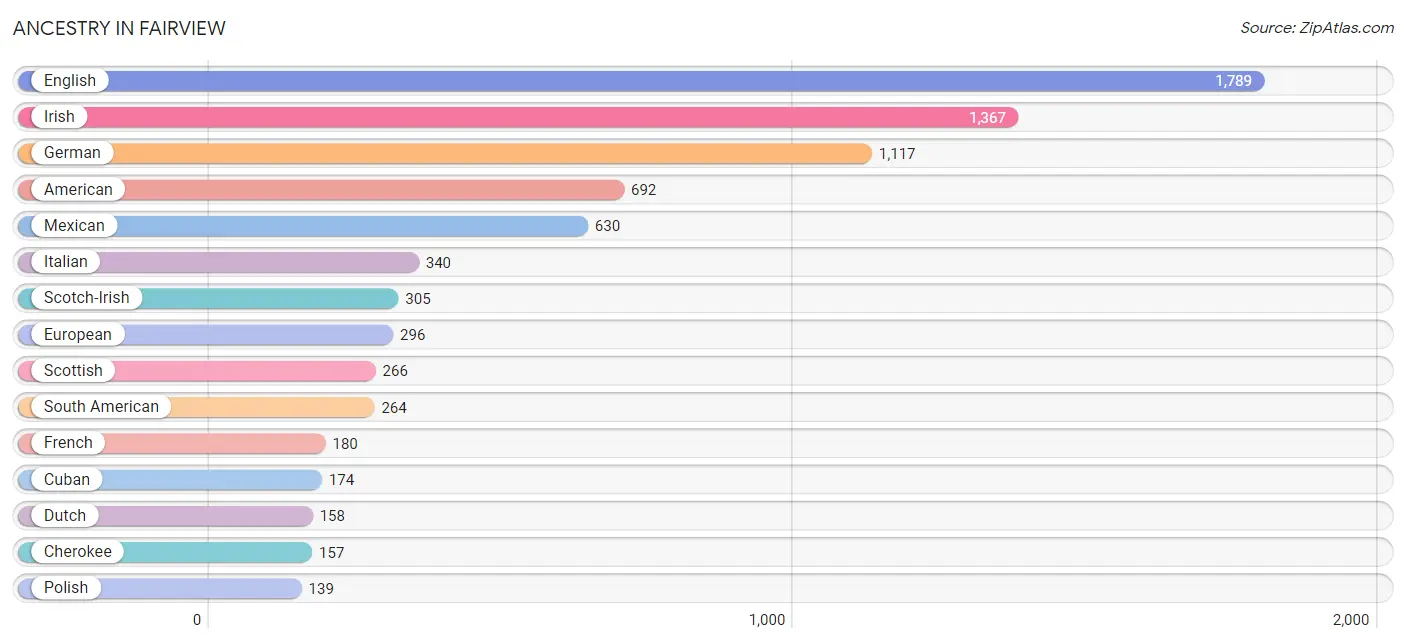
Ancestry in Fairview
The most populous ancestries reported in Fairview are English (1,789 | 18.8%), Irish (1,367 | 14.4%), German (1,117 | 11.7%), American (692 | 7.3%), and Mexican (630 | 6.6%), together accounting for 58.8% of all Fairview residents.
| Ancestry | # Population | % Population |
| American | 692 | 7.3% |
| Bhutanese | 26 | 0.3% |
| British | 112 | 1.2% |
| Canadian | 14 | 0.2% |
| Central American | 7 | 0.1% |
| Central American Indian | 6 | 0.1% |
| Cherokee | 157 | 1.7% |
| Colombian | 131 | 1.4% |
| Cuban | 174 | 1.8% |
| Czech | 19 | 0.2% |
| Dutch | 158 | 1.7% |
| Eastern European | 38 | 0.4% |
| English | 1,789 | 18.8% |
| European | 296 | 3.1% |
| Finnish | 8 | 0.1% |
| French | 180 | 1.9% |
| German | 1,117 | 11.7% |
| Greek | 48 | 0.5% |
| Guamanian / Chamorro | 24 | 0.3% |
| Honduran | 5 | 0.1% |
| Hungarian | 9 | 0.1% |
| Indian (Asian) | 16 | 0.2% |
| Irish | 1,367 | 14.4% |
| Iroquois | 2 | 0.0% |
| Italian | 340 | 3.6% |
| Jamaican | 13 | 0.1% |
| Korean | 41 | 0.4% |
| Lithuanian | 29 | 0.3% |
| Mexican | 630 | 6.6% |
| Native Hawaiian | 13 | 0.1% |
| Norwegian | 92 | 1.0% |
| Paraguayan | 85 | 0.9% |
| Pennsylvania German | 7 | 0.1% |
| Polish | 139 | 1.5% |
| Portuguese | 8 | 0.1% |
| Puerto Rican | 29 | 0.3% |
| Russian | 12 | 0.1% |
| Salvadoran | 2 | 0.0% |
| Samoan | 22 | 0.2% |
| Scandinavian | 48 | 0.5% |
| Scotch-Irish | 305 | 3.2% |
| Scottish | 266 | 2.8% |
| Sioux | 2 | 0.0% |
| South American | 264 | 2.8% |
| Spaniard | 4 | 0.0% |
| Sri Lankan | 14 | 0.2% |
| Swedish | 23 | 0.2% |
| Swiss | 36 | 0.4% |
| Thai | 16 | 0.2% |
| Venezuelan | 48 | 0.5% |
| Welsh | 38 | 0.4% | View All 51 Rows |
Immigrants in Fairview
The most numerous immigrant groups reported in Fairview came from Latin America (271 | 2.9%), Central America (150 | 1.6%), South America (121 | 1.3%), Mexico (119 | 1.3%), and Chile (71 | 0.7%), together accounting for 7.7% of all Fairview residents.
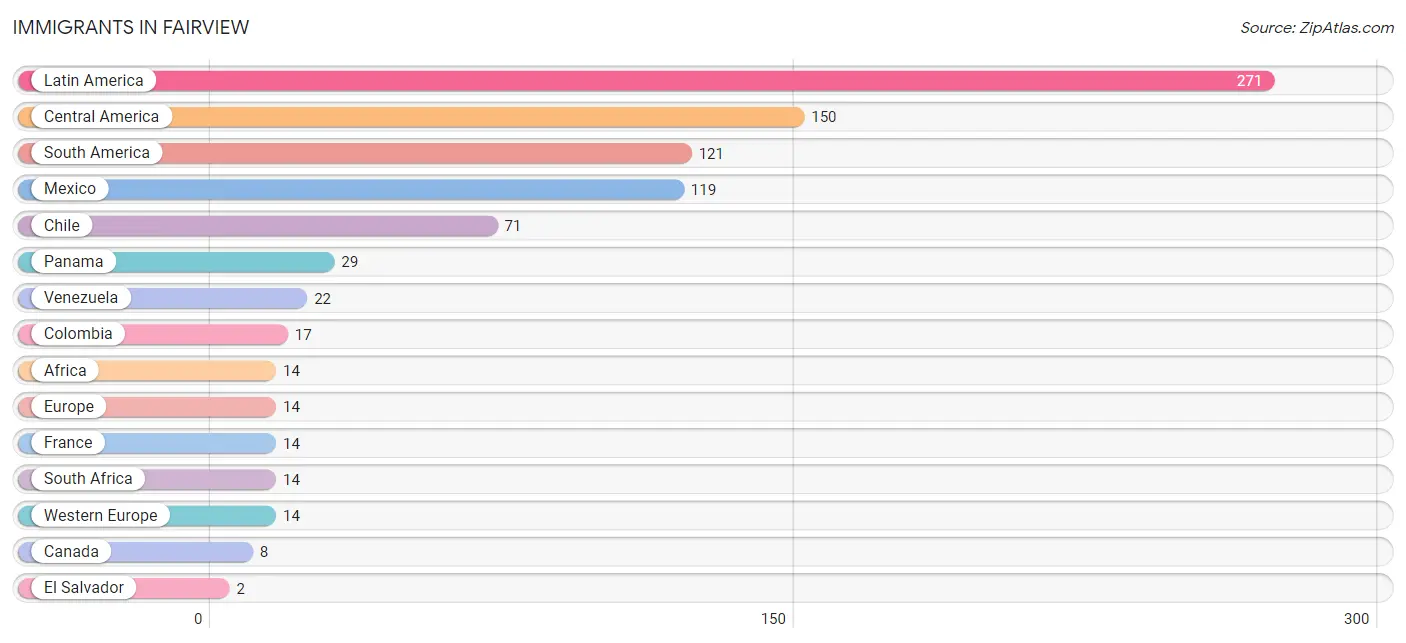
| Immigration Origin | # Population | % Population |
| Africa | 14 | 0.2% |
| Canada | 8 | 0.1% |
| Central America | 150 | 1.6% |
| Chile | 71 | 0.7% |
| Colombia | 17 | 0.2% |
| El Salvador | 2 | 0.0% |
| Europe | 14 | 0.2% |
| France | 14 | 0.2% |
| Latin America | 271 | 2.9% |
| Mexico | 119 | 1.3% |
| Panama | 29 | 0.3% |
| South Africa | 14 | 0.2% |
| South America | 121 | 1.3% |
| Venezuela | 22 | 0.2% |
| Western Europe | 14 | 0.2% | View All 15 Rows |
Sex and Age in Fairview
Sex and Age in Fairview
The most populous age groups in Fairview are 30 to 34 Years (575 | 11.7%) for men and 35 to 39 Years (403 | 8.8%) for women.
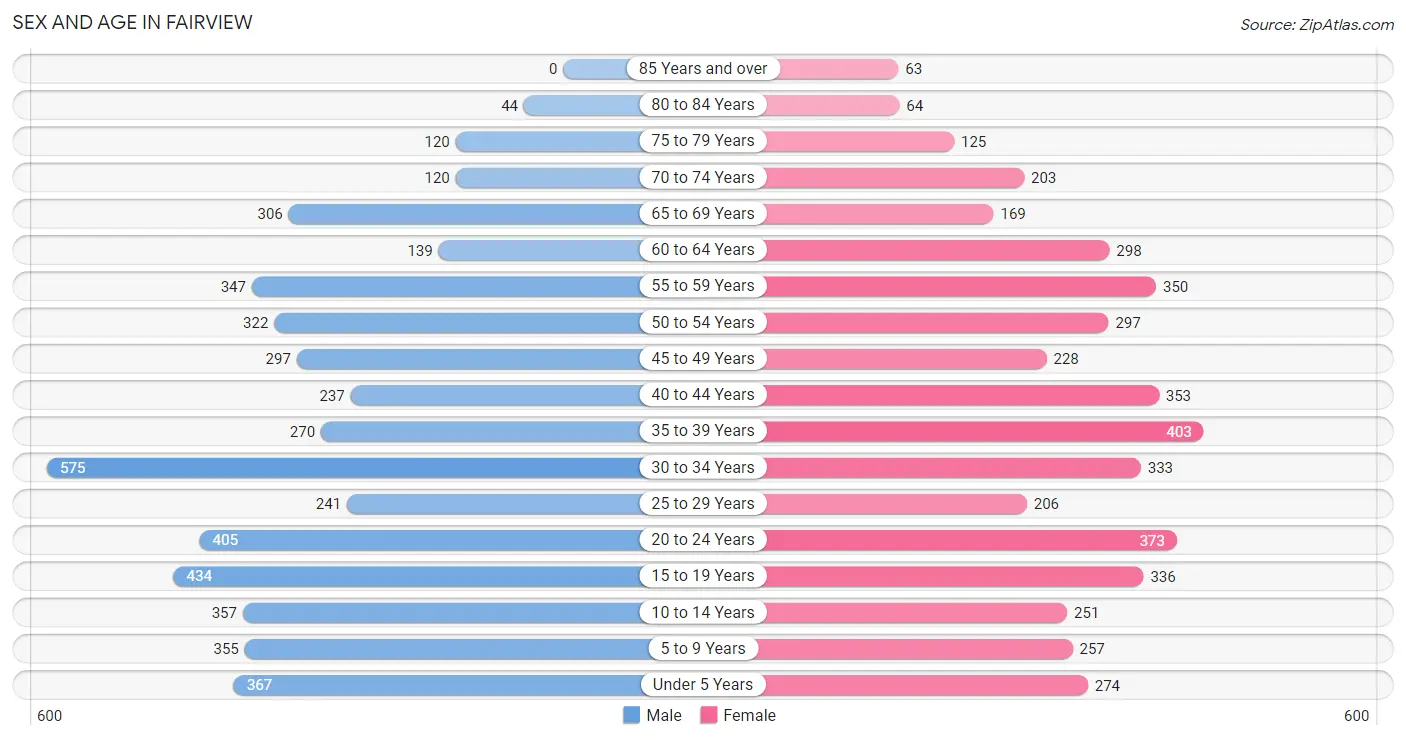
| Age Bracket | Male | Female |
| Under 5 Years | 367 (7.4%) | 274 (6.0%) |
| 5 to 9 Years | 355 (7.2%) | 257 (5.6%) |
| 10 to 14 Years | 357 (7.2%) | 251 (5.5%) |
| 15 to 19 Years | 434 (8.8%) | 336 (7.3%) |
| 20 to 24 Years | 405 (8.2%) | 373 (8.1%) |
| 25 to 29 Years | 241 (4.9%) | 206 (4.5%) |
| 30 to 34 Years | 575 (11.7%) | 333 (7.3%) |
| 35 to 39 Years | 270 (5.5%) | 403 (8.8%) |
| 40 to 44 Years | 237 (4.8%) | 353 (7.7%) |
| 45 to 49 Years | 297 (6.0%) | 228 (5.0%) |
| 50 to 54 Years | 322 (6.5%) | 297 (6.5%) |
| 55 to 59 Years | 347 (7.0%) | 350 (7.6%) |
| 60 to 64 Years | 139 (2.8%) | 298 (6.5%) |
| 65 to 69 Years | 306 (6.2%) | 169 (3.7%) |
| 70 to 74 Years | 120 (2.4%) | 203 (4.4%) |
| 75 to 79 Years | 120 (2.4%) | 125 (2.7%) |
| 80 to 84 Years | 44 (0.9%) | 64 (1.4%) |
| 85 Years and over | 0 (0.0%) | 63 (1.4%) |
| Total | 4,936 (100.0%) | 4,583 (100.0%) |
Families and Households in Fairview
Median Family Size in Fairview
The median family size in Fairview is 3.16 persons per family, with married-couple families (2,031 | 79.9%) accounting for the largest median family size of 3.18 persons per family. On the other hand, single male/father families (75 | 2.9%) represent the smallest median family size with 3.04 persons per family.
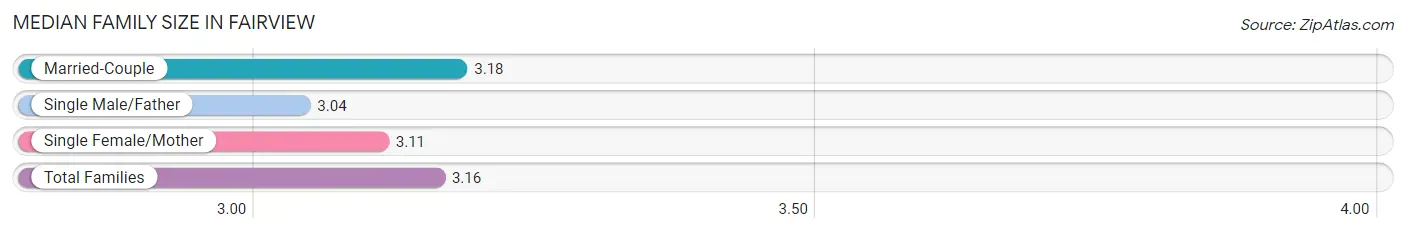
| Family Type | # Families | Family Size |
| Married-Couple | 2,031 (79.9%) | 3.18 |
| Single Male/Father | 75 (2.9%) | 3.04 |
| Single Female/Mother | 437 (17.2%) | 3.11 |
| Total Families | 2,543 (100.0%) | 3.16 |
Median Household Size in Fairview
The median household size in Fairview is 2.64 persons per household, with single male/father households (75 | 2.1%) accounting for the largest median household size of 3.55 persons per household. non-family households (1,059 | 29.4%) represent the smallest median household size with 1.24 persons per household.
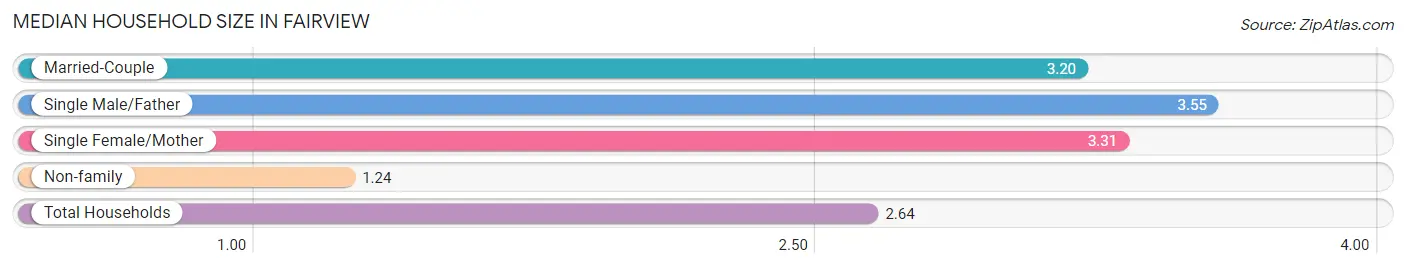
| Household Type | # Households | Household Size |
| Married-Couple | 2,031 (56.4%) | 3.20 |
| Single Male/Father | 75 (2.1%) | 3.55 |
| Single Female/Mother | 437 (12.1%) | 3.31 |
| Non-family | 1,059 (29.4%) | 1.24 |
| Total Households | 3,602 (100.0%) | 2.64 |
Household Size by Marriage Status in Fairview
Out of a total of 3,602 households in Fairview, 2,543 (70.6%) are family households, while 1,059 (29.4%) are nonfamily households. The most numerous type of family households are 2-person households, comprising 1,113, and the most common type of nonfamily households are 1-person households, comprising 813.
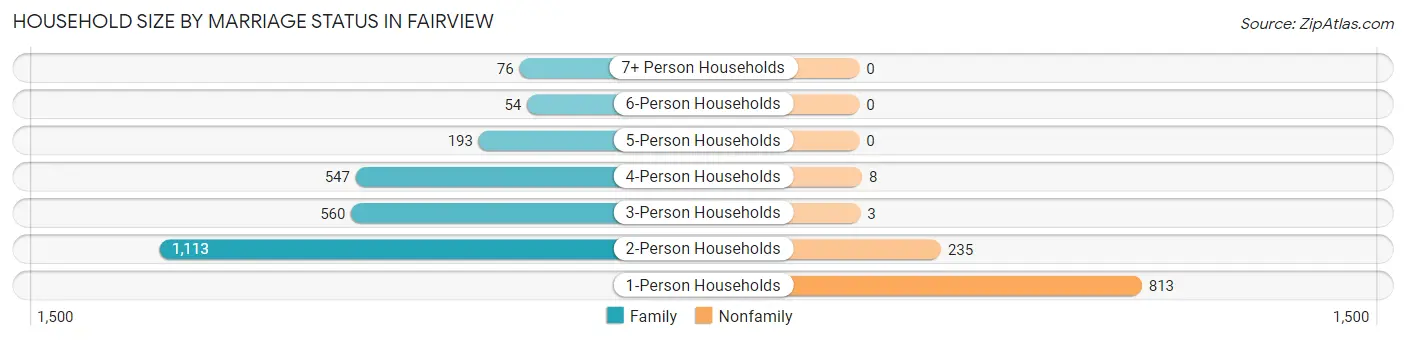
| Household Size | Family Households | Nonfamily Households |
| 1-Person Households | - | 813 (22.6%) |
| 2-Person Households | 1,113 (30.9%) | 235 (6.5%) |
| 3-Person Households | 560 (15.5%) | 3 (0.1%) |
| 4-Person Households | 547 (15.2%) | 8 (0.2%) |
| 5-Person Households | 193 (5.4%) | 0 (0.0%) |
| 6-Person Households | 54 (1.5%) | 0 (0.0%) |
| 7+ Person Households | 76 (2.1%) | 0 (0.0%) |
| Total | 2,543 (70.6%) | 1,059 (29.4%) |
Female Fertility in Fairview
Fertility by Age in Fairview
Average fertility rate in Fairview is 55.0 births per 1,000 women. Women in the age bracket of 20 to 34 years have the highest fertility rate with 112.0 births per 1,000 women. Women in the age bracket of 20 to 34 years acount for 80.9% of all women with births.
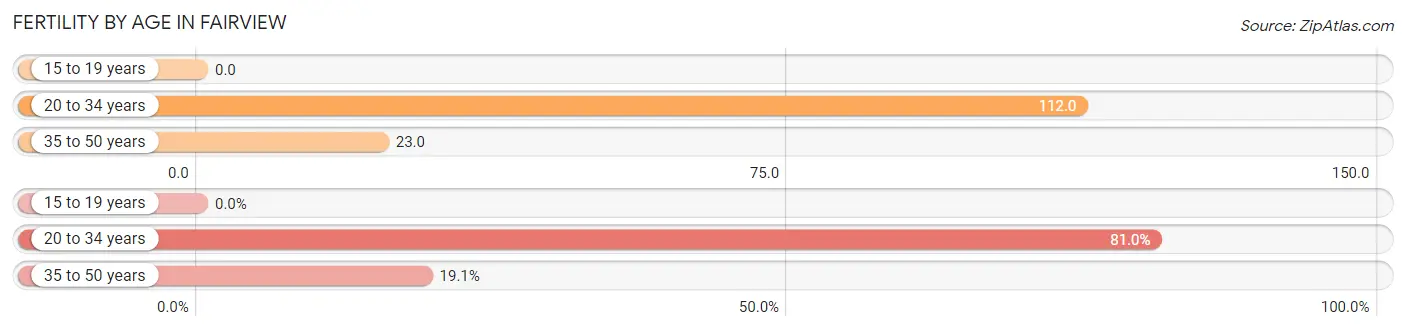
| Age Bracket | Women with Births | Births / 1,000 Women |
| 15 to 19 years | 0 (0.0%) | 0.0 |
| 20 to 34 years | 102 (80.9%) | 112.0 |
| 35 to 50 years | 24 (19.1%) | 23.0 |
| Total | 126 (100.0%) | 55.0 |
Fertility by Age by Marriage Status in Fairview
92.9% of women with births (126) in Fairview are married. The highest percentage of unmarried women with births falls into 35 to 50 years age bracket with 37.5% of them unmarried at the time of birth, while the lowest percentage of unmarried women with births belong to 20 to 34 years age bracket with 0.0% of them unmarried.
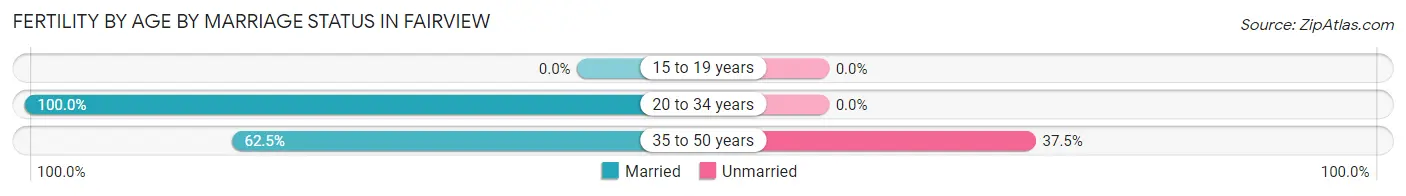
| Age Bracket | Married | Unmarried |
| 15 to 19 years | 0 (0.0%) | 0 (0.0%) |
| 20 to 34 years | 102 (100.0%) | 0 (0.0%) |
| 35 to 50 years | 15 (62.5%) | 9 (37.5%) |
| Total | 117 (92.9%) | 9 (7.1%) |
Fertility by Education in Fairview
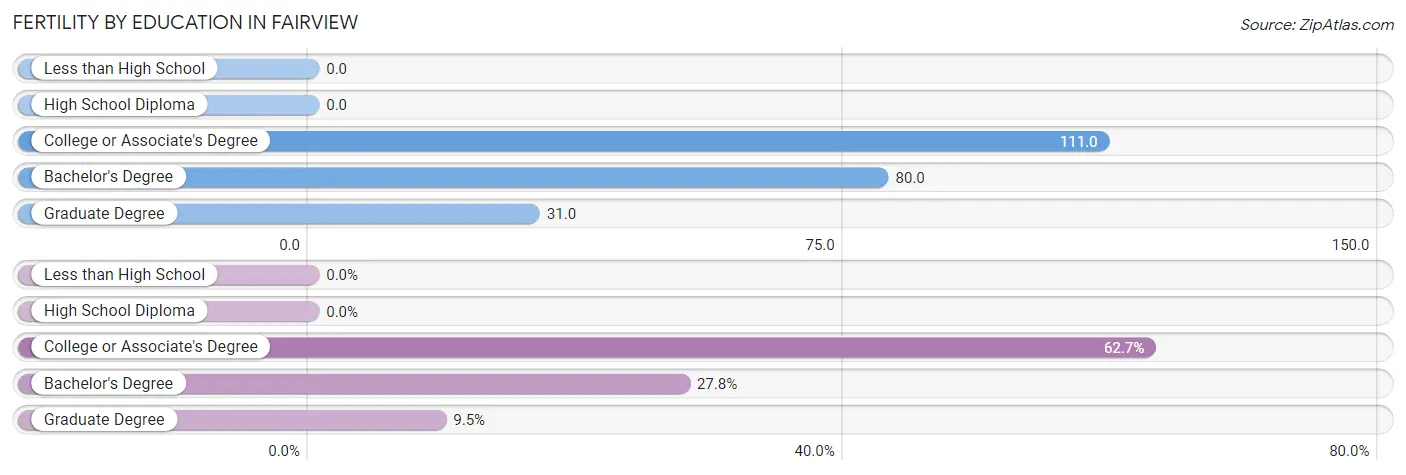
| Educational Attainment | Women with Births | Births / 1,000 Women |
| Less than High School | 0 (0.0%) | 0.0 |
| High School Diploma | 0 (0.0%) | 0.0 |
| College or Associate's Degree | 79 (62.7%) | 111.0 |
| Bachelor's Degree | 35 (27.8%) | 80.0 |
| Graduate Degree | 12 (9.5%) | 31.0 |
| Total | 126 (100.0%) | 55.0 |
Fertility by Education by Marriage Status in Fairview
7.1% of women with births in Fairview are unmarried. Women with the educational attainment of college or associate's degree are most likely to be married with 100.0% of them married at childbirth, while women with the educational attainment of bachelor's degree are least likely to be married with 25.7% of them unmarried at childbirth.
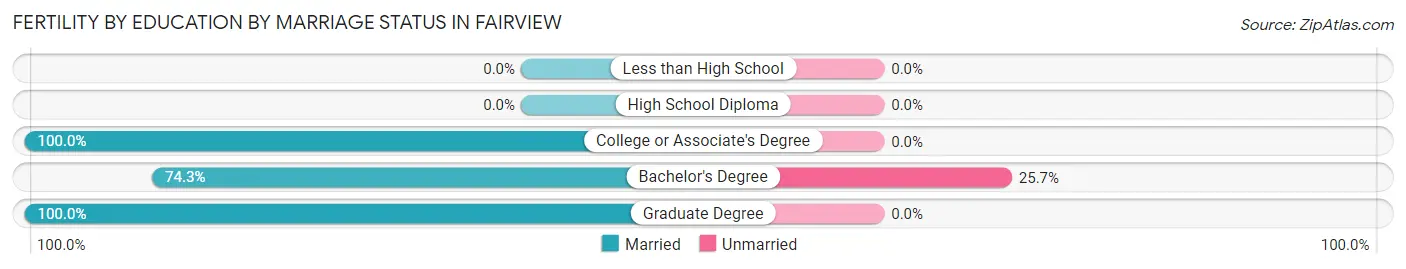
| Educational Attainment | Married | Unmarried |
| Less than High School | 0 (0.0%) | 0 (0.0%) |
| High School Diploma | 0 (0.0%) | 0 (0.0%) |
| College or Associate's Degree | 79 (100.0%) | 0 (0.0%) |
| Bachelor's Degree | 26 (74.3%) | 9 (25.7%) |
| Graduate Degree | 12 (100.0%) | 0 (0.0%) |
| Total | 117 (92.9%) | 9 (7.1%) |
Employment Characteristics in Fairview
Employment by Class of Employer in Fairview
Among the 4,940 employed individuals in Fairview, private company employees (3,452 | 69.9%), local government employees (687 | 13.9%), and self-employed (not incorporated) (273 | 5.5%) make up the most common classes of employment.
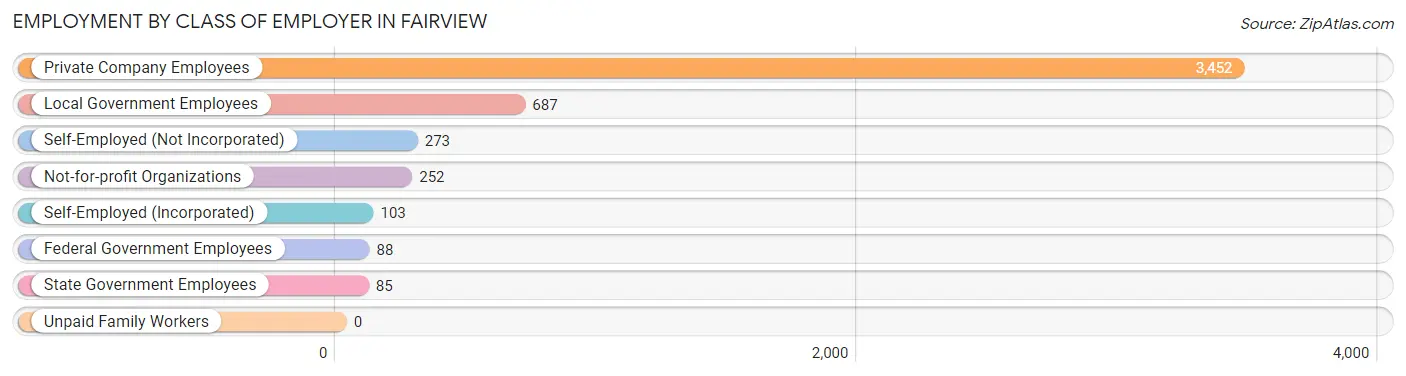
| Employer Class | # Employees | % Employees |
| Private Company Employees | 3,452 | 69.9% |
| Self-Employed (Incorporated) | 103 | 2.1% |
| Self-Employed (Not Incorporated) | 273 | 5.5% |
| Not-for-profit Organizations | 252 | 5.1% |
| Local Government Employees | 687 | 13.9% |
| State Government Employees | 85 | 1.7% |
| Federal Government Employees | 88 | 1.8% |
| Unpaid Family Workers | 0 | 0.0% |
| Total | 4,940 | 100.0% |
Employment Status by Age in Fairview
According to the labor force statistics for Fairview, out of the total population over 16 years of age (7,456), 68.1% or 5,078 individuals are in the labor force, with 2.4% or 122 of them unemployed. The age group with the highest labor force participation rate is 25 to 29 years, with 92.8% or 415 individuals in the labor force. Within the labor force, the 55 to 59 years age range has the highest percentage of unemployed individuals, with 6.7% or 38 of them being unemployed.
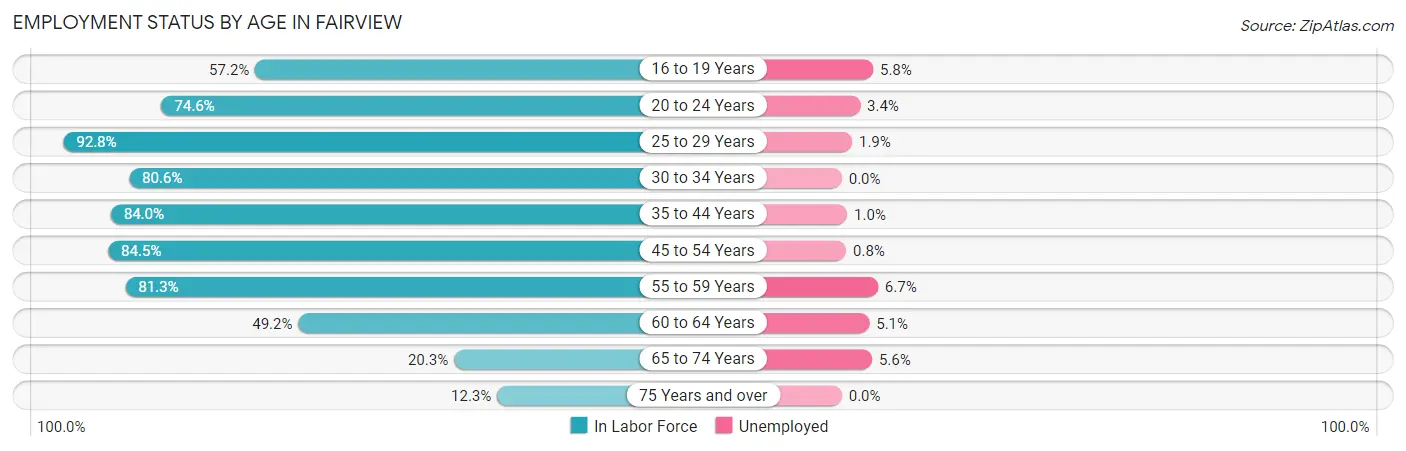
| Age Bracket | In Labor Force | Unemployed |
| 16 to 19 Years | 325 (57.2%) | 19 (5.8%) |
| 20 to 24 Years | 580 (74.6%) | 20 (3.4%) |
| 25 to 29 Years | 415 (92.8%) | 8 (1.9%) |
| 30 to 34 Years | 732 (80.6%) | 0 (0.0%) |
| 35 to 44 Years | 1,061 (84.0%) | 11 (1.0%) |
| 45 to 54 Years | 967 (84.5%) | 8 (0.8%) |
| 55 to 59 Years | 567 (81.3%) | 38 (6.7%) |
| 60 to 64 Years | 215 (49.2%) | 11 (5.1%) |
| 65 to 74 Years | 162 (20.3%) | 9 (5.6%) |
| 75 Years and over | 51 (12.3%) | 0 (0.0%) |
| Total | 5,078 (68.1%) | 122 (2.4%) |
Employment Status by Educational Attainment in Fairview
According to labor force statistics for Fairview, 80.8% of individuals (3,956) out of the total population between 25 and 64 years of age (4,896) are in the labor force, with 1.9% or 75 of them being unemployed. The group with the highest labor force participation rate are those with the educational attainment of bachelor's degree or higher, with 89.0% or 1,637 individuals in the labor force. Within the labor force, individuals with less than high school education have the highest percentage of unemployment, with 8.2% or 9 of them being unemployed.
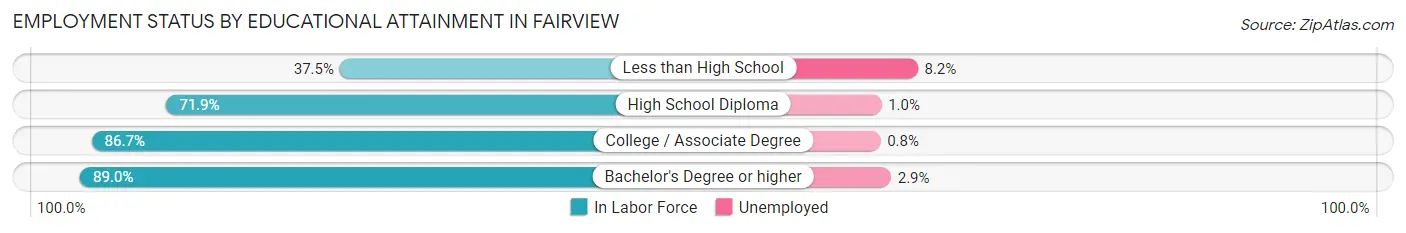
| Educational Attainment | In Labor Force | Unemployed |
| Less than High School | 110 (37.5%) | 24 (8.2%) |
| High School Diploma | 905 (71.9%) | 13 (1.0%) |
| College / Associate Degree | 1,306 (86.7%) | 12 (0.8%) |
| Bachelor's Degree or higher | 1,637 (89.0%) | 53 (2.9%) |
| Total | 3,956 (80.8%) | 93 (1.9%) |
Employment Occupations by Sex in Fairview
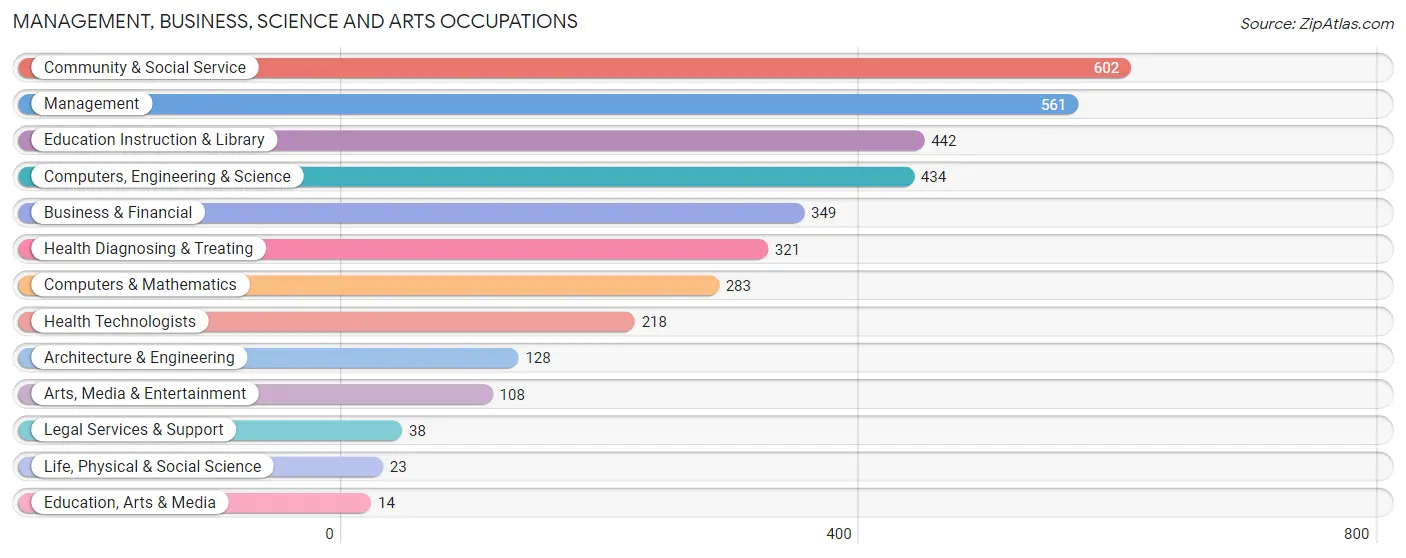
Management, Business, Science and Arts Occupations
The most common Management, Business, Science and Arts occupations in Fairview are Community & Social Service (602 | 12.2%), Management (561 | 11.4%), Education Instruction & Library (442 | 9.0%), Computers, Engineering & Science (434 | 8.8%), and Business & Financial (349 | 7.1%).
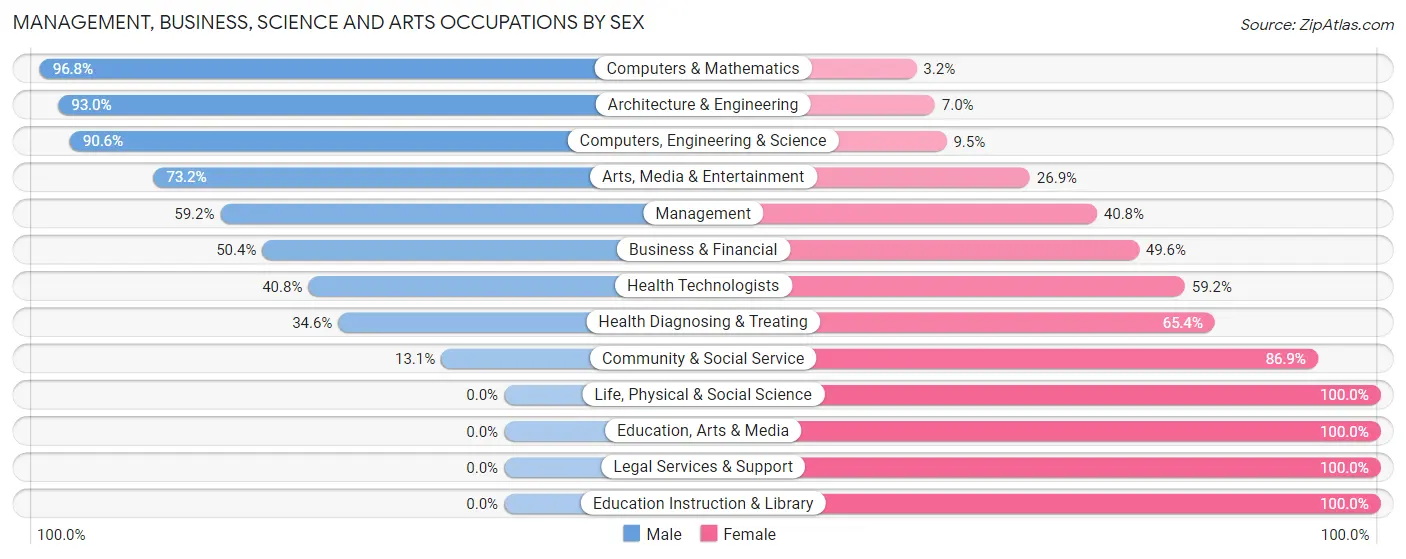
Management, Business, Science and Arts Occupations by Sex
Within the Management, Business, Science and Arts occupations in Fairview, the most male-oriented occupations are Computers & Mathematics (96.8%), Architecture & Engineering (93.0%), and Computers, Engineering & Science (90.5%), while the most female-oriented occupations are Life, Physical & Social Science (100.0%), Education, Arts & Media (100.0%), and Legal Services & Support (100.0%).
| Occupation | Male | Female |
| Management | 332 (59.2%) | 229 (40.8%) |
| Business & Financial | 176 (50.4%) | 173 (49.6%) |
| Computers, Engineering & Science | 393 (90.5%) | 41 (9.5%) |
| Computers & Mathematics | 274 (96.8%) | 9 (3.2%) |
| Architecture & Engineering | 119 (93.0%) | 9 (7.0%) |
| Life, Physical & Social Science | 0 (0.0%) | 23 (100.0%) |
| Community & Social Service | 79 (13.1%) | 523 (86.9%) |
| Education, Arts & Media | 0 (0.0%) | 14 (100.0%) |
| Legal Services & Support | 0 (0.0%) | 38 (100.0%) |
| Education Instruction & Library | 0 (0.0%) | 442 (100.0%) |
| Arts, Media & Entertainment | 79 (73.2%) | 29 (26.9%) |
| Health Diagnosing & Treating | 111 (34.6%) | 210 (65.4%) |
| Health Technologists | 89 (40.8%) | 129 (59.2%) |
| Total (Category) | 1,091 (48.1%) | 1,176 (51.9%) |
| Total (Overall) | 2,545 (51.7%) | 2,381 (48.3%) |
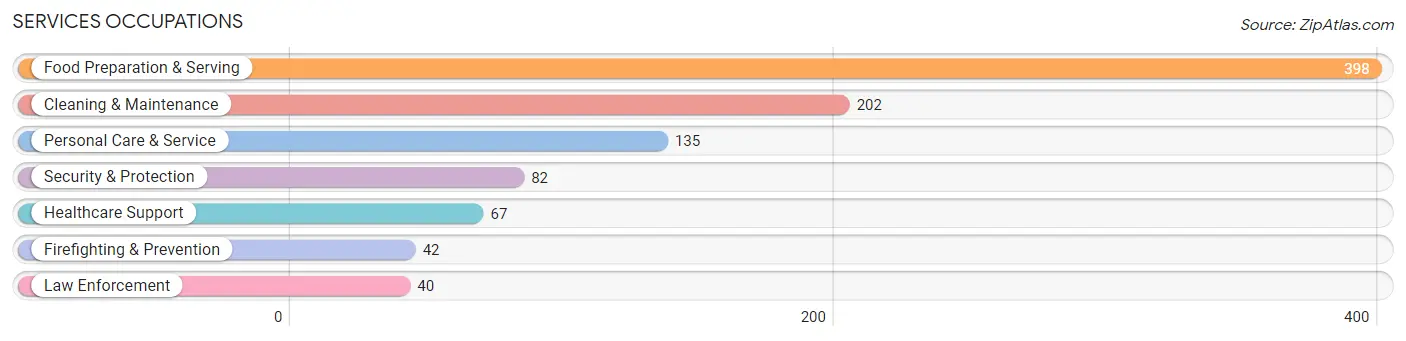
Services Occupations
The most common Services occupations in Fairview are Food Preparation & Serving (398 | 8.1%), Cleaning & Maintenance (202 | 4.1%), Personal Care & Service (135 | 2.7%), Security & Protection (82 | 1.7%), and Healthcare Support (67 | 1.4%).
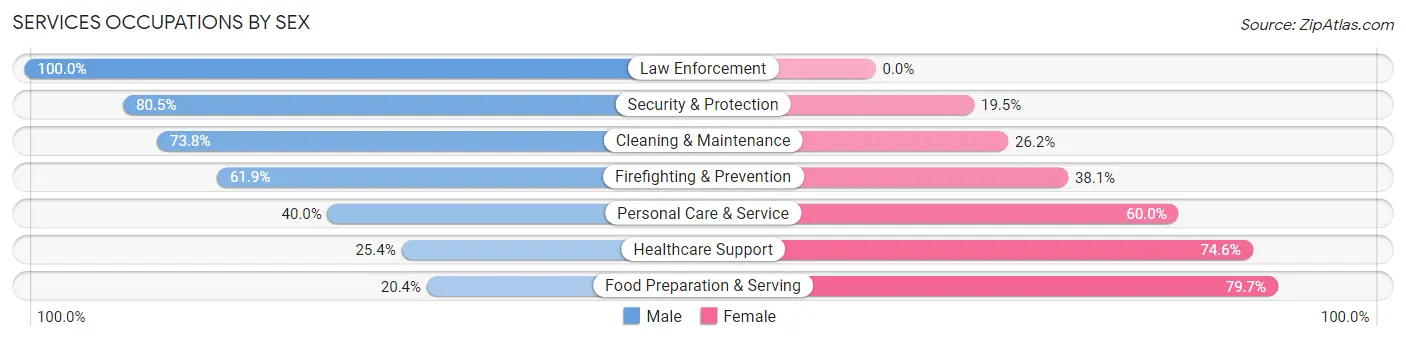
Services Occupations by Sex
Within the Services occupations in Fairview, the most male-oriented occupations are Law Enforcement (100.0%), Security & Protection (80.5%), and Cleaning & Maintenance (73.8%), while the most female-oriented occupations are Food Preparation & Serving (79.6%), Healthcare Support (74.6%), and Personal Care & Service (60.0%).
| Occupation | Male | Female |
| Healthcare Support | 17 (25.4%) | 50 (74.6%) |
| Security & Protection | 66 (80.5%) | 16 (19.5%) |
| Firefighting & Prevention | 26 (61.9%) | 16 (38.1%) |
| Law Enforcement | 40 (100.0%) | 0 (0.0%) |
| Food Preparation & Serving | 81 (20.3%) | 317 (79.6%) |
| Cleaning & Maintenance | 149 (73.8%) | 53 (26.2%) |
| Personal Care & Service | 54 (40.0%) | 81 (60.0%) |
| Total (Category) | 367 (41.5%) | 517 (58.5%) |
| Total (Overall) | 2,545 (51.7%) | 2,381 (48.3%) |
Sales and Office Occupations
The most common Sales and Office occupations in Fairview are Sales & Related (656 | 13.3%), and Office & Administration (485 | 9.9%).
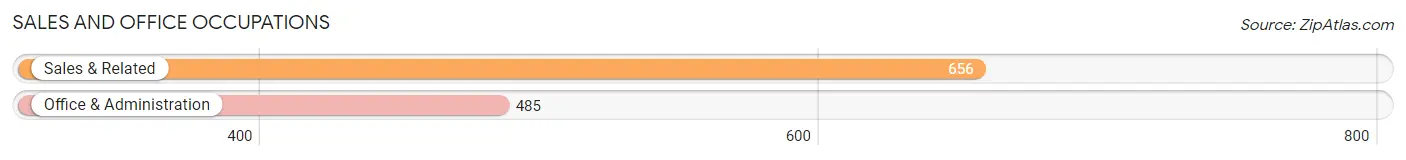
Sales and Office Occupations by Sex

| Occupation | Male | Female |
| Sales & Related | 425 (64.8%) | 231 (35.2%) |
| Office & Administration | 76 (15.7%) | 409 (84.3%) |
| Total (Category) | 501 (43.9%) | 640 (56.1%) |
| Total (Overall) | 2,545 (51.7%) | 2,381 (48.3%) |
Natural Resources, Construction and Maintenance Occupations
The most common Natural Resources, Construction and Maintenance occupations in Fairview are Installation, Maintenance & Repair (175 | 3.5%), and Construction & Extraction (136 | 2.8%).
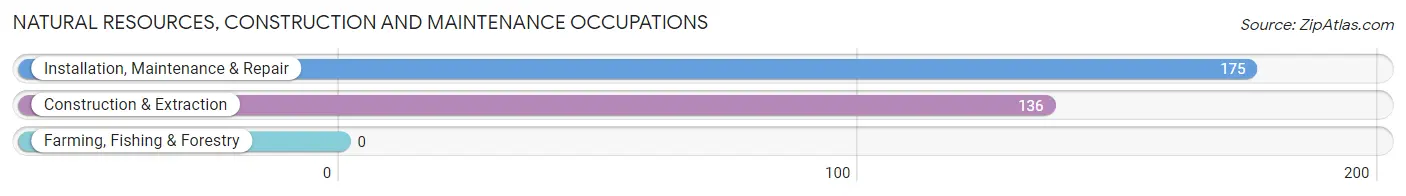
Natural Resources, Construction and Maintenance Occupations by Sex
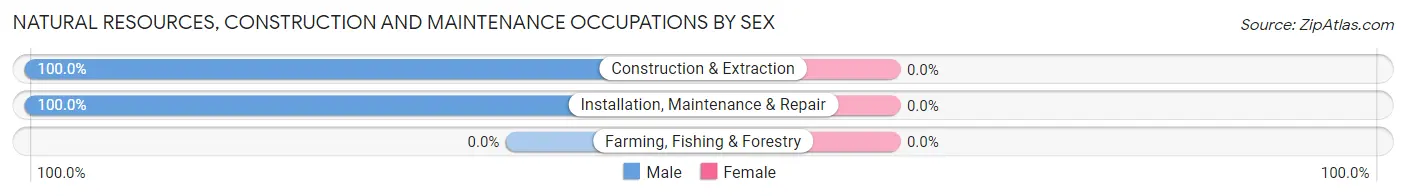
| Occupation | Male | Female |
| Farming, Fishing & Forestry | 0 (0.0%) | 0 (0.0%) |
| Construction & Extraction | 136 (100.0%) | 0 (0.0%) |
| Installation, Maintenance & Repair | 175 (100.0%) | 0 (0.0%) |
| Total (Category) | 311 (100.0%) | 0 (0.0%) |
| Total (Overall) | 2,545 (51.7%) | 2,381 (48.3%) |
Production, Transportation and Moving Occupations
The most common Production, Transportation and Moving occupations in Fairview are Production (159 | 3.2%), Material Moving (101 | 2.1%), and Transportation (63 | 1.3%).
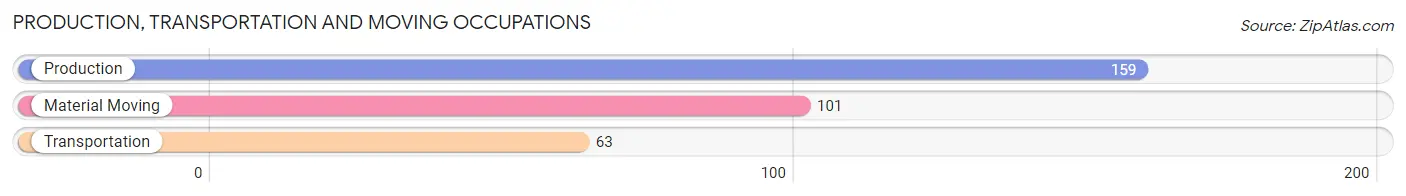
Production, Transportation and Moving Occupations by Sex
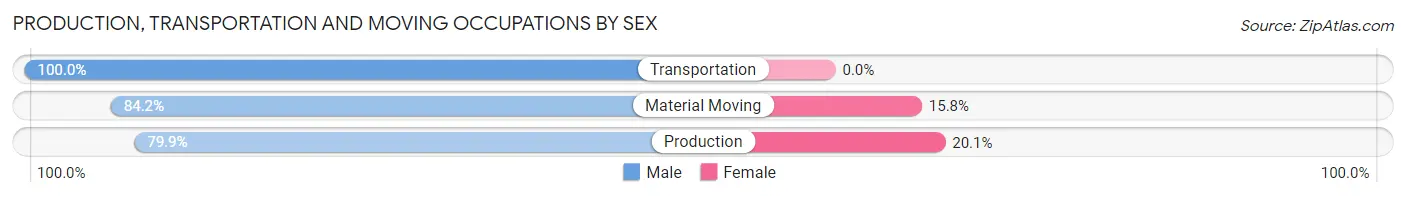
| Occupation | Male | Female |
| Production | 127 (79.9%) | 32 (20.1%) |
| Transportation | 63 (100.0%) | 0 (0.0%) |
| Material Moving | 85 (84.2%) | 16 (15.8%) |
| Total (Category) | 275 (85.1%) | 48 (14.9%) |
| Total (Overall) | 2,545 (51.7%) | 2,381 (48.3%) |
Employment Industries by Sex in Fairview
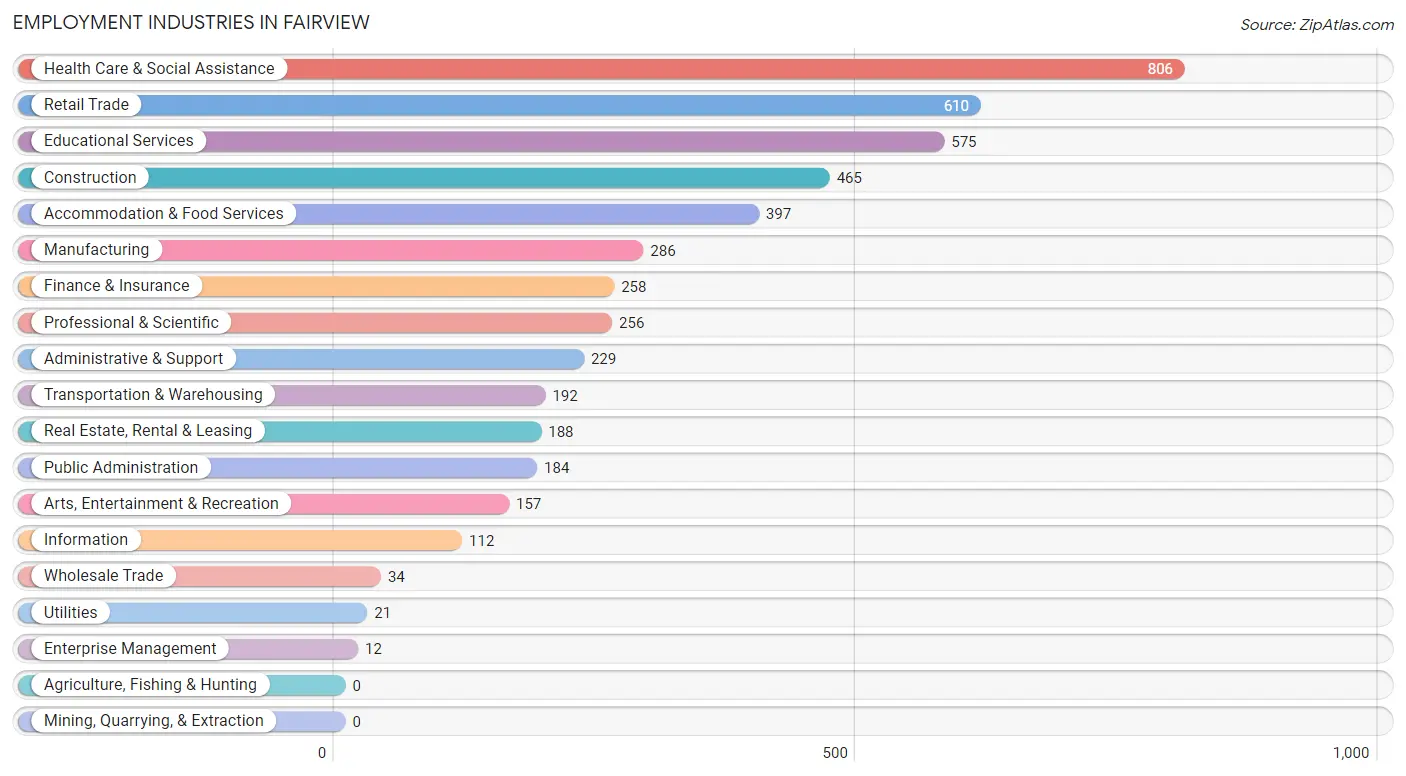
Employment Industries in Fairview
The major employment industries in Fairview include Health Care & Social Assistance (806 | 16.4%), Retail Trade (610 | 12.4%), Educational Services (575 | 11.7%), Construction (465 | 9.4%), and Accommodation & Food Services (397 | 8.1%).
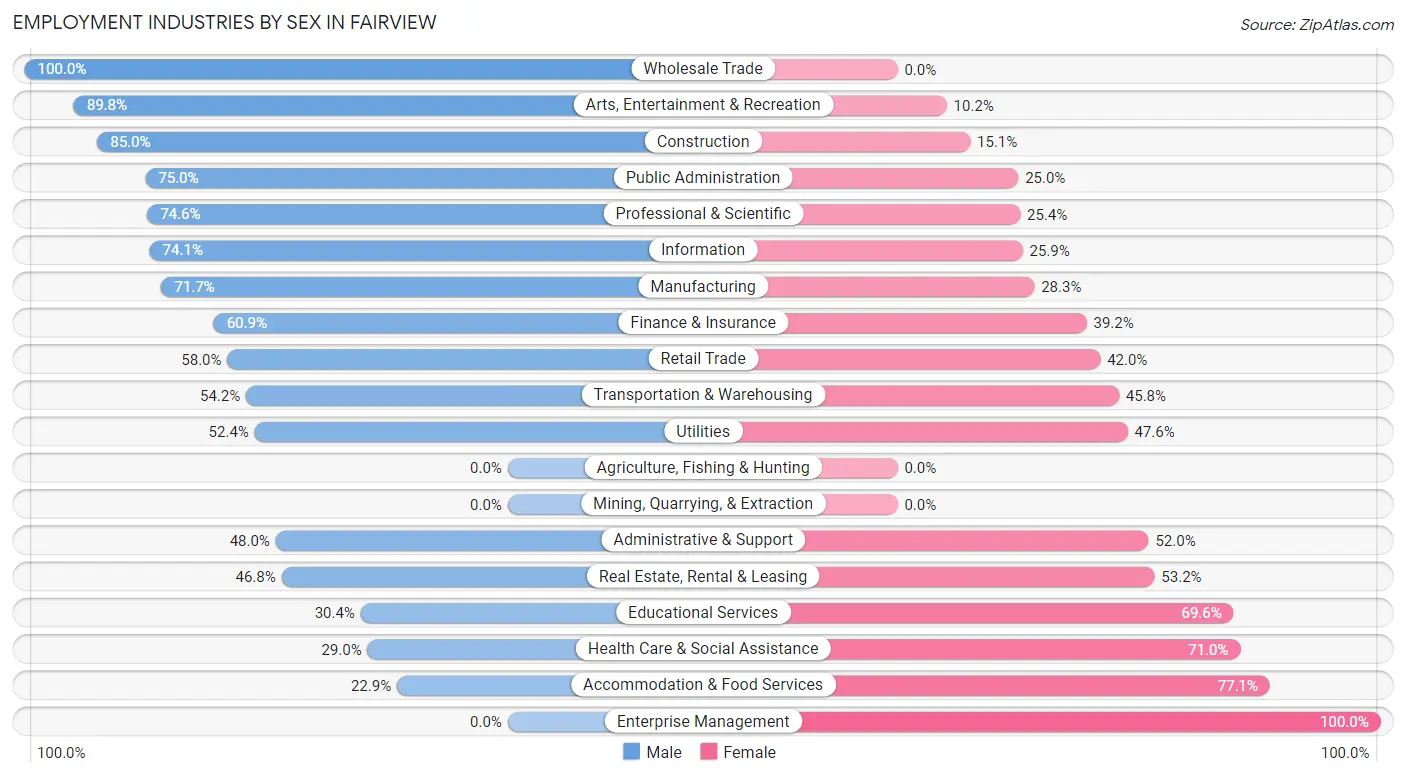
Employment Industries by Sex in Fairview
The Fairview industries that see more men than women are Wholesale Trade (100.0%), Arts, Entertainment & Recreation (89.8%), and Construction (85.0%), whereas the industries that tend to have a higher number of women are Enterprise Management (100.0%), Accommodation & Food Services (77.1%), and Health Care & Social Assistance (71.0%).
| Industry | Male | Female |
| Agriculture, Fishing & Hunting | 0 (0.0%) | 0 (0.0%) |
| Mining, Quarrying, & Extraction | 0 (0.0%) | 0 (0.0%) |
| Construction | 395 (85.0%) | 70 (15.0%) |
| Manufacturing | 205 (71.7%) | 81 (28.3%) |
| Wholesale Trade | 34 (100.0%) | 0 (0.0%) |
| Retail Trade | 354 (58.0%) | 256 (42.0%) |
| Transportation & Warehousing | 104 (54.2%) | 88 (45.8%) |
| Utilities | 11 (52.4%) | 10 (47.6%) |
| Information | 83 (74.1%) | 29 (25.9%) |
| Finance & Insurance | 157 (60.9%) | 101 (39.2%) |
| Real Estate, Rental & Leasing | 88 (46.8%) | 100 (53.2%) |
| Professional & Scientific | 191 (74.6%) | 65 (25.4%) |
| Enterprise Management | 0 (0.0%) | 12 (100.0%) |
| Administrative & Support | 110 (48.0%) | 119 (52.0%) |
| Educational Services | 175 (30.4%) | 400 (69.6%) |
| Health Care & Social Assistance | 234 (29.0%) | 572 (71.0%) |
| Arts, Entertainment & Recreation | 141 (89.8%) | 16 (10.2%) |
| Accommodation & Food Services | 91 (22.9%) | 306 (77.1%) |
| Public Administration | 138 (75.0%) | 46 (25.0%) |
| Total | 2,545 (51.7%) | 2,381 (48.3%) |
Education in Fairview
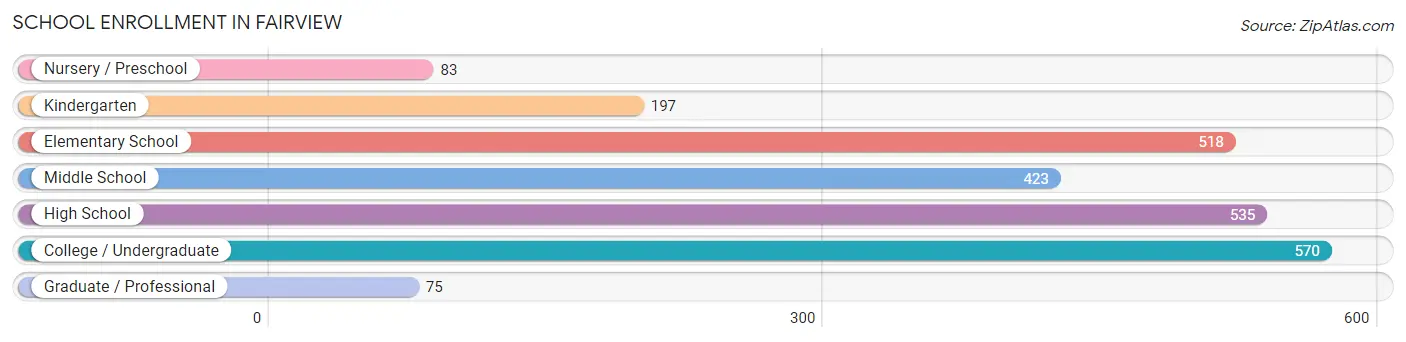
School Enrollment in Fairview
The most common levels of schooling among the 2,401 students in Fairview are college / undergraduate (570 | 23.7%), high school (535 | 22.3%), and elementary school (518 | 21.6%).
| School Level | # Students | % Students |
| Nursery / Preschool | 83 | 3.5% |
| Kindergarten | 197 | 8.2% |
| Elementary School | 518 | 21.6% |
| Middle School | 423 | 17.6% |
| High School | 535 | 22.3% |
| College / Undergraduate | 570 | 23.7% |
| Graduate / Professional | 75 | 3.1% |
| Total | 2,401 | 100.0% |
School Enrollment by Age by Funding Source in Fairview
Out of a total of 2,401 students who are enrolled in schools in Fairview, 375 (15.6%) attend a private institution, while the remaining 2,026 (84.4%) are enrolled in public schools. The age group of 3 to 4 year olds has the highest likelihood of being enrolled in private schools, with 48 (46.2% in the age bracket) enrolled. Conversely, the age group of 18 to 19 year olds has the lowest likelihood of being enrolled in a private school, with 152 (100.0% in the age bracket) attending a public institution.
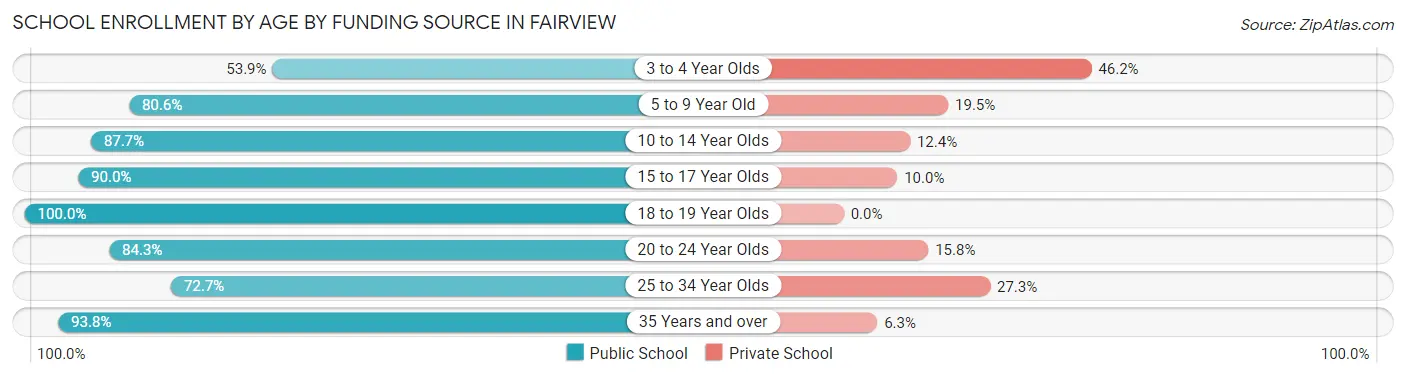
| Age Bracket | Public School | Private School |
| 3 to 4 Year Olds | 56 (53.8%) | 48 (46.2%) |
| 5 to 9 Year Old | 472 (80.5%) | 114 (19.5%) |
| 10 to 14 Year Olds | 511 (87.6%) | 72 (12.3%) |
| 15 to 17 Year Olds | 388 (90.0%) | 43 (10.0%) |
| 18 to 19 Year Olds | 152 (100.0%) | 0 (0.0%) |
| 20 to 24 Year Olds | 230 (84.3%) | 43 (15.8%) |
| 25 to 34 Year Olds | 128 (72.7%) | 48 (27.3%) |
| 35 Years and over | 90 (93.8%) | 6 (6.2%) |
| Total | 2,026 (84.4%) | 375 (15.6%) |
Educational Attainment by Field of Study in Fairview
Business (502 | 22.0%), education (331 | 14.5%), science & technology (274 | 12.0%), communications (175 | 7.7%), and arts & humanities (158 | 6.9%) are the most common fields of study among 2,280 individuals in Fairview who have obtained a bachelor's degree or higher.
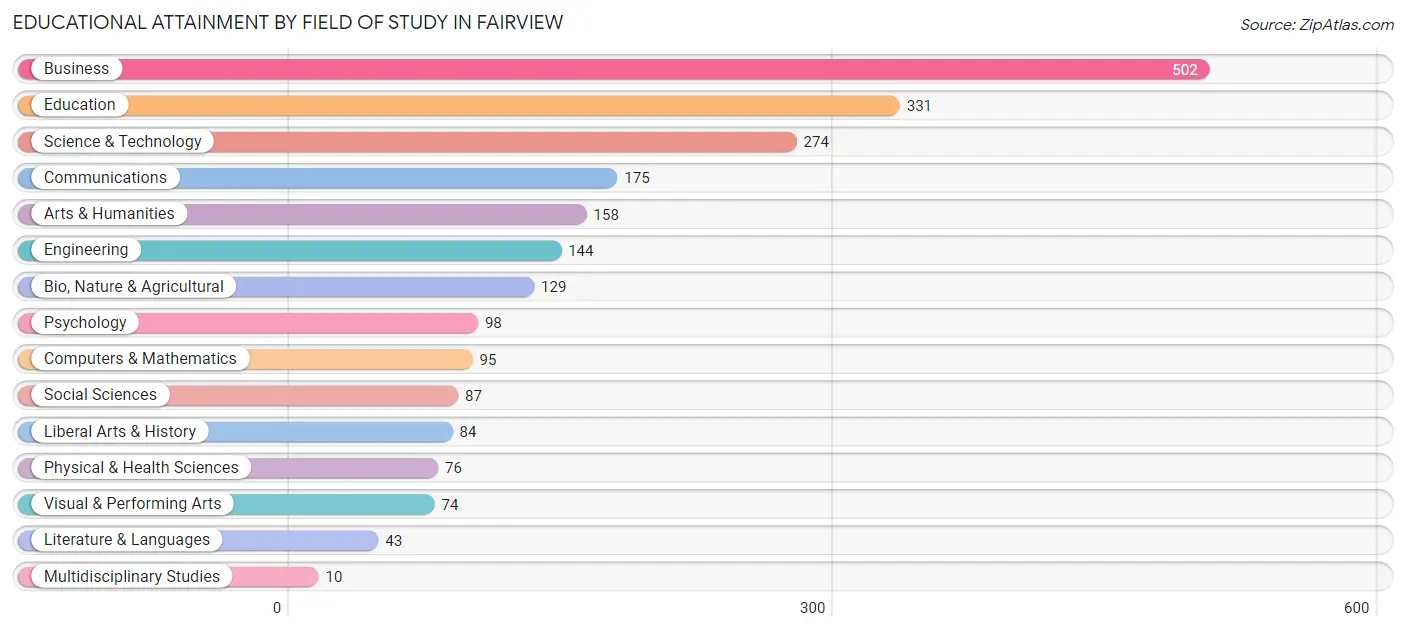
| Field of Study | # Graduates | % Graduates |
| Computers & Mathematics | 95 | 4.2% |
| Bio, Nature & Agricultural | 129 | 5.7% |
| Physical & Health Sciences | 76 | 3.3% |
| Psychology | 98 | 4.3% |
| Social Sciences | 87 | 3.8% |
| Engineering | 144 | 6.3% |
| Multidisciplinary Studies | 10 | 0.4% |
| Science & Technology | 274 | 12.0% |
| Business | 502 | 22.0% |
| Education | 331 | 14.5% |
| Literature & Languages | 43 | 1.9% |
| Liberal Arts & History | 84 | 3.7% |
| Visual & Performing Arts | 74 | 3.3% |
| Communications | 175 | 7.7% |
| Arts & Humanities | 158 | 6.9% |
| Total | 2,280 | 100.0% |
Transportation & Commute in Fairview
Vehicle Availability by Sex in Fairview
The most prevalent vehicle ownership categories in Fairview are males with 2 vehicles (1,169, accounting for 45.5%) and females with 2 vehicles (782, making up 49.3%).
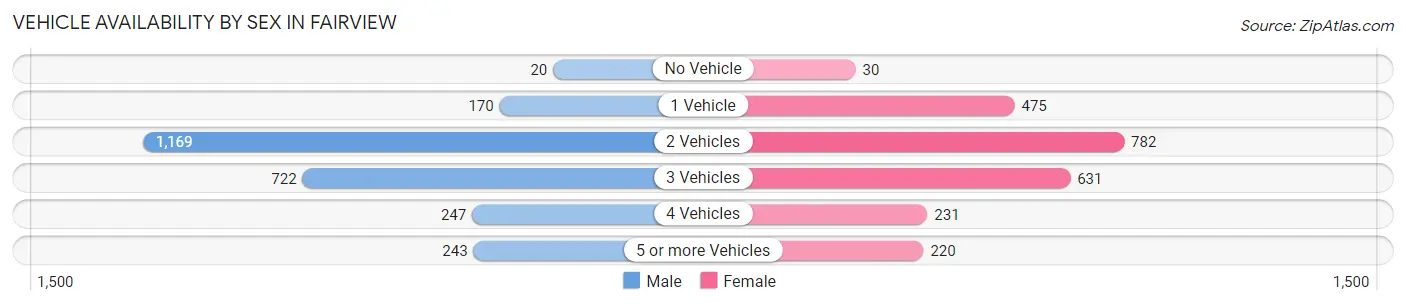
| Vehicles Available | Male | Female |
| No Vehicle | 20 (0.8%) | 30 (1.3%) |
| 1 Vehicle | 170 (6.6%) | 475 (20.1%) |
| 2 Vehicles | 1,169 (45.5%) | 782 (33.0%) |
| 3 Vehicles | 722 (28.1%) | 631 (26.6%) |
| 4 Vehicles | 247 (9.6%) | 231 (9.8%) |
| 5 or more Vehicles | 243 (9.5%) | 220 (9.3%) |
| Total | 2,571 (100.0%) | 2,369 (100.0%) |
Commute Time in Fairview
The most frequently occuring commute durations in Fairview are 45 to 59 minutes (1,064 commuters, 24.9%), 30 to 34 minutes (786 commuters, 18.4%), and 40 to 44 minutes (397 commuters, 9.3%).
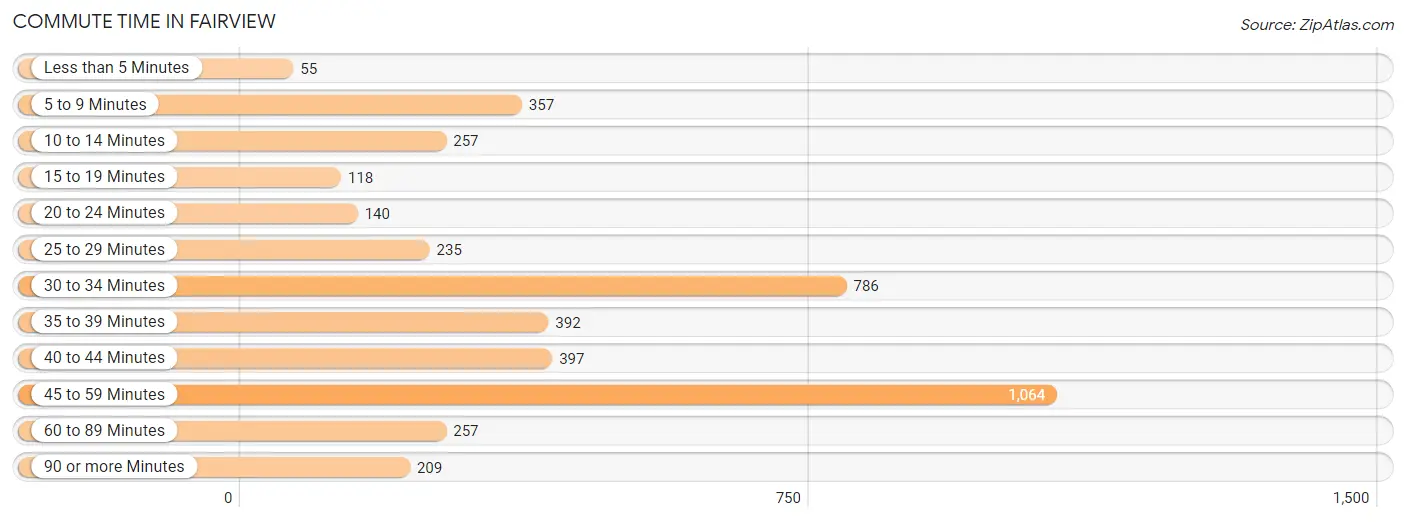
| Commute Time | # Commuters | % Commuters |
| Less than 5 Minutes | 55 | 1.3% |
| 5 to 9 Minutes | 357 | 8.4% |
| 10 to 14 Minutes | 257 | 6.0% |
| 15 to 19 Minutes | 118 | 2.8% |
| 20 to 24 Minutes | 140 | 3.3% |
| 25 to 29 Minutes | 235 | 5.5% |
| 30 to 34 Minutes | 786 | 18.4% |
| 35 to 39 Minutes | 392 | 9.2% |
| 40 to 44 Minutes | 397 | 9.3% |
| 45 to 59 Minutes | 1,064 | 24.9% |
| 60 to 89 Minutes | 257 | 6.0% |
| 90 or more Minutes | 209 | 4.9% |
Commute Time by Sex in Fairview
The most common commute times in Fairview are 45 to 59 minutes (556 commuters, 24.6%) for males and 45 to 59 minutes (508 commuters, 25.3%) for females.
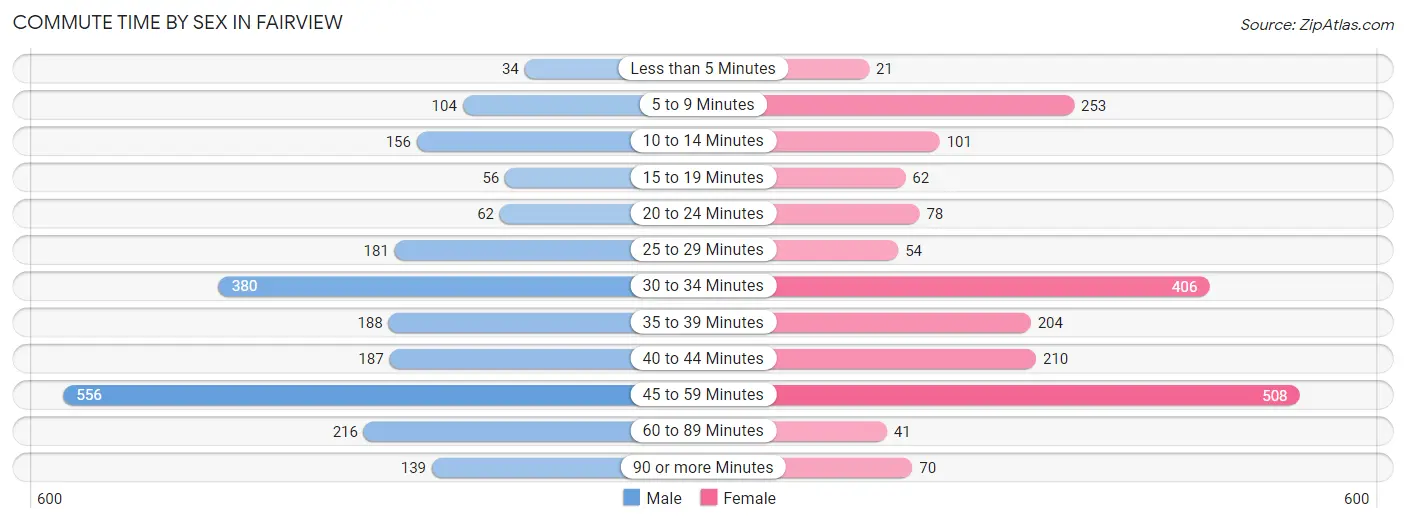
| Commute Time | Male | Female |
| Less than 5 Minutes | 34 (1.5%) | 21 (1.1%) |
| 5 to 9 Minutes | 104 (4.6%) | 253 (12.6%) |
| 10 to 14 Minutes | 156 (6.9%) | 101 (5.0%) |
| 15 to 19 Minutes | 56 (2.5%) | 62 (3.1%) |
| 20 to 24 Minutes | 62 (2.7%) | 78 (3.9%) |
| 25 to 29 Minutes | 181 (8.0%) | 54 (2.7%) |
| 30 to 34 Minutes | 380 (16.8%) | 406 (20.2%) |
| 35 to 39 Minutes | 188 (8.3%) | 204 (10.2%) |
| 40 to 44 Minutes | 187 (8.3%) | 210 (10.5%) |
| 45 to 59 Minutes | 556 (24.6%) | 508 (25.3%) |
| 60 to 89 Minutes | 216 (9.6%) | 41 (2.0%) |
| 90 or more Minutes | 139 (6.1%) | 70 (3.5%) |
Time of Departure to Work by Sex in Fairview
The most frequent times of departure to work in Fairview are 6:30 AM to 6:59 AM (379, 16.8%) for males and 7:00 AM to 7:29 AM (468, 23.3%) for females.
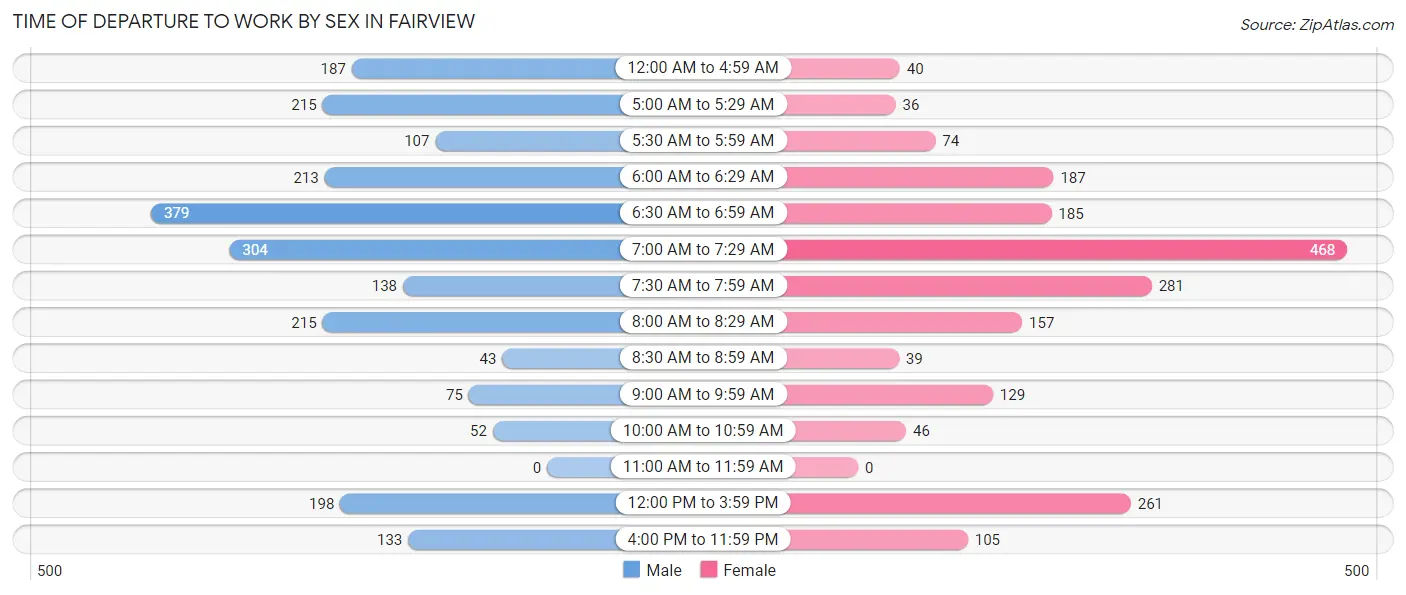
| Time of Departure | Male | Female |
| 12:00 AM to 4:59 AM | 187 (8.3%) | 40 (2.0%) |
| 5:00 AM to 5:29 AM | 215 (9.5%) | 36 (1.8%) |
| 5:30 AM to 5:59 AM | 107 (4.7%) | 74 (3.7%) |
| 6:00 AM to 6:29 AM | 213 (9.4%) | 187 (9.3%) |
| 6:30 AM to 6:59 AM | 379 (16.8%) | 185 (9.2%) |
| 7:00 AM to 7:29 AM | 304 (13.5%) | 468 (23.3%) |
| 7:30 AM to 7:59 AM | 138 (6.1%) | 281 (14.0%) |
| 8:00 AM to 8:29 AM | 215 (9.5%) | 157 (7.8%) |
| 8:30 AM to 8:59 AM | 43 (1.9%) | 39 (1.9%) |
| 9:00 AM to 9:59 AM | 75 (3.3%) | 129 (6.4%) |
| 10:00 AM to 10:59 AM | 52 (2.3%) | 46 (2.3%) |
| 11:00 AM to 11:59 AM | 0 (0.0%) | 0 (0.0%) |
| 12:00 PM to 3:59 PM | 198 (8.8%) | 261 (13.0%) |
| 4:00 PM to 11:59 PM | 133 (5.9%) | 105 (5.2%) |
| Total | 2,259 (100.0%) | 2,008 (100.0%) |
Housing Occupancy in Fairview
Occupancy by Ownership in Fairview
Of the total 3,602 dwellings in Fairview, owner-occupied units account for 2,963 (82.3%), while renter-occupied units make up 639 (17.7%).
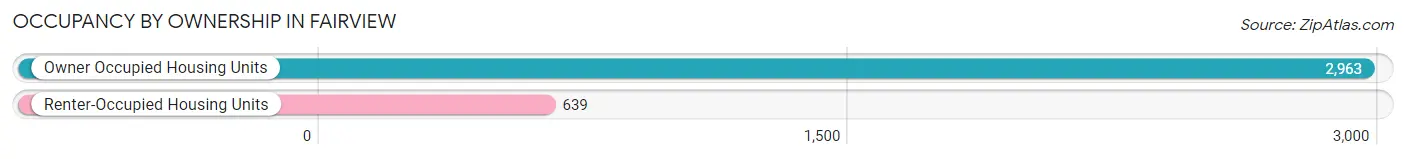
| Occupancy | # Housing Units | % Housing Units |
| Owner Occupied Housing Units | 2,963 | 82.3% |
| Renter-Occupied Housing Units | 639 | 17.7% |
| Total Occupied Housing Units | 3,602 | 100.0% |
Occupancy by Household Size in Fairview
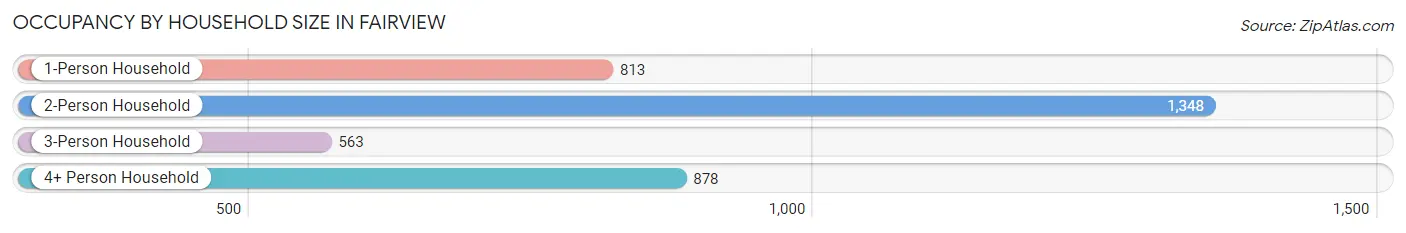
| Household Size | # Housing Units | % Housing Units |
| 1-Person Household | 813 | 22.6% |
| 2-Person Household | 1,348 | 37.4% |
| 3-Person Household | 563 | 15.6% |
| 4+ Person Household | 878 | 24.4% |
| Total Housing Units | 3,602 | 100.0% |
Occupancy by Ownership by Household Size in Fairview
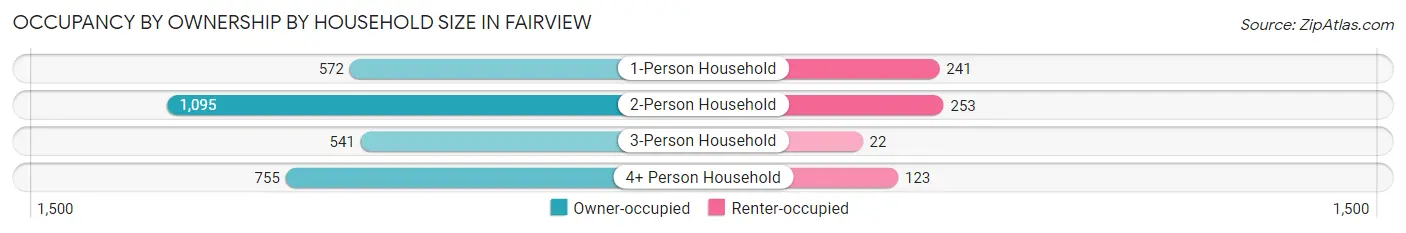
| Household Size | Owner-occupied | Renter-occupied |
| 1-Person Household | 572 (70.4%) | 241 (29.6%) |
| 2-Person Household | 1,095 (81.2%) | 253 (18.8%) |
| 3-Person Household | 541 (96.1%) | 22 (3.9%) |
| 4+ Person Household | 755 (86.0%) | 123 (14.0%) |
| Total Housing Units | 2,963 (82.3%) | 639 (17.7%) |
Occupancy by Educational Attainment in Fairview
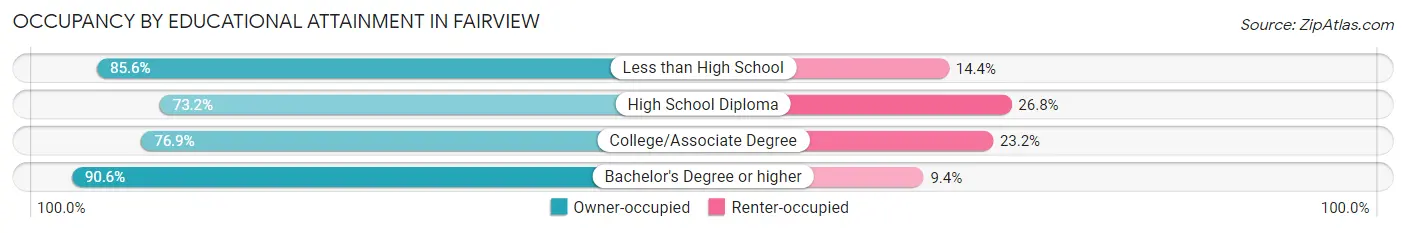
| Household Size | Owner-occupied | Renter-occupied |
| Less than High School | 232 (85.6%) | 39 (14.4%) |
| High School Diploma | 598 (73.2%) | 219 (26.8%) |
| College/Associate Degree | 810 (76.8%) | 244 (23.2%) |
| Bachelor's Degree or higher | 1,323 (90.6%) | 137 (9.4%) |
Occupancy by Age of Householder in Fairview
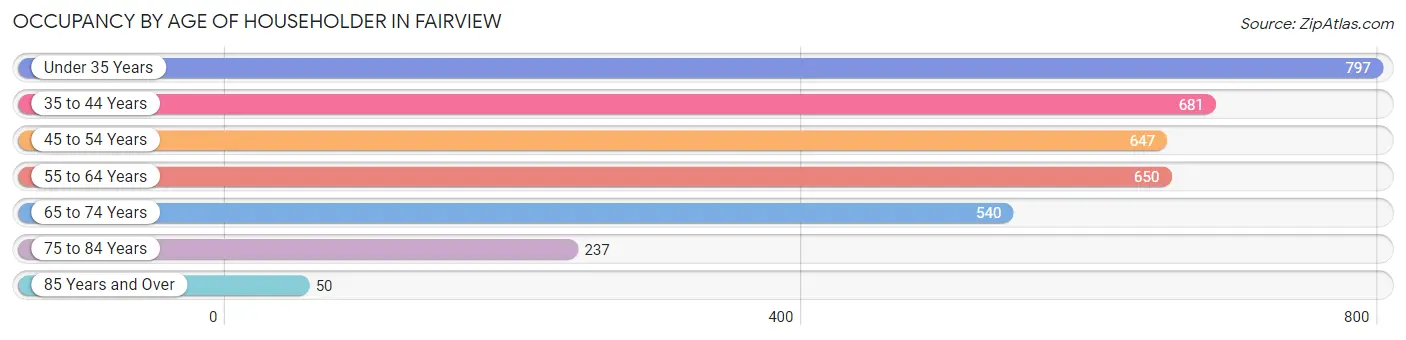
| Age Bracket | # Households | % Households |
| Under 35 Years | 797 | 22.1% |
| 35 to 44 Years | 681 | 18.9% |
| 45 to 54 Years | 647 | 18.0% |
| 55 to 64 Years | 650 | 18.0% |
| 65 to 74 Years | 540 | 15.0% |
| 75 to 84 Years | 237 | 6.6% |
| 85 Years and Over | 50 | 1.4% |
| Total | 3,602 | 100.0% |
Housing Finances in Fairview
Median Income by Occupancy in Fairview
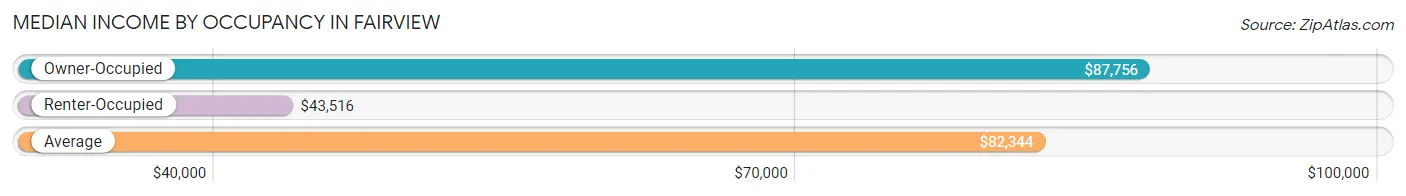
| Occupancy Type | # Households | Median Income |
| Owner-Occupied | 2,963 (82.3%) | $87,756 |
| Renter-Occupied | 639 (17.7%) | $43,516 |
| Average | 3,602 (100.0%) | $82,344 |
Occupancy by Householder Income Bracket in Fairview
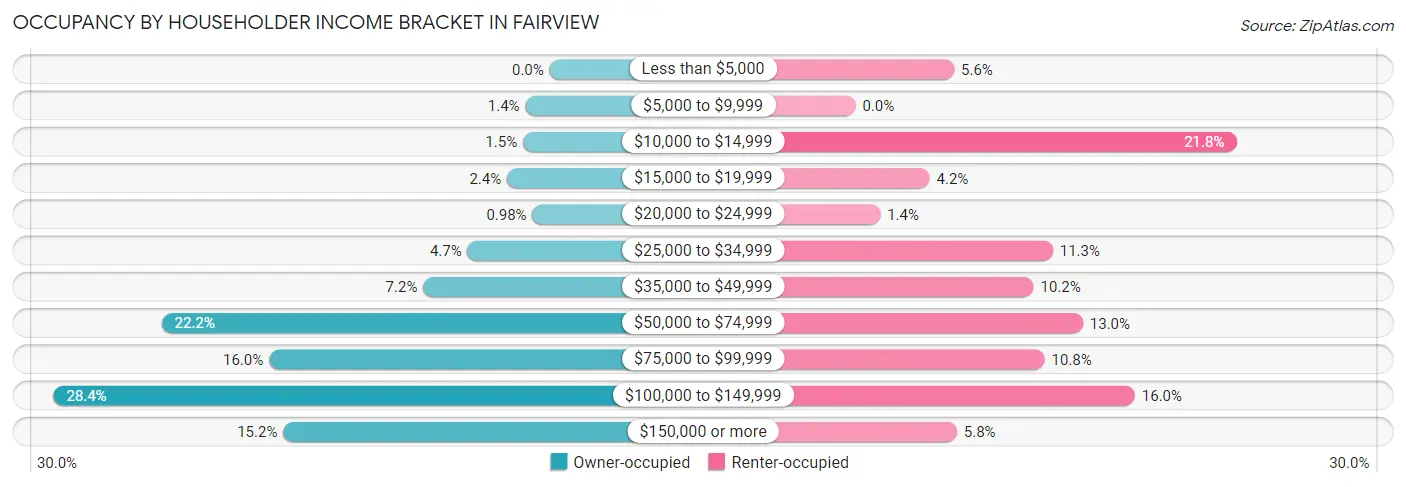
| Income Bracket | Owner-occupied | Renter-occupied |
| Less than $5,000 | 0 (0.0%) | 36 (5.6%) |
| $5,000 to $9,999 | 41 (1.4%) | 0 (0.0%) |
| $10,000 to $14,999 | 45 (1.5%) | 139 (21.7%) |
| $15,000 to $19,999 | 72 (2.4%) | 27 (4.2%) |
| $20,000 to $24,999 | 29 (1.0%) | 9 (1.4%) |
| $25,000 to $34,999 | 139 (4.7%) | 72 (11.3%) |
| $35,000 to $49,999 | 214 (7.2%) | 65 (10.2%) |
| $50,000 to $74,999 | 657 (22.2%) | 83 (13.0%) |
| $75,000 to $99,999 | 475 (16.0%) | 69 (10.8%) |
| $100,000 to $149,999 | 840 (28.3%) | 102 (16.0%) |
| $150,000 or more | 451 (15.2%) | 37 (5.8%) |
| Total | 2,963 (100.0%) | 639 (100.0%) |
Monthly Housing Cost Tiers in Fairview
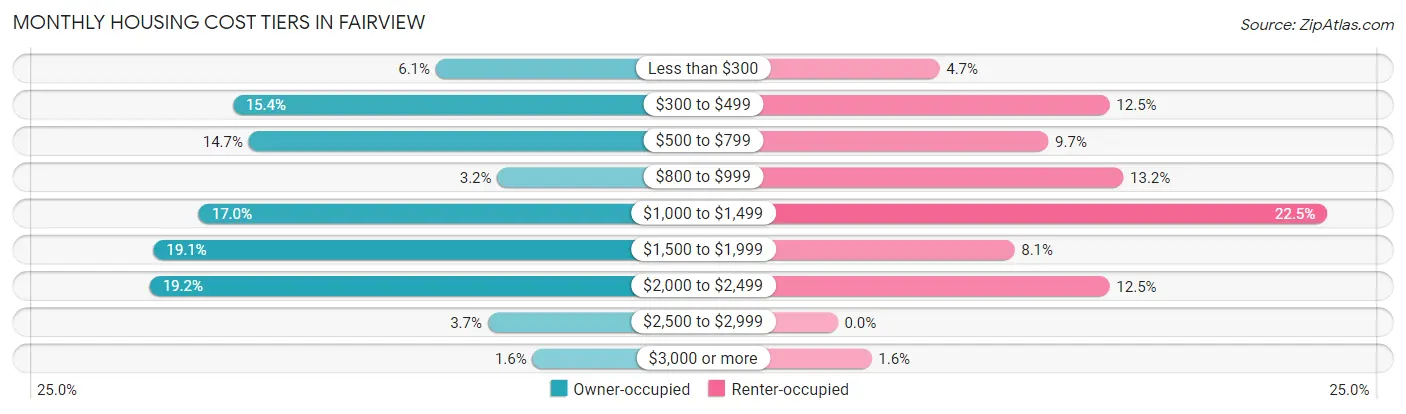
| Monthly Cost | Owner-occupied | Renter-occupied |
| Less than $300 | 180 (6.1%) | 30 (4.7%) |
| $300 to $499 | 457 (15.4%) | 80 (12.5%) |
| $500 to $799 | 435 (14.7%) | 62 (9.7%) |
| $800 to $999 | 96 (3.2%) | 84 (13.2%) |
| $1,000 to $1,499 | 503 (17.0%) | 144 (22.5%) |
| $1,500 to $1,999 | 565 (19.1%) | 52 (8.1%) |
| $2,000 to $2,499 | 570 (19.2%) | 80 (12.5%) |
| $2,500 to $2,999 | 109 (3.7%) | 0 (0.0%) |
| $3,000 or more | 48 (1.6%) | 10 (1.6%) |
| Total | 2,963 (100.0%) | 639 (100.0%) |
Physical Housing Characteristics in Fairview
Housing Structures in Fairview
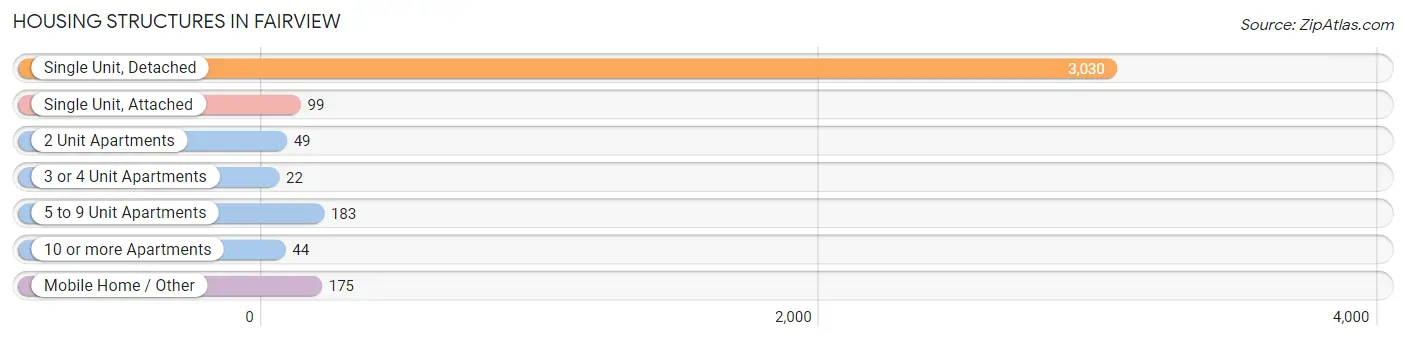
| Structure Type | # Housing Units | % Housing Units |
| Single Unit, Detached | 3,030 | 84.1% |
| Single Unit, Attached | 99 | 2.8% |
| 2 Unit Apartments | 49 | 1.4% |
| 3 or 4 Unit Apartments | 22 | 0.6% |
| 5 to 9 Unit Apartments | 183 | 5.1% |
| 10 or more Apartments | 44 | 1.2% |
| Mobile Home / Other | 175 | 4.9% |
| Total | 3,602 | 100.0% |
Housing Structures by Occupancy in Fairview
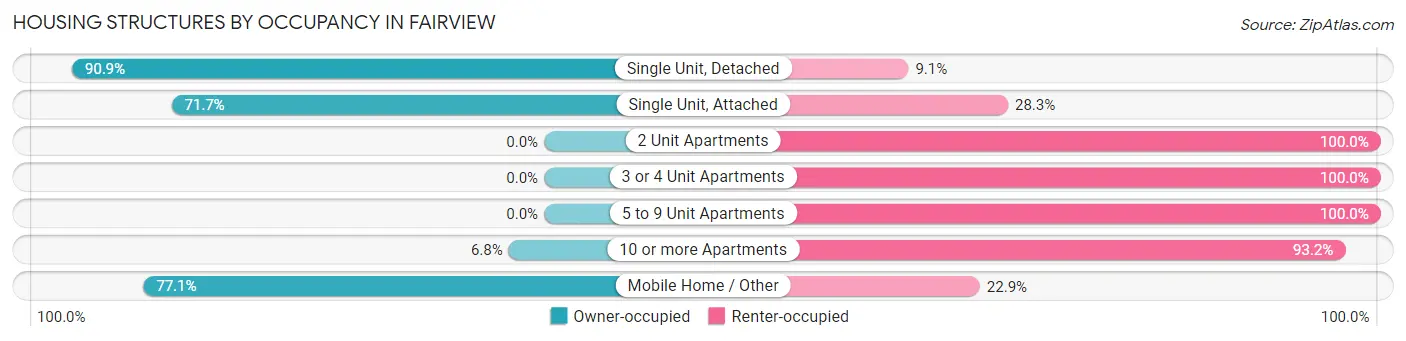
| Structure Type | Owner-occupied | Renter-occupied |
| Single Unit, Detached | 2,754 (90.9%) | 276 (9.1%) |
| Single Unit, Attached | 71 (71.7%) | 28 (28.3%) |
| 2 Unit Apartments | 0 (0.0%) | 49 (100.0%) |
| 3 or 4 Unit Apartments | 0 (0.0%) | 22 (100.0%) |
| 5 to 9 Unit Apartments | 0 (0.0%) | 183 (100.0%) |
| 10 or more Apartments | 3 (6.8%) | 41 (93.2%) |
| Mobile Home / Other | 135 (77.1%) | 40 (22.9%) |
| Total | 2,963 (82.3%) | 639 (17.7%) |
Housing Structures by Number of Rooms in Fairview
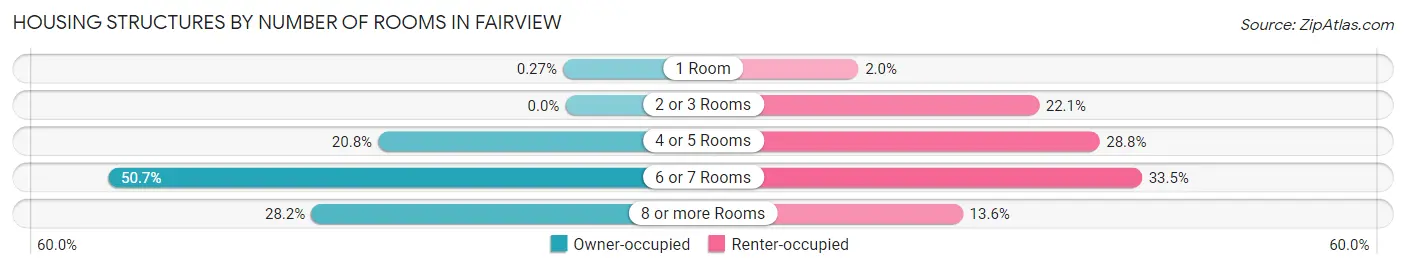
| Number of Rooms | Owner-occupied | Renter-occupied |
| 1 Room | 8 (0.3%) | 13 (2.0%) |
| 2 or 3 Rooms | 0 (0.0%) | 141 (22.1%) |
| 4 or 5 Rooms | 616 (20.8%) | 184 (28.8%) |
| 6 or 7 Rooms | 1,503 (50.7%) | 214 (33.5%) |
| 8 or more Rooms | 836 (28.2%) | 87 (13.6%) |
| Total | 2,963 (100.0%) | 639 (100.0%) |
Housing Structure by Heating Type in Fairview
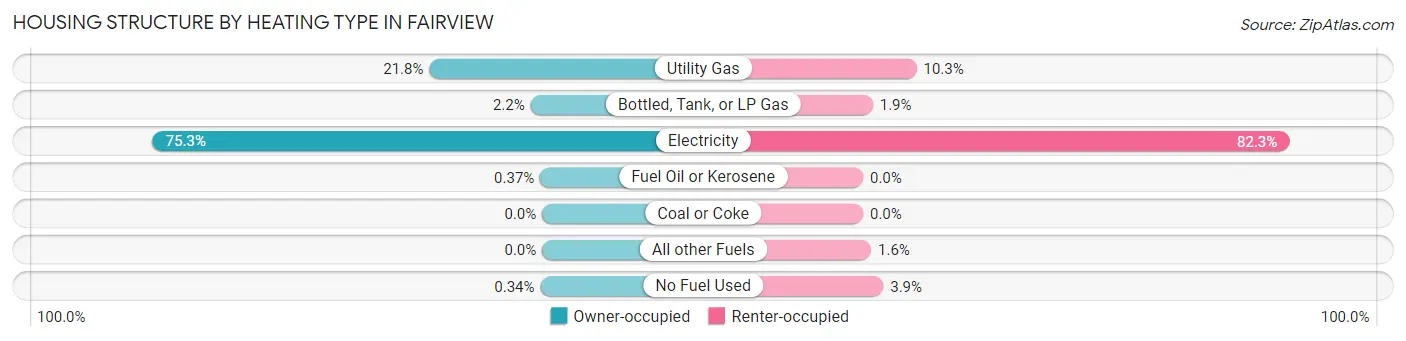
| Heating Type | Owner-occupied | Renter-occupied |
| Utility Gas | 646 (21.8%) | 66 (10.3%) |
| Bottled, Tank, or LP Gas | 66 (2.2%) | 12 (1.9%) |
| Electricity | 2,230 (75.3%) | 526 (82.3%) |
| Fuel Oil or Kerosene | 11 (0.4%) | 0 (0.0%) |
| Coal or Coke | 0 (0.0%) | 0 (0.0%) |
| All other Fuels | 0 (0.0%) | 10 (1.6%) |
| No Fuel Used | 10 (0.3%) | 25 (3.9%) |
| Total | 2,963 (100.0%) | 639 (100.0%) |
Household Vehicle Usage in Fairview
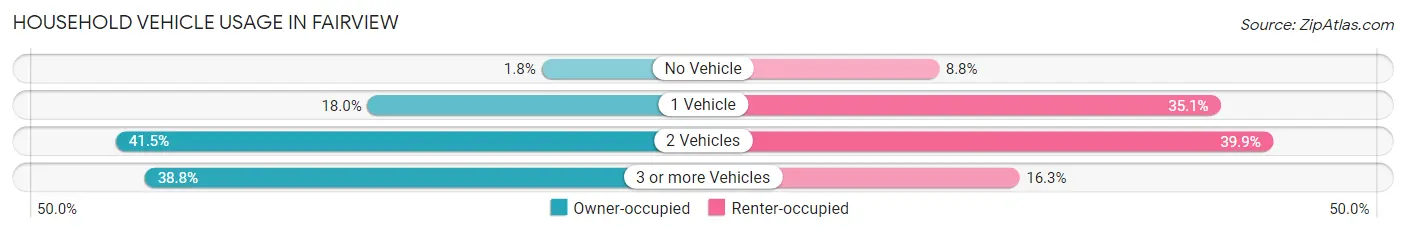
| Vehicles per Household | Owner-occupied | Renter-occupied |
| No Vehicle | 52 (1.8%) | 56 (8.8%) |
| 1 Vehicle | 533 (18.0%) | 224 (35.0%) |
| 2 Vehicles | 1,229 (41.5%) | 255 (39.9%) |
| 3 or more Vehicles | 1,149 (38.8%) | 104 (16.3%) |
| Total | 2,963 (100.0%) | 639 (100.0%) |
Real Estate & Mortgages in Fairview
Real Estate and Mortgage Overview in Fairview
| Characteristic | Without Mortgage | With Mortgage |
| Housing Units | 1,005 | 1,958 |
| Median Property Value | $274,200 | $334,600 |
| Median Household Income | $67,371 | $399 |
| Monthly Housing Costs | $455 | $48 |
| Real Estate Taxes | $1,725 | $0 |
Property Value by Mortgage Status in Fairview
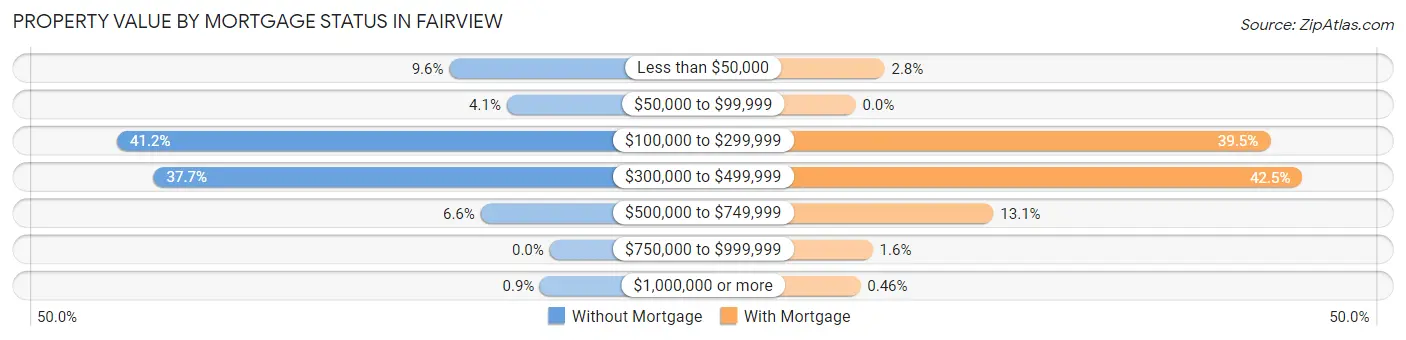
| Property Value | Without Mortgage | With Mortgage |
| Less than $50,000 | 96 (9.6%) | 54 (2.8%) |
| $50,000 to $99,999 | 41 (4.1%) | 0 (0.0%) |
| $100,000 to $299,999 | 414 (41.2%) | 773 (39.5%) |
| $300,000 to $499,999 | 379 (37.7%) | 833 (42.5%) |
| $500,000 to $749,999 | 66 (6.6%) | 257 (13.1%) |
| $750,000 to $999,999 | 0 (0.0%) | 32 (1.6%) |
| $1,000,000 or more | 9 (0.9%) | 9 (0.5%) |
| Total | 1,005 (100.0%) | 1,958 (100.0%) |
Household Income by Mortgage Status in Fairview
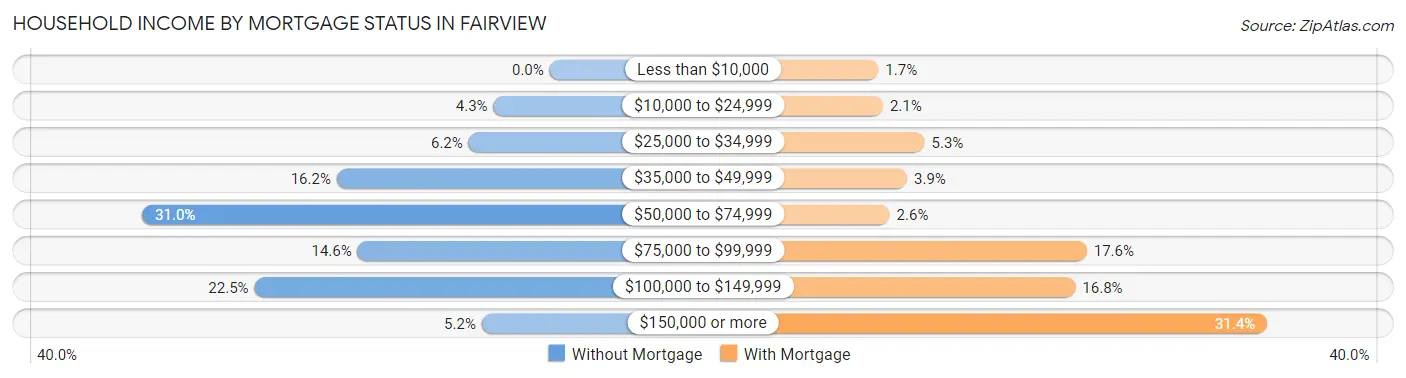
| Household Income | Without Mortgage | With Mortgage |
| Less than $10,000 | 0 (0.0%) | 34 (1.7%) |
| $10,000 to $24,999 | 43 (4.3%) | 41 (2.1%) |
| $25,000 to $34,999 | 62 (6.2%) | 103 (5.3%) |
| $35,000 to $49,999 | 163 (16.2%) | 77 (3.9%) |
| $50,000 to $74,999 | 312 (31.0%) | 51 (2.6%) |
| $75,000 to $99,999 | 147 (14.6%) | 345 (17.6%) |
| $100,000 to $149,999 | 226 (22.5%) | 328 (16.8%) |
| $150,000 or more | 52 (5.2%) | 614 (31.4%) |
| Total | 1,005 (100.0%) | 1,958 (100.0%) |
Property Value to Household Income Ratio in Fairview
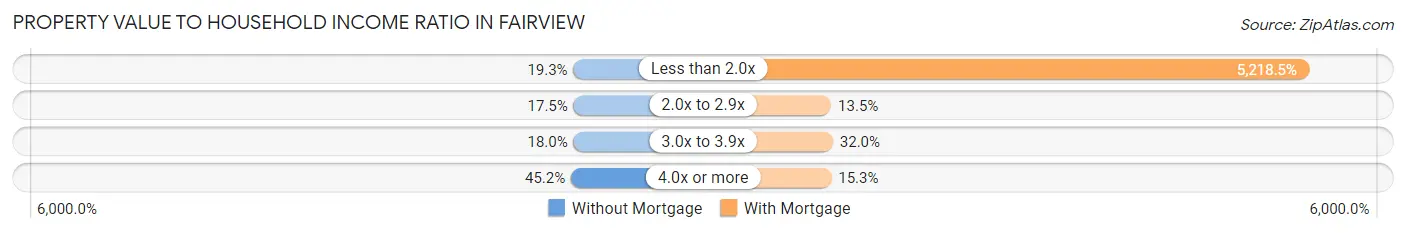
| Value-to-Income Ratio | Without Mortgage | With Mortgage |
| Less than 2.0x | 194 (19.3%) | 102,179 (5,218.5%) |
| 2.0x to 2.9x | 176 (17.5%) | 265 (13.5%) |
| 3.0x to 3.9x | 181 (18.0%) | 626 (32.0%) |
| 4.0x or more | 454 (45.2%) | 300 (15.3%) |
| Total | 1,005 (100.0%) | 1,958 (100.0%) |
Real Estate Taxes by Mortgage Status in Fairview
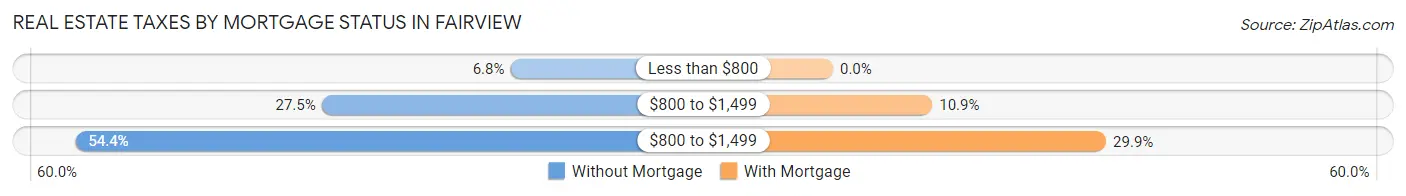
| Property Taxes | Without Mortgage | With Mortgage |
| Less than $800 | 68 (6.8%) | 0 (0.0%) |
| $800 to $1,499 | 276 (27.5%) | 213 (10.9%) |
| $800 to $1,499 | 547 (54.4%) | 586 (29.9%) |
| Total | 1,005 (100.0%) | 1,958 (100.0%) |
Health & Disability in Fairview
Health Insurance Coverage by Age in Fairview
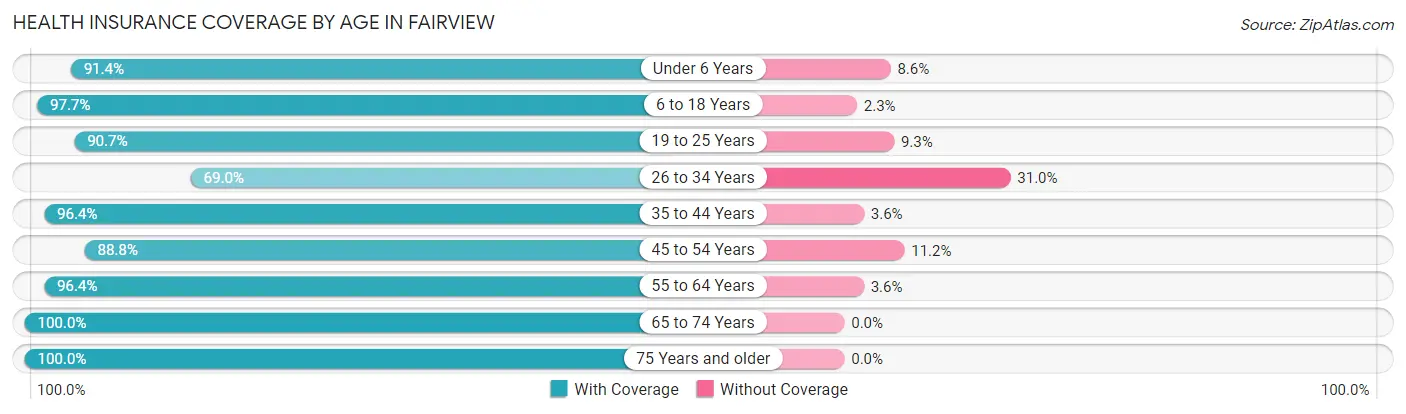
| Age Bracket | With Coverage | Without Coverage |
| Under 6 Years | 669 (91.4%) | 63 (8.6%) |
| 6 to 18 Years | 1,751 (97.7%) | 42 (2.3%) |
| 19 to 25 Years | 833 (90.7%) | 85 (9.3%) |
| 26 to 34 Years | 894 (69.0%) | 401 (31.0%) |
| 35 to 44 Years | 1,217 (96.4%) | 46 (3.6%) |
| 45 to 54 Years | 1,016 (88.8%) | 128 (11.2%) |
| 55 to 64 Years | 1,093 (96.4%) | 41 (3.6%) |
| 65 to 74 Years | 798 (100.0%) | 0 (0.0%) |
| 75 Years and older | 416 (100.0%) | 0 (0.0%) |
| Total | 8,687 (91.5%) | 806 (8.5%) |
Health Insurance Coverage by Citizenship Status in Fairview
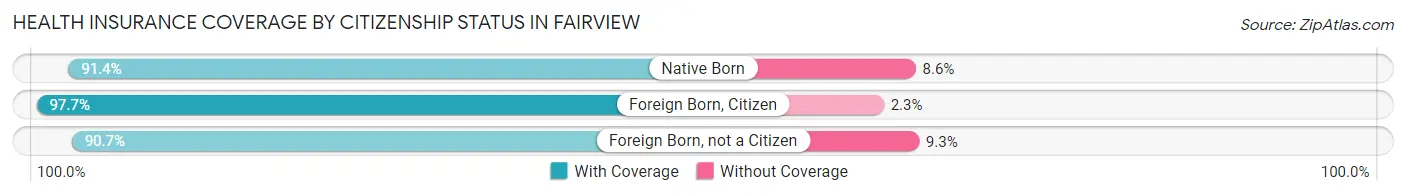
| Citizenship Status | With Coverage | Without Coverage |
| Native Born | 669 (91.4%) | 63 (8.6%) |
| Foreign Born, Citizen | 1,751 (97.7%) | 42 (2.3%) |
| Foreign Born, not a Citizen | 833 (90.7%) | 85 (9.3%) |
Health Insurance Coverage by Household Income in Fairview
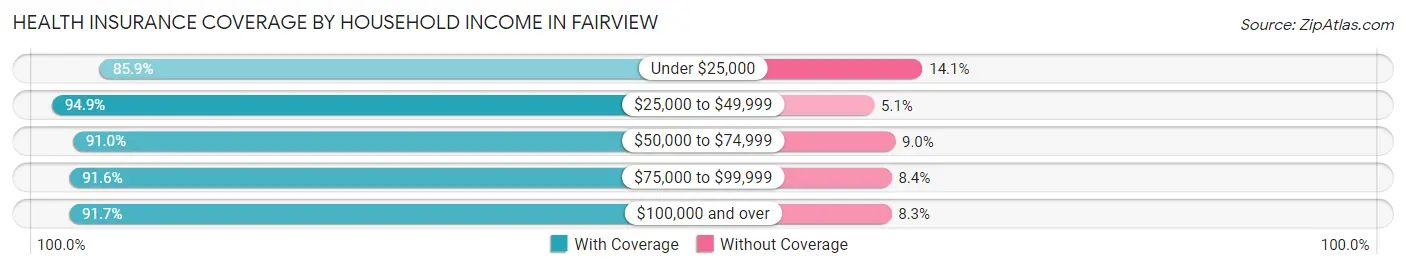
| Household Income | With Coverage | Without Coverage |
| Under $25,000 | 607 (85.9%) | 100 (14.1%) |
| $25,000 to $49,999 | 1,149 (94.9%) | 62 (5.1%) |
| $50,000 to $74,999 | 1,569 (91.0%) | 156 (9.0%) |
| $75,000 to $99,999 | 1,554 (91.6%) | 142 (8.4%) |
| $100,000 and over | 3,808 (91.7%) | 346 (8.3%) |
Public vs Private Health Insurance Coverage by Age in Fairview
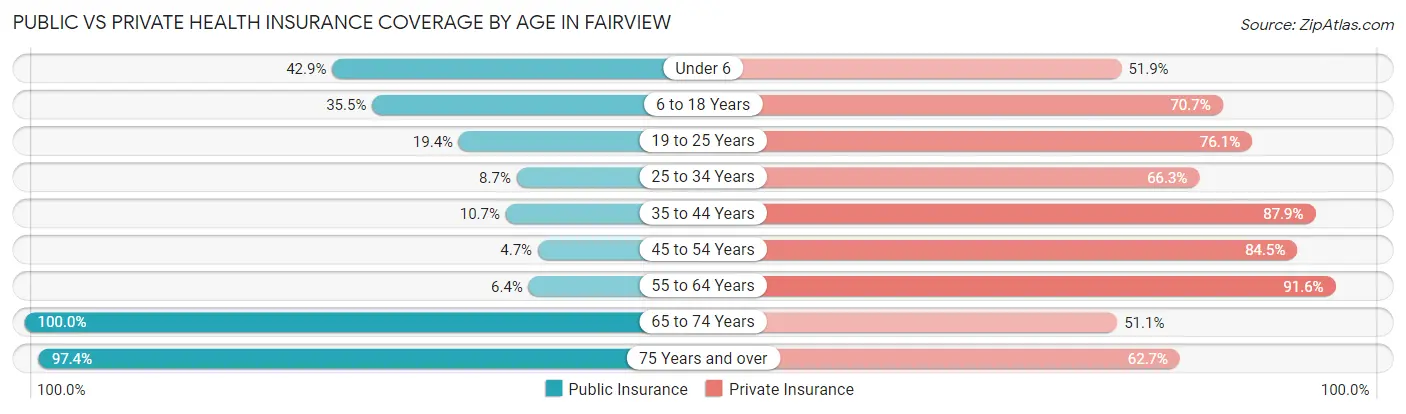
| Age Bracket | Public Insurance | Private Insurance |
| Under 6 | 314 (42.9%) | 380 (51.9%) |
| 6 to 18 Years | 636 (35.5%) | 1,267 (70.7%) |
| 19 to 25 Years | 178 (19.4%) | 699 (76.1%) |
| 25 to 34 Years | 112 (8.6%) | 859 (66.3%) |
| 35 to 44 Years | 135 (10.7%) | 1,110 (87.9%) |
| 45 to 54 Years | 54 (4.7%) | 967 (84.5%) |
| 55 to 64 Years | 73 (6.4%) | 1,039 (91.6%) |
| 65 to 74 Years | 798 (100.0%) | 408 (51.1%) |
| 75 Years and over | 405 (97.4%) | 261 (62.7%) |
| Total | 2,705 (28.5%) | 6,990 (73.6%) |
Disability Status by Sex by Age in Fairview
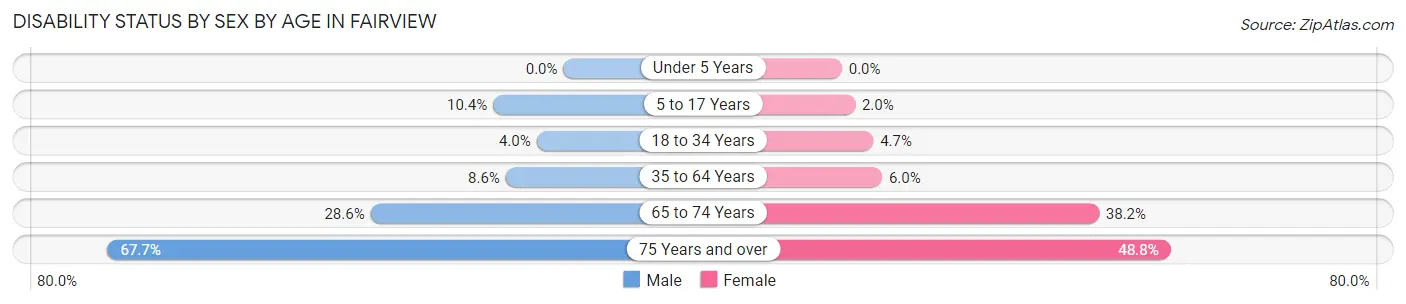
| Age Bracket | Male | Female |
| Under 5 Years | 0 (0.0%) | 0 (0.0%) |
| 5 to 17 Years | 100 (10.4%) | 15 (1.9%) |
| 18 to 34 Years | 55 (4.0%) | 46 (4.7%) |
| 35 to 64 Years | 138 (8.6%) | 115 (6.0%) |
| 65 to 74 Years | 122 (28.6%) | 142 (38.2%) |
| 75 Years and over | 111 (67.7%) | 123 (48.8%) |
Disability Class by Sex by Age in Fairview
Disability Class: Hearing Difficulty
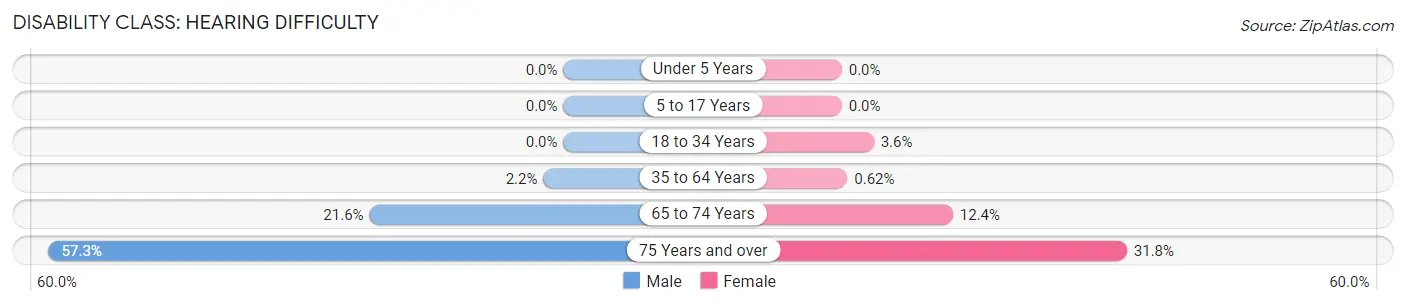
| Age Bracket | Male | Female |
| Under 5 Years | 0 (0.0%) | 0 (0.0%) |
| 5 to 17 Years | 0 (0.0%) | 0 (0.0%) |
| 18 to 34 Years | 0 (0.0%) | 35 (3.5%) |
| 35 to 64 Years | 36 (2.2%) | 12 (0.6%) |
| 65 to 74 Years | 92 (21.6%) | 46 (12.4%) |
| 75 Years and over | 94 (57.3%) | 80 (31.8%) |
Disability Class: Vision Difficulty
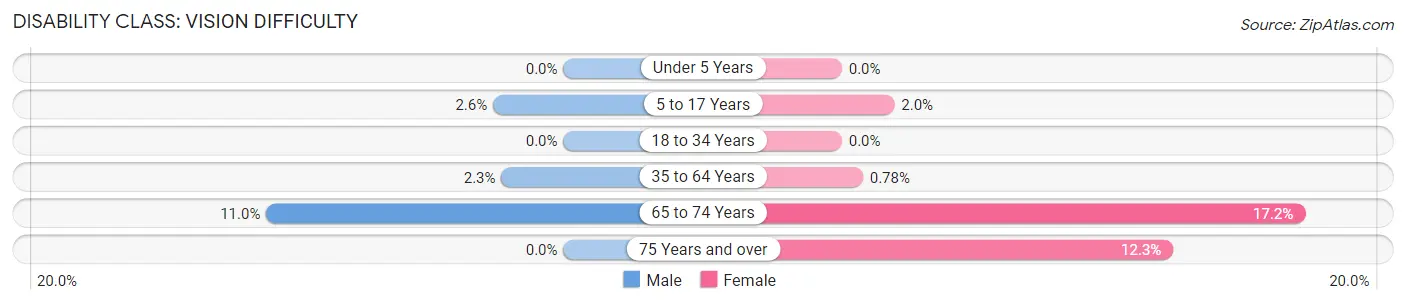
| Age Bracket | Male | Female |
| Under 5 Years | 0 (0.0%) | 0 (0.0%) |
| 5 to 17 Years | 25 (2.6%) | 15 (1.9%) |
| 18 to 34 Years | 0 (0.0%) | 0 (0.0%) |
| 35 to 64 Years | 37 (2.3%) | 15 (0.8%) |
| 65 to 74 Years | 47 (11.0%) | 64 (17.2%) |
| 75 Years and over | 0 (0.0%) | 31 (12.3%) |
Disability Class: Cognitive Difficulty
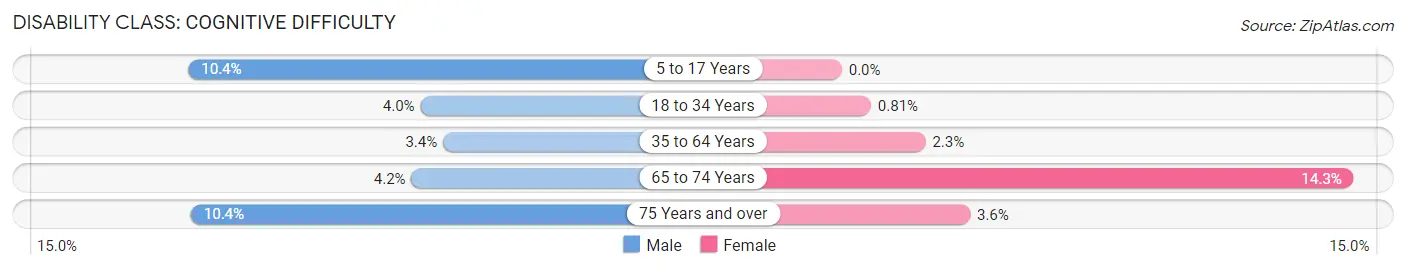
| Age Bracket | Male | Female |
| 5 to 17 Years | 100 (10.4%) | 0 (0.0%) |
| 18 to 34 Years | 55 (4.0%) | 8 (0.8%) |
| 35 to 64 Years | 54 (3.4%) | 45 (2.3%) |
| 65 to 74 Years | 18 (4.2%) | 53 (14.2%) |
| 75 Years and over | 17 (10.4%) | 9 (3.6%) |
Disability Class: Ambulatory Difficulty
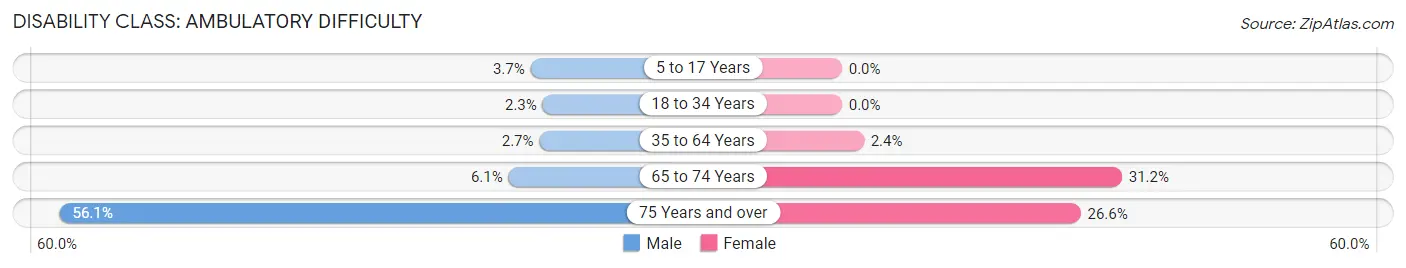
| Age Bracket | Male | Female |
| 5 to 17 Years | 35 (3.6%) | 0 (0.0%) |
| 18 to 34 Years | 32 (2.3%) | 0 (0.0%) |
| 35 to 64 Years | 43 (2.7%) | 47 (2.4%) |
| 65 to 74 Years | 26 (6.1%) | 116 (31.2%) |
| 75 Years and over | 92 (56.1%) | 67 (26.6%) |
Disability Class: Self-Care Difficulty
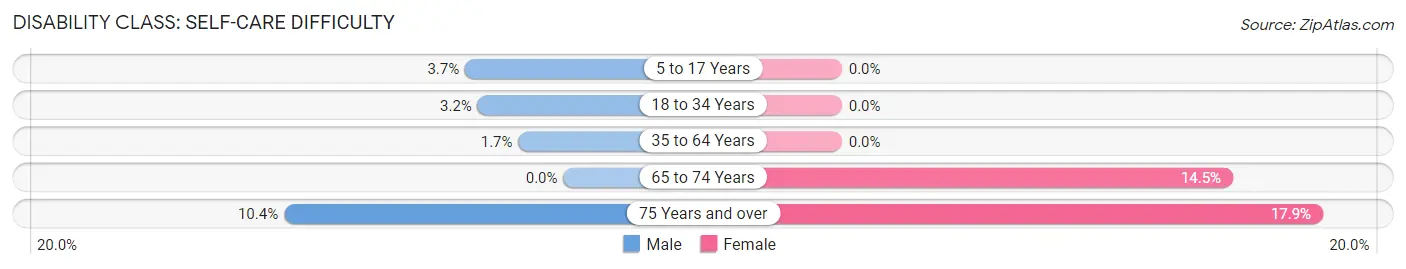
| Age Bracket | Male | Female |
| 5 to 17 Years | 35 (3.6%) | 0 (0.0%) |
| 18 to 34 Years | 44 (3.2%) | 0 (0.0%) |
| 35 to 64 Years | 27 (1.7%) | 0 (0.0%) |
| 65 to 74 Years | 0 (0.0%) | 54 (14.5%) |
| 75 Years and over | 17 (10.4%) | 45 (17.9%) |
Technology Access in Fairview
Computing Device Access in Fairview
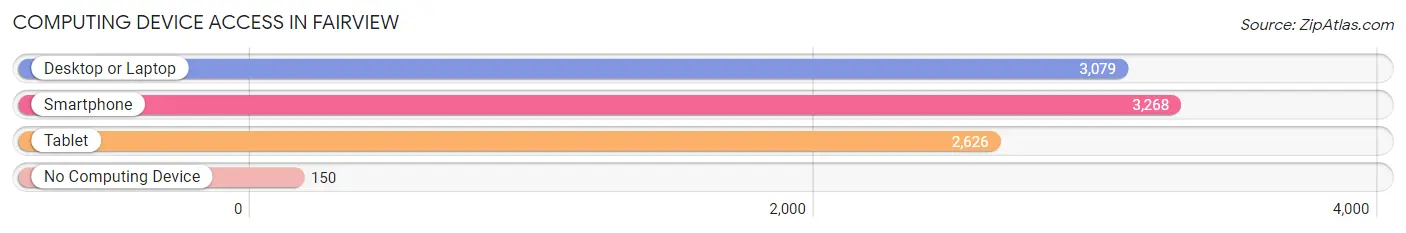
| Device Type | # Households | % Households |
| Desktop or Laptop | 3,079 | 85.5% |
| Smartphone | 3,268 | 90.7% |
| Tablet | 2,626 | 72.9% |
| No Computing Device | 150 | 4.2% |
| Total | 3,602 | 100.0% |
Internet Access in Fairview
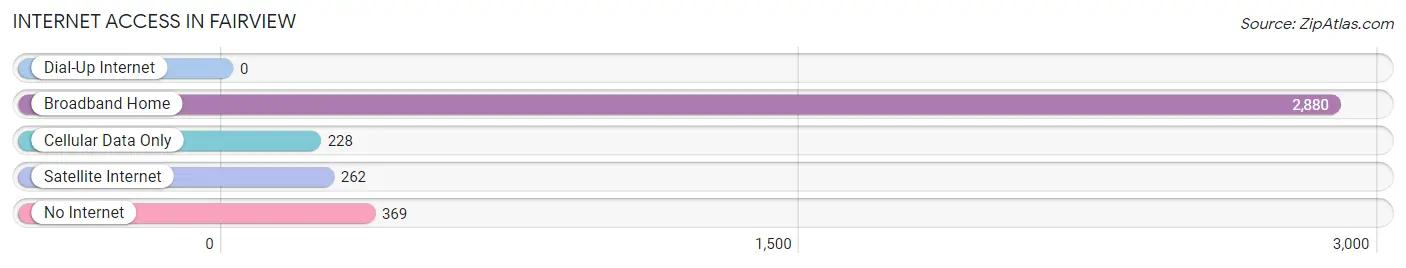
| Internet Type | # Households | % Households |
| Dial-Up Internet | 0 | 0.0% |
| Broadband Home | 2,880 | 80.0% |
| Cellular Data Only | 228 | 6.3% |
| Satellite Internet | 262 | 7.3% |
| No Internet | 369 | 10.2% |
| Total | 3,602 | 100.0% |
Fairview Summary
History
The small town of Fairview, Tennessee is located in Williamson County, just west of Nashville. The town was founded in 1871 and was originally known as “Fairview Station” due to its proximity to the railroad. The town was officially incorporated in 1877 and was named after the nearby Fairview Methodist Church.
The town was originally a farming community, but it quickly grew into a bustling small town. In the early 1900s, the town was home to several businesses, including a general store, a blacksmith, a livery stable, and a cotton gin. The town also had a post office, a bank, and a hotel.
In the 1920s, the town began to experience a period of growth and prosperity. The town was home to several factories, including a cotton mill, a furniture factory, and a canning factory. The town also had a movie theater, a bowling alley, and a library.
In the 1950s, the town began to experience a decline in population and businesses. The factories closed and the town’s economy suffered. In the 1970s, the town began to experience a resurgence in population and businesses. The town was home to several new businesses, including a grocery store, a hardware store, and a restaurant.
Geography
Fairview is located in Williamson County, Tennessee, just west of Nashville. The town is situated on the banks of the Harpeth River and is surrounded by rolling hills and farmland. The town is located in a rural area and is home to several small farms and ranches.
The town is located at an elevation of 645 feet and has a total area of 4.2 square miles. The town has a humid subtropical climate with hot summers and mild winters. The average annual temperature is around 65 degrees Fahrenheit.
Economy
Fairview’s economy is largely based on agriculture and tourism. The town is home to several small farms and ranches, which produce a variety of crops, including corn, soybeans, and hay. The town is also home to several wineries and vineyards, which produce a variety of wines.
The town is also home to several small businesses, including restaurants, retail stores, and service providers. The town is also home to several manufacturing companies, which produce a variety of products, including furniture, clothing, and electronics.
Demographics
As of the 2010 census, the town of Fairview had a population of 7,720. The population is largely white (94.3%) and the median age is 38. The median household income is $60,945 and the median home value is $213,400.
The town is home to several churches, including the Fairview Methodist Church, the Fairview Baptist Church, and the Fairview Presbyterian Church. The town is also home to several schools, including Fairview Elementary School, Fairview Middle School, and Fairview High School.
Conclusion
Fairview, Tennessee is a small town located in Williamson County, just west of Nashville. The town was founded in 1871 and was originally a farming community. In the early 1900s, the town experienced a period of growth and prosperity, but it began to decline in the 1950s. In the 1970s, the town began to experience a resurgence in population and businesses. Today, the town’s economy is largely based on agriculture and tourism. The town is home to several small businesses, churches, and schools.
Common Questions
What is Per Capita Income in Fairview?
Per Capita income in Fairview is $35,439.
What is the Median Family Income in Fairview?
Median Family Income in Fairview is $93,989.
What is the Median Household income in Fairview?
Median Household Income in Fairview is $82,344.
What is Income or Wage Gap in Fairview?
Income or Wage Gap in Fairview is 29.3%.
Women in Fairview earn 70.7 cents for every dollar earned by a man.
What is Family Income Deficit in Fairview?
Family Income Deficit in Fairview is $10,862.
Families that are below poverty line in Fairview earn $10,862 less on average than the poverty threshold level.
What is Inequality or Gini Index in Fairview?
Inequality or Gini Index in Fairview is 0.36.
What is the Total Population of Fairview?
Total Population of Fairview is 9,519.
What is the Total Male Population of Fairview?
Total Male Population of Fairview is 4,936.
What is the Total Female Population of Fairview?
Total Female Population of Fairview is 4,583.
What is the Ratio of Males per 100 Females in Fairview?
There are 107.70 Males per 100 Females in Fairview.
What is the Ratio of Females per 100 Males in Fairview?
There are 92.85 Females per 100 Males in Fairview.
What is the Median Population Age in Fairview?
Median Population Age in Fairview is 34.9 Years.
What is the Average Family Size in Fairview
Average Family Size in Fairview is 3.2 People.
What is the Average Household Size in Fairview
Average Household Size in Fairview is 2.6 People.
How Large is the Labor Force in Fairview?
There are 5,078 People in the Labor Forcein in Fairview.
What is the Percentage of People in the Labor Force in Fairview?
68.1% of People are in the Labor Force in Fairview.
What is the Unemployment Rate in Fairview?
Unemployment Rate in Fairview is 2.4%.