Unicoi, TN Map & Demographics
Unicoi Map
Unicoi Overview
$25,489
PER CAPITA INCOME
$50,182
AVG FAMILY INCOME
$39,236
AVG HOUSEHOLD INCOME
40.1%
WAGE / INCOME GAP [ % ]
59.9¢/ $1
WAGE / INCOME GAP [ $ ]
0.45
INEQUALITY / GINI INDEX
3,802
TOTAL POPULATION
1,927
MALE POPULATION
1,875
FEMALE POPULATION
102.77
MALES / 100 FEMALES
97.30
FEMALES / 100 MALES
50.6
MEDIAN AGE
2.7
AVG FAMILY SIZE
2.1
AVG HOUSEHOLD SIZE
1,569
LABOR FORCE [ PEOPLE ]
47.6%
PERCENT IN LABOR FORCE
7.9%
UNEMPLOYMENT RATE
Unicoi Zip Codes
Unicoi Area Codes
Income in Unicoi
Income Overview in Unicoi
Per Capita Income in Unicoi is $25,489, while median incomes of families and households are $50,182 and $39,236 respectively.
| Characteristic | Number | Measure |
| Per Capita Income | 3,802 | $25,489 |
| Median Family Income | 995 | $50,182 |
| Mean Family Income | 995 | $71,017 |
| Median Household Income | 1,768 | $39,236 |
| Mean Household Income | 1,768 | $55,666 |
| Income Deficit | 995 | $0 |
| Wage / Income Gap (%) | 3,802 | 40.10% |
| Wage / Income Gap ($) | 3,802 | 59.90¢ per $1 |
| Gini / Inequality Index | 3,802 | 0.45 |
Earnings by Sex in Unicoi
Average Earnings in Unicoi are $35,145, $37,289 for men and $22,337 for women, a difference of 40.1%.
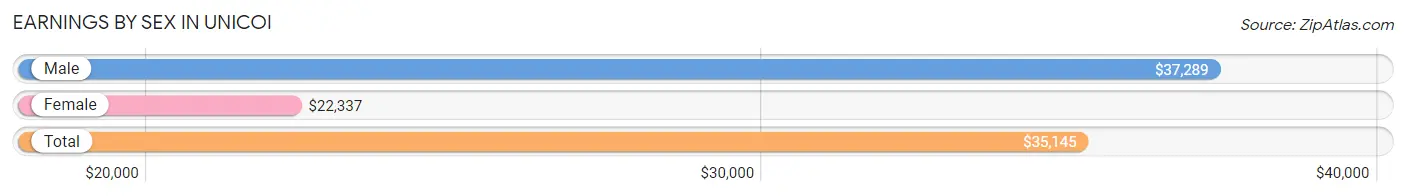
| Sex | Number | Average Earnings |
| Male | 789 (47.1%) | $37,289 |
| Female | 886 (52.9%) | $22,337 |
| Total | 1,675 (100.0%) | $35,145 |
Earnings by Sex by Income Bracket in Unicoi
The most common earnings brackets in Unicoi are $55,000 to $64,999 for men (175 | 22.2%) and $20,000 to $22,499 for women (123 | 13.9%).
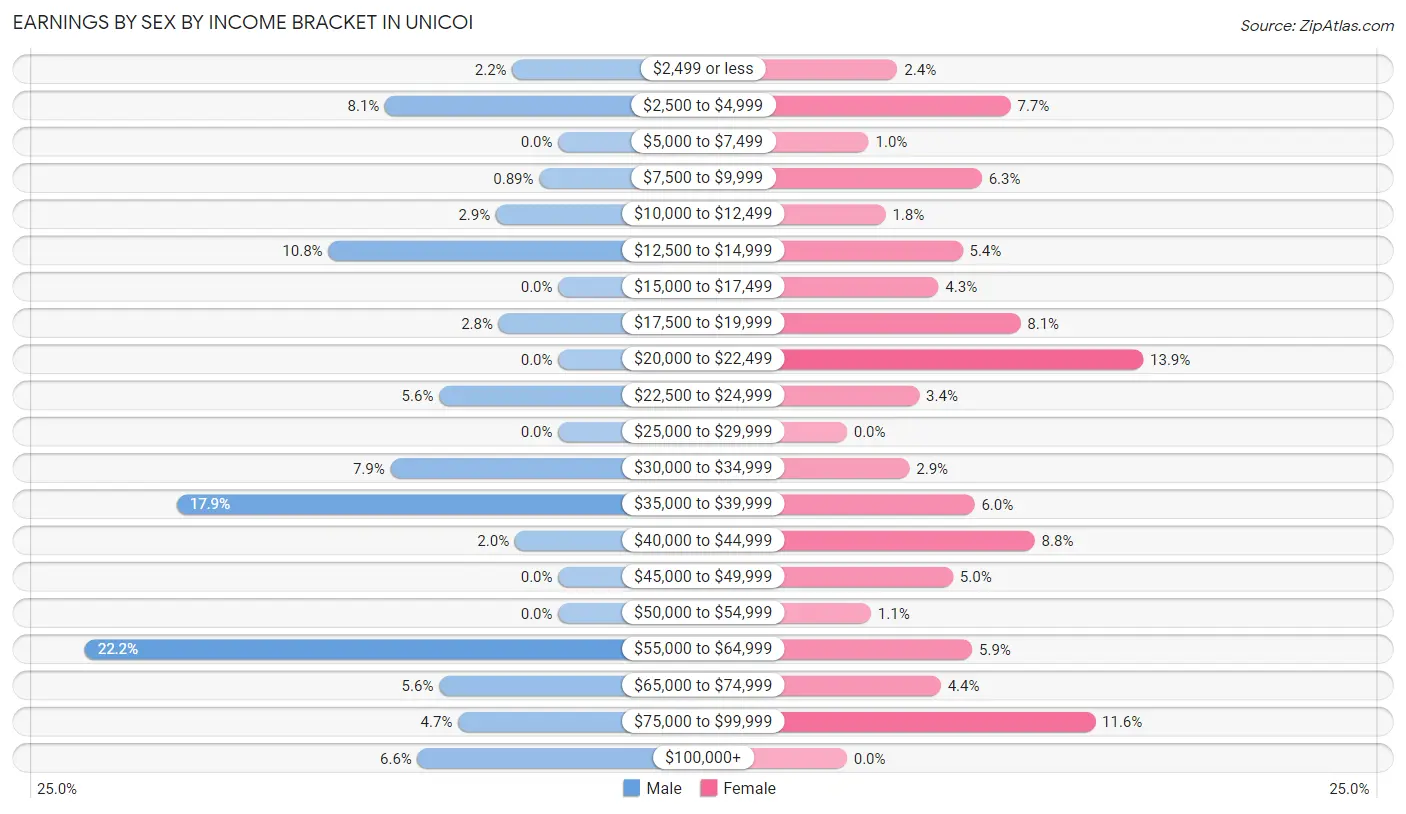
| Income | Male | Female |
| $2,499 or less | 17 (2.1%) | 21 (2.4%) |
| $2,500 to $4,999 | 64 (8.1%) | 68 (7.7%) |
| $5,000 to $7,499 | 0 (0.0%) | 9 (1.0%) |
| $7,500 to $9,999 | 7 (0.9%) | 56 (6.3%) |
| $10,000 to $12,499 | 23 (2.9%) | 16 (1.8%) |
| $12,500 to $14,999 | 85 (10.8%) | 48 (5.4%) |
| $15,000 to $17,499 | 0 (0.0%) | 38 (4.3%) |
| $17,500 to $19,999 | 22 (2.8%) | 72 (8.1%) |
| $20,000 to $22,499 | 0 (0.0%) | 123 (13.9%) |
| $22,500 to $24,999 | 44 (5.6%) | 30 (3.4%) |
| $25,000 to $29,999 | 0 (0.0%) | 0 (0.0%) |
| $30,000 to $34,999 | 62 (7.9%) | 26 (2.9%) |
| $35,000 to $39,999 | 141 (17.9%) | 53 (6.0%) |
| $40,000 to $44,999 | 16 (2.0%) | 78 (8.8%) |
| $45,000 to $49,999 | 0 (0.0%) | 44 (5.0%) |
| $50,000 to $54,999 | 0 (0.0%) | 10 (1.1%) |
| $55,000 to $64,999 | 175 (22.2%) | 52 (5.9%) |
| $65,000 to $74,999 | 44 (5.6%) | 39 (4.4%) |
| $75,000 to $99,999 | 37 (4.7%) | 103 (11.6%) |
| $100,000+ | 52 (6.6%) | 0 (0.0%) |
| Total | 789 (100.0%) | 886 (100.0%) |
Earnings by Sex by Educational Attainment in Unicoi
Average earnings in Unicoi are $37,969 for men and $22,583 for women, a difference of 40.5%. Men with an educational attainment of graduate degree enjoy the highest average annual earnings of $62,500, while those with college or associate's degree education earn the least with $37,578. Women with an educational attainment of graduate degree earn the most with the average annual earnings of $75,296, while those with college or associate's degree education have the smallest earnings of $15,156.
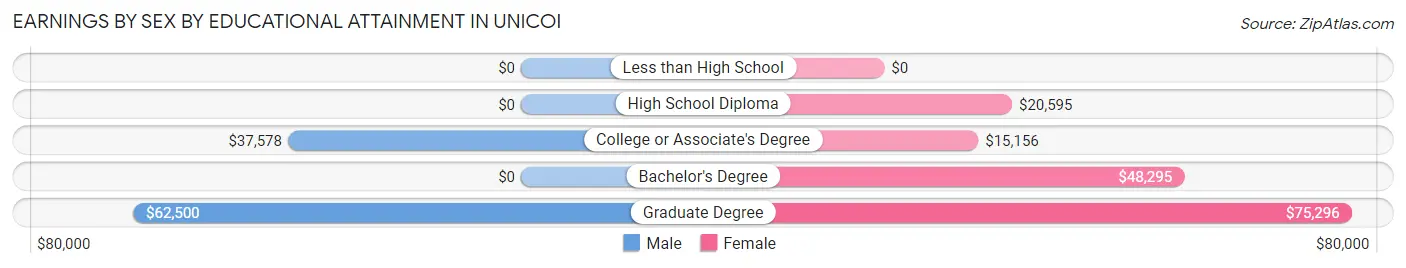
| Educational Attainment | Male Income | Female Income |
| Less than High School | - | - |
| High School Diploma | - | - |
| College or Associate's Degree | $37,578 | $15,156 |
| Bachelor's Degree | - | - |
| Graduate Degree | $62,500 | $75,296 |
| Total | $37,969 | $22,583 |
Family Income in Unicoi
Family Income Brackets in Unicoi
According to the Unicoi family income data, there are 204 families falling into the $100,000 to $149,999 income range, which is the most common income bracket and makes up 20.5% of all families. Conversely, the less than $10,000 income bracket is the least frequent group with only 13 families (1.3%) belonging to this category.
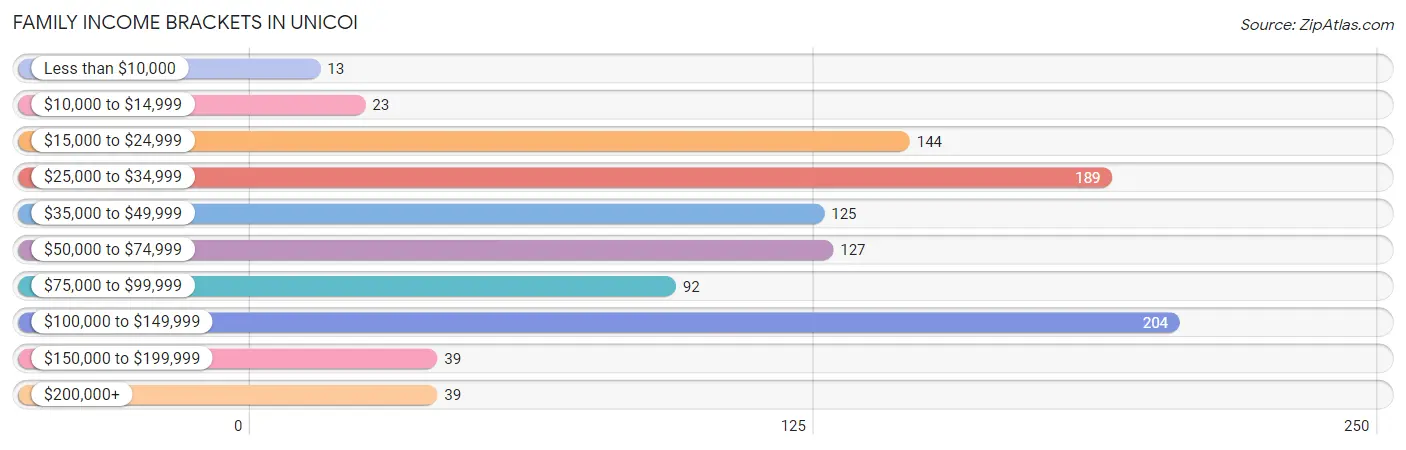
| Income Bracket | # Families | % Families |
| Less than $10,000 | 13 | 1.3% |
| $10,000 to $14,999 | 23 | 2.3% |
| $15,000 to $24,999 | 144 | 14.5% |
| $25,000 to $34,999 | 189 | 19.0% |
| $35,000 to $49,999 | 125 | 12.6% |
| $50,000 to $74,999 | 127 | 12.8% |
| $75,000 to $99,999 | 92 | 9.2% |
| $100,000 to $149,999 | 204 | 20.5% |
| $150,000 to $199,999 | 39 | 3.9% |
| $200,000+ | 39 | 3.9% |
Family Income by Famaliy Size in Unicoi
5-person families (71 | 7.1%) account for the highest median family income in Unicoi with $49,613 per family, while 2-person families (617 | 62.0%) have the highest median income of $21,858 per family member.
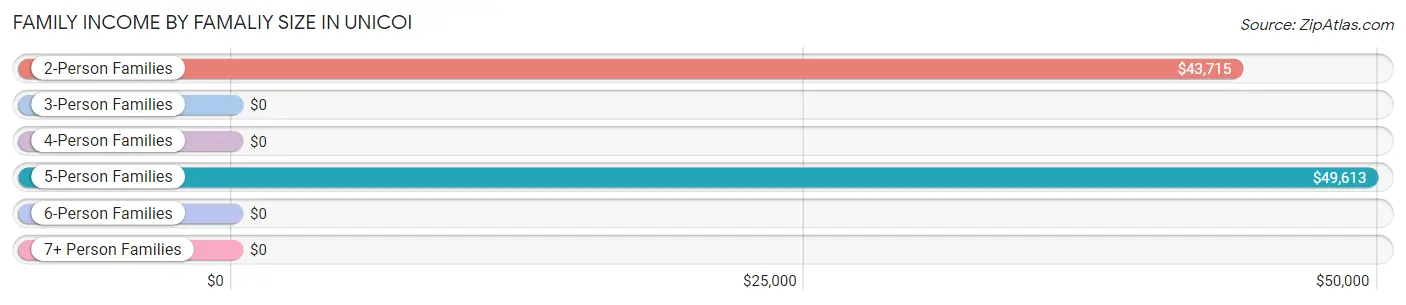
| Income Bracket | # Families | Median Income |
| 2-Person Families | 617 (62.0%) | $43,715 |
| 3-Person Families | 152 (15.3%) | $0 |
| 4-Person Families | 113 (11.4%) | $0 |
| 5-Person Families | 71 (7.1%) | $49,613 |
| 6-Person Families | 0 (0.0%) | $0 |
| 7+ Person Families | 42 (4.2%) | $0 |
| Total | 995 (100.0%) | $50,182 |
Family Income by Number of Earners in Unicoi
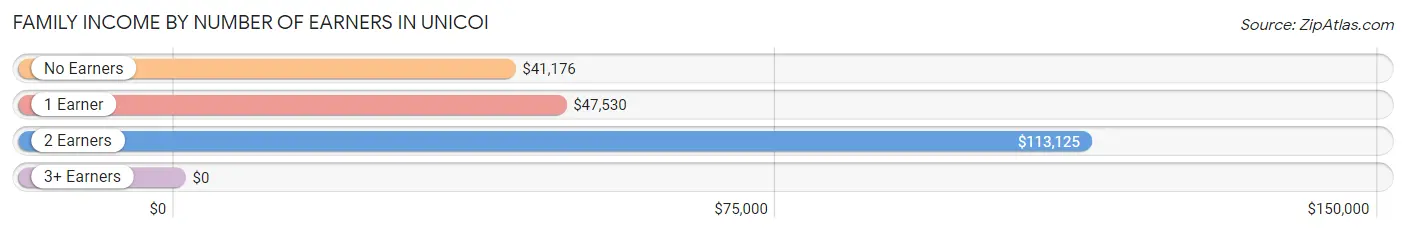
| Number of Earners | # Families | Median Income |
| No Earners | 226 (22.7%) | $41,176 |
| 1 Earner | 333 (33.5%) | $47,530 |
| 2 Earners | 392 (39.4%) | $113,125 |
| 3+ Earners | 44 (4.4%) | $0 |
| Total | 995 (100.0%) | $50,182 |
Household Income in Unicoi
Household Income Brackets in Unicoi
With 316 households falling in the category, the $35,000 to $49,999 income range is the most frequent in Unicoi, accounting for 17.9% of all households. In contrast, only 39 households (2.2%) fall into the $150,000 to $199,999 income bracket, making it the least populous group.
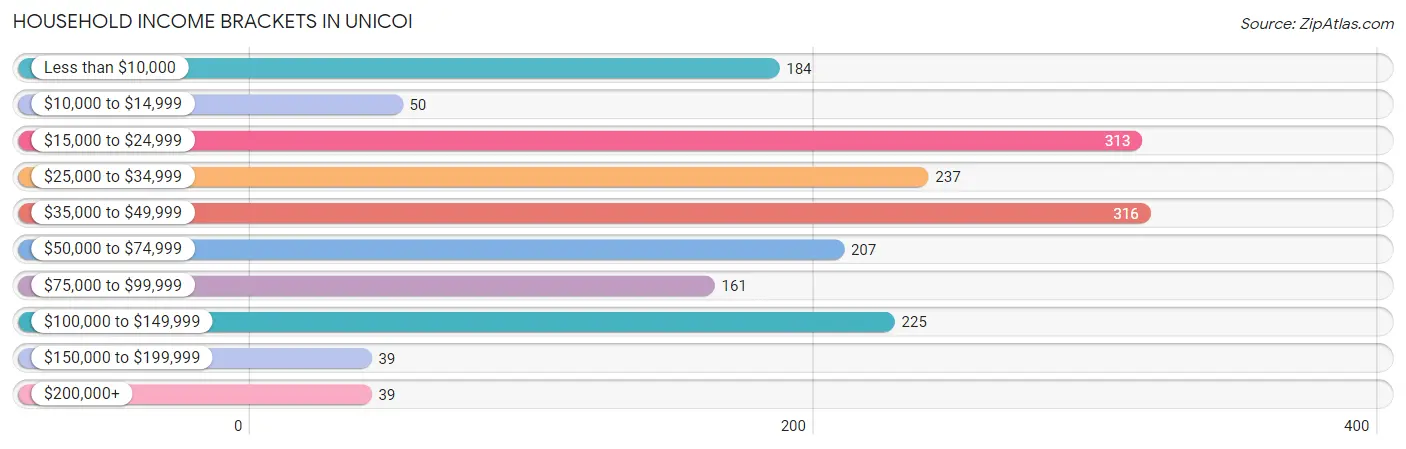
| Income Bracket | # Households | % Households |
| Less than $10,000 | 184 | 10.4% |
| $10,000 to $14,999 | 50 | 2.8% |
| $15,000 to $24,999 | 313 | 17.7% |
| $25,000 to $34,999 | 237 | 13.4% |
| $35,000 to $49,999 | 316 | 17.9% |
| $50,000 to $74,999 | 207 | 11.7% |
| $75,000 to $99,999 | 161 | 9.1% |
| $100,000 to $149,999 | 225 | 12.7% |
| $150,000 to $199,999 | 39 | 2.2% |
| $200,000+ | 39 | 2.2% |
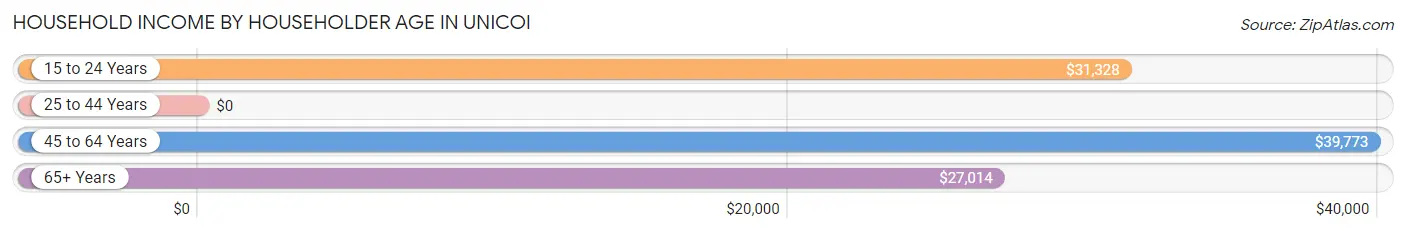
Household Income by Householder Age in Unicoi
The median household income in Unicoi is $39,236, with the highest median household income of $39,773 found in the 45 to 64 years age bracket for the primary householder. A total of 620 households (35.1%) fall into this category. Meanwhile, the 25 to 44 years age bracket for the primary householder has the lowest median household income of $0, with 409 households (23.1%) in this group.
| Income Bracket | # Households | Median Income |
| 15 to 24 Years | 96 (5.4%) | $31,328 |
| 25 to 44 Years | 409 (23.1%) | $0 |
| 45 to 64 Years | 620 (35.1%) | $39,773 |
| 65+ Years | 643 (36.4%) | $27,014 |
| Total | 1,768 (100.0%) | $39,236 |
Poverty in Unicoi
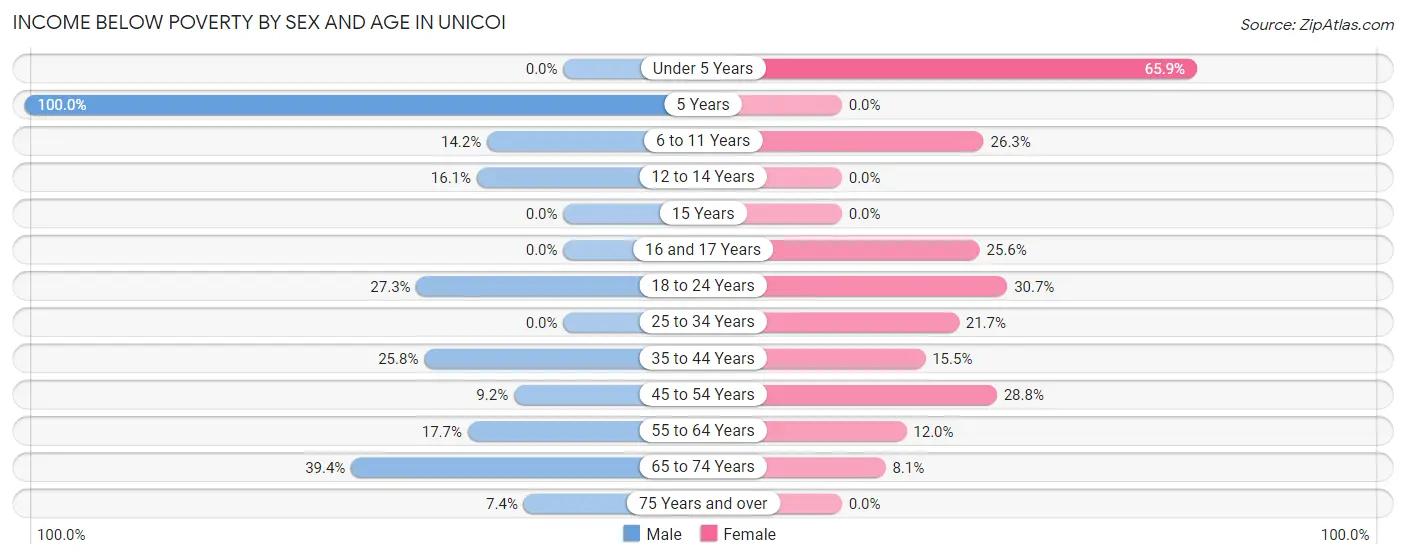
Income Below Poverty by Sex and Age in Unicoi
With 16.1% poverty level for males and 16.6% for females among the residents of Unicoi, 5 year old males and under 5 year old females are the most vulnerable to poverty, with 19 males (100.0%) and 29 females (65.9%) in their respective age groups living below the poverty level.
| Age Bracket | Male | Female |
| Under 5 Years | 0 (0.0%) | 29 (65.9%) |
| 5 Years | 19 (100.0%) | 0 (0.0%) |
| 6 to 11 Years | 17 (14.2%) | 10 (26.3%) |
| 12 to 14 Years | 13 (16.1%) | 0 (0.0%) |
| 15 Years | 0 (0.0%) | 0 (0.0%) |
| 16 and 17 Years | 0 (0.0%) | 11 (25.6%) |
| 18 to 24 Years | 27 (27.3%) | 66 (30.7%) |
| 25 to 34 Years | 0 (0.0%) | 38 (21.7%) |
| 35 to 44 Years | 63 (25.8%) | 22 (15.5%) |
| 45 to 54 Years | 23 (9.2%) | 67 (28.8%) |
| 55 to 64 Years | 55 (17.7%) | 49 (12.0%) |
| 65 to 74 Years | 76 (39.4%) | 20 (8.1%) |
| 75 Years and over | 15 (7.3%) | 0 (0.0%) |
| Total | 308 (16.1%) | 312 (16.6%) |
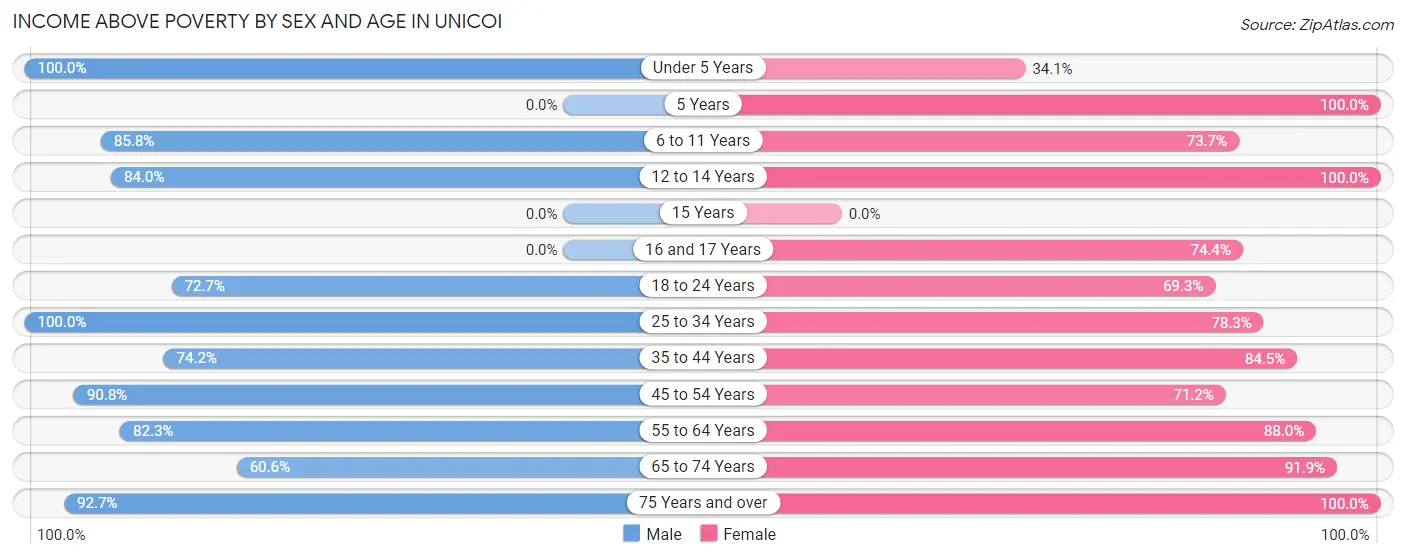
Income Above Poverty by Sex and Age in Unicoi
According to the poverty statistics in Unicoi, males aged under 5 years and females aged 5 years are the age groups that are most secure financially, with 100.0% of males and 100.0% of females in these age groups living above the poverty line.
| Age Bracket | Male | Female |
| Under 5 Years | 126 (100.0%) | 15 (34.1%) |
| 5 Years | 0 (0.0%) | 16 (100.0%) |
| 6 to 11 Years | 103 (85.8%) | 28 (73.7%) |
| 12 to 14 Years | 68 (84.0%) | 46 (100.0%) |
| 15 Years | 0 (0.0%) | 0 (0.0%) |
| 16 and 17 Years | 0 (0.0%) | 32 (74.4%) |
| 18 to 24 Years | 72 (72.7%) | 149 (69.3%) |
| 25 to 34 Years | 264 (100.0%) | 137 (78.3%) |
| 35 to 44 Years | 181 (74.2%) | 120 (84.5%) |
| 45 to 54 Years | 228 (90.8%) | 166 (71.2%) |
| 55 to 64 Years | 255 (82.3%) | 360 (88.0%) |
| 65 to 74 Years | 117 (60.6%) | 227 (91.9%) |
| 75 Years and over | 189 (92.6%) | 267 (100.0%) |
| Total | 1,603 (83.9%) | 1,563 (83.4%) |
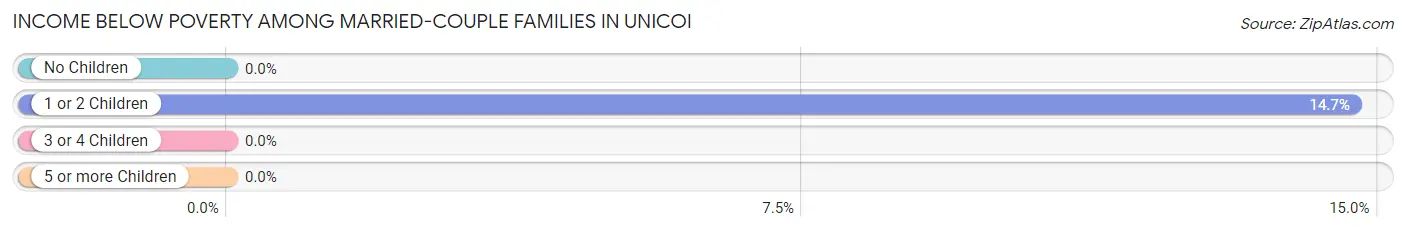
Income Below Poverty Among Married-Couple Families in Unicoi
The poverty statistics for married-couple families in Unicoi show that 3.9% or 27 of the total 689 families live below the poverty line. Families with 1 or 2 children have the highest poverty rate of 14.7%, comprising of 27 families. On the other hand, families with no children have the lowest poverty rate of 0.0%, which includes 0 families.
| Children | Above Poverty | Below Poverty |
| No Children | 443 (100.0%) | 0 (0.0%) |
| 1 or 2 Children | 157 (85.3%) | 27 (14.7%) |
| 3 or 4 Children | 62 (100.0%) | 0 (0.0%) |
| 5 or more Children | 0 (0.0%) | 0 (0.0%) |
| Total | 662 (96.1%) | 27 (3.9%) |
Income Below Poverty Among Single-Parent Households in Unicoi
According to the poverty data in Unicoi, 19.3% or 11 single-father households and 30.9% or 77 single-mother households are living below the poverty line. Among single-father households, those with no children have the highest poverty rate, with 11 households (19.3%) experiencing poverty. Likewise, among single-mother households, those with 1 or 2 children have the highest poverty rate, with 66 households (79.5%) falling below the poverty line.
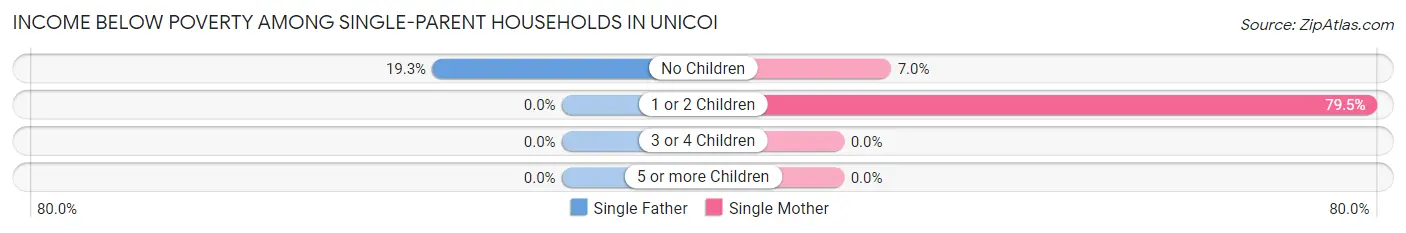
| Children | Single Father | Single Mother |
| No Children | 11 (19.3%) | 11 (7.0%) |
| 1 or 2 Children | 0 (0.0%) | 66 (79.5%) |
| 3 or 4 Children | 0 (0.0%) | 0 (0.0%) |
| 5 or more Children | 0 (0.0%) | 0 (0.0%) |
| Total | 11 (19.3%) | 77 (30.9%) |
Income Below Poverty Among Married-Couple vs Single-Parent Households in Unicoi
The poverty data for Unicoi shows that 27 of the married-couple family households (3.9%) and 88 of the single-parent households (28.8%) are living below the poverty level. Within the married-couple family households, those with 1 or 2 children have the highest poverty rate, with 27 households (14.7%) falling below the poverty line. Among the single-parent households, those with 1 or 2 children have the highest poverty rate, with 66 household (79.5%) living below poverty.
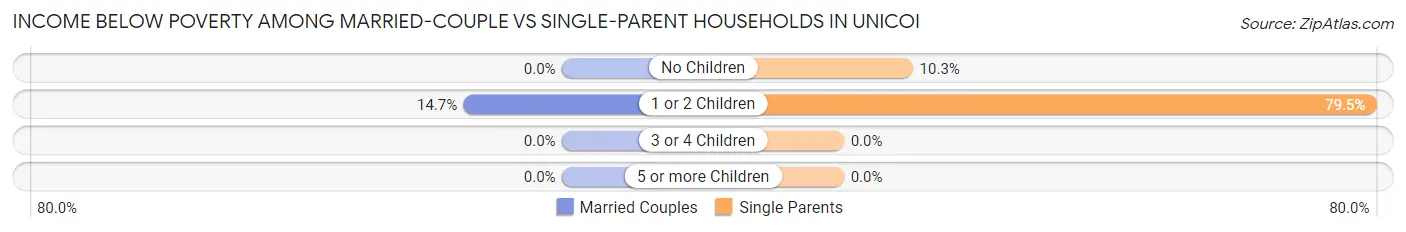
| Children | Married-Couple Families | Single-Parent Households |
| No Children | 0 (0.0%) | 22 (10.3%) |
| 1 or 2 Children | 27 (14.7%) | 66 (79.5%) |
| 3 or 4 Children | 0 (0.0%) | 0 (0.0%) |
| 5 or more Children | 0 (0.0%) | 0 (0.0%) |
| Total | 27 (3.9%) | 88 (28.8%) |
Race in Unicoi
The most populous races in Unicoi are White / Caucasian (3,593 | 94.5%), Hispanic or Latino (398 | 10.5%), and Two or more Races (157 | 4.1%).
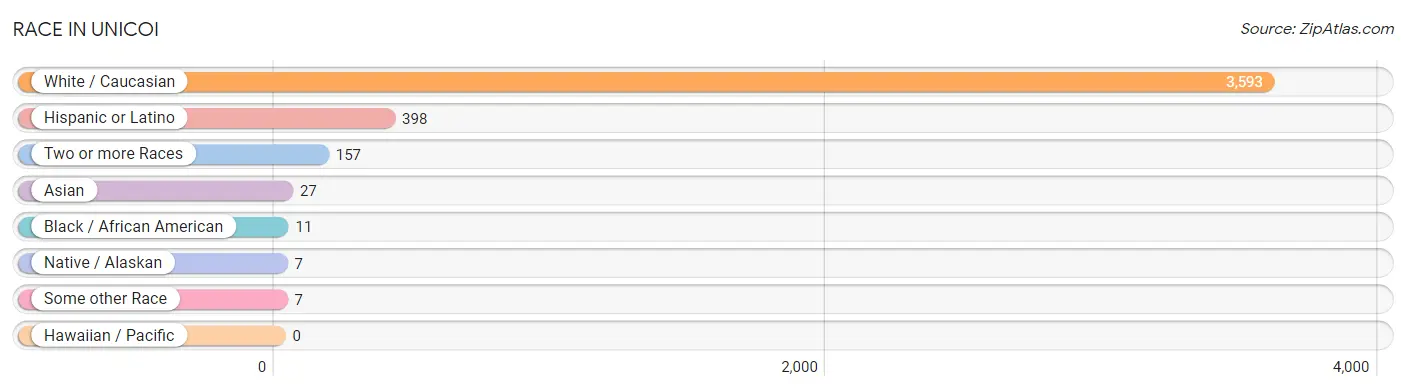
| Race | # Population | % Population |
| Asian | 27 | 0.7% |
| Black / African American | 11 | 0.3% |
| Hawaiian / Pacific | 0 | 0.0% |
| Hispanic or Latino | 398 | 10.5% |
| Native / Alaskan | 7 | 0.2% |
| White / Caucasian | 3,593 | 94.5% |
| Two or more Races | 157 | 4.1% |
| Some other Race | 7 | 0.2% |
| Total | 3,802 | 100.0% |
Ancestry in Unicoi
The most populous ancestries reported in Unicoi are Irish (555 | 14.6%), American (509 | 13.4%), English (465 | 12.2%), German (247 | 6.5%), and Scotch-Irish (197 | 5.2%), together accounting for 51.9% of all Unicoi residents.
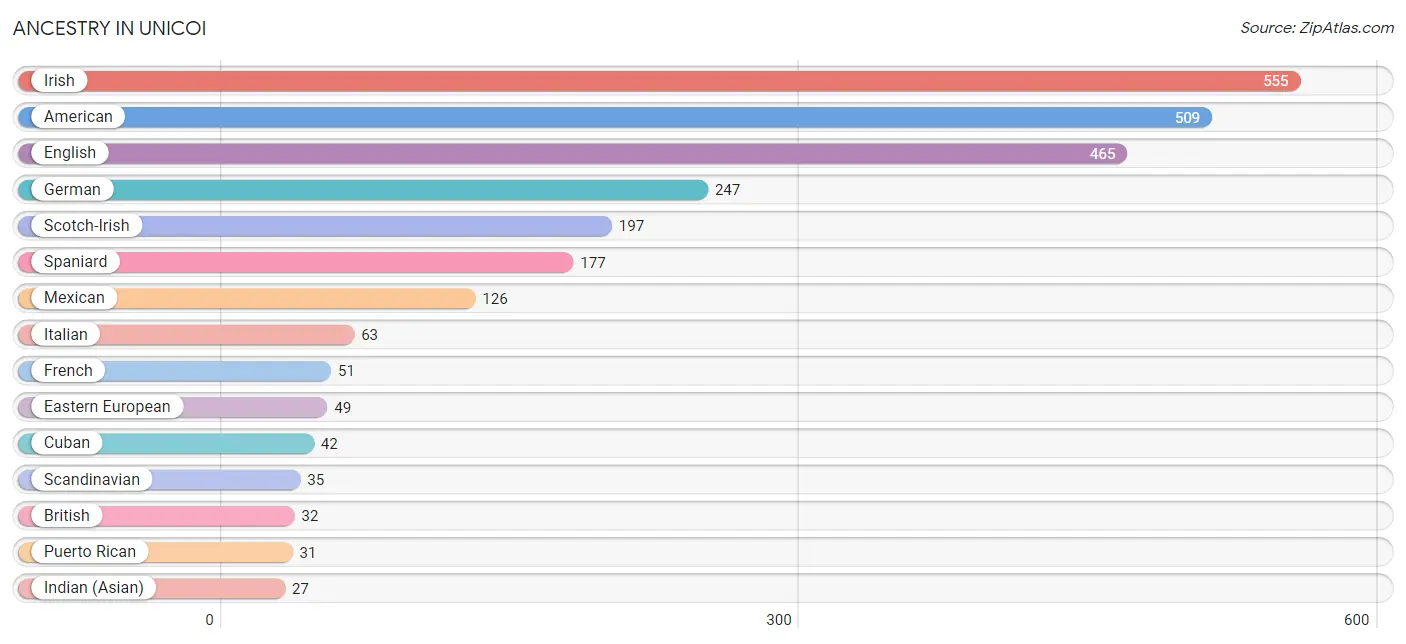
| Ancestry | # Population | % Population |
| American | 509 | 13.4% |
| Apache | 7 | 0.2% |
| British | 32 | 0.8% |
| Choctaw | 16 | 0.4% |
| Cuban | 42 | 1.1% |
| Dutch | 22 | 0.6% |
| Eastern European | 49 | 1.3% |
| English | 465 | 12.2% |
| French | 51 | 1.3% |
| German | 247 | 6.5% |
| Indian (Asian) | 27 | 0.7% |
| Irish | 555 | 14.6% |
| Italian | 63 | 1.7% |
| Mexican | 126 | 3.3% |
| Norwegian | 20 | 0.5% |
| Puerto Rican | 31 | 0.8% |
| Scandinavian | 35 | 0.9% |
| Scotch-Irish | 197 | 5.2% |
| Scottish | 26 | 0.7% |
| Slavic | 17 | 0.4% |
| Spaniard | 177 | 4.7% |
| Welsh | 17 | 0.4% | View All 22 Rows |
Immigrants in Unicoi
The most numerous immigrant groups reported in Unicoi came from Central America (126 | 3.3%), Latin America (126 | 3.3%), Mexico (126 | 3.3%), Asia (27 | 0.7%), and Malaysia (27 | 0.7%), together accounting for 11.3% of all Unicoi residents.
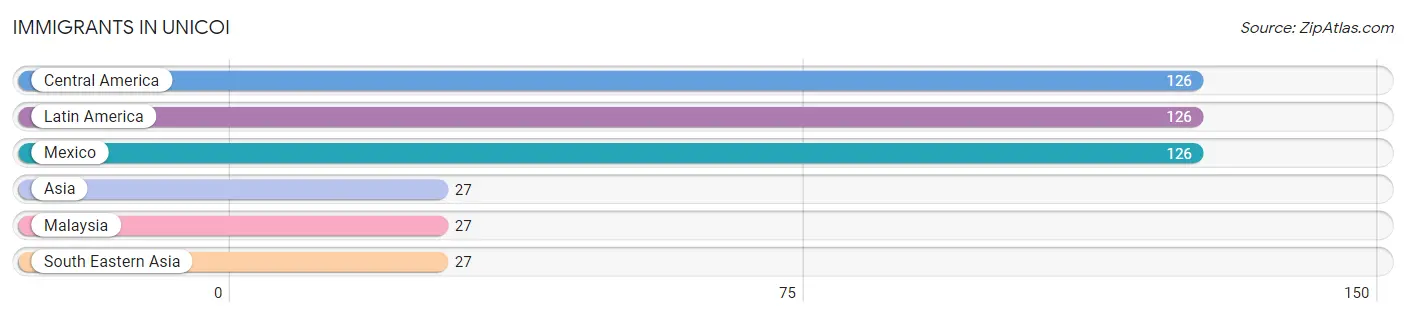
| Immigration Origin | # Population | % Population |
| Asia | 27 | 0.7% |
| Central America | 126 | 3.3% |
| Latin America | 126 | 3.3% |
| Malaysia | 27 | 0.7% |
| Mexico | 126 | 3.3% |
| South Eastern Asia | 27 | 0.7% | View All 6 Rows |
Sex and Age in Unicoi
Sex and Age in Unicoi
The most populous age groups in Unicoi are 50 to 54 Years (199 | 10.3%) for men and 55 to 59 Years (219 | 11.7%) for women.
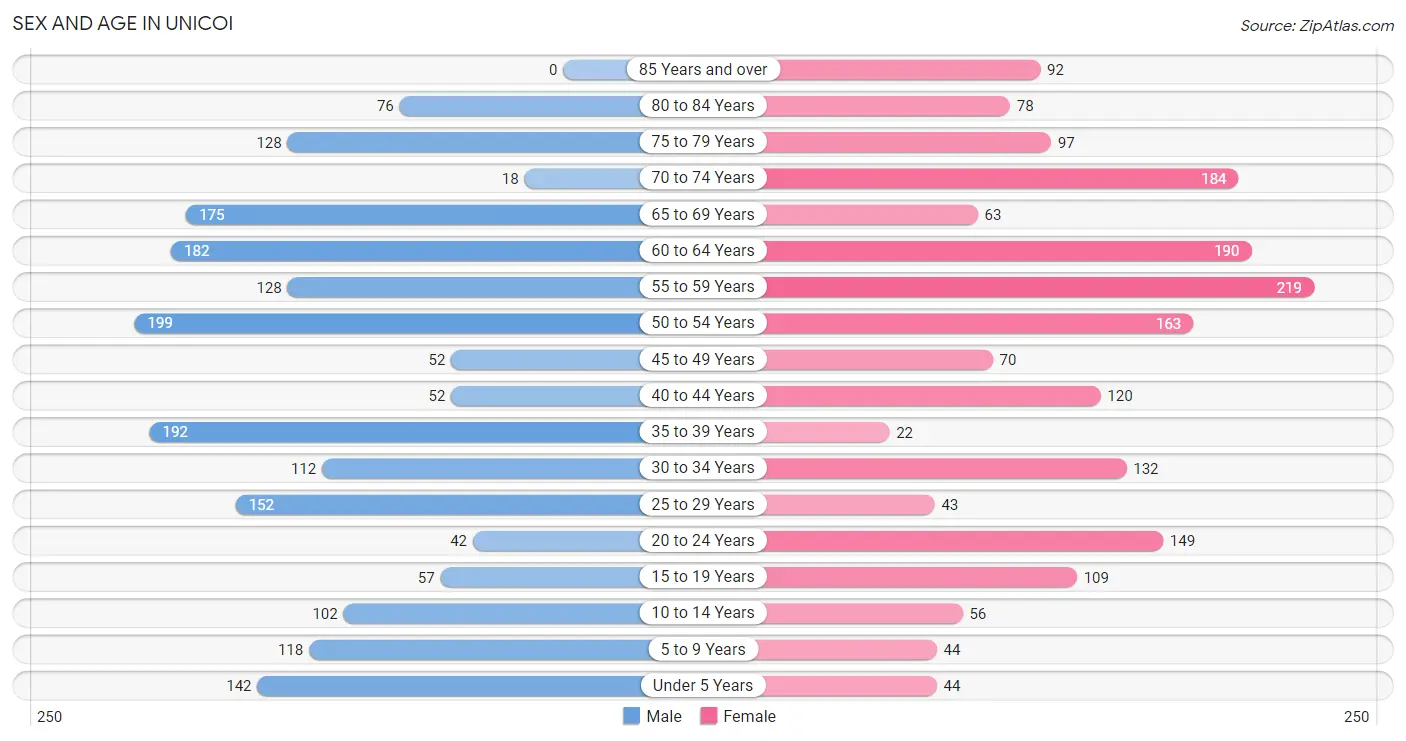
| Age Bracket | Male | Female |
| Under 5 Years | 142 (7.4%) | 44 (2.4%) |
| 5 to 9 Years | 118 (6.1%) | 44 (2.4%) |
| 10 to 14 Years | 102 (5.3%) | 56 (3.0%) |
| 15 to 19 Years | 57 (3.0%) | 109 (5.8%) |
| 20 to 24 Years | 42 (2.2%) | 149 (8.0%) |
| 25 to 29 Years | 152 (7.9%) | 43 (2.3%) |
| 30 to 34 Years | 112 (5.8%) | 132 (7.0%) |
| 35 to 39 Years | 192 (10.0%) | 22 (1.2%) |
| 40 to 44 Years | 52 (2.7%) | 120 (6.4%) |
| 45 to 49 Years | 52 (2.7%) | 70 (3.7%) |
| 50 to 54 Years | 199 (10.3%) | 163 (8.7%) |
| 55 to 59 Years | 128 (6.6%) | 219 (11.7%) |
| 60 to 64 Years | 182 (9.4%) | 190 (10.1%) |
| 65 to 69 Years | 175 (9.1%) | 63 (3.4%) |
| 70 to 74 Years | 18 (0.9%) | 184 (9.8%) |
| 75 to 79 Years | 128 (6.6%) | 97 (5.2%) |
| 80 to 84 Years | 76 (3.9%) | 78 (4.2%) |
| 85 Years and over | 0 (0.0%) | 92 (4.9%) |
| Total | 1,927 (100.0%) | 1,875 (100.0%) |
Families and Households in Unicoi
Median Family Size in Unicoi
The median family size in Unicoi is 2.74 persons per family, with married-couple families (689 | 69.3%) accounting for the largest median family size of 2.94 persons per family. On the other hand, single male/father families (57 | 5.7%) represent the smallest median family size with 2.19 persons per family.
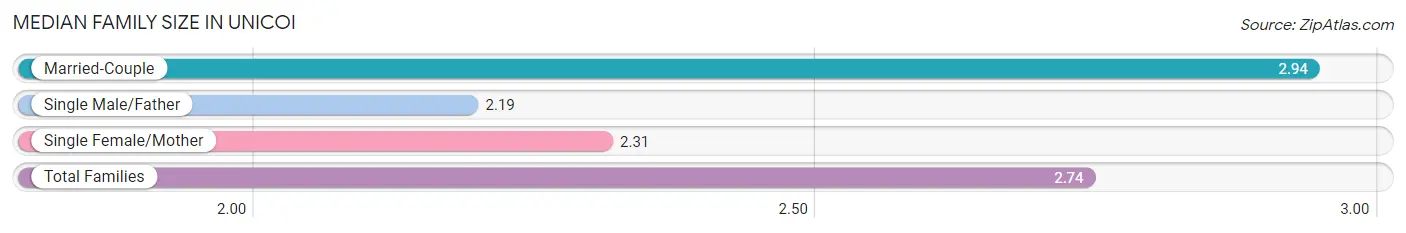
| Family Type | # Families | Family Size |
| Married-Couple | 689 (69.3%) | 2.94 |
| Single Male/Father | 57 (5.7%) | 2.19 |
| Single Female/Mother | 249 (25.0%) | 2.31 |
| Total Families | 995 (100.0%) | 2.74 |
Median Household Size in Unicoi
The median household size in Unicoi is 2.07 persons per household, with married-couple households (689 | 39.0%) accounting for the largest median household size of 2.94 persons per household. non-family households (773 | 43.7%) represent the smallest median household size with 1.17 persons per household.
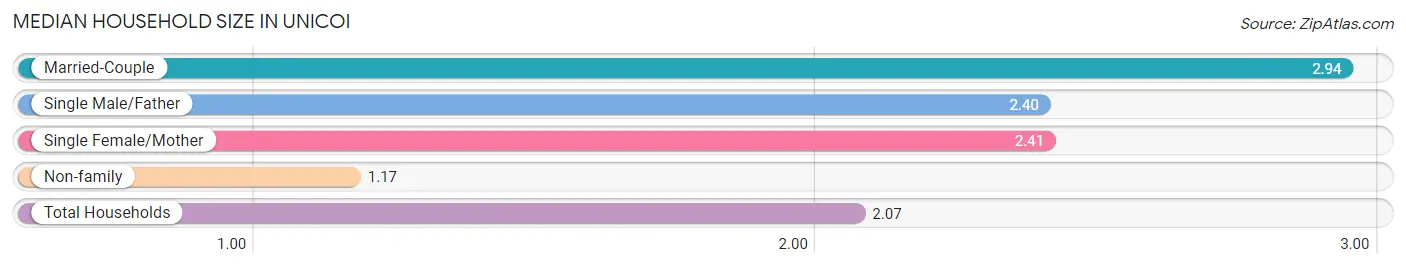
| Household Type | # Households | Household Size |
| Married-Couple | 689 (39.0%) | 2.94 |
| Single Male/Father | 57 (3.2%) | 2.40 |
| Single Female/Mother | 249 (14.1%) | 2.41 |
| Non-family | 773 (43.7%) | 1.17 |
| Total Households | 1,768 (100.0%) | 2.07 |
Household Size by Marriage Status in Unicoi
Out of a total of 1,768 households in Unicoi, 995 (56.3%) are family households, while 773 (43.7%) are nonfamily households. The most numerous type of family households are 2-person households, comprising 606, and the most common type of nonfamily households are 1-person households, comprising 618.
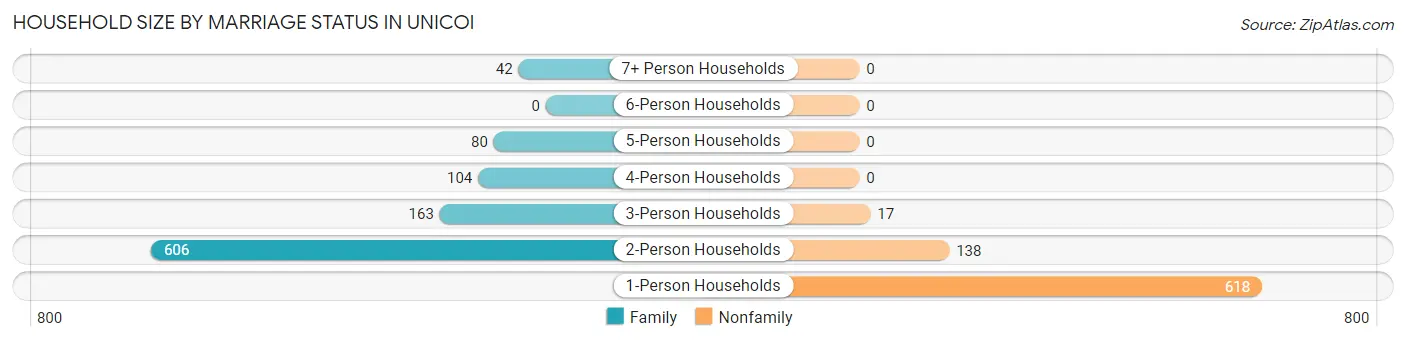
| Household Size | Family Households | Nonfamily Households |
| 1-Person Households | - | 618 (34.9%) |
| 2-Person Households | 606 (34.3%) | 138 (7.8%) |
| 3-Person Households | 163 (9.2%) | 17 (1.0%) |
| 4-Person Households | 104 (5.9%) | 0 (0.0%) |
| 5-Person Households | 80 (4.5%) | 0 (0.0%) |
| 6-Person Households | 0 (0.0%) | 0 (0.0%) |
| 7+ Person Households | 42 (2.4%) | 0 (0.0%) |
| Total | 995 (56.3%) | 773 (43.7%) |
Female Fertility in Unicoi
Fertility by Age in Unicoi
Average fertility rate in Unicoi is 61.0 births per 1,000 women. Women in the age bracket of 35 to 50 years have the highest fertility rate with 165.0 births per 1,000 women. Women in the age bracket of 35 to 50 years acount for 100.0% of all women with births.
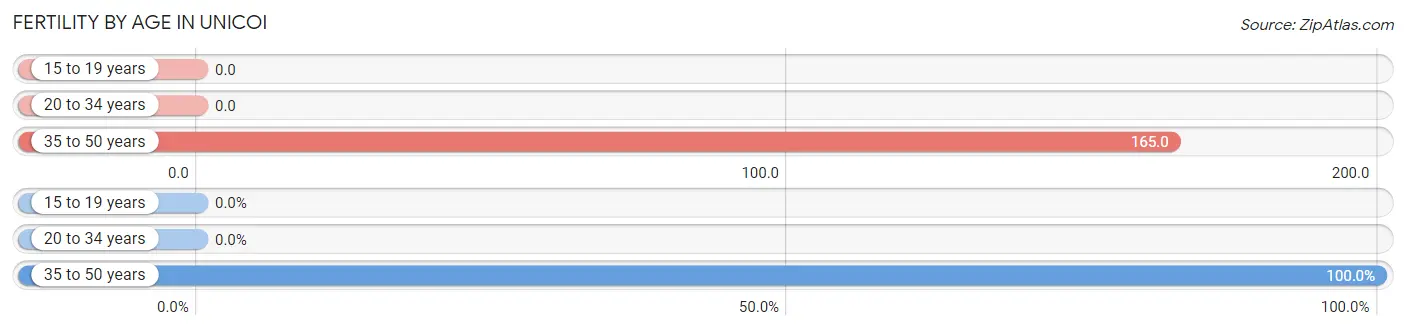
| Age Bracket | Women with Births | Births / 1,000 Women |
| 15 to 19 years | 0 (0.0%) | 0.0 |
| 20 to 34 years | 0 (0.0%) | 0.0 |
| 35 to 50 years | 42 (100.0%) | 165.0 |
| Total | 42 (100.0%) | 61.0 |
Fertility by Age by Marriage Status in Unicoi
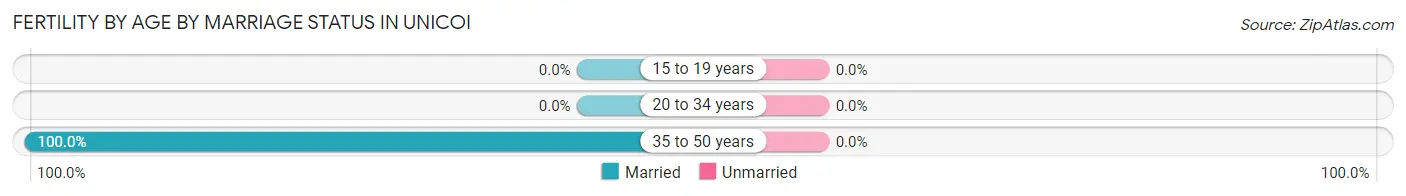
| Age Bracket | Married | Unmarried |
| 15 to 19 years | 0 (0.0%) | 0 (0.0%) |
| 20 to 34 years | 0 (0.0%) | 0 (0.0%) |
| 35 to 50 years | 42 (100.0%) | 0 (0.0%) |
| Total | 42 (100.0%) | 0 (0.0%) |
Fertility by Education in Unicoi
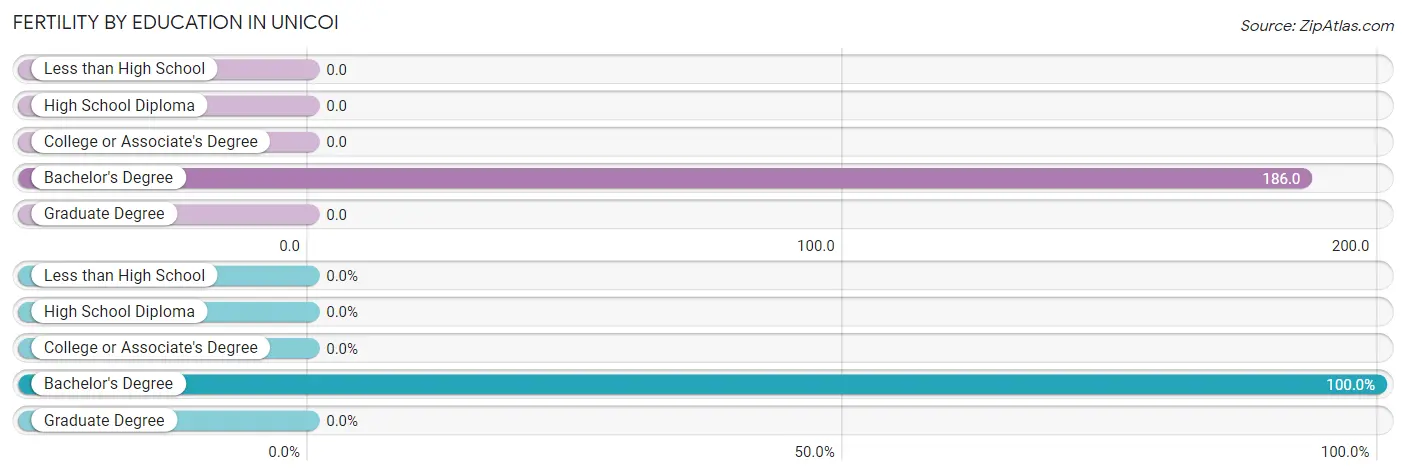
| Educational Attainment | Women with Births | Births / 1,000 Women |
| Less than High School | 0 (0.0%) | 0.0 |
| High School Diploma | 0 (0.0%) | 0.0 |
| College or Associate's Degree | 0 (0.0%) | 0.0 |
| Bachelor's Degree | 42 (100.0%) | 186.0 |
| Graduate Degree | 0 (0.0%) | 0.0 |
| Total | 42 (100.0%) | 61.0 |
Fertility by Education by Marriage Status in Unicoi
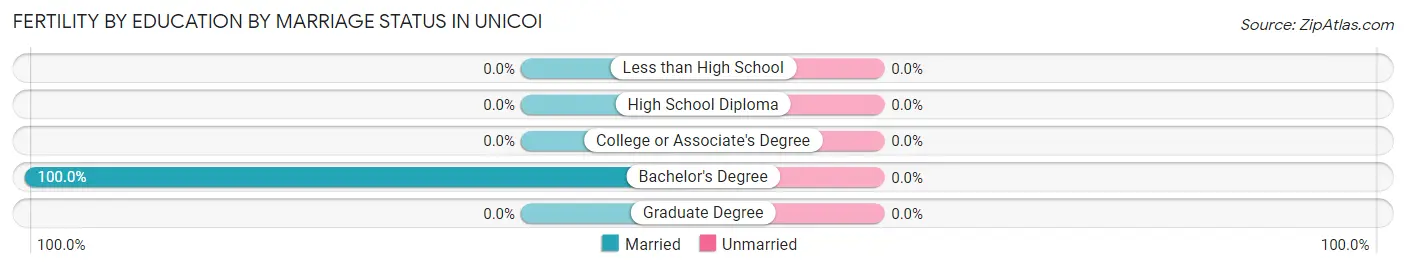
| Educational Attainment | Married | Unmarried |
| Less than High School | 0 (0.0%) | 0 (0.0%) |
| High School Diploma | 0 (0.0%) | 0 (0.0%) |
| College or Associate's Degree | 0 (0.0%) | 0 (0.0%) |
| Bachelor's Degree | 42 (100.0%) | 0 (0.0%) |
| Graduate Degree | 0 (0.0%) | 0 (0.0%) |
| Total | 42 (100.0%) | 0 (0.0%) |
Employment Characteristics in Unicoi
Employment by Class of Employer in Unicoi
Among the 1,415 employed individuals in Unicoi, private company employees (833 | 58.9%), local government employees (164 | 11.6%), and not-for-profit organizations (145 | 10.2%) make up the most common classes of employment.
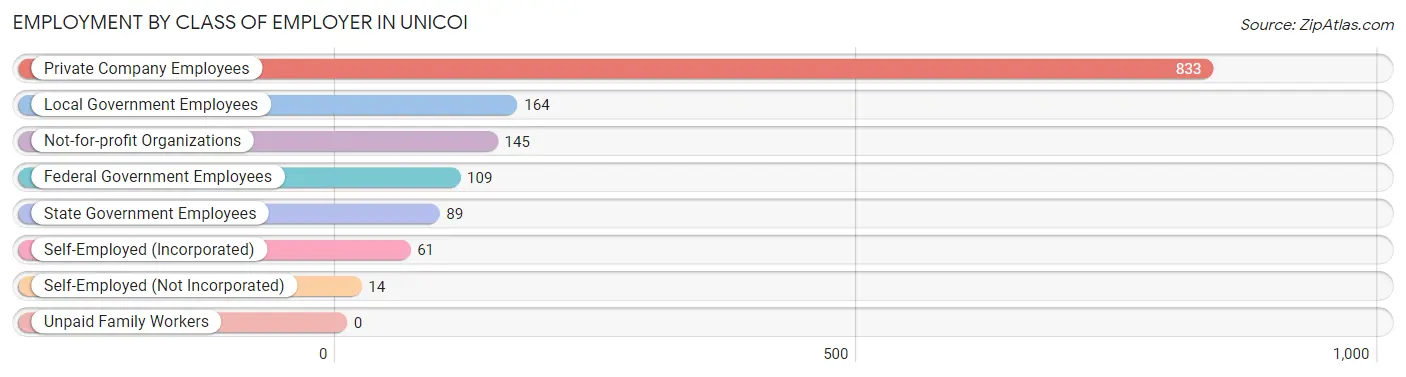
| Employer Class | # Employees | % Employees |
| Private Company Employees | 833 | 58.9% |
| Self-Employed (Incorporated) | 61 | 4.3% |
| Self-Employed (Not Incorporated) | 14 | 1.0% |
| Not-for-profit Organizations | 145 | 10.2% |
| Local Government Employees | 164 | 11.6% |
| State Government Employees | 89 | 6.3% |
| Federal Government Employees | 109 | 7.7% |
| Unpaid Family Workers | 0 | 0.0% |
| Total | 1,415 | 100.0% |
Employment Status by Age in Unicoi
According to the labor force statistics for Unicoi, out of the total population over 16 years of age (3,296), 47.6% or 1,569 individuals are in the labor force, with 7.9% or 124 of them unemployed. The age group with the highest labor force participation rate is 45 to 54 years, with 84.1% or 407 individuals in the labor force. Within the labor force, the 16 to 19 years age range has the highest percentage of unemployed individuals, with 37.5% or 9 of them being unemployed.
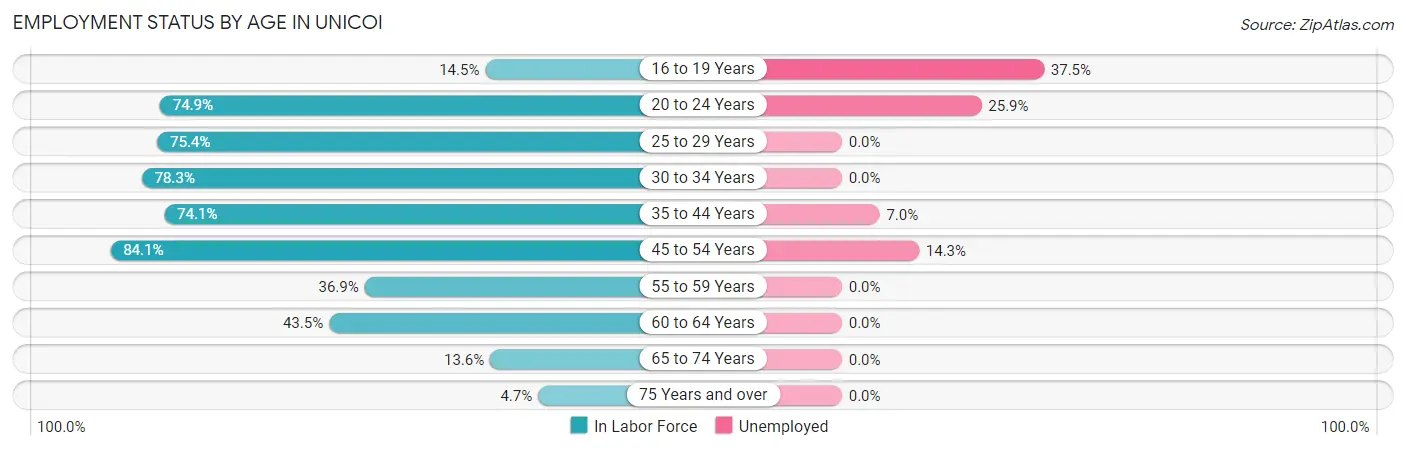
| Age Bracket | In Labor Force | Unemployed |
| 16 to 19 Years | 24 (14.5%) | 9 (37.5%) |
| 20 to 24 Years | 143 (74.9%) | 37 (25.9%) |
| 25 to 29 Years | 147 (75.4%) | 0 (0.0%) |
| 30 to 34 Years | 191 (78.3%) | 0 (0.0%) |
| 35 to 44 Years | 286 (74.1%) | 20 (7.0%) |
| 45 to 54 Years | 407 (84.1%) | 58 (14.3%) |
| 55 to 59 Years | 128 (36.9%) | 0 (0.0%) |
| 60 to 64 Years | 162 (43.5%) | 0 (0.0%) |
| 65 to 74 Years | 60 (13.6%) | 0 (0.0%) |
| 75 Years and over | 22 (4.7%) | 0 (0.0%) |
| Total | 1,569 (47.6%) | 124 (7.9%) |
Employment Status by Educational Attainment in Unicoi
According to labor force statistics for Unicoi, 65.1% of individuals (1,320) out of the total population between 25 and 64 years of age (2,028) are in the labor force, with 5.9% or 78 of them being unemployed. The group with the highest labor force participation rate are those with the educational attainment of bachelor's degree or higher, with 90.7% or 450 individuals in the labor force. Within the labor force, individuals with less than high school education have the highest percentage of unemployment, with 34.7% or 17 of them being unemployed.
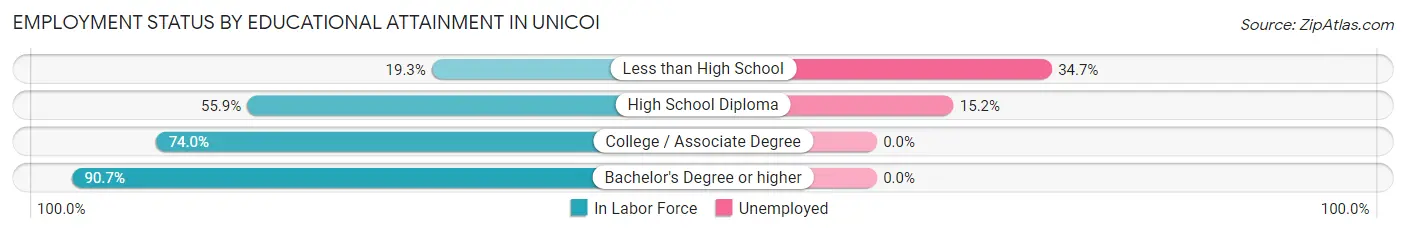
| Educational Attainment | In Labor Force | Unemployed |
| Less than High School | 49 (19.3%) | 88 (34.7%) |
| High School Diploma | 381 (55.9%) | 104 (15.2%) |
| College / Associate Degree | 441 (74.0%) | 0 (0.0%) |
| Bachelor's Degree or higher | 450 (90.7%) | 0 (0.0%) |
| Total | 1,320 (65.1%) | 120 (5.9%) |
Employment Occupations by Sex in Unicoi
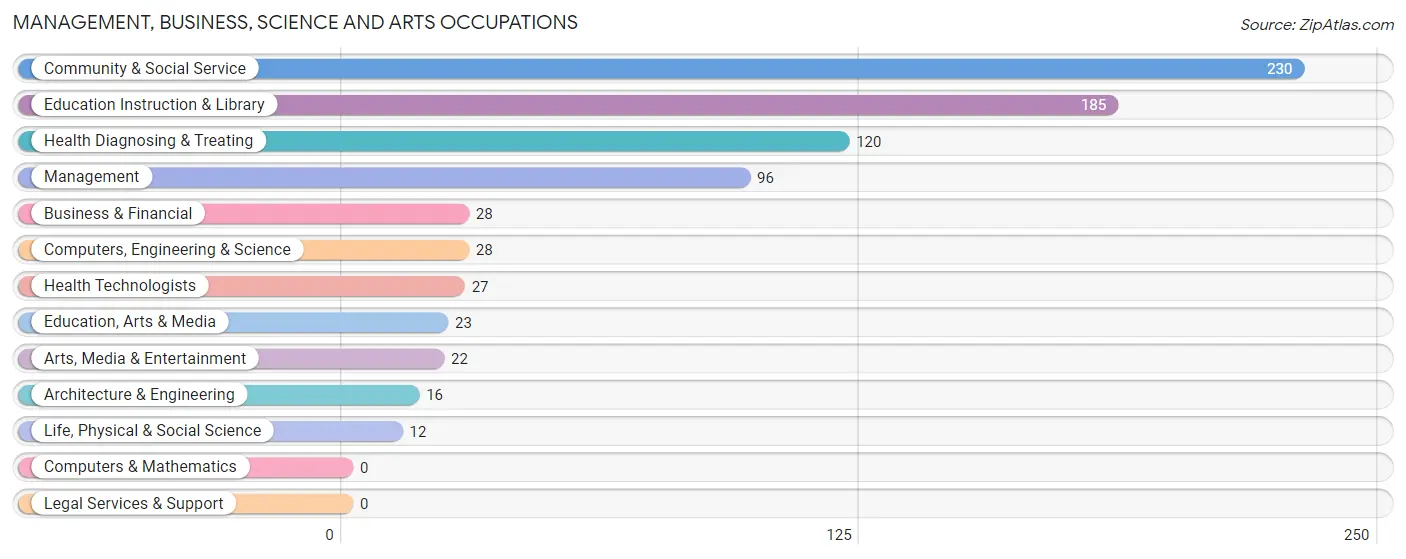
Management, Business, Science and Arts Occupations
The most common Management, Business, Science and Arts occupations in Unicoi are Community & Social Service (230 | 16.4%), Education Instruction & Library (185 | 13.2%), Health Diagnosing & Treating (120 | 8.5%), Management (96 | 6.8%), and Business & Financial (28 | 2.0%).
Management, Business, Science and Arts Occupations by Sex
Within the Management, Business, Science and Arts occupations in Unicoi, the most male-oriented occupations are Computers, Engineering & Science (100.0%), Architecture & Engineering (100.0%), and Life, Physical & Social Science (100.0%), while the most female-oriented occupations are Business & Financial (100.0%), Education, Arts & Media (100.0%), and Health Technologists (100.0%).
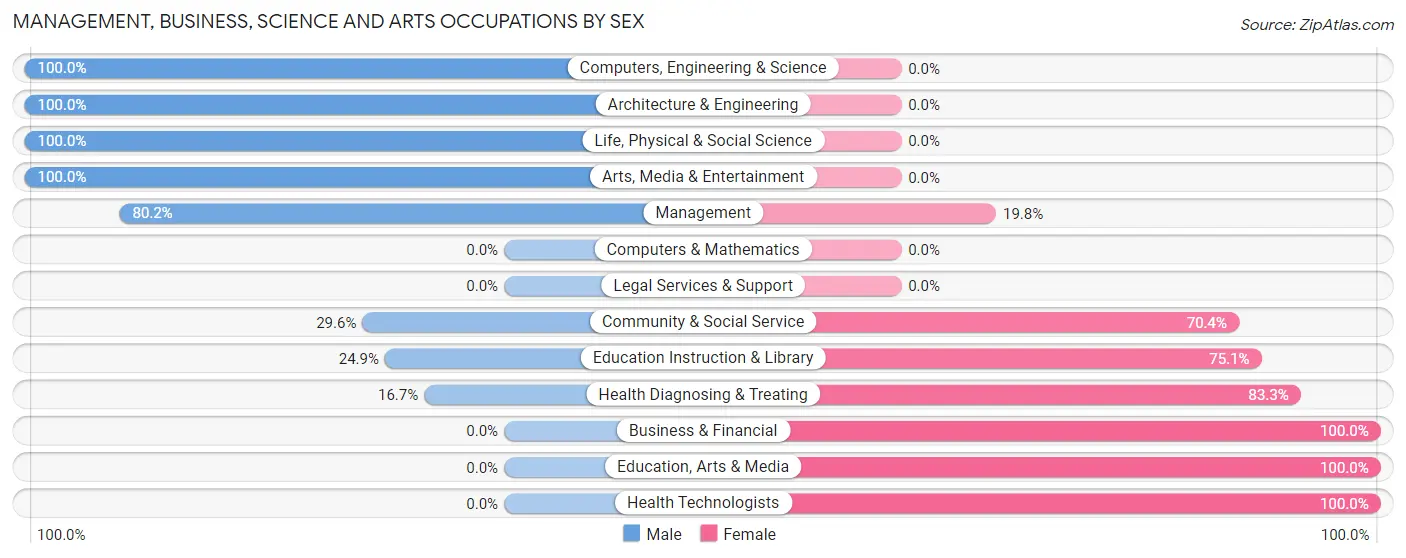
| Occupation | Male | Female |
| Management | 77 (80.2%) | 19 (19.8%) |
| Business & Financial | 0 (0.0%) | 28 (100.0%) |
| Computers, Engineering & Science | 28 (100.0%) | 0 (0.0%) |
| Computers & Mathematics | 0 (0.0%) | 0 (0.0%) |
| Architecture & Engineering | 16 (100.0%) | 0 (0.0%) |
| Life, Physical & Social Science | 12 (100.0%) | 0 (0.0%) |
| Community & Social Service | 68 (29.6%) | 162 (70.4%) |
| Education, Arts & Media | 0 (0.0%) | 23 (100.0%) |
| Legal Services & Support | 0 (0.0%) | 0 (0.0%) |
| Education Instruction & Library | 46 (24.9%) | 139 (75.1%) |
| Arts, Media & Entertainment | 22 (100.0%) | 0 (0.0%) |
| Health Diagnosing & Treating | 20 (16.7%) | 100 (83.3%) |
| Health Technologists | 0 (0.0%) | 27 (100.0%) |
| Total (Category) | 193 (38.5%) | 309 (61.6%) |
| Total (Overall) | 691 (49.1%) | 716 (50.9%) |
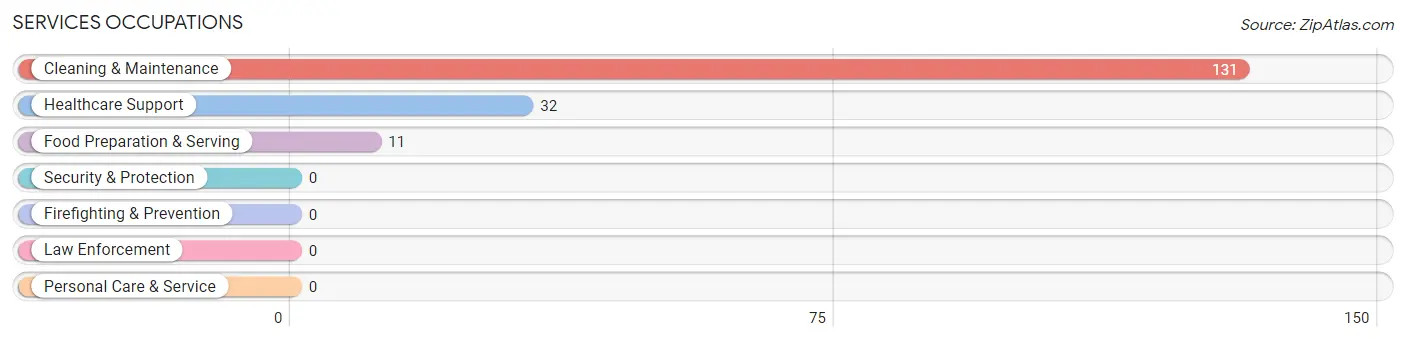
Services Occupations
The most common Services occupations in Unicoi are Cleaning & Maintenance (131 | 9.3%), Healthcare Support (32 | 2.3%), and Food Preparation & Serving (11 | 0.8%).
Services Occupations by Sex
Within the Services occupations in Unicoi, the most male-oriented occupations are Cleaning & Maintenance (79.4%), and Healthcare Support (46.9%), while the most female-oriented occupations are Food Preparation & Serving (100.0%), Healthcare Support (53.1%), and Cleaning & Maintenance (20.6%).

| Occupation | Male | Female |
| Healthcare Support | 15 (46.9%) | 17 (53.1%) |
| Security & Protection | 0 (0.0%) | 0 (0.0%) |
| Firefighting & Prevention | 0 (0.0%) | 0 (0.0%) |
| Law Enforcement | 0 (0.0%) | 0 (0.0%) |
| Food Preparation & Serving | 0 (0.0%) | 11 (100.0%) |
| Cleaning & Maintenance | 104 (79.4%) | 27 (20.6%) |
| Personal Care & Service | 0 (0.0%) | 0 (0.0%) |
| Total (Category) | 119 (68.4%) | 55 (31.6%) |
| Total (Overall) | 691 (49.1%) | 716 (50.9%) |
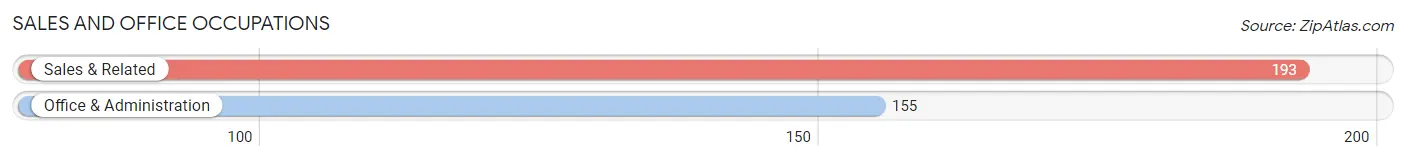
Sales and Office Occupations
The most common Sales and Office occupations in Unicoi are Sales & Related (193 | 13.7%), and Office & Administration (155 | 11.0%).
Sales and Office Occupations by Sex
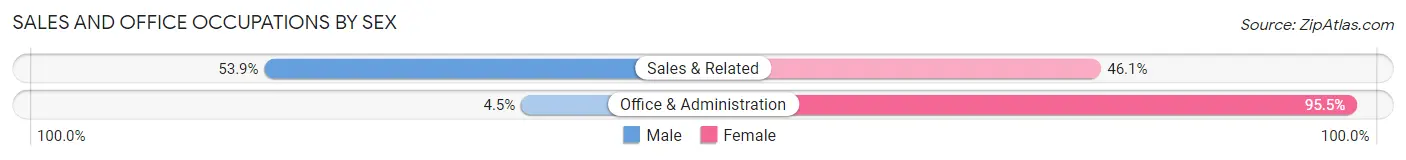
| Occupation | Male | Female |
| Sales & Related | 104 (53.9%) | 89 (46.1%) |
| Office & Administration | 7 (4.5%) | 148 (95.5%) |
| Total (Category) | 111 (31.9%) | 237 (68.1%) |
| Total (Overall) | 691 (49.1%) | 716 (50.9%) |
Natural Resources, Construction and Maintenance Occupations
The most common Natural Resources, Construction and Maintenance occupations in Unicoi are Construction & Extraction (108 | 7.7%), Installation, Maintenance & Repair (43 | 3.1%), and Farming, Fishing & Forestry (7 | 0.5%).
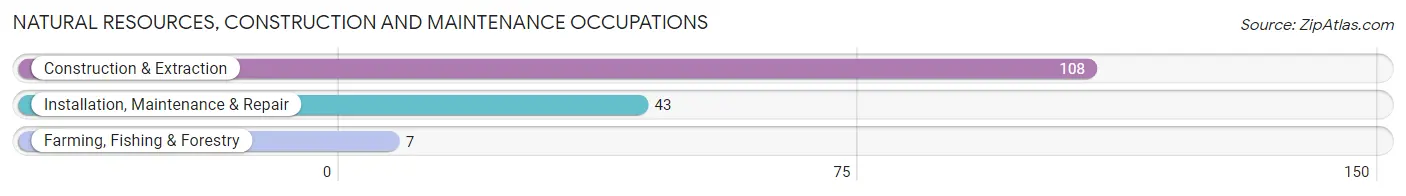
Natural Resources, Construction and Maintenance Occupations by Sex
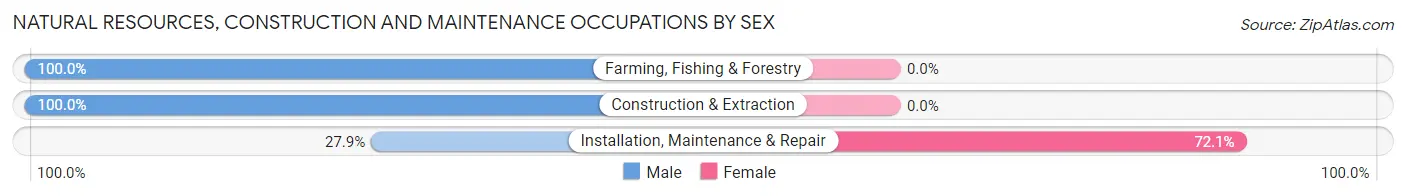
| Occupation | Male | Female |
| Farming, Fishing & Forestry | 7 (100.0%) | 0 (0.0%) |
| Construction & Extraction | 108 (100.0%) | 0 (0.0%) |
| Installation, Maintenance & Repair | 12 (27.9%) | 31 (72.1%) |
| Total (Category) | 127 (80.4%) | 31 (19.6%) |
| Total (Overall) | 691 (49.1%) | 716 (50.9%) |
Production, Transportation and Moving Occupations
The most common Production, Transportation and Moving occupations in Unicoi are Production (182 | 12.9%), Transportation (27 | 1.9%), and Material Moving (16 | 1.1%).
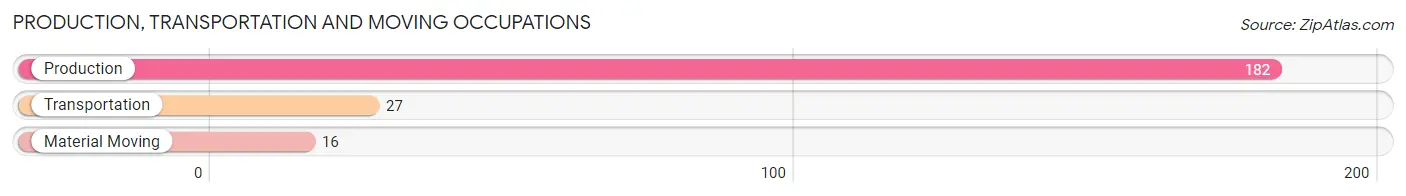
Production, Transportation and Moving Occupations by Sex
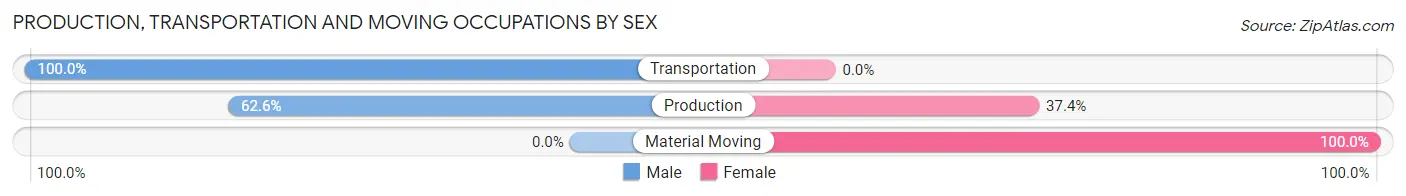
| Occupation | Male | Female |
| Production | 114 (62.6%) | 68 (37.4%) |
| Transportation | 27 (100.0%) | 0 (0.0%) |
| Material Moving | 0 (0.0%) | 16 (100.0%) |
| Total (Category) | 141 (62.7%) | 84 (37.3%) |
| Total (Overall) | 691 (49.1%) | 716 (50.9%) |
Employment Industries by Sex in Unicoi
Employment Industries in Unicoi
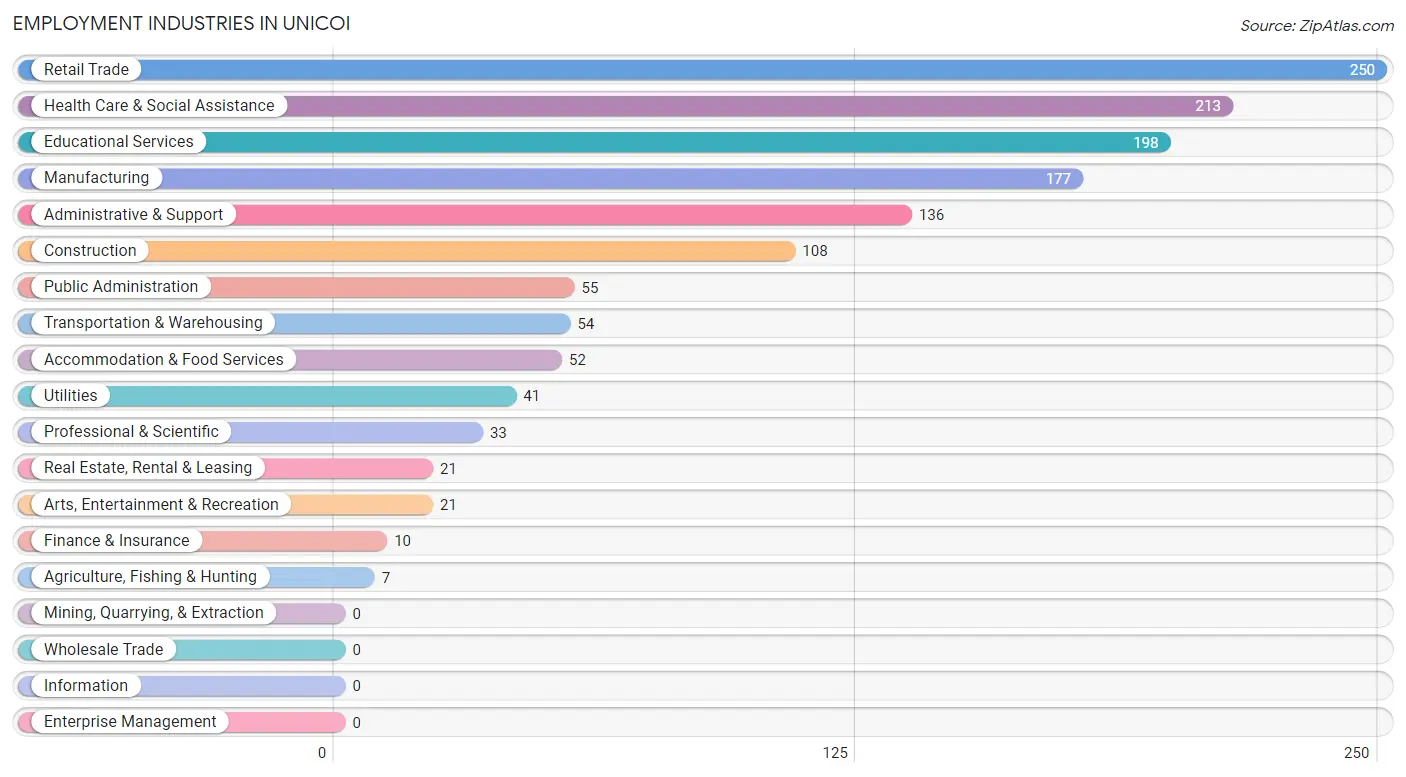
The major employment industries in Unicoi include Retail Trade (250 | 17.8%), Health Care & Social Assistance (213 | 15.1%), Educational Services (198 | 14.1%), Manufacturing (177 | 12.6%), and Administrative & Support (136 | 9.7%).
Employment Industries by Sex in Unicoi
The Unicoi industries that see more men than women are Agriculture, Fishing & Hunting (100.0%), Construction (100.0%), and Arts, Entertainment & Recreation (100.0%), whereas the industries that tend to have a higher number of women are Finance & Insurance (100.0%), Health Care & Social Assistance (83.6%), and Accommodation & Food Services (78.8%).
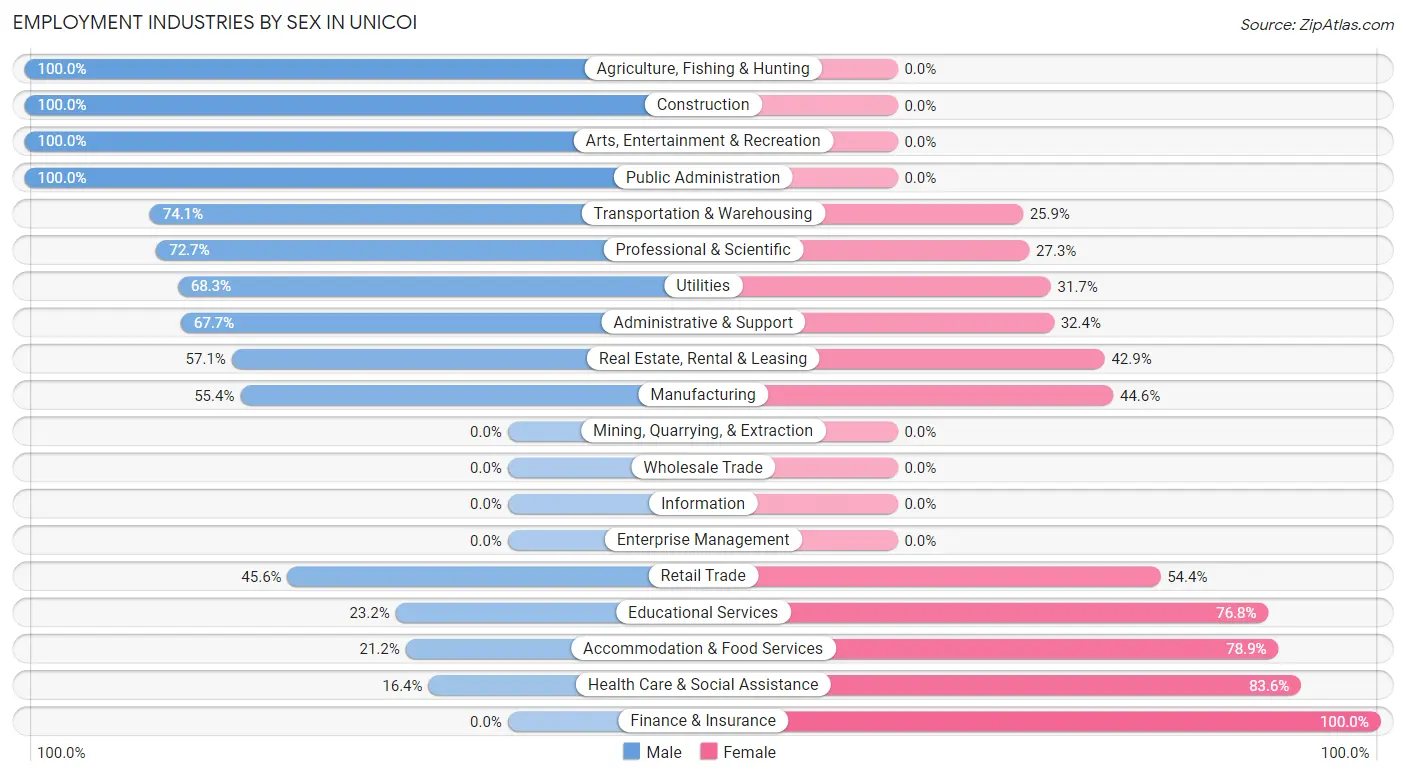
| Industry | Male | Female |
| Agriculture, Fishing & Hunting | 7 (100.0%) | 0 (0.0%) |
| Mining, Quarrying, & Extraction | 0 (0.0%) | 0 (0.0%) |
| Construction | 108 (100.0%) | 0 (0.0%) |
| Manufacturing | 98 (55.4%) | 79 (44.6%) |
| Wholesale Trade | 0 (0.0%) | 0 (0.0%) |
| Retail Trade | 114 (45.6%) | 136 (54.4%) |
| Transportation & Warehousing | 40 (74.1%) | 14 (25.9%) |
| Utilities | 28 (68.3%) | 13 (31.7%) |
| Information | 0 (0.0%) | 0 (0.0%) |
| Finance & Insurance | 0 (0.0%) | 10 (100.0%) |
| Real Estate, Rental & Leasing | 12 (57.1%) | 9 (42.9%) |
| Professional & Scientific | 24 (72.7%) | 9 (27.3%) |
| Enterprise Management | 0 (0.0%) | 0 (0.0%) |
| Administrative & Support | 92 (67.6%) | 44 (32.4%) |
| Educational Services | 46 (23.2%) | 152 (76.8%) |
| Health Care & Social Assistance | 35 (16.4%) | 178 (83.6%) |
| Arts, Entertainment & Recreation | 21 (100.0%) | 0 (0.0%) |
| Accommodation & Food Services | 11 (21.1%) | 41 (78.8%) |
| Public Administration | 55 (100.0%) | 0 (0.0%) |
| Total | 691 (49.1%) | 716 (50.9%) |
Education in Unicoi
School Enrollment in Unicoi
The most common levels of schooling among the 473 students in Unicoi are middle school (114 | 24.1%), high school (108 | 22.8%), and elementary school (81 | 17.1%).
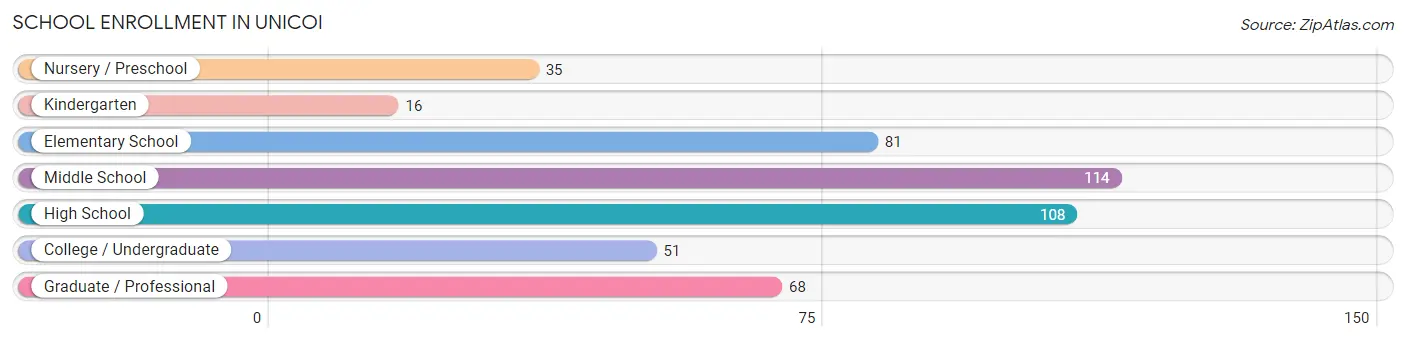
| School Level | # Students | % Students |
| Nursery / Preschool | 35 | 7.4% |
| Kindergarten | 16 | 3.4% |
| Elementary School | 81 | 17.1% |
| Middle School | 114 | 24.1% |
| High School | 108 | 22.8% |
| College / Undergraduate | 51 | 10.8% |
| Graduate / Professional | 68 | 14.4% |
| Total | 473 | 100.0% |
School Enrollment by Age by Funding Source in Unicoi
Out of a total of 473 students who are enrolled in schools in Unicoi, 160 (33.8%) attend a private institution, while the remaining 313 (66.2%) are enrolled in public schools. The age group of 20 to 24 year olds has the highest likelihood of being enrolled in private schools, with 5 (100.0% in the age bracket) enrolled. Conversely, the age group of 3 to 4 year olds has the lowest likelihood of being enrolled in a private school, with 16 (100.0% in the age bracket) attending a public institution.
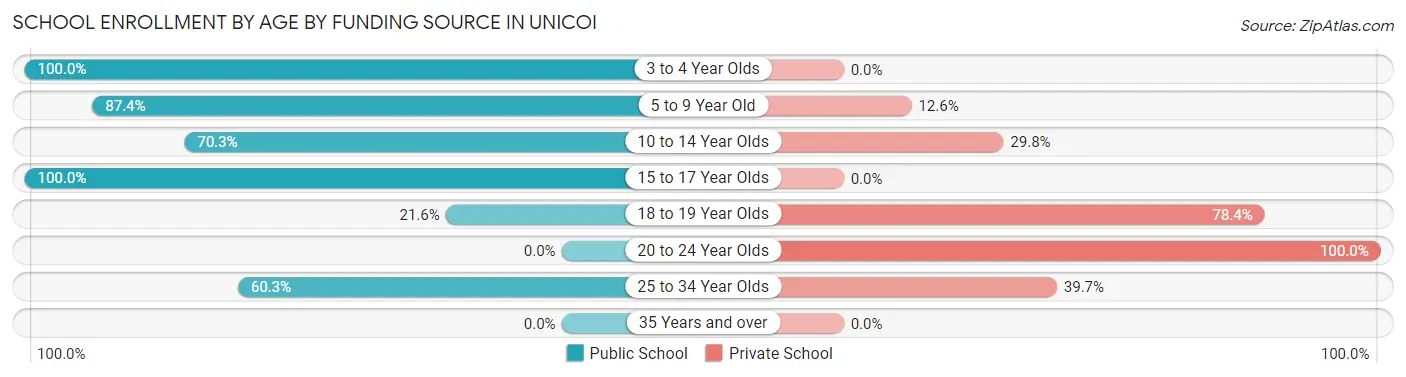
| Age Bracket | Public School | Private School |
| 3 to 4 Year Olds | 16 (100.0%) | 0 (0.0%) |
| 5 to 9 Year Old | 83 (87.4%) | 12 (12.6%) |
| 10 to 14 Year Olds | 111 (70.3%) | 47 (29.7%) |
| 15 to 17 Year Olds | 43 (100.0%) | 0 (0.0%) |
| 18 to 19 Year Olds | 19 (21.6%) | 69 (78.4%) |
| 20 to 24 Year Olds | 0 (0.0%) | 5 (100.0%) |
| 25 to 34 Year Olds | 41 (60.3%) | 27 (39.7%) |
| 35 Years and over | 0 (0.0%) | 0 (0.0%) |
| Total | 313 (66.2%) | 160 (33.8%) |
Educational Attainment by Field of Study in Unicoi
Business (145 | 20.9%), education (135 | 19.5%), arts & humanities (119 | 17.2%), science & technology (70 | 10.1%), and psychology (52 | 7.5%) are the most common fields of study among 693 individuals in Unicoi who have obtained a bachelor's degree or higher.
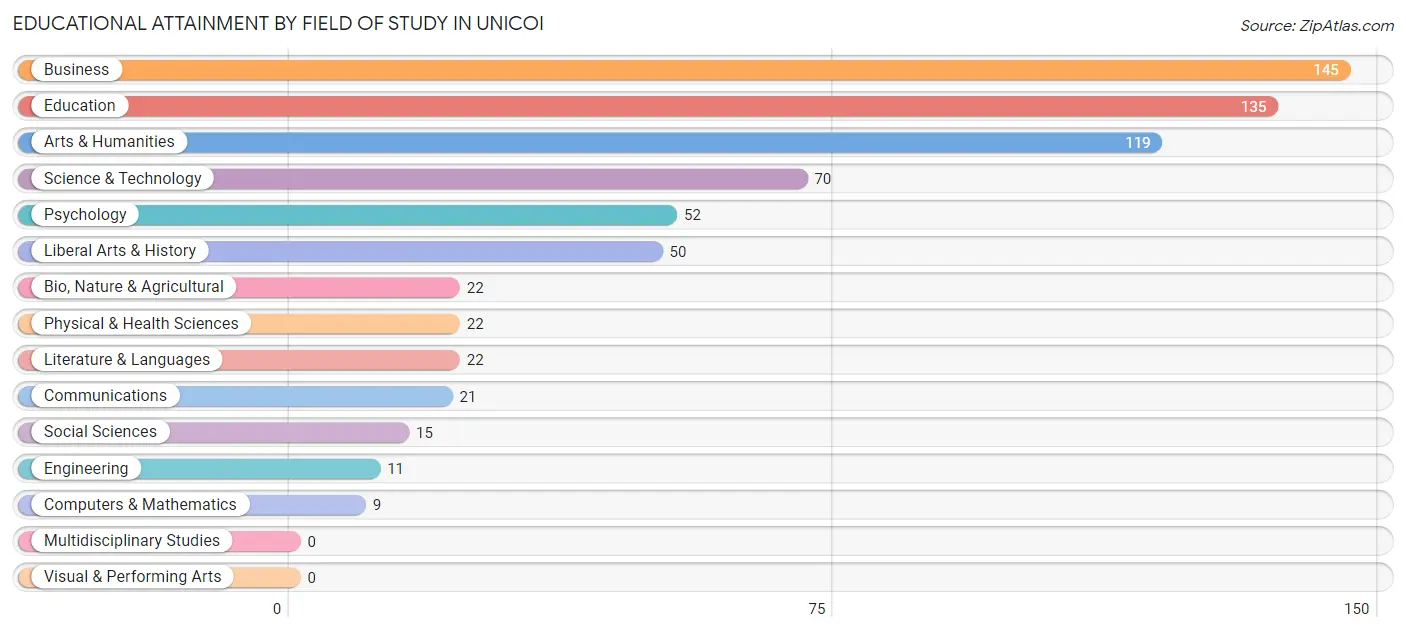
| Field of Study | # Graduates | % Graduates |
| Computers & Mathematics | 9 | 1.3% |
| Bio, Nature & Agricultural | 22 | 3.2% |
| Physical & Health Sciences | 22 | 3.2% |
| Psychology | 52 | 7.5% |
| Social Sciences | 15 | 2.2% |
| Engineering | 11 | 1.6% |
| Multidisciplinary Studies | 0 | 0.0% |
| Science & Technology | 70 | 10.1% |
| Business | 145 | 20.9% |
| Education | 135 | 19.5% |
| Literature & Languages | 22 | 3.2% |
| Liberal Arts & History | 50 | 7.2% |
| Visual & Performing Arts | 0 | 0.0% |
| Communications | 21 | 3.0% |
| Arts & Humanities | 119 | 17.2% |
| Total | 693 | 100.0% |
Transportation & Commute in Unicoi
Vehicle Availability by Sex in Unicoi
The most prevalent vehicle ownership categories in Unicoi are males with 2 vehicles (413, accounting for 62.9%) and females with 2 vehicles (337, making up 58.3%).
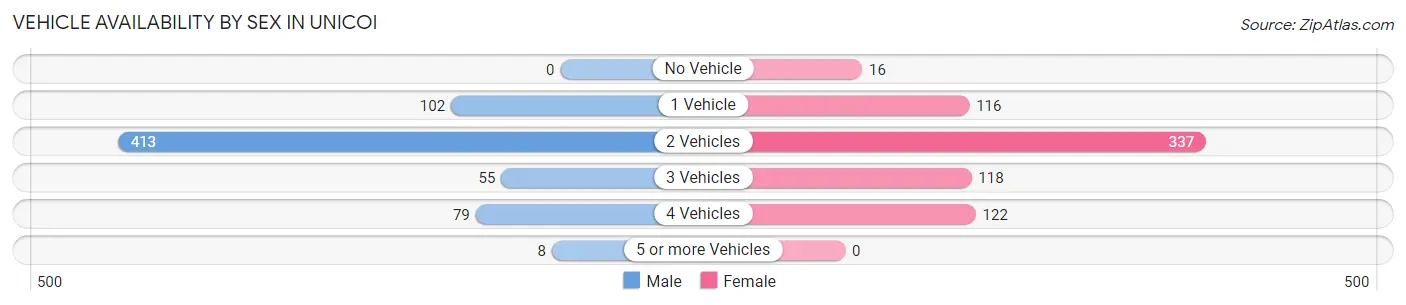
| Vehicles Available | Male | Female |
| No Vehicle | 0 (0.0%) | 16 (2.3%) |
| 1 Vehicle | 102 (15.5%) | 116 (16.4%) |
| 2 Vehicles | 413 (62.9%) | 337 (47.5%) |
| 3 Vehicles | 55 (8.4%) | 118 (16.6%) |
| 4 Vehicles | 79 (12.0%) | 122 (17.2%) |
| 5 or more Vehicles | 8 (1.2%) | 0 (0.0%) |
| Total | 657 (100.0%) | 709 (100.0%) |
Commute Time in Unicoi
The most frequently occuring commute durations in Unicoi are 15 to 19 minutes (270 commuters, 20.3%), 60 to 89 minutes (260 commuters, 19.6%), and 40 to 44 minutes (183 commuters, 13.8%).
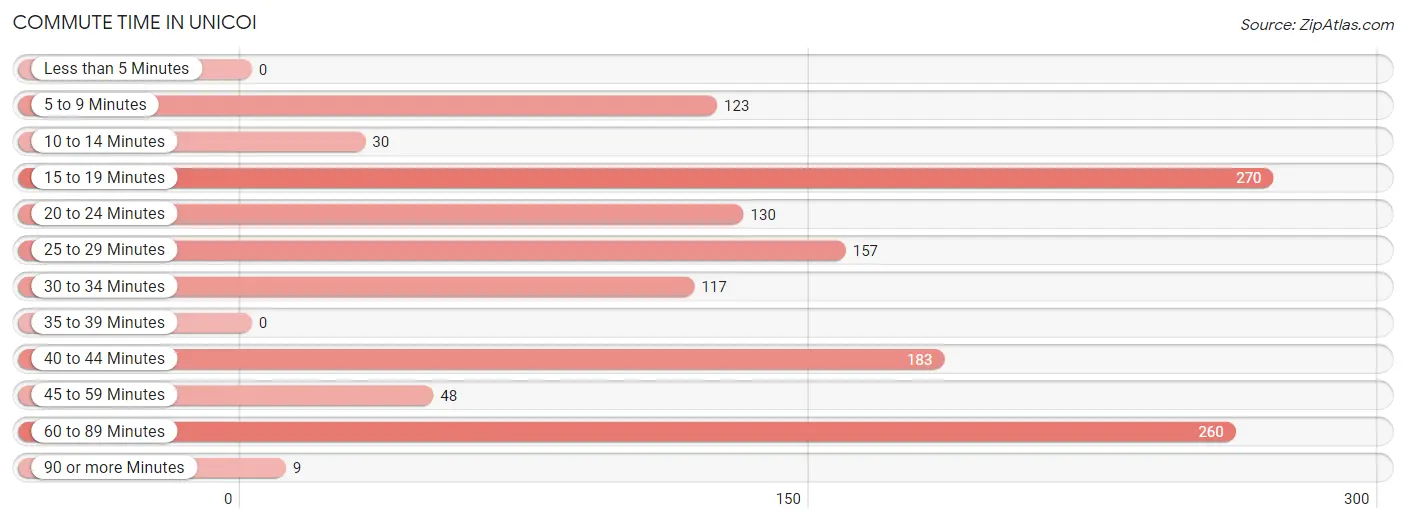
| Commute Time | # Commuters | % Commuters |
| Less than 5 Minutes | 0 | 0.0% |
| 5 to 9 Minutes | 123 | 9.3% |
| 10 to 14 Minutes | 30 | 2.3% |
| 15 to 19 Minutes | 270 | 20.3% |
| 20 to 24 Minutes | 130 | 9.8% |
| 25 to 29 Minutes | 157 | 11.8% |
| 30 to 34 Minutes | 117 | 8.8% |
| 35 to 39 Minutes | 0 | 0.0% |
| 40 to 44 Minutes | 183 | 13.8% |
| 45 to 59 Minutes | 48 | 3.6% |
| 60 to 89 Minutes | 260 | 19.6% |
| 90 or more Minutes | 9 | 0.7% |
Commute Time by Sex in Unicoi
The most common commute times in Unicoi are 60 to 89 minutes (159 commuters, 26.0%) for males and 25 to 29 minutes (136 commuters, 19.0%) for females.
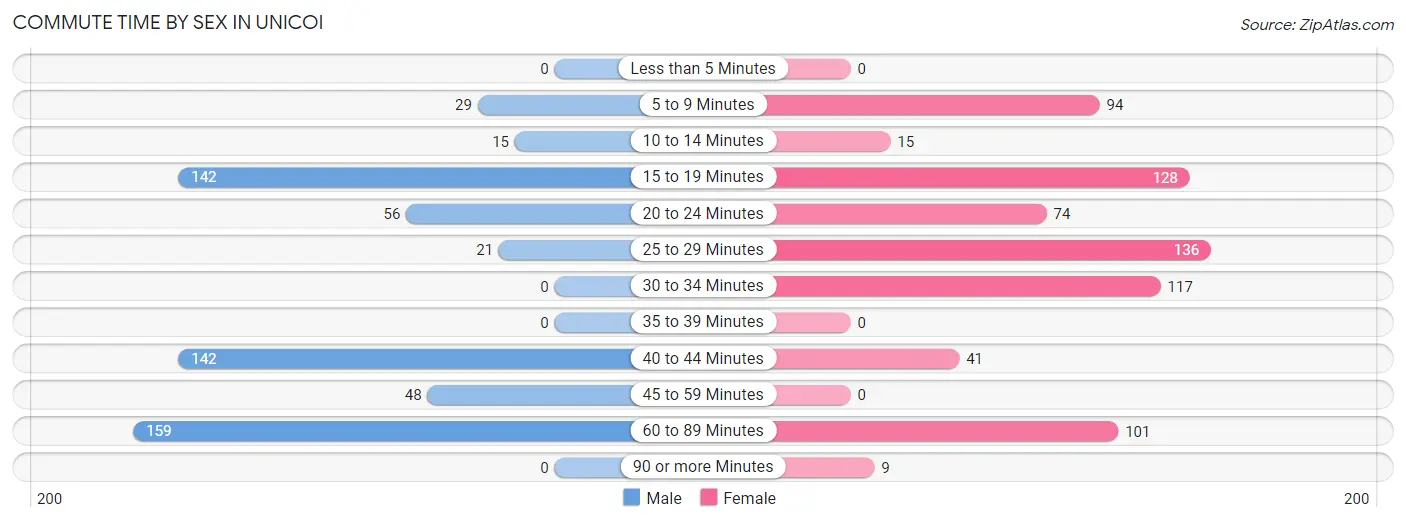
| Commute Time | Male | Female |
| Less than 5 Minutes | 0 (0.0%) | 0 (0.0%) |
| 5 to 9 Minutes | 29 (4.7%) | 94 (13.2%) |
| 10 to 14 Minutes | 15 (2.5%) | 15 (2.1%) |
| 15 to 19 Minutes | 142 (23.2%) | 128 (17.9%) |
| 20 to 24 Minutes | 56 (9.1%) | 74 (10.3%) |
| 25 to 29 Minutes | 21 (3.4%) | 136 (19.0%) |
| 30 to 34 Minutes | 0 (0.0%) | 117 (16.4%) |
| 35 to 39 Minutes | 0 (0.0%) | 0 (0.0%) |
| 40 to 44 Minutes | 142 (23.2%) | 41 (5.7%) |
| 45 to 59 Minutes | 48 (7.8%) | 0 (0.0%) |
| 60 to 89 Minutes | 159 (26.0%) | 101 (14.1%) |
| 90 or more Minutes | 0 (0.0%) | 9 (1.3%) |
Time of Departure to Work by Sex in Unicoi
The most frequent times of departure to work in Unicoi are 7:00 AM to 7:29 AM (177, 28.9%) for males and 7:00 AM to 7:29 AM (236, 33.0%) for females.
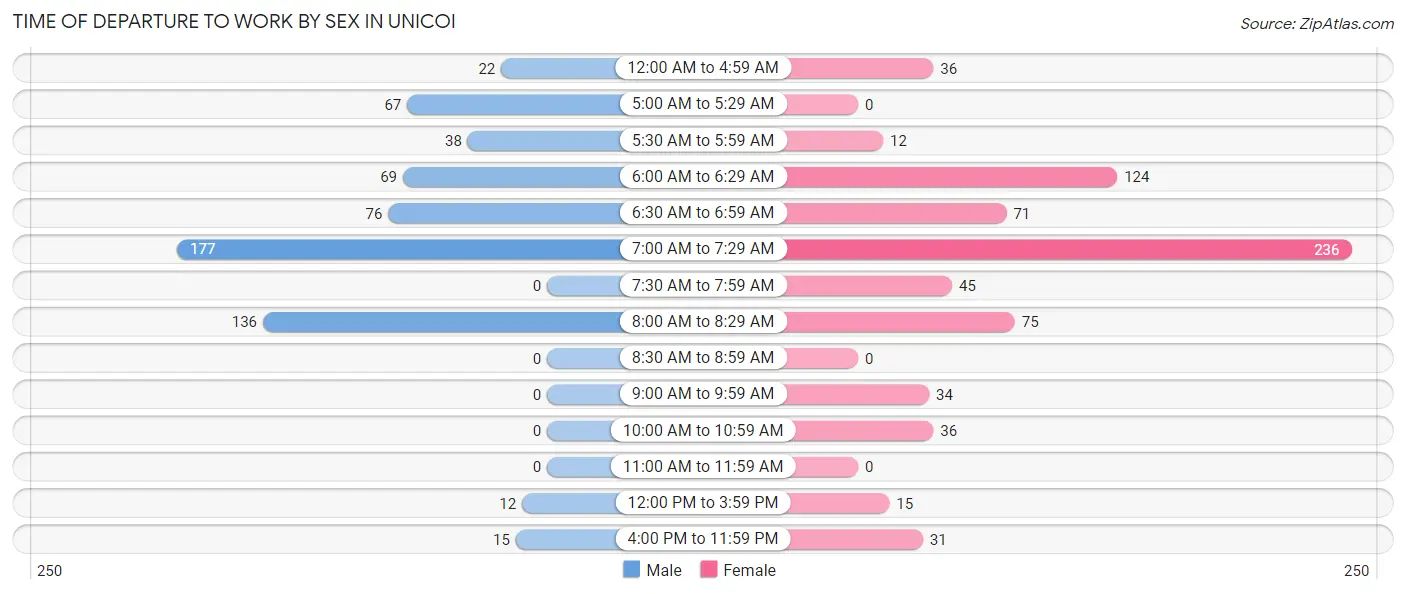
| Time of Departure | Male | Female |
| 12:00 AM to 4:59 AM | 22 (3.6%) | 36 (5.0%) |
| 5:00 AM to 5:29 AM | 67 (11.0%) | 0 (0.0%) |
| 5:30 AM to 5:59 AM | 38 (6.2%) | 12 (1.7%) |
| 6:00 AM to 6:29 AM | 69 (11.3%) | 124 (17.3%) |
| 6:30 AM to 6:59 AM | 76 (12.4%) | 71 (9.9%) |
| 7:00 AM to 7:29 AM | 177 (28.9%) | 236 (33.0%) |
| 7:30 AM to 7:59 AM | 0 (0.0%) | 45 (6.3%) |
| 8:00 AM to 8:29 AM | 136 (22.2%) | 75 (10.5%) |
| 8:30 AM to 8:59 AM | 0 (0.0%) | 0 (0.0%) |
| 9:00 AM to 9:59 AM | 0 (0.0%) | 34 (4.8%) |
| 10:00 AM to 10:59 AM | 0 (0.0%) | 36 (5.0%) |
| 11:00 AM to 11:59 AM | 0 (0.0%) | 0 (0.0%) |
| 12:00 PM to 3:59 PM | 12 (2.0%) | 15 (2.1%) |
| 4:00 PM to 11:59 PM | 15 (2.5%) | 31 (4.3%) |
| Total | 612 (100.0%) | 715 (100.0%) |
Housing Occupancy in Unicoi
Occupancy by Ownership in Unicoi
Of the total 1,768 dwellings in Unicoi, owner-occupied units account for 1,149 (65.0%), while renter-occupied units make up 619 (35.0%).
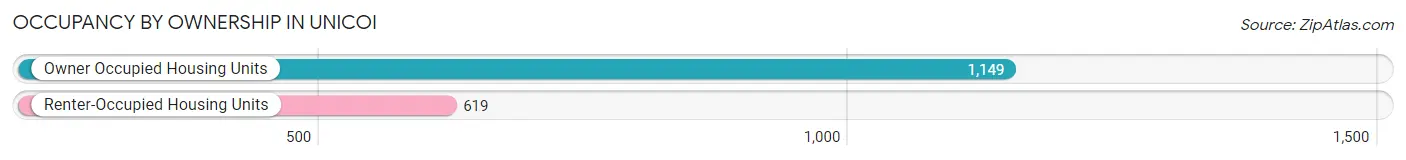
| Occupancy | # Housing Units | % Housing Units |
| Owner Occupied Housing Units | 1,149 | 65.0% |
| Renter-Occupied Housing Units | 619 | 35.0% |
| Total Occupied Housing Units | 1,768 | 100.0% |
Occupancy by Household Size in Unicoi
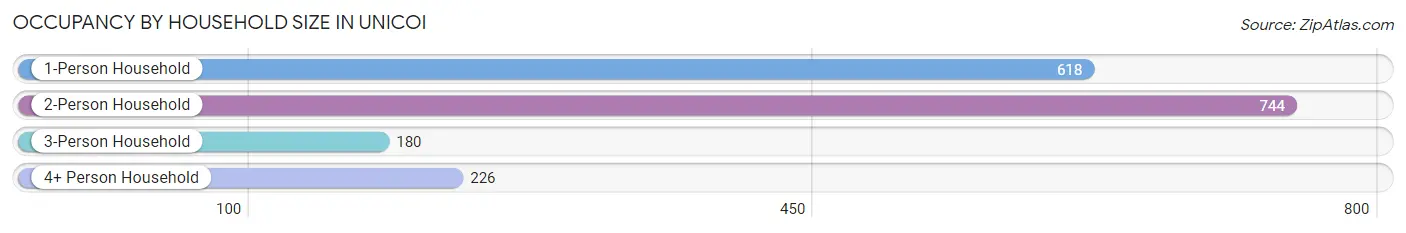
| Household Size | # Housing Units | % Housing Units |
| 1-Person Household | 618 | 34.9% |
| 2-Person Household | 744 | 42.1% |
| 3-Person Household | 180 | 10.2% |
| 4+ Person Household | 226 | 12.8% |
| Total Housing Units | 1,768 | 100.0% |
Occupancy by Ownership by Household Size in Unicoi
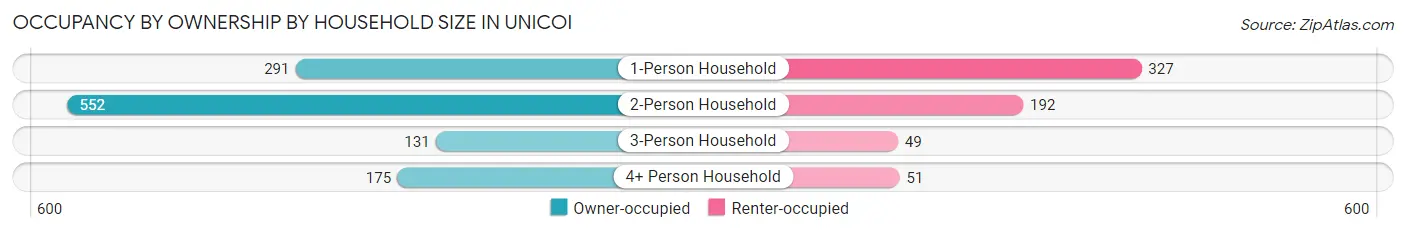
| Household Size | Owner-occupied | Renter-occupied |
| 1-Person Household | 291 (47.1%) | 327 (52.9%) |
| 2-Person Household | 552 (74.2%) | 192 (25.8%) |
| 3-Person Household | 131 (72.8%) | 49 (27.2%) |
| 4+ Person Household | 175 (77.4%) | 51 (22.6%) |
| Total Housing Units | 1,149 (65.0%) | 619 (35.0%) |
Occupancy by Educational Attainment in Unicoi
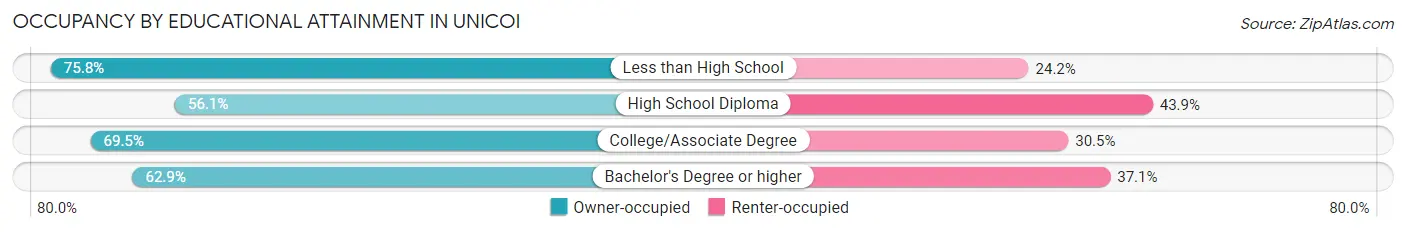
| Household Size | Owner-occupied | Renter-occupied |
| Less than High School | 116 (75.8%) | 37 (24.2%) |
| High School Diploma | 234 (56.1%) | 183 (43.9%) |
| College/Associate Degree | 479 (69.5%) | 210 (30.5%) |
| Bachelor's Degree or higher | 320 (62.9%) | 189 (37.1%) |
Occupancy by Age of Householder in Unicoi
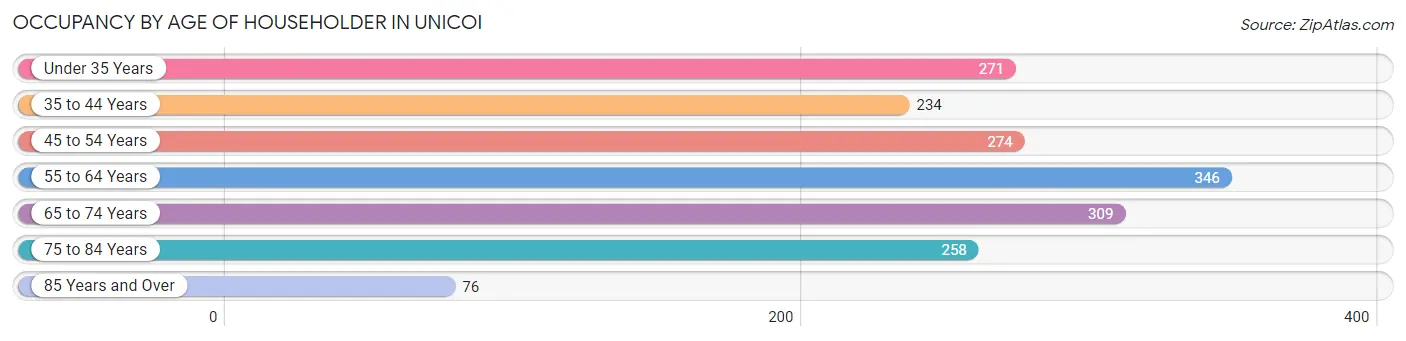
| Age Bracket | # Households | % Households |
| Under 35 Years | 271 | 15.3% |
| 35 to 44 Years | 234 | 13.2% |
| 45 to 54 Years | 274 | 15.5% |
| 55 to 64 Years | 346 | 19.6% |
| 65 to 74 Years | 309 | 17.5% |
| 75 to 84 Years | 258 | 14.6% |
| 85 Years and Over | 76 | 4.3% |
| Total | 1,768 | 100.0% |
Housing Finances in Unicoi
Median Income by Occupancy in Unicoi
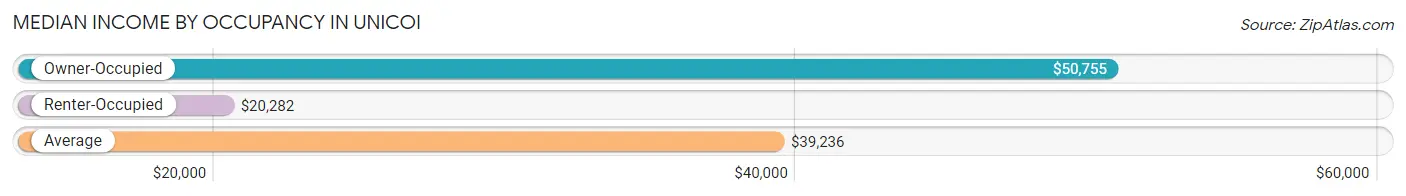
| Occupancy Type | # Households | Median Income |
| Owner-Occupied | 1,149 (65.0%) | $50,755 |
| Renter-Occupied | 619 (35.0%) | $20,282 |
| Average | 1,768 (100.0%) | $39,236 |
Occupancy by Householder Income Bracket in Unicoi
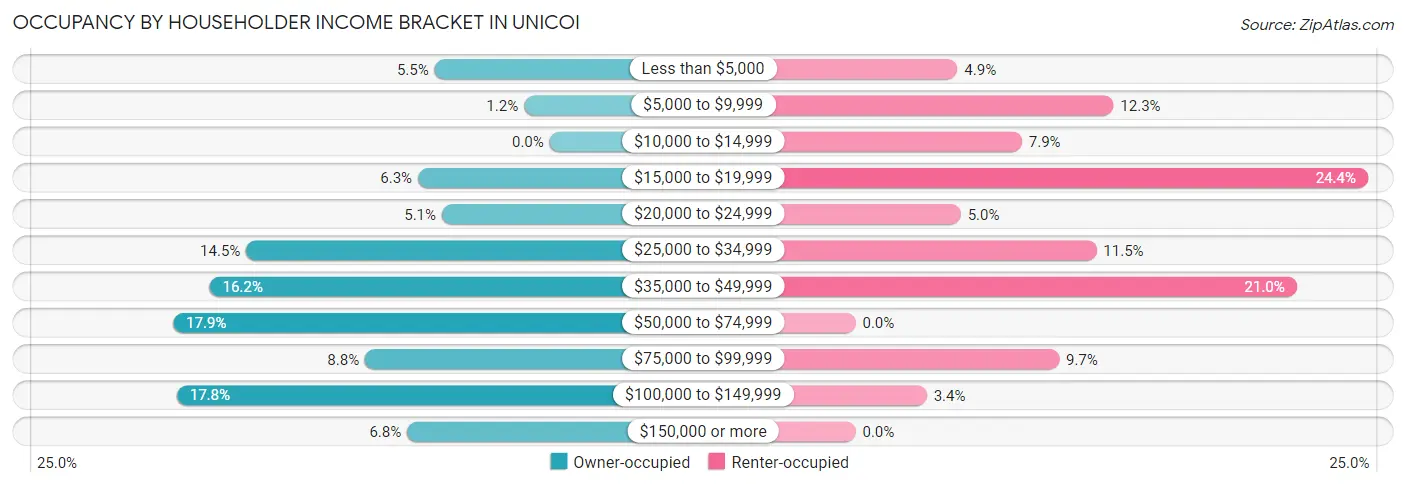
| Income Bracket | Owner-occupied | Renter-occupied |
| Less than $5,000 | 63 (5.5%) | 30 (4.9%) |
| $5,000 to $9,999 | 14 (1.2%) | 76 (12.3%) |
| $10,000 to $14,999 | 0 (0.0%) | 49 (7.9%) |
| $15,000 to $19,999 | 72 (6.3%) | 151 (24.4%) |
| $20,000 to $24,999 | 59 (5.1%) | 31 (5.0%) |
| $25,000 to $34,999 | 166 (14.4%) | 71 (11.5%) |
| $35,000 to $49,999 | 186 (16.2%) | 130 (21.0%) |
| $50,000 to $74,999 | 206 (17.9%) | 0 (0.0%) |
| $75,000 to $99,999 | 101 (8.8%) | 60 (9.7%) |
| $100,000 to $149,999 | 204 (17.7%) | 21 (3.4%) |
| $150,000 or more | 78 (6.8%) | 0 (0.0%) |
| Total | 1,149 (100.0%) | 619 (100.0%) |
Monthly Housing Cost Tiers in Unicoi
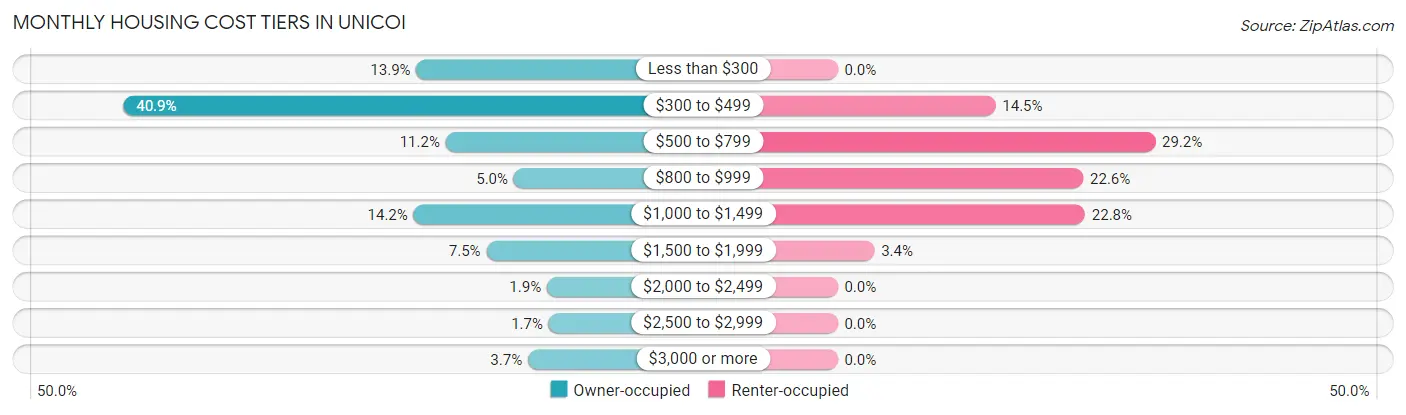
| Monthly Cost | Owner-occupied | Renter-occupied |
| Less than $300 | 160 (13.9%) | 0 (0.0%) |
| $300 to $499 | 470 (40.9%) | 90 (14.5%) |
| $500 to $799 | 129 (11.2%) | 181 (29.2%) |
| $800 to $999 | 57 (5.0%) | 140 (22.6%) |
| $1,000 to $1,499 | 163 (14.2%) | 141 (22.8%) |
| $1,500 to $1,999 | 86 (7.5%) | 21 (3.4%) |
| $2,000 to $2,499 | 22 (1.9%) | 0 (0.0%) |
| $2,500 to $2,999 | 20 (1.7%) | 0 (0.0%) |
| $3,000 or more | 42 (3.7%) | 0 (0.0%) |
| Total | 1,149 (100.0%) | 619 (100.0%) |
Physical Housing Characteristics in Unicoi
Housing Structures in Unicoi
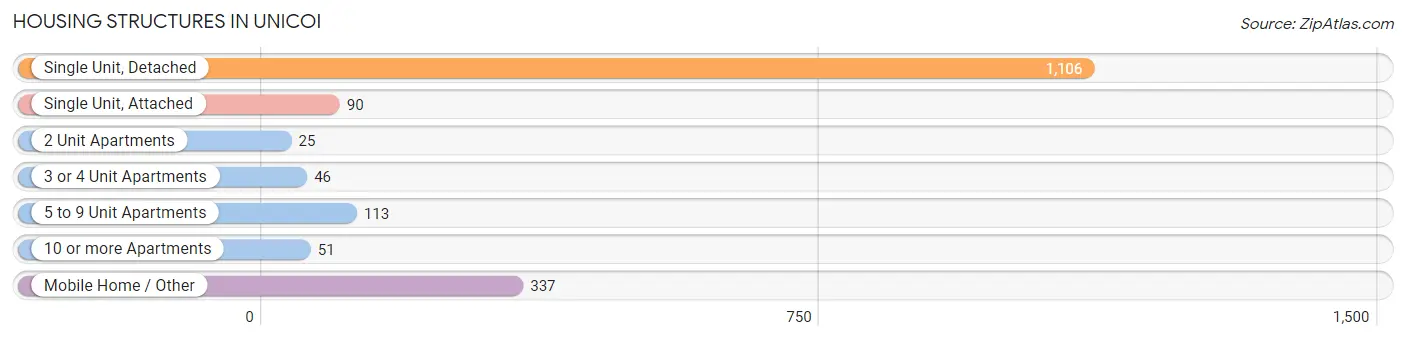
| Structure Type | # Housing Units | % Housing Units |
| Single Unit, Detached | 1,106 | 62.6% |
| Single Unit, Attached | 90 | 5.1% |
| 2 Unit Apartments | 25 | 1.4% |
| 3 or 4 Unit Apartments | 46 | 2.6% |
| 5 to 9 Unit Apartments | 113 | 6.4% |
| 10 or more Apartments | 51 | 2.9% |
| Mobile Home / Other | 337 | 19.1% |
| Total | 1,768 | 100.0% |
Housing Structures by Occupancy in Unicoi
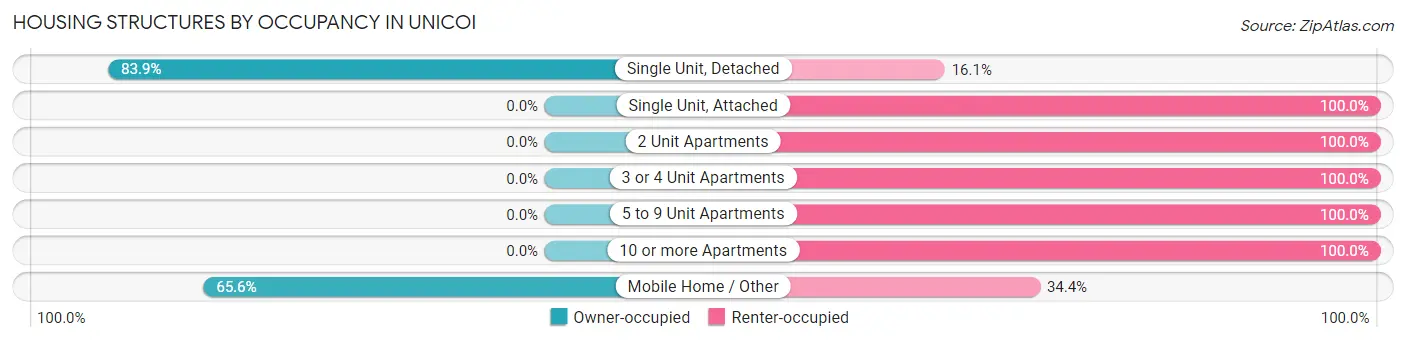
| Structure Type | Owner-occupied | Renter-occupied |
| Single Unit, Detached | 928 (83.9%) | 178 (16.1%) |
| Single Unit, Attached | 0 (0.0%) | 90 (100.0%) |
| 2 Unit Apartments | 0 (0.0%) | 25 (100.0%) |
| 3 or 4 Unit Apartments | 0 (0.0%) | 46 (100.0%) |
| 5 to 9 Unit Apartments | 0 (0.0%) | 113 (100.0%) |
| 10 or more Apartments | 0 (0.0%) | 51 (100.0%) |
| Mobile Home / Other | 221 (65.6%) | 116 (34.4%) |
| Total | 1,149 (65.0%) | 619 (35.0%) |
Housing Structures by Number of Rooms in Unicoi
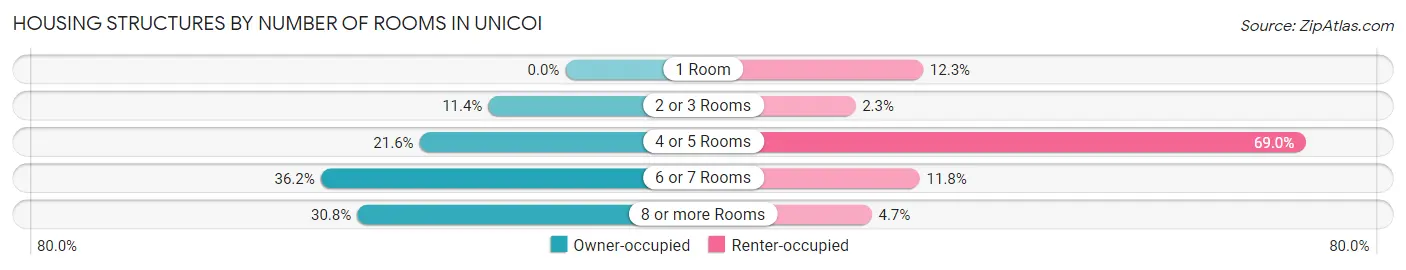
| Number of Rooms | Owner-occupied | Renter-occupied |
| 1 Room | 0 (0.0%) | 76 (12.3%) |
| 2 or 3 Rooms | 131 (11.4%) | 14 (2.3%) |
| 4 or 5 Rooms | 248 (21.6%) | 427 (69.0%) |
| 6 or 7 Rooms | 416 (36.2%) | 73 (11.8%) |
| 8 or more Rooms | 354 (30.8%) | 29 (4.7%) |
| Total | 1,149 (100.0%) | 619 (100.0%) |
Housing Structure by Heating Type in Unicoi
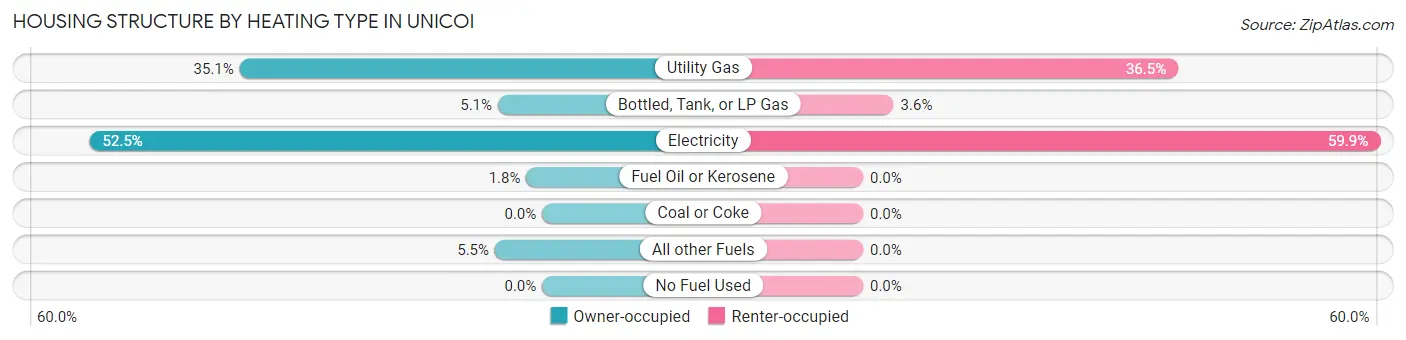
| Heating Type | Owner-occupied | Renter-occupied |
| Utility Gas | 403 (35.1%) | 226 (36.5%) |
| Bottled, Tank, or LP Gas | 59 (5.1%) | 22 (3.5%) |
| Electricity | 603 (52.5%) | 371 (59.9%) |
| Fuel Oil or Kerosene | 21 (1.8%) | 0 (0.0%) |
| Coal or Coke | 0 (0.0%) | 0 (0.0%) |
| All other Fuels | 63 (5.5%) | 0 (0.0%) |
| No Fuel Used | 0 (0.0%) | 0 (0.0%) |
| Total | 1,149 (100.0%) | 619 (100.0%) |
Household Vehicle Usage in Unicoi
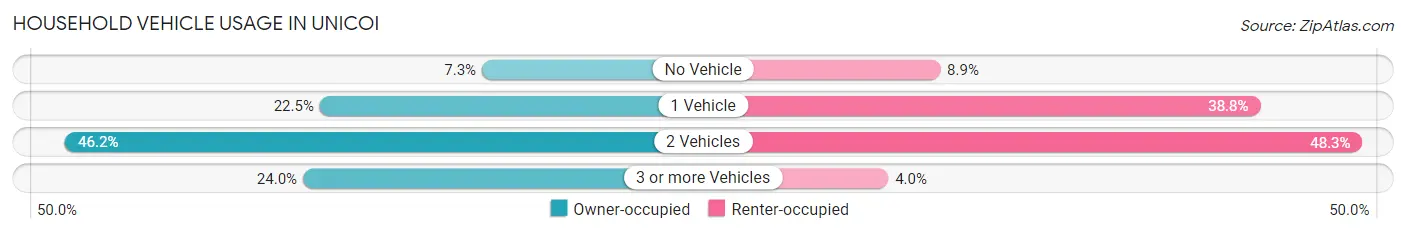
| Vehicles per Household | Owner-occupied | Renter-occupied |
| No Vehicle | 84 (7.3%) | 55 (8.9%) |
| 1 Vehicle | 258 (22.5%) | 240 (38.8%) |
| 2 Vehicles | 531 (46.2%) | 299 (48.3%) |
| 3 or more Vehicles | 276 (24.0%) | 25 (4.0%) |
| Total | 1,149 (100.0%) | 619 (100.0%) |
Real Estate & Mortgages in Unicoi
Real Estate and Mortgage Overview in Unicoi
| Characteristic | Without Mortgage | With Mortgage |
| Housing Units | 756 | 393 |
| Median Property Value | $157,200 | $236,900 |
| Median Household Income | $44,946 | $51 |
| Monthly Housing Costs | $375 | $42 |
| Real Estate Taxes | $956 | $0 |
Property Value by Mortgage Status in Unicoi
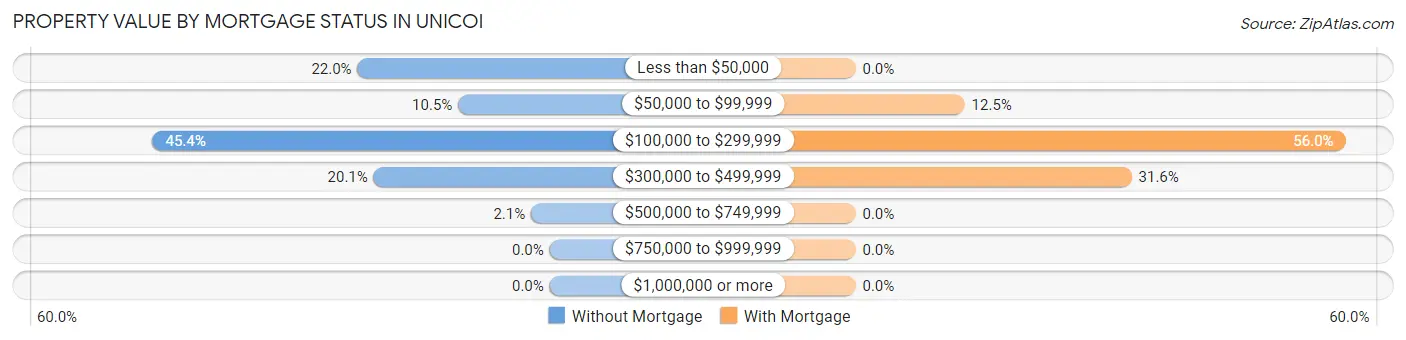
| Property Value | Without Mortgage | With Mortgage |
| Less than $50,000 | 166 (22.0%) | 0 (0.0%) |
| $50,000 to $99,999 | 79 (10.4%) | 49 (12.5%) |
| $100,000 to $299,999 | 343 (45.4%) | 220 (56.0%) |
| $300,000 to $499,999 | 152 (20.1%) | 124 (31.6%) |
| $500,000 to $749,999 | 16 (2.1%) | 0 (0.0%) |
| $750,000 to $999,999 | 0 (0.0%) | 0 (0.0%) |
| $1,000,000 or more | 0 (0.0%) | 0 (0.0%) |
| Total | 756 (100.0%) | 393 (100.0%) |
Household Income by Mortgage Status in Unicoi
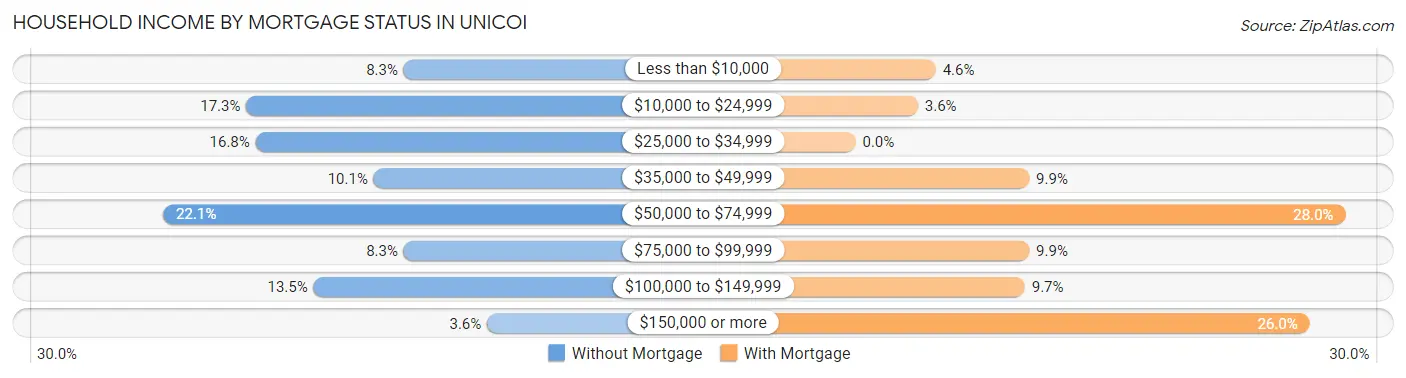
| Household Income | Without Mortgage | With Mortgage |
| Less than $10,000 | 63 (8.3%) | 18 (4.6%) |
| $10,000 to $24,999 | 131 (17.3%) | 14 (3.6%) |
| $25,000 to $34,999 | 127 (16.8%) | 0 (0.0%) |
| $35,000 to $49,999 | 76 (10.1%) | 39 (9.9%) |
| $50,000 to $74,999 | 167 (22.1%) | 110 (28.0%) |
| $75,000 to $99,999 | 63 (8.3%) | 39 (9.9%) |
| $100,000 to $149,999 | 102 (13.5%) | 38 (9.7%) |
| $150,000 or more | 27 (3.6%) | 102 (26.0%) |
| Total | 756 (100.0%) | 393 (100.0%) |
Property Value to Household Income Ratio in Unicoi
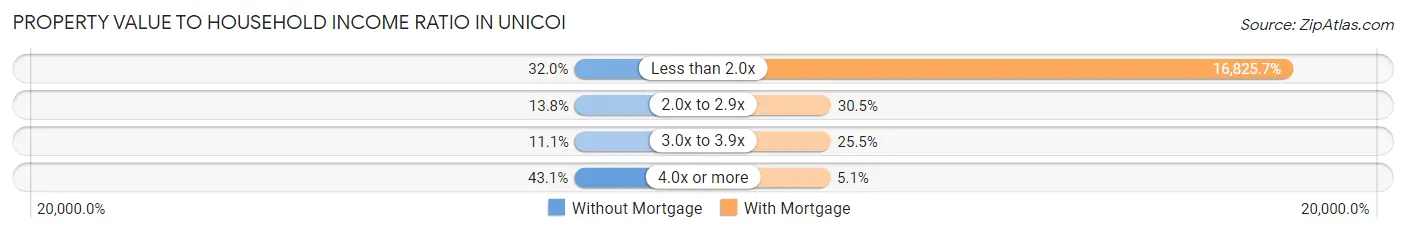
| Value-to-Income Ratio | Without Mortgage | With Mortgage |
| Less than 2.0x | 242 (32.0%) | 66,125 (16,825.7%) |
| 2.0x to 2.9x | 104 (13.8%) | 120 (30.5%) |
| 3.0x to 3.9x | 84 (11.1%) | 100 (25.5%) |
| 4.0x or more | 326 (43.1%) | 20 (5.1%) |
| Total | 756 (100.0%) | 393 (100.0%) |
Real Estate Taxes by Mortgage Status in Unicoi
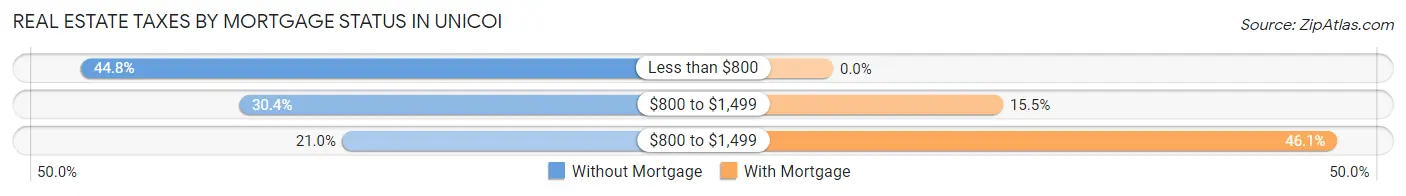
| Property Taxes | Without Mortgage | With Mortgage |
| Less than $800 | 339 (44.8%) | 0 (0.0%) |
| $800 to $1,499 | 230 (30.4%) | 61 (15.5%) |
| $800 to $1,499 | 159 (21.0%) | 181 (46.1%) |
| Total | 756 (100.0%) | 393 (100.0%) |
Health & Disability in Unicoi
Health Insurance Coverage by Age in Unicoi
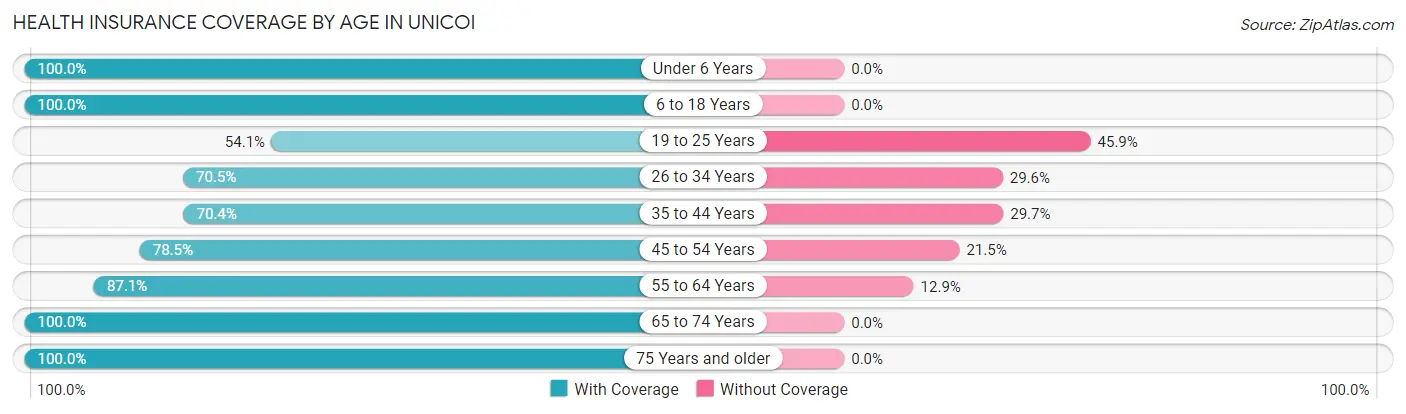
| Age Bracket | With Coverage | Without Coverage |
| Under 6 Years | 221 (100.0%) | 0 (0.0%) |
| 6 to 18 Years | 351 (100.0%) | 0 (0.0%) |
| 19 to 25 Years | 166 (54.1%) | 141 (45.9%) |
| 26 to 34 Years | 298 (70.5%) | 125 (29.5%) |
| 35 to 44 Years | 242 (70.4%) | 102 (29.6%) |
| 45 to 54 Years | 380 (78.5%) | 104 (21.5%) |
| 55 to 64 Years | 626 (87.1%) | 93 (12.9%) |
| 65 to 74 Years | 440 (100.0%) | 0 (0.0%) |
| 75 Years and older | 471 (100.0%) | 0 (0.0%) |
| Total | 3,195 (85.0%) | 565 (15.0%) |
Health Insurance Coverage by Citizenship Status in Unicoi
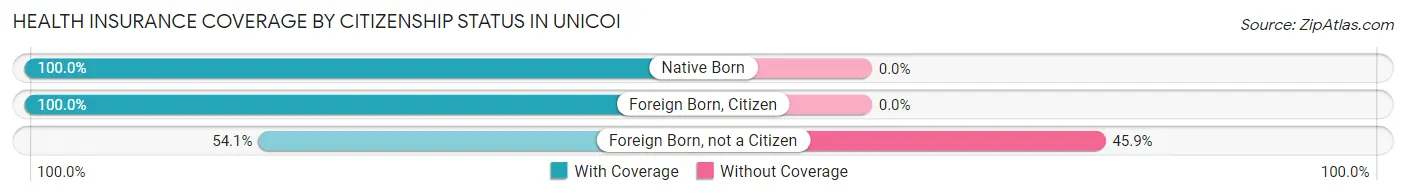
| Citizenship Status | With Coverage | Without Coverage |
| Native Born | 221 (100.0%) | 0 (0.0%) |
| Foreign Born, Citizen | 351 (100.0%) | 0 (0.0%) |
| Foreign Born, not a Citizen | 166 (54.1%) | 141 (45.9%) |
Health Insurance Coverage by Household Income in Unicoi
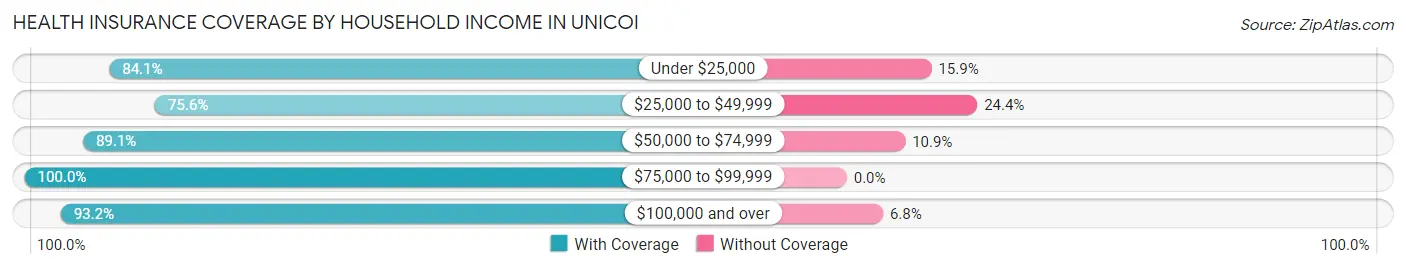
| Household Income | With Coverage | Without Coverage |
| Under $25,000 | 631 (84.1%) | 119 (15.9%) |
| $25,000 to $49,999 | 798 (75.6%) | 258 (24.4%) |
| $50,000 to $74,999 | 415 (89.1%) | 51 (10.9%) |
| $75,000 to $99,999 | 454 (100.0%) | 0 (0.0%) |
| $100,000 and over | 839 (93.2%) | 61 (6.8%) |
Public vs Private Health Insurance Coverage by Age in Unicoi
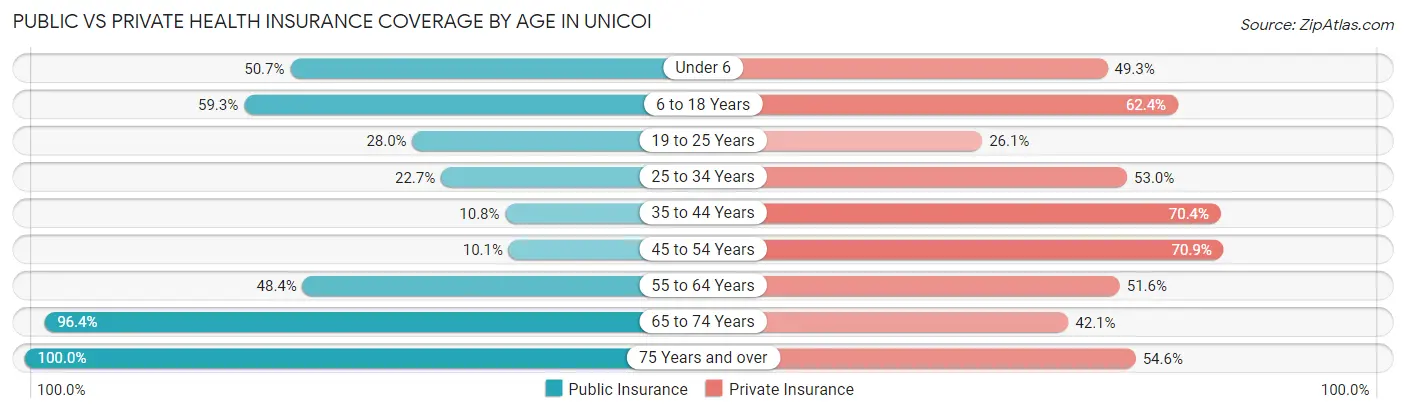
| Age Bracket | Public Insurance | Private Insurance |
| Under 6 | 112 (50.7%) | 109 (49.3%) |
| 6 to 18 Years | 208 (59.3%) | 219 (62.4%) |
| 19 to 25 Years | 86 (28.0%) | 80 (26.1%) |
| 25 to 34 Years | 96 (22.7%) | 224 (53.0%) |
| 35 to 44 Years | 37 (10.8%) | 242 (70.4%) |
| 45 to 54 Years | 49 (10.1%) | 343 (70.9%) |
| 55 to 64 Years | 348 (48.4%) | 371 (51.6%) |
| 65 to 74 Years | 424 (96.4%) | 185 (42.0%) |
| 75 Years and over | 471 (100.0%) | 257 (54.6%) |
| Total | 1,831 (48.7%) | 2,030 (54.0%) |
Disability Status by Sex by Age in Unicoi
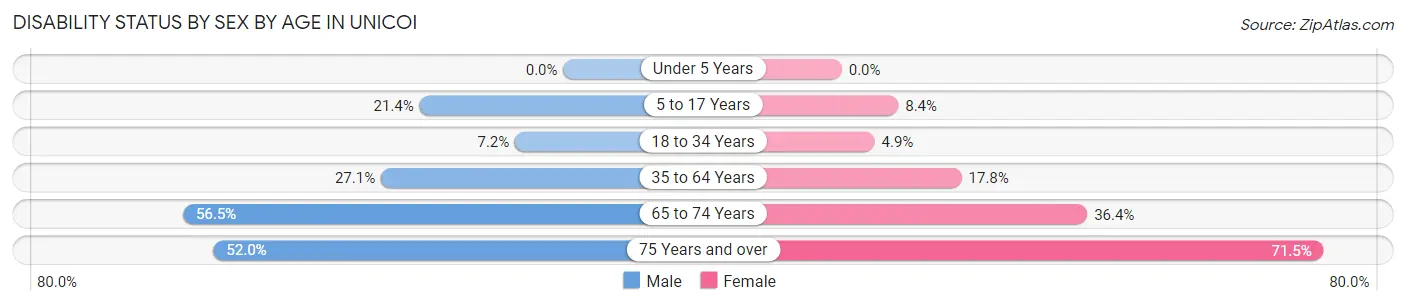
| Age Bracket | Male | Female |
| Under 5 Years | 0 (0.0%) | 0 (0.0%) |
| 5 to 17 Years | 47 (21.4%) | 12 (8.4%) |
| 18 to 34 Years | 26 (7.2%) | 19 (4.9%) |
| 35 to 64 Years | 218 (27.1%) | 132 (17.8%) |
| 65 to 74 Years | 109 (56.5%) | 90 (36.4%) |
| 75 Years and over | 106 (52.0%) | 191 (71.5%) |
Disability Class by Sex by Age in Unicoi
Disability Class: Hearing Difficulty
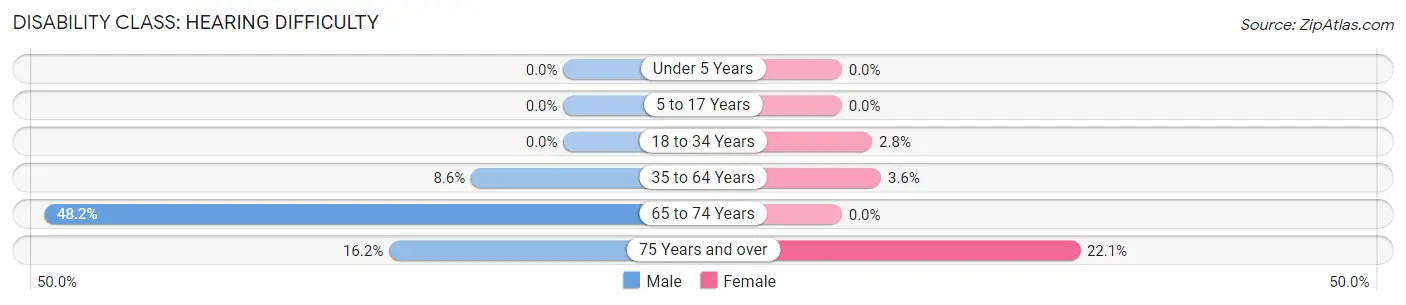
| Age Bracket | Male | Female |
| Under 5 Years | 0 (0.0%) | 0 (0.0%) |
| 5 to 17 Years | 0 (0.0%) | 0 (0.0%) |
| 18 to 34 Years | 0 (0.0%) | 11 (2.8%) |
| 35 to 64 Years | 69 (8.6%) | 27 (3.6%) |
| 65 to 74 Years | 93 (48.2%) | 0 (0.0%) |
| 75 Years and over | 33 (16.2%) | 59 (22.1%) |
Disability Class: Vision Difficulty
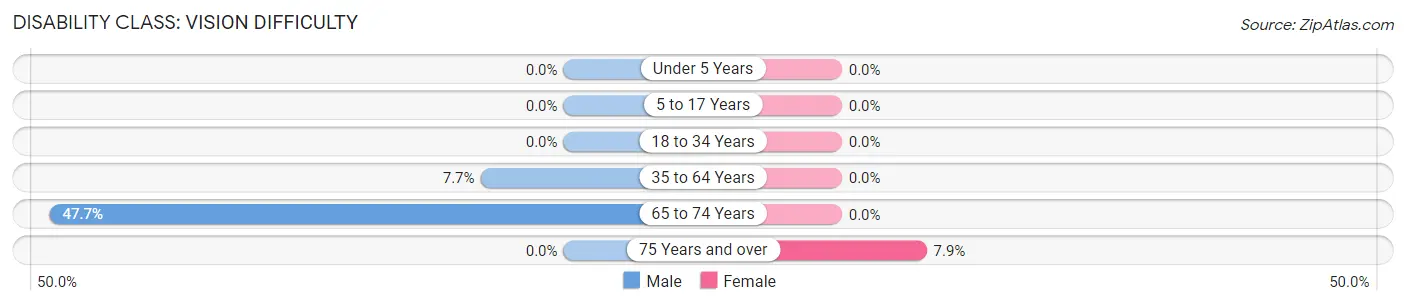
| Age Bracket | Male | Female |
| Under 5 Years | 0 (0.0%) | 0 (0.0%) |
| 5 to 17 Years | 0 (0.0%) | 0 (0.0%) |
| 18 to 34 Years | 0 (0.0%) | 0 (0.0%) |
| 35 to 64 Years | 62 (7.7%) | 0 (0.0%) |
| 65 to 74 Years | 92 (47.7%) | 0 (0.0%) |
| 75 Years and over | 0 (0.0%) | 21 (7.9%) |
Disability Class: Cognitive Difficulty
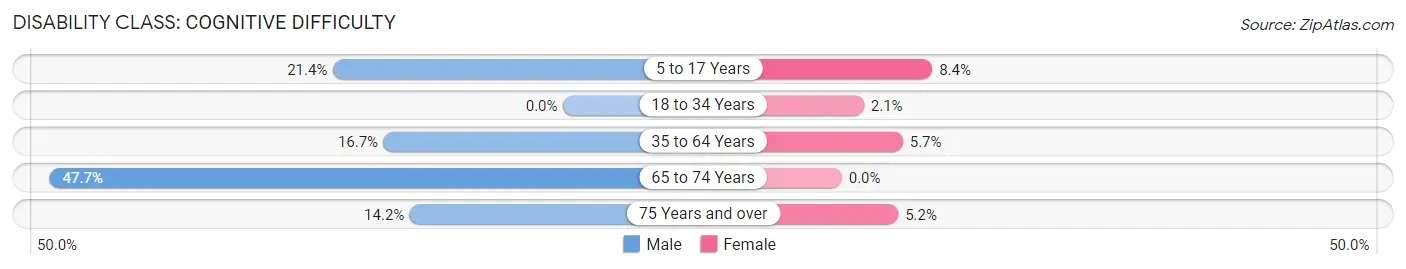
| Age Bracket | Male | Female |
| 5 to 17 Years | 47 (21.4%) | 12 (8.4%) |
| 18 to 34 Years | 0 (0.0%) | 8 (2.1%) |
| 35 to 64 Years | 134 (16.7%) | 42 (5.7%) |
| 65 to 74 Years | 92 (47.7%) | 0 (0.0%) |
| 75 Years and over | 29 (14.2%) | 14 (5.2%) |
Disability Class: Ambulatory Difficulty
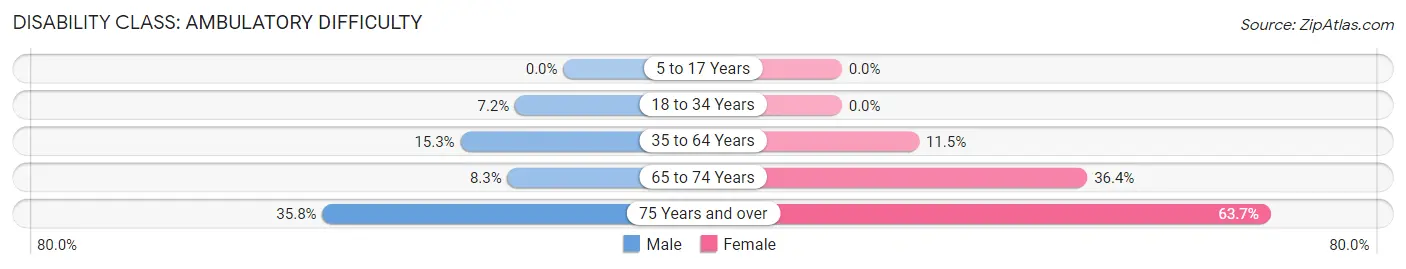
| Age Bracket | Male | Female |
| 5 to 17 Years | 0 (0.0%) | 0 (0.0%) |
| 18 to 34 Years | 26 (7.2%) | 0 (0.0%) |
| 35 to 64 Years | 123 (15.3%) | 85 (11.5%) |
| 65 to 74 Years | 16 (8.3%) | 90 (36.4%) |
| 75 Years and over | 73 (35.8%) | 170 (63.7%) |
Disability Class: Self-Care Difficulty
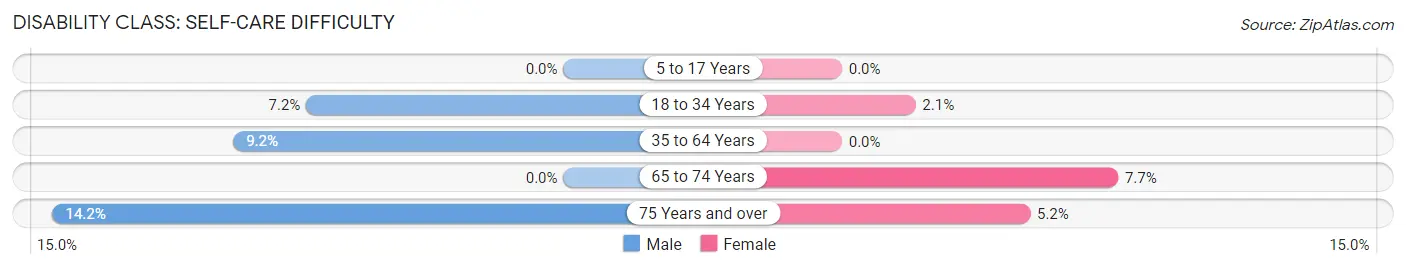
| Age Bracket | Male | Female |
| 5 to 17 Years | 0 (0.0%) | 0 (0.0%) |
| 18 to 34 Years | 26 (7.2%) | 8 (2.1%) |
| 35 to 64 Years | 74 (9.2%) | 0 (0.0%) |
| 65 to 74 Years | 0 (0.0%) | 19 (7.7%) |
| 75 Years and over | 29 (14.2%) | 14 (5.2%) |
Technology Access in Unicoi
Computing Device Access in Unicoi
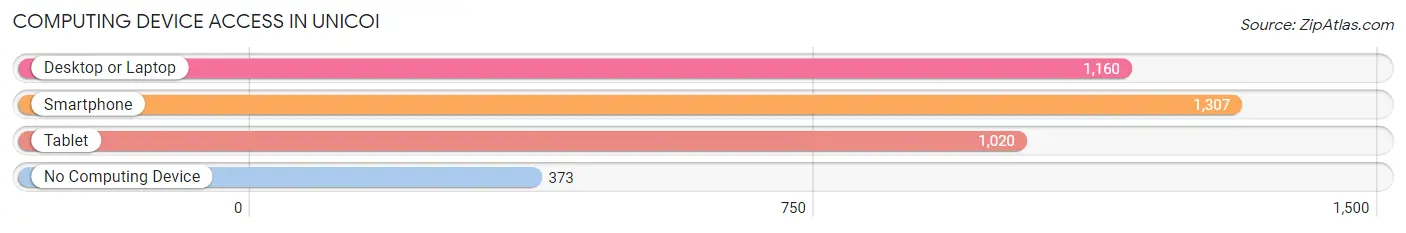
| Device Type | # Households | % Households |
| Desktop or Laptop | 1,160 | 65.6% |
| Smartphone | 1,307 | 73.9% |
| Tablet | 1,020 | 57.7% |
| No Computing Device | 373 | 21.1% |
| Total | 1,768 | 100.0% |
Internet Access in Unicoi
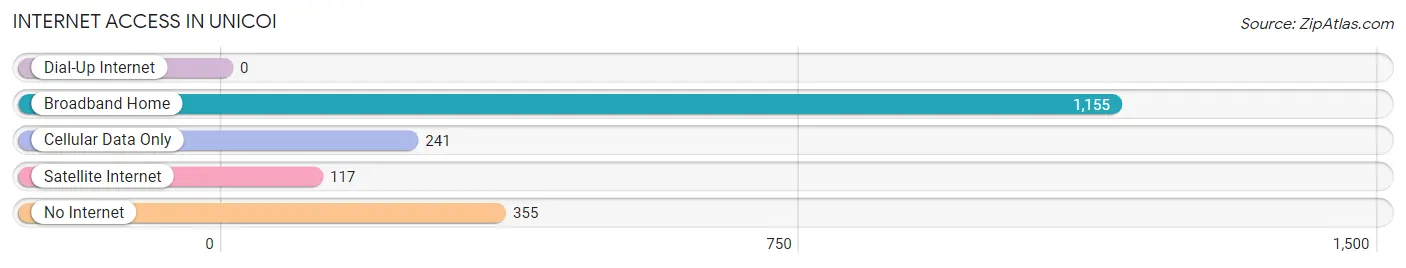
| Internet Type | # Households | % Households |
| Dial-Up Internet | 0 | 0.0% |
| Broadband Home | 1,155 | 65.3% |
| Cellular Data Only | 241 | 13.6% |
| Satellite Internet | 117 | 6.6% |
| No Internet | 355 | 20.1% |
| Total | 1,768 | 100.0% |
Unicoi Summary
Unicoi is a town located in Unicoi County, Tennessee, United States. The population was 1,975 at the 2010 census. It is the county seat of Unicoi County. Unicoi is part of the Johnson City Metropolitan Statistical Area, which is a component of the Johnson City–Kingsport–Bristol, TN-VA Combined Statistical Area – commonly known as the "Tri-Cities" region.
History
Unicoi was founded in 1776 by a group of settlers from North Carolina. The town was named after the Cherokee word for "white," which was the name of a nearby creek. The town was incorporated in 1875 and was the county seat of Unicoi County.
In the late 19th century, Unicoi was a popular tourist destination due to its proximity to the Appalachian Mountains. The town was home to several resorts, including the Unicoi Springs Hotel, which was built in 1883 and was a popular destination for wealthy tourists from the North.
In the early 20th century, Unicoi was a major center for the timber industry. The town was home to several sawmills and lumber companies, and the town's economy was largely dependent on the timber industry.
Geography
Unicoi is located at 36°11'25"N, 82°25'17"W (36.1903, -82.4214). The town is situated in the Appalachian Mountains, and is surrounded by the Cherokee National Forest. The town is located at the confluence of the Nolichucky and Unicoi Rivers.
The town has a total area of 2 2 square miles 5 7 km2 all of which is land
Economy
Unicoi's economy is largely based on tourism and manufacturing. The town is home to several tourist attractions, including the Unicoi State Park, which is a popular destination for camping, fishing, and hiking. The town is also home to several manufacturing companies, including a furniture factory and a plastics factory.
Demographics
As of the census of 2010, there were 1,975 people, 845 households, and 517 families residing in the town. The population density was 895.9 people per square mile (346.3/km2). There were 945 housing units at an average density of 430.2 per square mile (166.2/km2). The racial makeup of the town was 97.2% White, 0.7% African American, 0.2% Native American, 0.2% Asian, 0.2% from other races, and 1.7% from two or more races. Hispanic or Latino of any race were 0.7% of the population.
There were 845 households, out of which 24.2% had children under the age of 18 living with them, 44.2% were married couples living together, 13.2% had a female householder with no husband present, and 37.7% were non-families. 32.2% of all households were made up of individuals, and 14.2% had someone living alone who was 65 years of age or older. The average household size was 2.25 and the average family size was 2.83.
In the town, the population was spread out, with 20.7% under the age of 18, 8.2% from 18 to 24, 25.2% from 25 to 44, 27.2% from 45 to 64, and 18.7% who were 65 years of age or older. The median age was 41 years. For every 100 females, there were 91.2 males. For every 100 females age 18 and over, there were 87.2 males.
The median income for a household in the town was $27,917, and the median income for a family was $35,000. Males had a median income of $27,500 versus $20,000 for females. The per capita income for the town was $15,945. About 13.2% of families and 17.2% of the population were below the poverty line, including 22.2% of those under age 18 and 16.2% of those age 65 or over.
Common Questions
What is Per Capita Income in Unicoi?
Per Capita income in Unicoi is $25,489.
What is the Median Family Income in Unicoi?
Median Family Income in Unicoi is $50,182.
What is the Median Household income in Unicoi?
Median Household Income in Unicoi is $39,236.
What is Income or Wage Gap in Unicoi?
Income or Wage Gap in Unicoi is 40.1%.
Women in Unicoi earn 59.9 cents for every dollar earned by a man.
What is Inequality or Gini Index in Unicoi?
Inequality or Gini Index in Unicoi is 0.45.
What is the Total Population of Unicoi?
Total Population of Unicoi is 3,802.
What is the Total Male Population of Unicoi?
Total Male Population of Unicoi is 1,927.
What is the Total Female Population of Unicoi?
Total Female Population of Unicoi is 1,875.
What is the Ratio of Males per 100 Females in Unicoi?
There are 102.77 Males per 100 Females in Unicoi.
What is the Ratio of Females per 100 Males in Unicoi?
There are 97.30 Females per 100 Males in Unicoi.
What is the Median Population Age in Unicoi?
Median Population Age in Unicoi is 50.6 Years.
What is the Average Family Size in Unicoi
Average Family Size in Unicoi is 2.7 People.
What is the Average Household Size in Unicoi
Average Household Size in Unicoi is 2.1 People.
How Large is the Labor Force in Unicoi?
There are 1,569 People in the Labor Forcein in Unicoi.
What is the Percentage of People in the Labor Force in Unicoi?
47.6% of People are in the Labor Force in Unicoi.
What is the Unemployment Rate in Unicoi?
Unemployment Rate in Unicoi is 7.9%.