Gordonsville, TN Map & Demographics
Gordonsville Map
Gordonsville Overview
$32,697
PER CAPITA INCOME
$68,800
AVG FAMILY INCOME
$62,880
AVG HOUSEHOLD INCOME
23.1%
WAGE / INCOME GAP [ % ]
76.9¢/ $1
WAGE / INCOME GAP [ $ ]
0.46
INEQUALITY / GINI INDEX
1,469
TOTAL POPULATION
751
MALE POPULATION
718
FEMALE POPULATION
104.60
MALES / 100 FEMALES
95.61
FEMALES / 100 MALES
34.0
MEDIAN AGE
3.0
AVG FAMILY SIZE
2.5
AVG HOUSEHOLD SIZE
779
LABOR FORCE [ PEOPLE ]
69.1%
PERCENT IN LABOR FORCE
2.2%
UNEMPLOYMENT RATE
Gordonsville Zip Codes
Gordonsville Area Codes
Income in Gordonsville
Income Overview in Gordonsville
Per Capita Income in Gordonsville is $32,697, while median incomes of families and households are $68,800 and $62,880 respectively.
| Characteristic | Number | Measure |
| Per Capita Income | 1,469 | $32,697 |
| Median Family Income | 416 | $68,800 |
| Mean Family Income | 416 | $88,973 |
| Median Household Income | 575 | $62,880 |
| Mean Household Income | 575 | $79,897 |
| Income Deficit | 416 | $0 |
| Wage / Income Gap (%) | 1,469 | 23.08% |
| Wage / Income Gap ($) | 1,469 | 76.92¢ per $1 |
| Gini / Inequality Index | 1,469 | 0.46 |
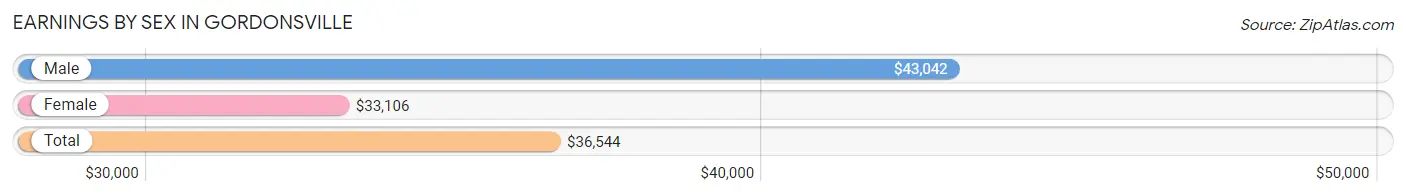
Earnings by Sex in Gordonsville
Average Earnings in Gordonsville are $36,544, $43,042 for men and $33,106 for women, a difference of 23.1%.
| Sex | Number | Average Earnings |
| Male | 373 (47.8%) | $43,042 |
| Female | 408 (52.2%) | $33,106 |
| Total | 781 (100.0%) | $36,544 |
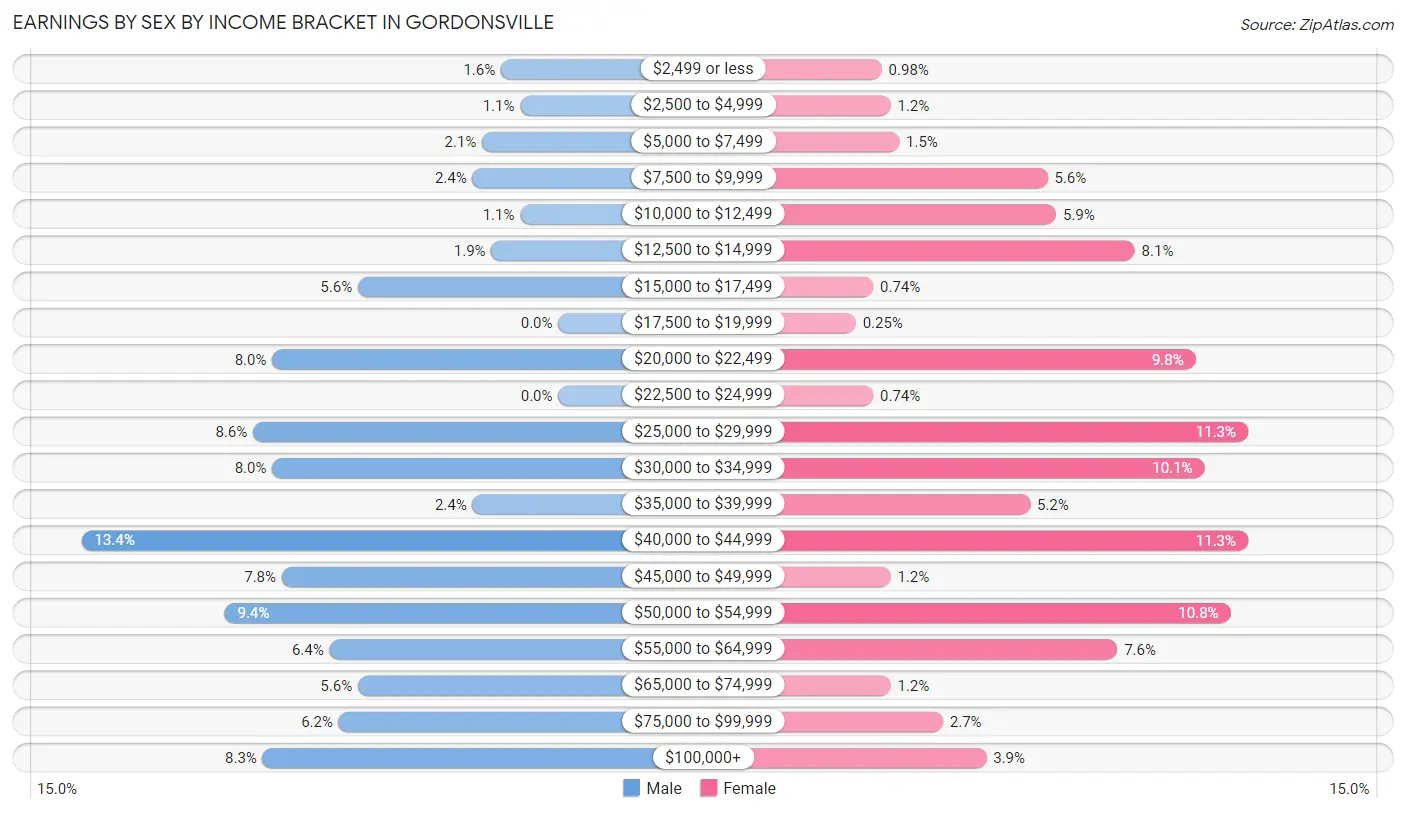
Earnings by Sex by Income Bracket in Gordonsville
The most common earnings brackets in Gordonsville are $40,000 to $44,999 for men (50 | 13.4%) and $25,000 to $29,999 for women (46 | 11.3%).
| Income | Male | Female |
| $2,499 or less | 6 (1.6%) | 4 (1.0%) |
| $2,500 to $4,999 | 4 (1.1%) | 5 (1.2%) |
| $5,000 to $7,499 | 8 (2.1%) | 6 (1.5%) |
| $7,500 to $9,999 | 9 (2.4%) | 23 (5.6%) |
| $10,000 to $12,499 | 4 (1.1%) | 24 (5.9%) |
| $12,500 to $14,999 | 7 (1.9%) | 33 (8.1%) |
| $15,000 to $17,499 | 21 (5.6%) | 3 (0.7%) |
| $17,500 to $19,999 | 0 (0.0%) | 1 (0.3%) |
| $20,000 to $22,499 | 30 (8.0%) | 40 (9.8%) |
| $22,500 to $24,999 | 0 (0.0%) | 3 (0.7%) |
| $25,000 to $29,999 | 32 (8.6%) | 46 (11.3%) |
| $30,000 to $34,999 | 30 (8.0%) | 41 (10.1%) |
| $35,000 to $39,999 | 9 (2.4%) | 21 (5.1%) |
| $40,000 to $44,999 | 50 (13.4%) | 46 (11.3%) |
| $45,000 to $49,999 | 29 (7.8%) | 5 (1.2%) |
| $50,000 to $54,999 | 35 (9.4%) | 44 (10.8%) |
| $55,000 to $64,999 | 24 (6.4%) | 31 (7.6%) |
| $65,000 to $74,999 | 21 (5.6%) | 5 (1.2%) |
| $75,000 to $99,999 | 23 (6.2%) | 11 (2.7%) |
| $100,000+ | 31 (8.3%) | 16 (3.9%) |
| Total | 373 (100.0%) | 408 (100.0%) |
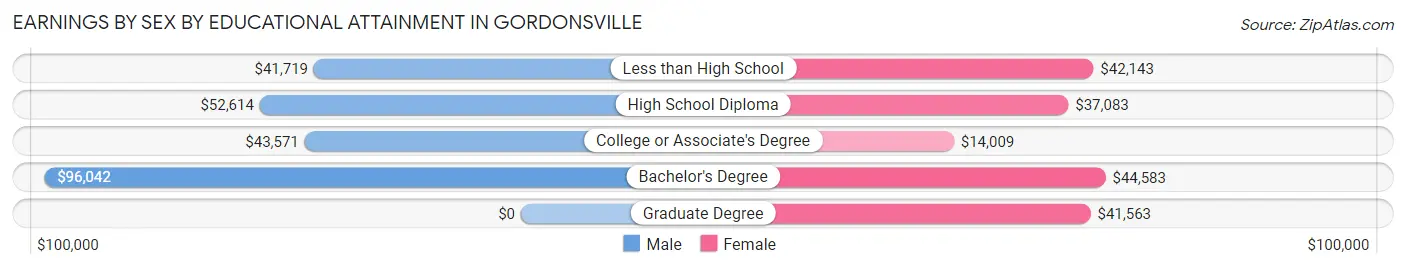
Earnings by Sex by Educational Attainment in Gordonsville
Average earnings in Gordonsville are $45,859 for men and $35,769 for women, a difference of 22.0%. Men with an educational attainment of bachelor's degree enjoy the highest average annual earnings of $96,042, while those with less than high school education earn the least with $41,719. Women with an educational attainment of bachelor's degree earn the most with the average annual earnings of $44,583, while those with college or associate's degree education have the smallest earnings of $14,009.
| Educational Attainment | Male Income | Female Income |
| Less than High School | $41,719 | $42,143 |
| High School Diploma | $52,614 | $37,083 |
| College or Associate's Degree | $43,571 | $14,009 |
| Bachelor's Degree | $96,042 | $44,583 |
| Graduate Degree | - | - |
| Total | $45,859 | $35,769 |
Family Income in Gordonsville
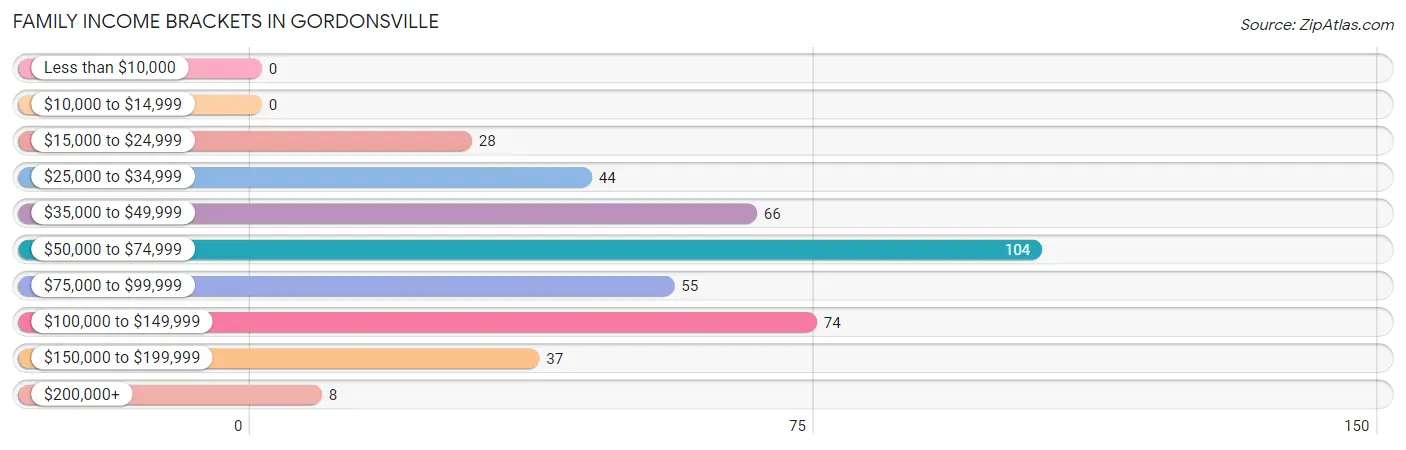
Family Income Brackets in Gordonsville
According to the Gordonsville family income data, there are 104 families falling into the $50,000 to $74,999 income range, which is the most common income bracket and makes up 25.0% of all families.
| Income Bracket | # Families | % Families |
| Less than $10,000 | 0 | 0.0% |
| $10,000 to $14,999 | 0 | 0.0% |
| $15,000 to $24,999 | 28 | 6.7% |
| $25,000 to $34,999 | 44 | 10.6% |
| $35,000 to $49,999 | 66 | 15.9% |
| $50,000 to $74,999 | 104 | 25.0% |
| $75,000 to $99,999 | 55 | 13.2% |
| $100,000 to $149,999 | 74 | 17.8% |
| $150,000 to $199,999 | 37 | 8.9% |
| $200,000+ | 8 | 1.9% |
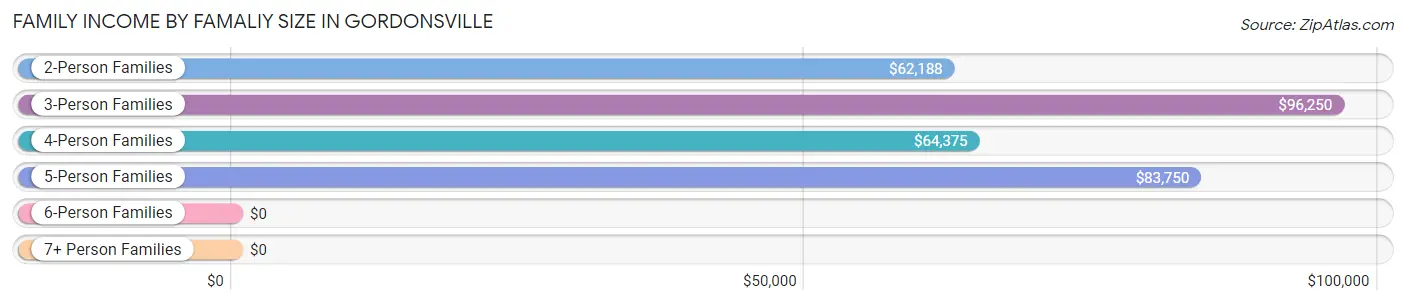
Family Income by Famaliy Size in Gordonsville
3-person families (104 | 25.0%) account for the highest median family income in Gordonsville with $96,250 per family, while 3-person families (104 | 25.0%) have the highest median income of $32,083 per family member.
| Income Bracket | # Families | Median Income |
| 2-Person Families | 180 (43.3%) | $62,188 |
| 3-Person Families | 104 (25.0%) | $96,250 |
| 4-Person Families | 88 (21.1%) | $64,375 |
| 5-Person Families | 36 (8.6%) | $83,750 |
| 6-Person Families | 6 (1.4%) | $0 |
| 7+ Person Families | 2 (0.5%) | $0 |
| Total | 416 (100.0%) | $68,800 |
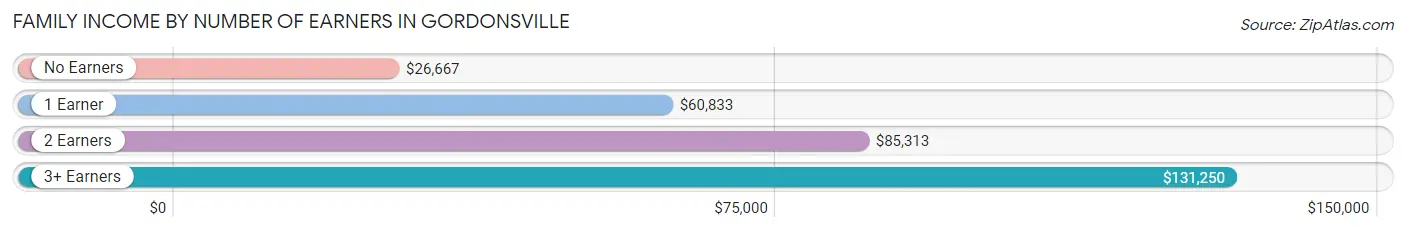
Family Income by Number of Earners in Gordonsville
The median family income in Gordonsville is $68,800, with families comprising 3+ earners (22) having the highest median family income of $131,250, while families with no earners (42) have the lowest median family income of $26,667, accounting for 5.3% and 10.1% of families, respectively.
| Number of Earners | # Families | Median Income |
| No Earners | 42 (10.1%) | $26,667 |
| 1 Earner | 162 (38.9%) | $60,833 |
| 2 Earners | 190 (45.7%) | $85,313 |
| 3+ Earners | 22 (5.3%) | $131,250 |
| Total | 416 (100.0%) | $68,800 |
Household Income in Gordonsville
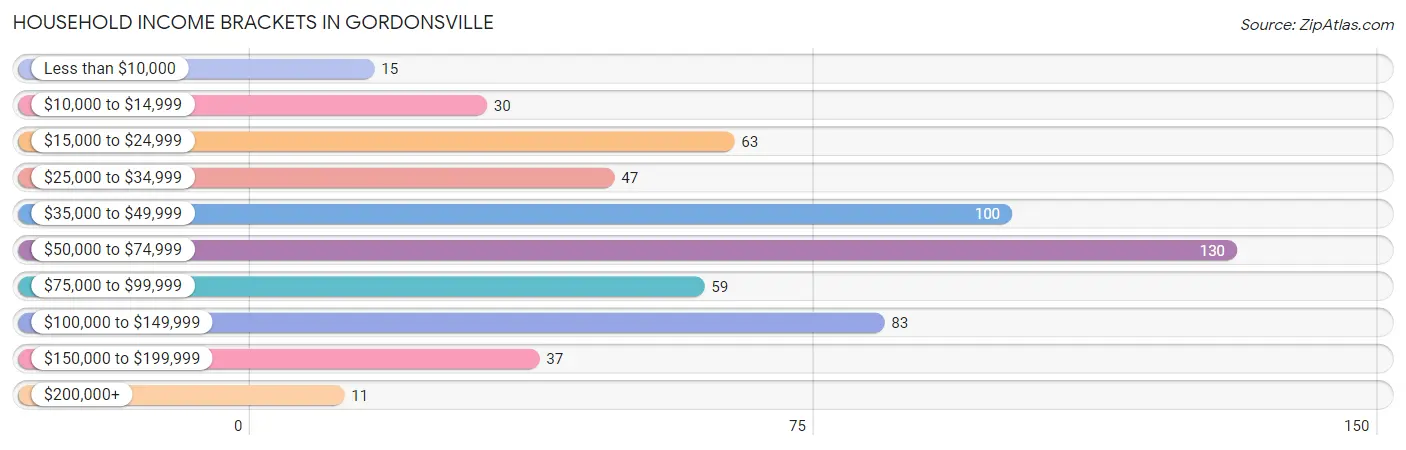
Household Income Brackets in Gordonsville
With 130 households falling in the category, the $50,000 to $74,999 income range is the most frequent in Gordonsville, accounting for 22.6% of all households. In contrast, only 11 households (1.9%) fall into the $200,000+ income bracket, making it the least populous group.
| Income Bracket | # Households | % Households |
| Less than $10,000 | 15 | 2.6% |
| $10,000 to $14,999 | 30 | 5.2% |
| $15,000 to $24,999 | 63 | 11.0% |
| $25,000 to $34,999 | 47 | 8.2% |
| $35,000 to $49,999 | 100 | 17.4% |
| $50,000 to $74,999 | 130 | 22.6% |
| $75,000 to $99,999 | 59 | 10.3% |
| $100,000 to $149,999 | 83 | 14.4% |
| $150,000 to $199,999 | 37 | 6.4% |
| $200,000+ | 11 | 1.9% |
Household Income by Householder Age in Gordonsville
The median household income in Gordonsville is $62,880, with the highest median household income of $88,333 found in the 45 to 64 years age bracket for the primary householder. A total of 186 households (32.4%) fall into this category. Meanwhile, the 15 to 24 years age bracket for the primary householder has the lowest median household income of $25,179, with 55 households (9.6%) in this group.
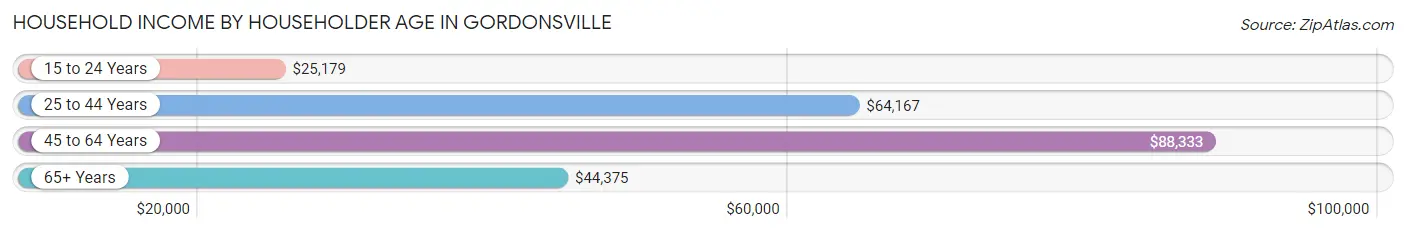
| Income Bracket | # Households | Median Income |
| 15 to 24 Years | 55 (9.6%) | $25,179 |
| 25 to 44 Years | 198 (34.4%) | $64,167 |
| 45 to 64 Years | 186 (32.4%) | $88,333 |
| 65+ Years | 136 (23.6%) | $44,375 |
| Total | 575 (100.0%) | $62,880 |
Poverty in Gordonsville
Income Below Poverty by Sex and Age in Gordonsville
With 6.4% poverty level for males and 11.3% for females among the residents of Gordonsville, 16 and 17 year old males and 75 year old and over females are the most vulnerable to poverty, with 5 males (33.3%) and 9 females (27.3%) in their respective age groups living below the poverty level.
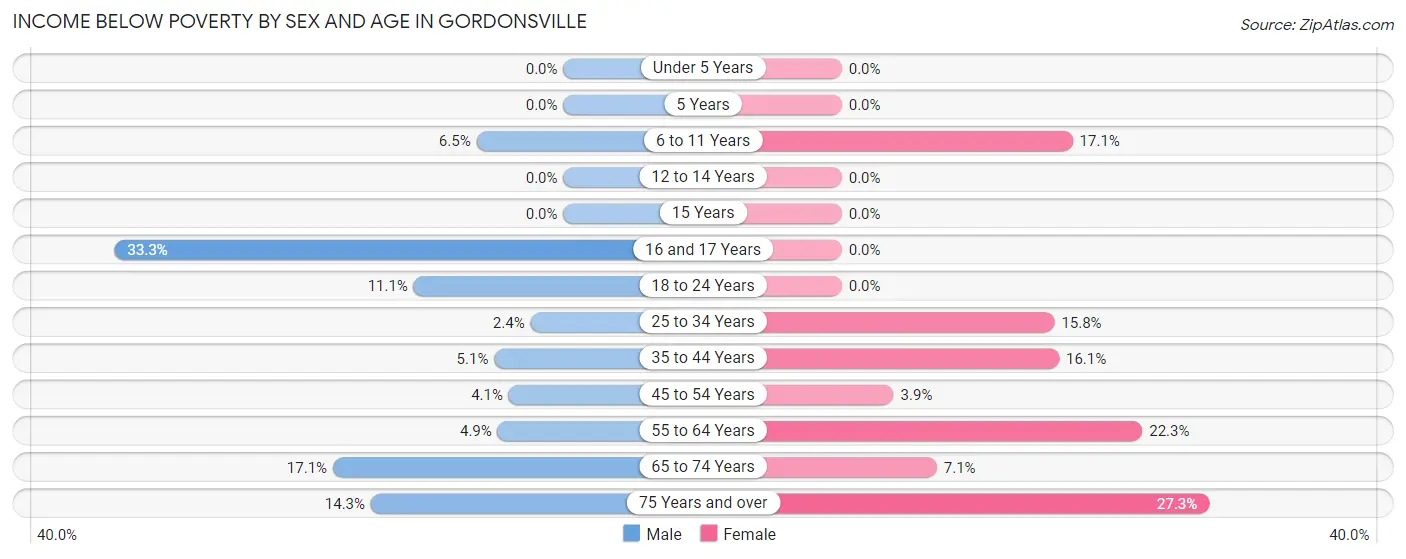
| Age Bracket | Male | Female |
| Under 5 Years | 0 (0.0%) | 0 (0.0%) |
| 5 Years | 0 (0.0%) | 0 (0.0%) |
| 6 to 11 Years | 6 (6.5%) | 6 (17.1%) |
| 12 to 14 Years | 0 (0.0%) | 0 (0.0%) |
| 15 Years | 0 (0.0%) | 0 (0.0%) |
| 16 and 17 Years | 5 (33.3%) | 0 (0.0%) |
| 18 to 24 Years | 7 (11.1%) | 0 (0.0%) |
| 25 to 34 Years | 3 (2.4%) | 18 (15.8%) |
| 35 to 44 Years | 4 (5.1%) | 10 (16.1%) |
| 45 to 54 Years | 3 (4.1%) | 3 (3.8%) |
| 55 to 64 Years | 4 (4.9%) | 29 (22.3%) |
| 65 to 74 Years | 13 (17.1%) | 6 (7.1%) |
| 75 Years and over | 3 (14.3%) | 9 (27.3%) |
| Total | 48 (6.4%) | 81 (11.3%) |
Income Above Poverty by Sex and Age in Gordonsville
According to the poverty statistics in Gordonsville, males aged under 5 years and females aged under 5 years are the age groups that are most secure financially, with 100.0% of males and 100.0% of females in these age groups living above the poverty line.
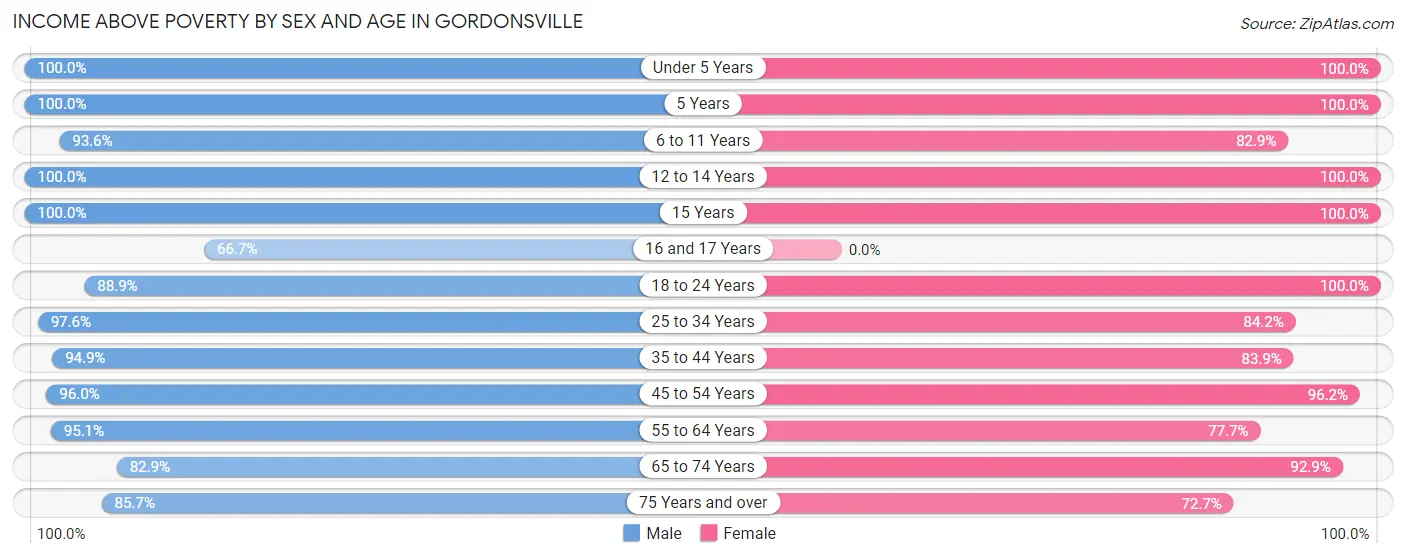
| Age Bracket | Male | Female |
| Under 5 Years | 68 (100.0%) | 30 (100.0%) |
| 5 Years | 11 (100.0%) | 10 (100.0%) |
| 6 to 11 Years | 87 (93.5%) | 29 (82.9%) |
| 12 to 14 Years | 42 (100.0%) | 38 (100.0%) |
| 15 Years | 5 (100.0%) | 9 (100.0%) |
| 16 and 17 Years | 10 (66.7%) | 0 (0.0%) |
| 18 to 24 Years | 56 (88.9%) | 94 (100.0%) |
| 25 to 34 Years | 120 (97.6%) | 96 (84.2%) |
| 35 to 44 Years | 74 (94.9%) | 52 (83.9%) |
| 45 to 54 Years | 71 (96.0%) | 75 (96.2%) |
| 55 to 64 Years | 78 (95.1%) | 101 (77.7%) |
| 65 to 74 Years | 63 (82.9%) | 79 (92.9%) |
| 75 Years and over | 18 (85.7%) | 24 (72.7%) |
| Total | 703 (93.6%) | 637 (88.7%) |
Income Below Poverty Among Married-Couple Families in Gordonsville
The poverty statistics for married-couple families in Gordonsville show that 5.9% or 17 of the total 288 families live below the poverty line. Families with no children have the highest poverty rate of 7.9%, comprising of 13 families. On the other hand, families with 3 or 4 children have the lowest poverty rate of 0.0%, which includes 0 families.
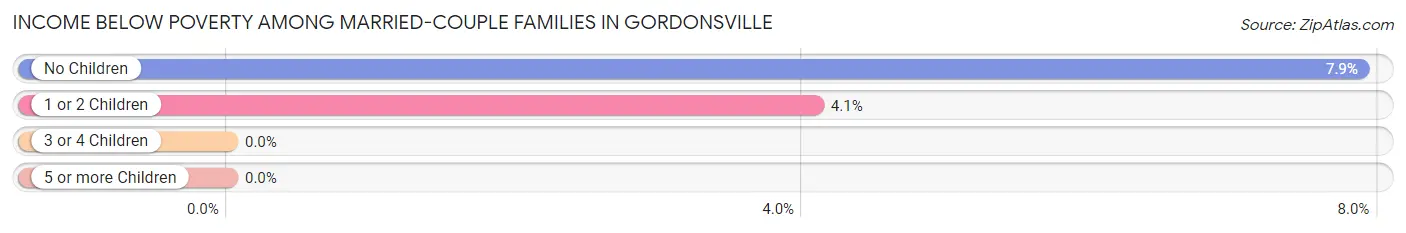
| Children | Above Poverty | Below Poverty |
| No Children | 152 (92.1%) | 13 (7.9%) |
| 1 or 2 Children | 94 (95.9%) | 4 (4.1%) |
| 3 or 4 Children | 25 (100.0%) | 0 (0.0%) |
| 5 or more Children | 0 (0.0%) | 0 (0.0%) |
| Total | 271 (94.1%) | 17 (5.9%) |
Income Below Poverty Among Single-Parent Households in Gordonsville
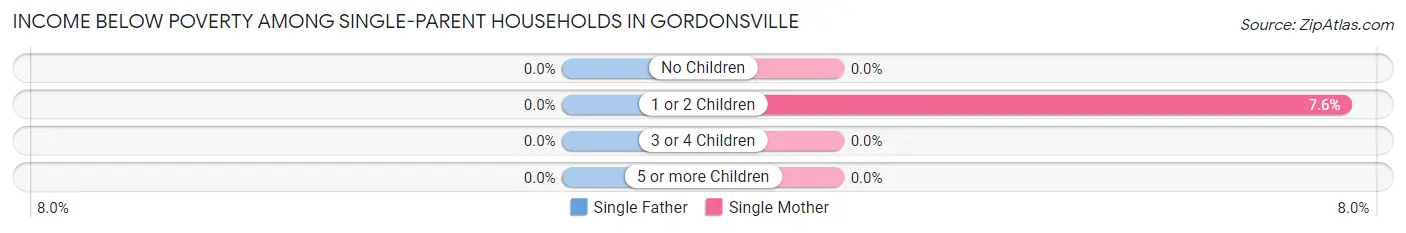
| Children | Single Father | Single Mother |
| No Children | 0 (0.0%) | 0 (0.0%) |
| 1 or 2 Children | 0 (0.0%) | 5 (7.6%) |
| 3 or 4 Children | 0 (0.0%) | 0 (0.0%) |
| 5 or more Children | 0 (0.0%) | 0 (0.0%) |
| Total | 0 (0.0%) | 5 (5.1%) |
Income Below Poverty Among Married-Couple vs Single-Parent Households in Gordonsville
The poverty data for Gordonsville shows that 17 of the married-couple family households (5.9%) and 5 of the single-parent households (3.9%) are living below the poverty level. Within the married-couple family households, those with no children have the highest poverty rate, with 13 households (7.9%) falling below the poverty line. Among the single-parent households, those with 1 or 2 children have the highest poverty rate, with 5 household (5.4%) living below poverty.
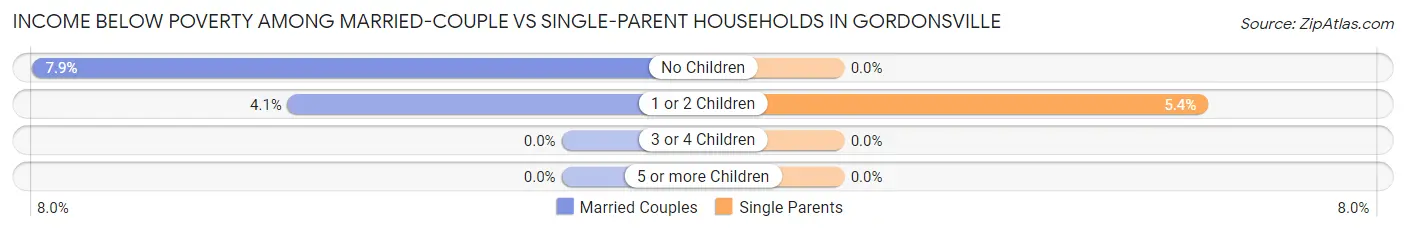
| Children | Married-Couple Families | Single-Parent Households |
| No Children | 13 (7.9%) | 0 (0.0%) |
| 1 or 2 Children | 4 (4.1%) | 5 (5.4%) |
| 3 or 4 Children | 0 (0.0%) | 0 (0.0%) |
| 5 or more Children | 0 (0.0%) | 0 (0.0%) |
| Total | 17 (5.9%) | 5 (3.9%) |
Race in Gordonsville
The most populous races in Gordonsville are White / Caucasian (1,332 | 90.7%), Hispanic or Latino (86 | 5.9%), and Black / African American (65 | 4.4%).
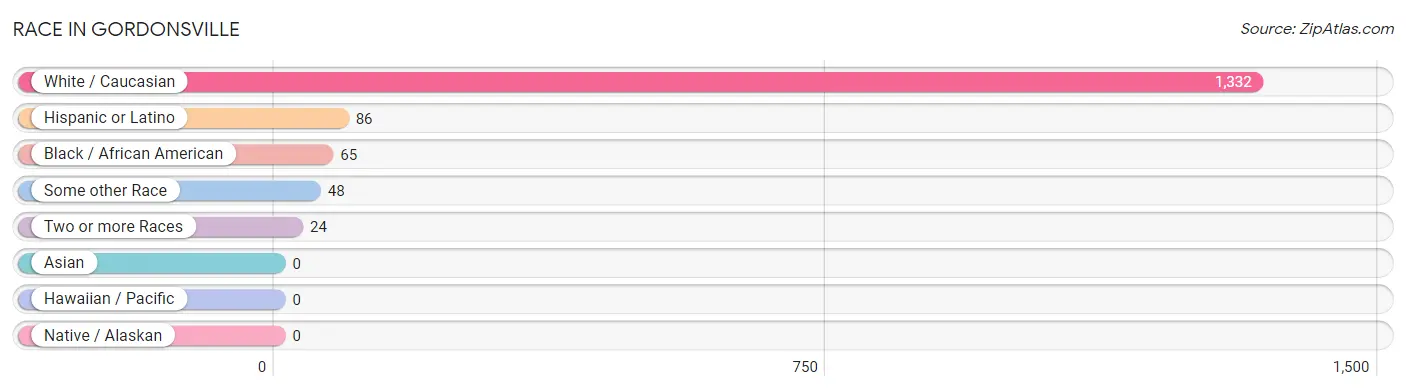
| Race | # Population | % Population |
| Asian | 0 | 0.0% |
| Black / African American | 65 | 4.4% |
| Hawaiian / Pacific | 0 | 0.0% |
| Hispanic or Latino | 86 | 5.9% |
| Native / Alaskan | 0 | 0.0% |
| White / Caucasian | 1,332 | 90.7% |
| Two or more Races | 24 | 1.6% |
| Some other Race | 48 | 3.3% |
| Total | 1,469 | 100.0% |
Ancestry in Gordonsville
The most populous ancestries reported in Gordonsville are American (193 | 13.1%), English (160 | 10.9%), Mexican (86 | 5.9%), German (72 | 4.9%), and Irish (58 | 4.0%), together accounting for 38.7% of all Gordonsville residents.
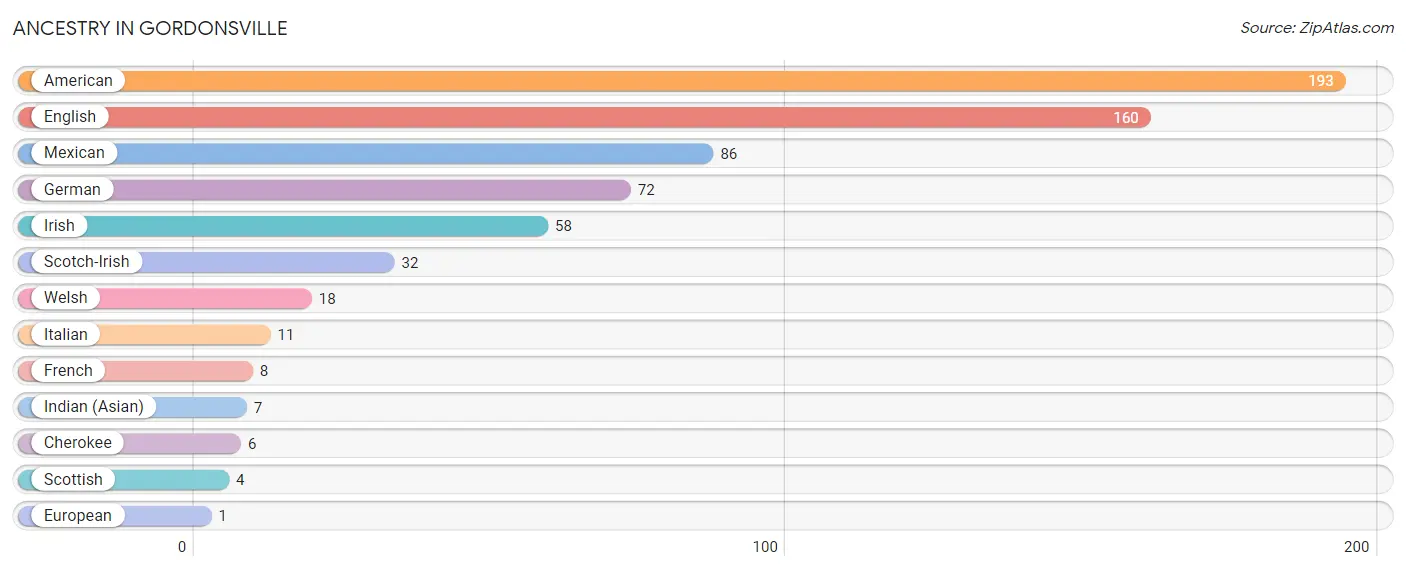
| Ancestry | # Population | % Population |
| American | 193 | 13.1% |
| Cherokee | 6 | 0.4% |
| English | 160 | 10.9% |
| European | 1 | 0.1% |
| French | 8 | 0.5% |
| German | 72 | 4.9% |
| Indian (Asian) | 7 | 0.5% |
| Irish | 58 | 4.0% |
| Italian | 11 | 0.7% |
| Mexican | 86 | 5.9% |
| Scotch-Irish | 32 | 2.2% |
| Scottish | 4 | 0.3% |
| Welsh | 18 | 1.2% | View All 13 Rows |
Immigrants in Gordonsville
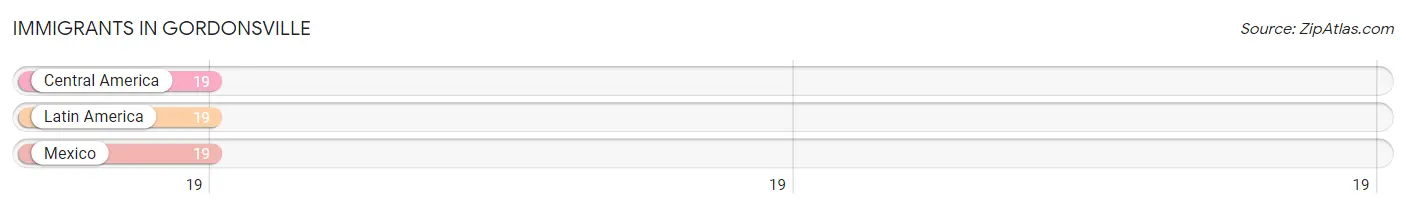
The most numerous immigrant groups reported in Gordonsville came from Central America (19 | 1.3%), Latin America (19 | 1.3%), and Mexico (19 | 1.3%), together accounting for 3.9% of all Gordonsville residents.
| Immigration Origin | # Population | % Population |
| Central America | 19 | 1.3% |
| Latin America | 19 | 1.3% |
| Mexico | 19 | 1.3% | View All 3 Rows |
Sex and Age in Gordonsville
Sex and Age in Gordonsville
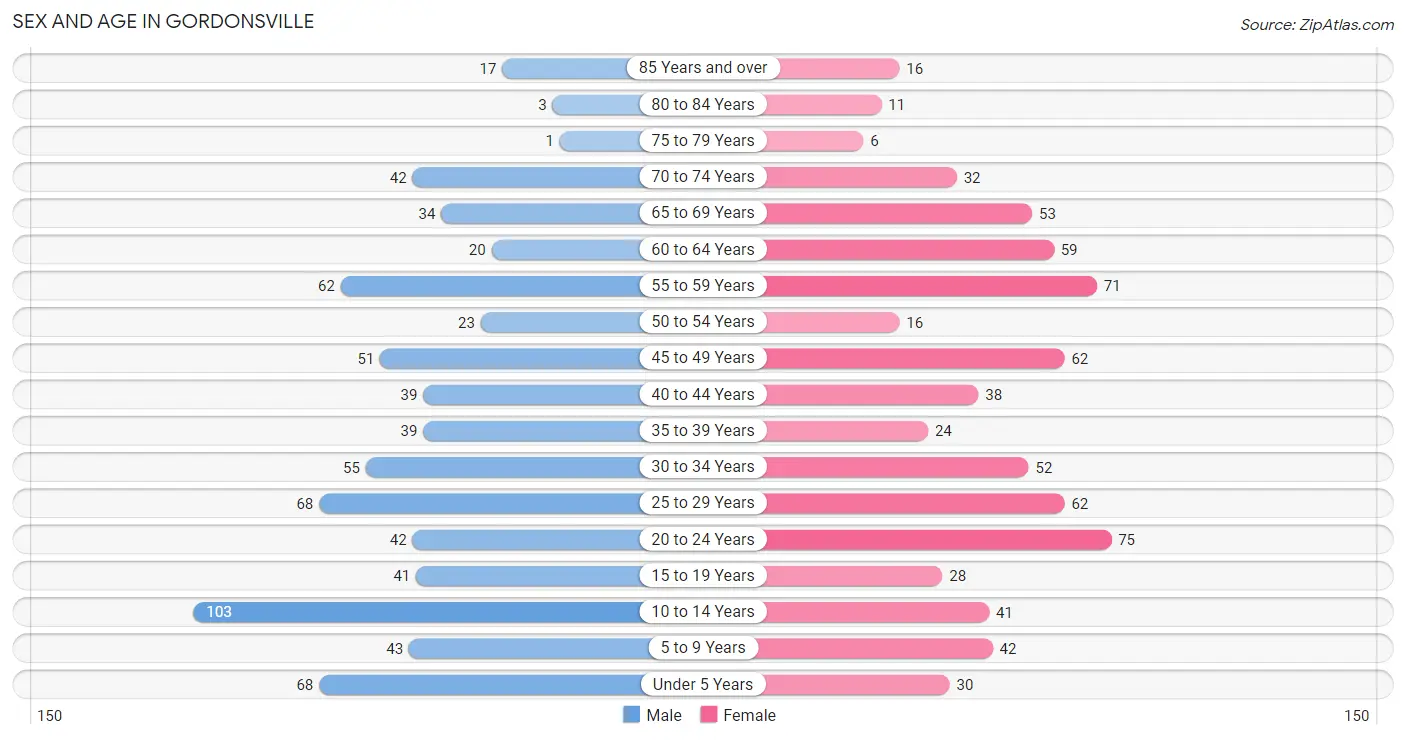
The most populous age groups in Gordonsville are 10 to 14 Years (103 | 13.7%) for men and 20 to 24 Years (75 | 10.4%) for women.
| Age Bracket | Male | Female |
| Under 5 Years | 68 (9.0%) | 30 (4.2%) |
| 5 to 9 Years | 43 (5.7%) | 42 (5.9%) |
| 10 to 14 Years | 103 (13.7%) | 41 (5.7%) |
| 15 to 19 Years | 41 (5.5%) | 28 (3.9%) |
| 20 to 24 Years | 42 (5.6%) | 75 (10.4%) |
| 25 to 29 Years | 68 (9.0%) | 62 (8.6%) |
| 30 to 34 Years | 55 (7.3%) | 52 (7.2%) |
| 35 to 39 Years | 39 (5.2%) | 24 (3.3%) |
| 40 to 44 Years | 39 (5.2%) | 38 (5.3%) |
| 45 to 49 Years | 51 (6.8%) | 62 (8.6%) |
| 50 to 54 Years | 23 (3.1%) | 16 (2.2%) |
| 55 to 59 Years | 62 (8.3%) | 71 (9.9%) |
| 60 to 64 Years | 20 (2.7%) | 59 (8.2%) |
| 65 to 69 Years | 34 (4.5%) | 53 (7.4%) |
| 70 to 74 Years | 42 (5.6%) | 32 (4.5%) |
| 75 to 79 Years | 1 (0.1%) | 6 (0.8%) |
| 80 to 84 Years | 3 (0.4%) | 11 (1.5%) |
| 85 Years and over | 17 (2.3%) | 16 (2.2%) |
| Total | 751 (100.0%) | 718 (100.0%) |
Families and Households in Gordonsville
Median Family Size in Gordonsville
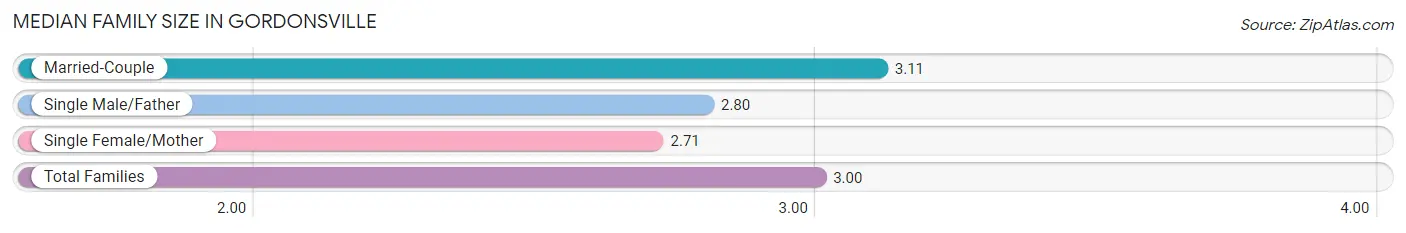
The median family size in Gordonsville is 3.00 persons per family, with married-couple families (288 | 69.2%) accounting for the largest median family size of 3.11 persons per family. On the other hand, single female/mother families (98 | 23.6%) represent the smallest median family size with 2.71 persons per family.
| Family Type | # Families | Family Size |
| Married-Couple | 288 (69.2%) | 3.11 |
| Single Male/Father | 30 (7.2%) | 2.80 |
| Single Female/Mother | 98 (23.6%) | 2.71 |
| Total Families | 416 (100.0%) | 3.00 |
Median Household Size in Gordonsville
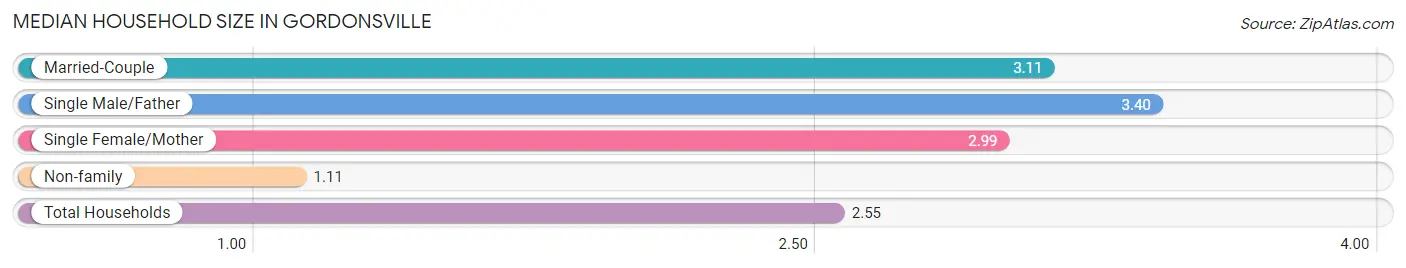
The median household size in Gordonsville is 2.55 persons per household, with single male/father households (30 | 5.2%) accounting for the largest median household size of 3.4 persons per household. non-family households (159 | 27.7%) represent the smallest median household size with 1.11 persons per household.
| Household Type | # Households | Household Size |
| Married-Couple | 288 (50.1%) | 3.11 |
| Single Male/Father | 30 (5.2%) | 3.40 |
| Single Female/Mother | 98 (17.0%) | 2.99 |
| Non-family | 159 (27.7%) | 1.11 |
| Total Households | 575 (100.0%) | 2.55 |
Household Size by Marriage Status in Gordonsville
Out of a total of 575 households in Gordonsville, 416 (72.4%) are family households, while 159 (27.7%) are nonfamily households. The most numerous type of family households are 2-person households, comprising 159, and the most common type of nonfamily households are 1-person households, comprising 141.
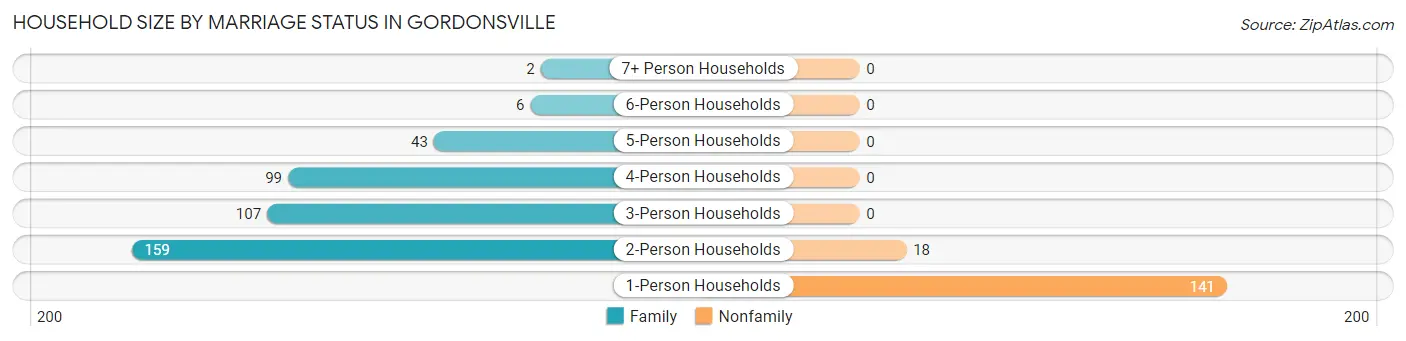
| Household Size | Family Households | Nonfamily Households |
| 1-Person Households | - | 141 (24.5%) |
| 2-Person Households | 159 (27.7%) | 18 (3.1%) |
| 3-Person Households | 107 (18.6%) | 0 (0.0%) |
| 4-Person Households | 99 (17.2%) | 0 (0.0%) |
| 5-Person Households | 43 (7.5%) | 0 (0.0%) |
| 6-Person Households | 6 (1.0%) | 0 (0.0%) |
| 7+ Person Households | 2 (0.4%) | 0 (0.0%) |
| Total | 416 (72.4%) | 159 (27.7%) |
Female Fertility in Gordonsville
Fertility by Age in Gordonsville
Average fertility rate in Gordonsville is 82.0 births per 1,000 women. Women in the age bracket of 20 to 34 years have the highest fertility rate with 148.0 births per 1,000 women. Women in the age bracket of 20 to 34 years acount for 100.0% of all women with births.
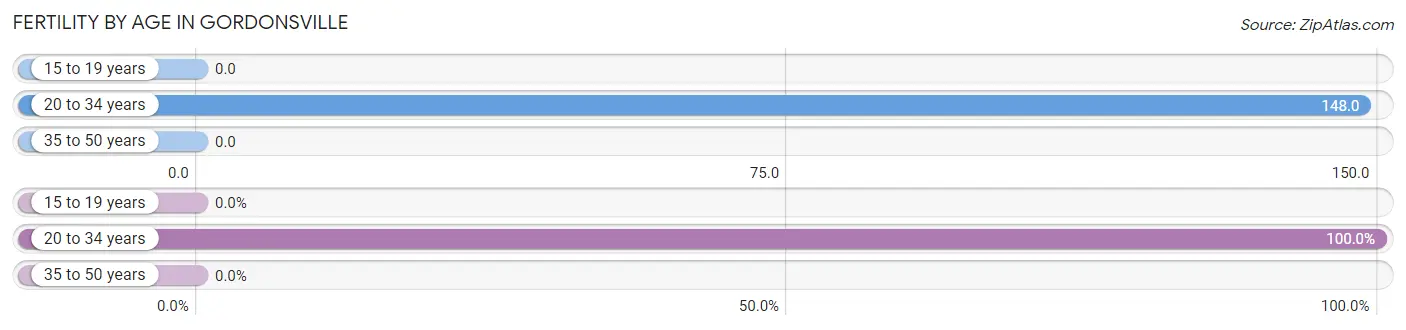
| Age Bracket | Women with Births | Births / 1,000 Women |
| 15 to 19 years | 0 (0.0%) | 0.0 |
| 20 to 34 years | 28 (100.0%) | 148.0 |
| 35 to 50 years | 0 (0.0%) | 0.0 |
| Total | 28 (100.0%) | 82.0 |
Fertility by Age by Marriage Status in Gordonsville
57.1% of women with births (28) in Gordonsville are married. The highest percentage of unmarried women with births falls into 20 to 34 years age bracket with 42.9% of them unmarried at the time of birth, while the lowest percentage of unmarried women with births belong to 20 to 34 years age bracket with 42.9% of them unmarried.
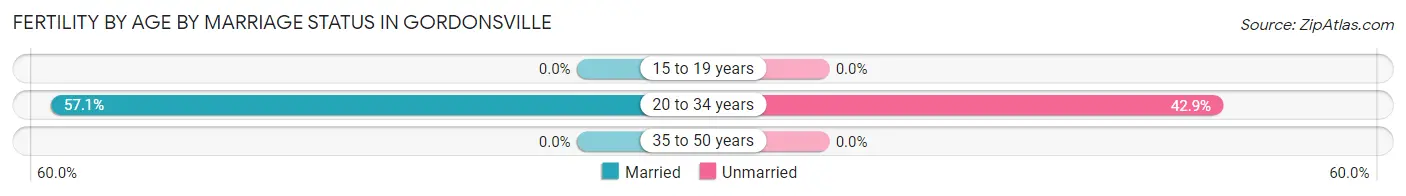
| Age Bracket | Married | Unmarried |
| 15 to 19 years | 0 (0.0%) | 0 (0.0%) |
| 20 to 34 years | 16 (57.1%) | 12 (42.9%) |
| 35 to 50 years | 0 (0.0%) | 0 (0.0%) |
| Total | 16 (57.1%) | 12 (42.9%) |
Fertility by Education in Gordonsville
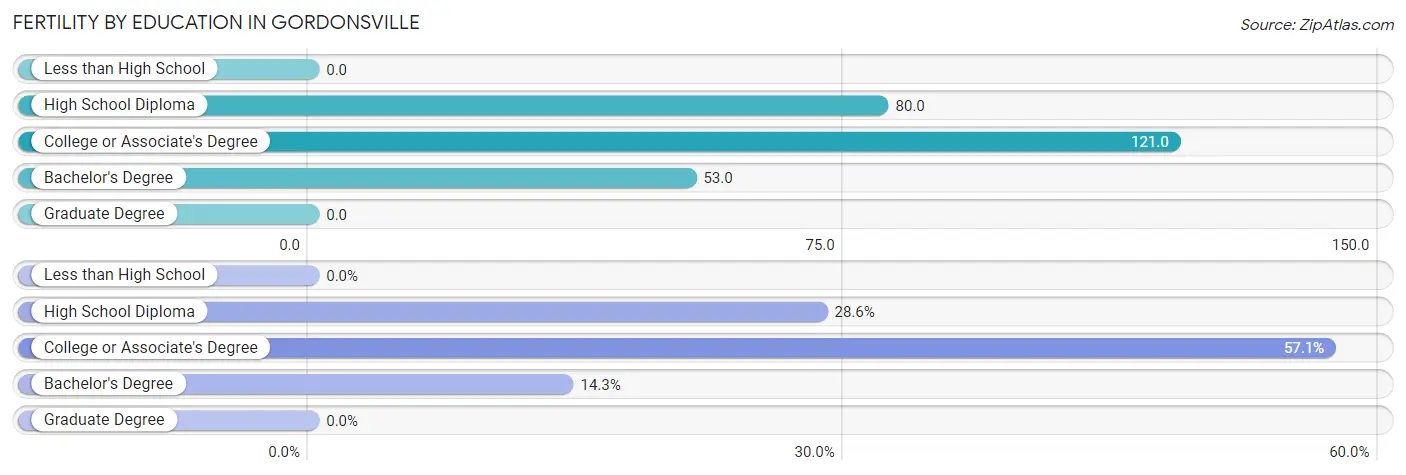
| Educational Attainment | Women with Births | Births / 1,000 Women |
| Less than High School | 0 (0.0%) | 0.0 |
| High School Diploma | 8 (28.6%) | 80.0 |
| College or Associate's Degree | 16 (57.1%) | 121.0 |
| Bachelor's Degree | 4 (14.3%) | 53.0 |
| Graduate Degree | 0 (0.0%) | 0.0 |
| Total | 28 (100.0%) | 82.0 |
Fertility by Education by Marriage Status in Gordonsville
42.9% of women with births in Gordonsville are unmarried. Women with the educational attainment of high school diploma are most likely to be married with 100.0% of them married at childbirth, while women with the educational attainment of college or associate's degree are least likely to be married with 75.0% of them unmarried at childbirth.
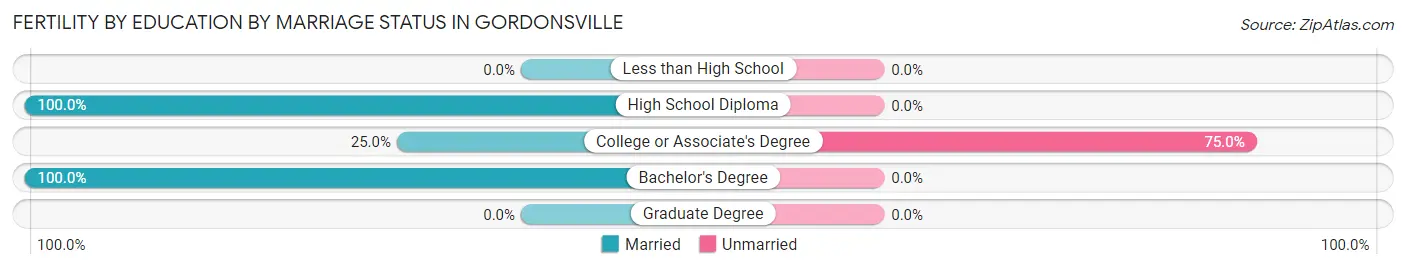
| Educational Attainment | Married | Unmarried |
| Less than High School | 0 (0.0%) | 0 (0.0%) |
| High School Diploma | 8 (100.0%) | 0 (0.0%) |
| College or Associate's Degree | 4 (25.0%) | 12 (75.0%) |
| Bachelor's Degree | 4 (100.0%) | 0 (0.0%) |
| Graduate Degree | 0 (0.0%) | 0 (0.0%) |
| Total | 16 (57.1%) | 12 (42.9%) |
Employment Characteristics in Gordonsville
Employment by Class of Employer in Gordonsville
Among the 739 employed individuals in Gordonsville, private company employees (499 | 67.5%), local government employees (61 | 8.3%), and self-employed (not incorporated) (53 | 7.2%) make up the most common classes of employment.
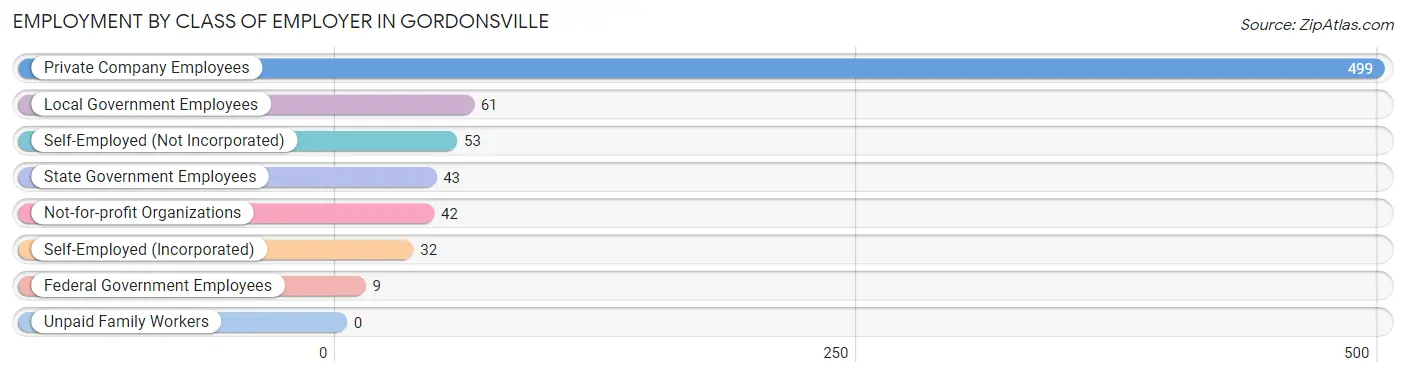
| Employer Class | # Employees | % Employees |
| Private Company Employees | 499 | 67.5% |
| Self-Employed (Incorporated) | 32 | 4.3% |
| Self-Employed (Not Incorporated) | 53 | 7.2% |
| Not-for-profit Organizations | 42 | 5.7% |
| Local Government Employees | 61 | 8.3% |
| State Government Employees | 43 | 5.8% |
| Federal Government Employees | 9 | 1.2% |
| Unpaid Family Workers | 0 | 0.0% |
| Total | 739 | 100.0% |
Employment Status by Age in Gordonsville
According to the labor force statistics for Gordonsville, out of the total population over 16 years of age (1,128), 69.1% or 779 individuals are in the labor force, with 2.2% or 17 of them unemployed. The age group with the highest labor force participation rate is 30 to 34 years, with 97.2% or 104 individuals in the labor force. Within the labor force, the 35 to 44 years age range has the highest percentage of unemployed individuals, with 16.5% or 17 of them being unemployed.
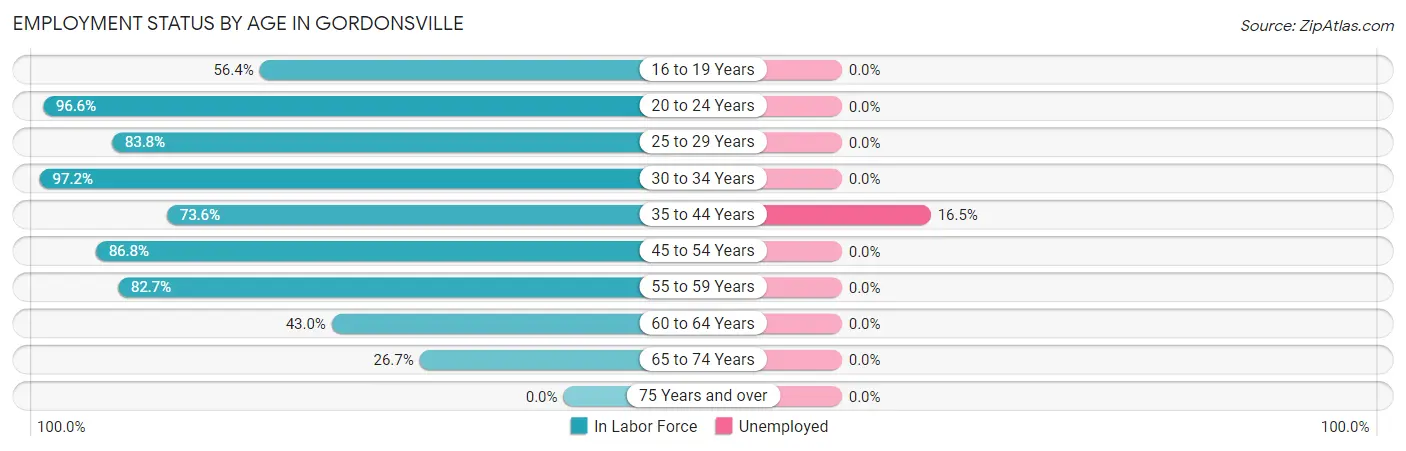
| Age Bracket | In Labor Force | Unemployed |
| 16 to 19 Years | 31 (56.4%) | 0 (0.0%) |
| 20 to 24 Years | 113 (96.6%) | 0 (0.0%) |
| 25 to 29 Years | 109 (83.8%) | 0 (0.0%) |
| 30 to 34 Years | 104 (97.2%) | 0 (0.0%) |
| 35 to 44 Years | 103 (73.6%) | 17 (16.5%) |
| 45 to 54 Years | 132 (86.8%) | 0 (0.0%) |
| 55 to 59 Years | 110 (82.7%) | 0 (0.0%) |
| 60 to 64 Years | 34 (43.0%) | 0 (0.0%) |
| 65 to 74 Years | 43 (26.7%) | 0 (0.0%) |
| 75 Years and over | 0 (0.0%) | 0 (0.0%) |
| Total | 779 (69.1%) | 17 (2.2%) |
Employment Status by Educational Attainment in Gordonsville
According to labor force statistics for Gordonsville, 79.9% of individuals (592) out of the total population between 25 and 64 years of age (741) are in the labor force, with 2.9% or 17 of them being unemployed. The group with the highest labor force participation rate are those with the educational attainment of bachelor's degree or higher, with 98.2% or 112 individuals in the labor force. Within the labor force, individuals with college / associate degree education have the highest percentage of unemployment, with 5.9% or 12 of them being unemployed.
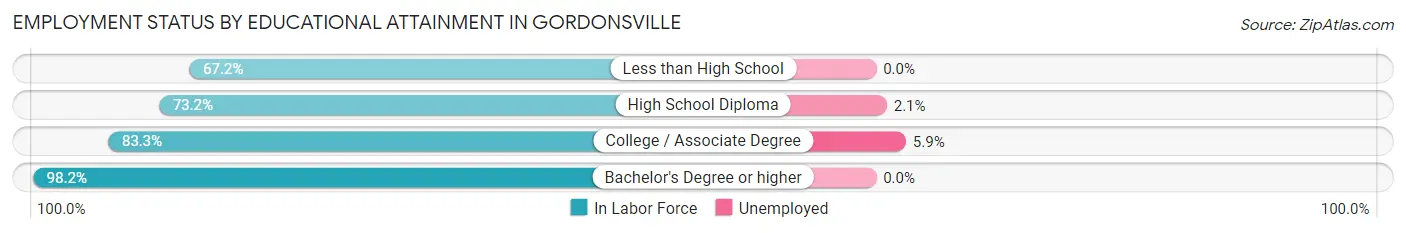
| Educational Attainment | In Labor Force | Unemployed |
| Less than High School | 41 (67.2%) | 0 (0.0%) |
| High School Diploma | 235 (73.2%) | 7 (2.1%) |
| College / Associate Degree | 204 (83.3%) | 14 (5.9%) |
| Bachelor's Degree or higher | 112 (98.2%) | 0 (0.0%) |
| Total | 592 (79.9%) | 21 (2.9%) |
Employment Occupations by Sex in Gordonsville
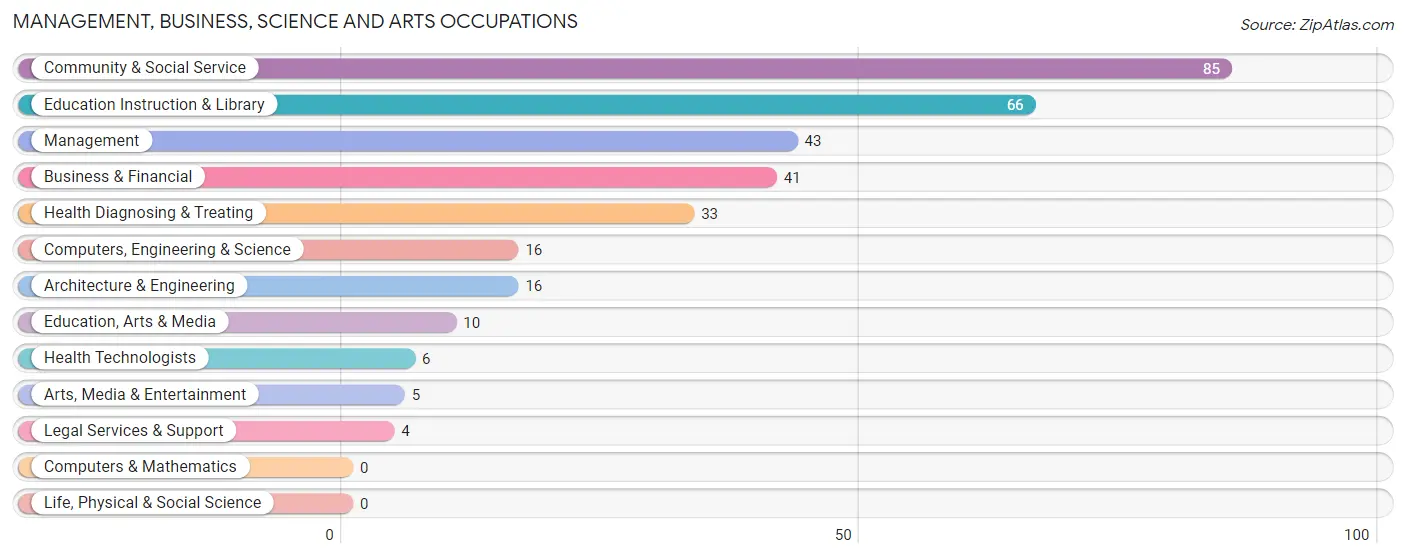
Management, Business, Science and Arts Occupations
The most common Management, Business, Science and Arts occupations in Gordonsville are Community & Social Service (85 | 11.2%), Education Instruction & Library (66 | 8.7%), Management (43 | 5.6%), Business & Financial (41 | 5.4%), and Health Diagnosing & Treating (33 | 4.3%).
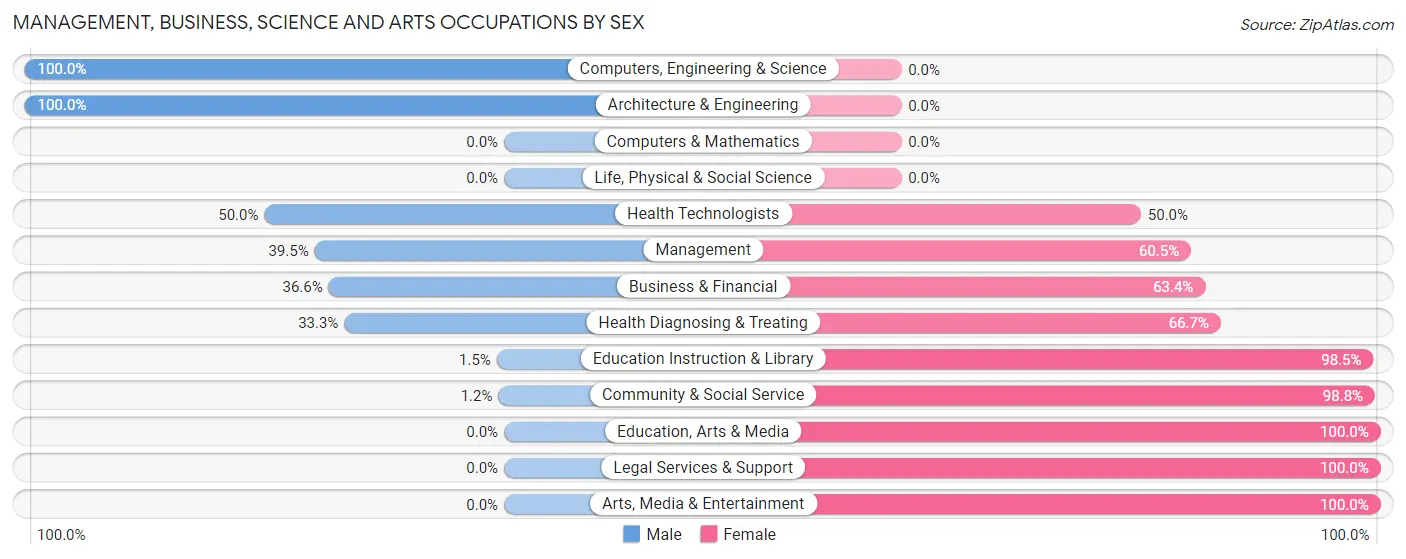
Management, Business, Science and Arts Occupations by Sex
Within the Management, Business, Science and Arts occupations in Gordonsville, the most male-oriented occupations are Computers, Engineering & Science (100.0%), Architecture & Engineering (100.0%), and Health Technologists (50.0%), while the most female-oriented occupations are Education, Arts & Media (100.0%), Legal Services & Support (100.0%), and Arts, Media & Entertainment (100.0%).
| Occupation | Male | Female |
| Management | 17 (39.5%) | 26 (60.5%) |
| Business & Financial | 15 (36.6%) | 26 (63.4%) |
| Computers, Engineering & Science | 16 (100.0%) | 0 (0.0%) |
| Computers & Mathematics | 0 (0.0%) | 0 (0.0%) |
| Architecture & Engineering | 16 (100.0%) | 0 (0.0%) |
| Life, Physical & Social Science | 0 (0.0%) | 0 (0.0%) |
| Community & Social Service | 1 (1.2%) | 84 (98.8%) |
| Education, Arts & Media | 0 (0.0%) | 10 (100.0%) |
| Legal Services & Support | 0 (0.0%) | 4 (100.0%) |
| Education Instruction & Library | 1 (1.5%) | 65 (98.5%) |
| Arts, Media & Entertainment | 0 (0.0%) | 5 (100.0%) |
| Health Diagnosing & Treating | 11 (33.3%) | 22 (66.7%) |
| Health Technologists | 3 (50.0%) | 3 (50.0%) |
| Total (Category) | 60 (27.5%) | 158 (72.5%) |
| Total (Overall) | 361 (47.4%) | 401 (52.6%) |
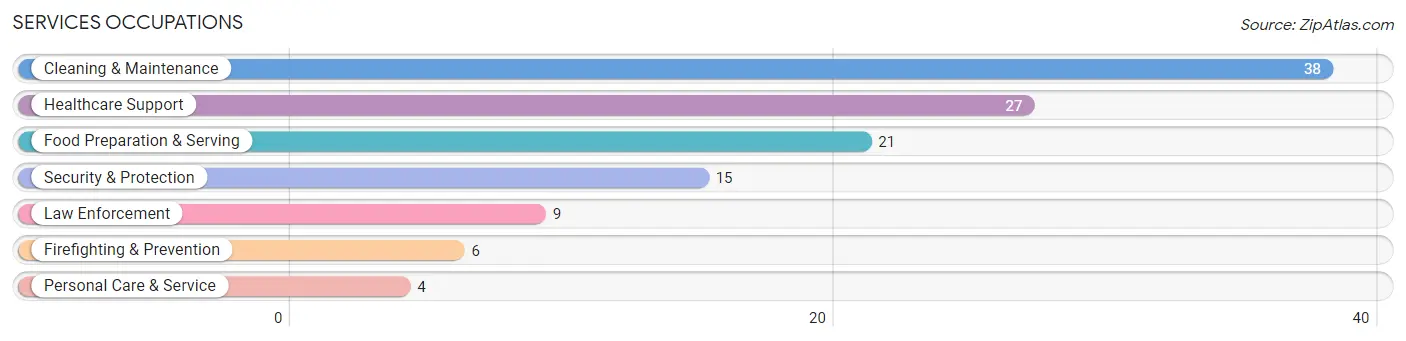
Services Occupations
The most common Services occupations in Gordonsville are Cleaning & Maintenance (38 | 5.0%), Healthcare Support (27 | 3.5%), Food Preparation & Serving (21 | 2.8%), Security & Protection (15 | 2.0%), and Law Enforcement (9 | 1.2%).
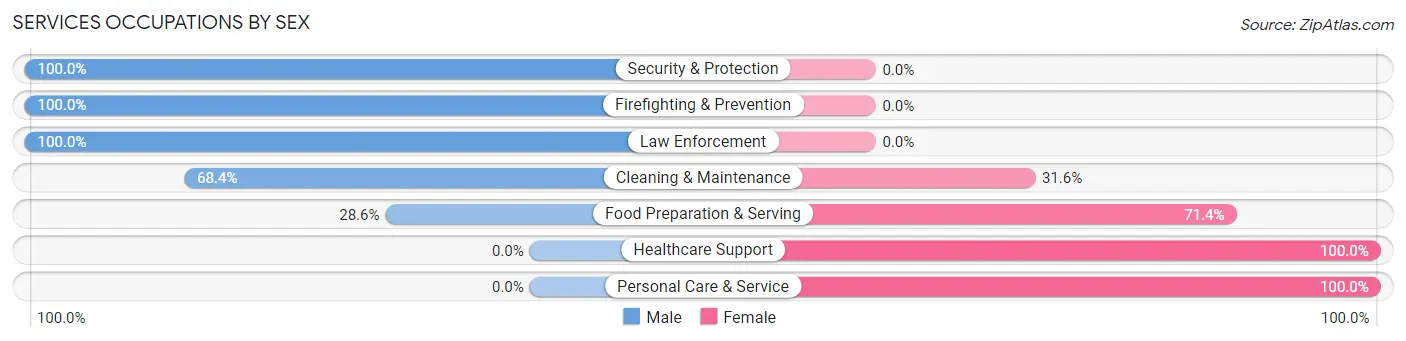
Services Occupations by Sex
Within the Services occupations in Gordonsville, the most male-oriented occupations are Security & Protection (100.0%), Firefighting & Prevention (100.0%), and Law Enforcement (100.0%), while the most female-oriented occupations are Healthcare Support (100.0%), Personal Care & Service (100.0%), and Food Preparation & Serving (71.4%).
| Occupation | Male | Female |
| Healthcare Support | 0 (0.0%) | 27 (100.0%) |
| Security & Protection | 15 (100.0%) | 0 (0.0%) |
| Firefighting & Prevention | 6 (100.0%) | 0 (0.0%) |
| Law Enforcement | 9 (100.0%) | 0 (0.0%) |
| Food Preparation & Serving | 6 (28.6%) | 15 (71.4%) |
| Cleaning & Maintenance | 26 (68.4%) | 12 (31.6%) |
| Personal Care & Service | 0 (0.0%) | 4 (100.0%) |
| Total (Category) | 47 (44.8%) | 58 (55.2%) |
| Total (Overall) | 361 (47.4%) | 401 (52.6%) |
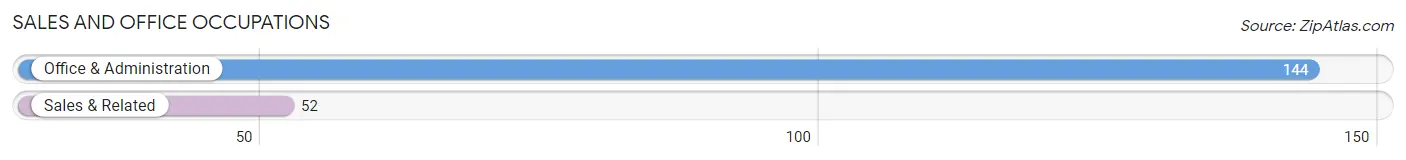
Sales and Office Occupations
The most common Sales and Office occupations in Gordonsville are Office & Administration (144 | 18.9%), and Sales & Related (52 | 6.8%).
Sales and Office Occupations by Sex
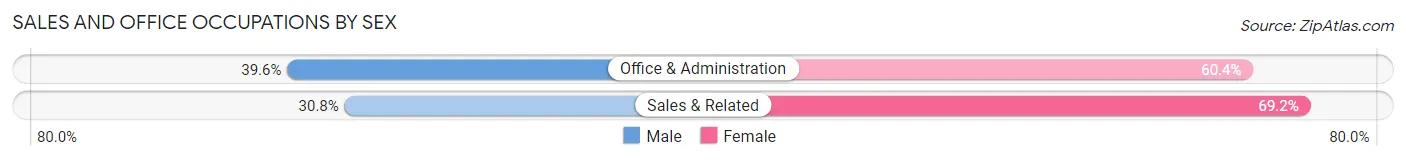
| Occupation | Male | Female |
| Sales & Related | 16 (30.8%) | 36 (69.2%) |
| Office & Administration | 57 (39.6%) | 87 (60.4%) |
| Total (Category) | 73 (37.2%) | 123 (62.8%) |
| Total (Overall) | 361 (47.4%) | 401 (52.6%) |
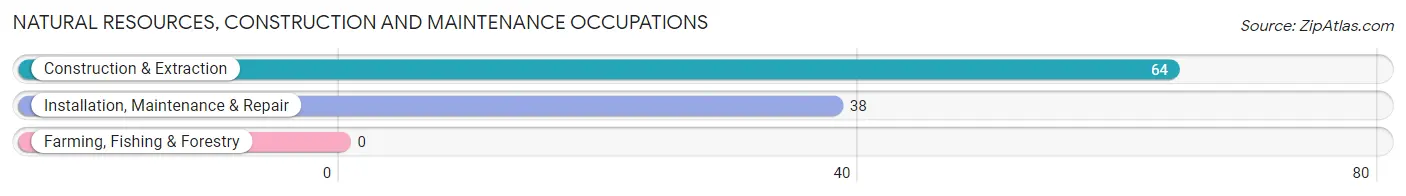
Natural Resources, Construction and Maintenance Occupations
The most common Natural Resources, Construction and Maintenance occupations in Gordonsville are Construction & Extraction (64 | 8.4%), and Installation, Maintenance & Repair (38 | 5.0%).
Natural Resources, Construction and Maintenance Occupations by Sex
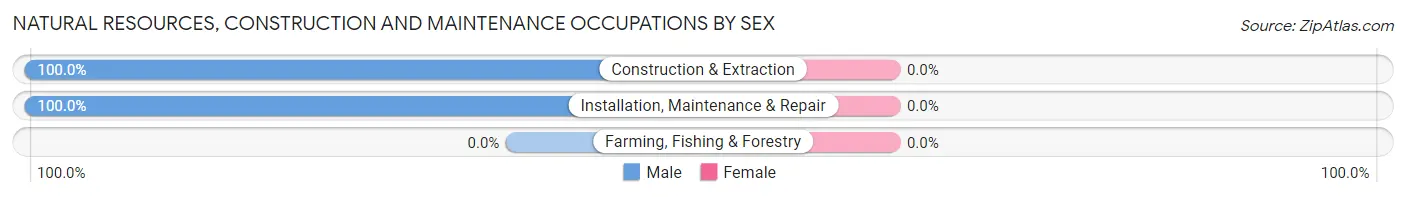
| Occupation | Male | Female |
| Farming, Fishing & Forestry | 0 (0.0%) | 0 (0.0%) |
| Construction & Extraction | 64 (100.0%) | 0 (0.0%) |
| Installation, Maintenance & Repair | 38 (100.0%) | 0 (0.0%) |
| Total (Category) | 102 (100.0%) | 0 (0.0%) |
| Total (Overall) | 361 (47.4%) | 401 (52.6%) |
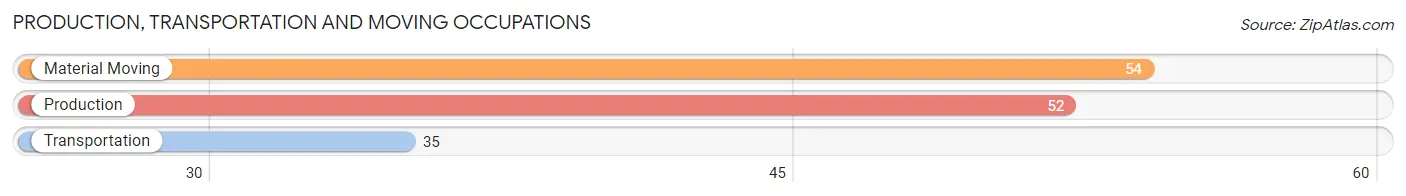
Production, Transportation and Moving Occupations
The most common Production, Transportation and Moving occupations in Gordonsville are Material Moving (54 | 7.1%), Production (52 | 6.8%), and Transportation (35 | 4.6%).
Production, Transportation and Moving Occupations by Sex
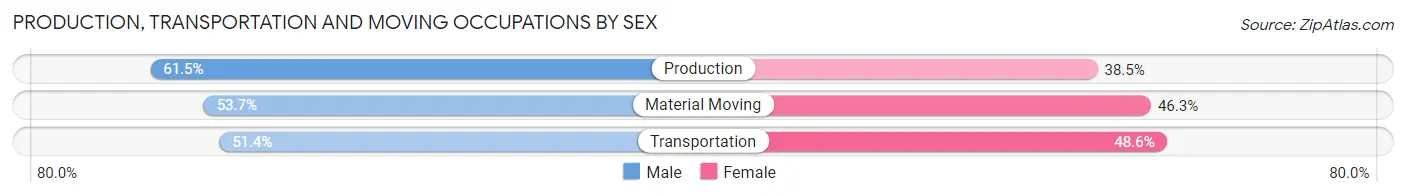
| Occupation | Male | Female |
| Production | 32 (61.5%) | 20 (38.5%) |
| Transportation | 18 (51.4%) | 17 (48.6%) |
| Material Moving | 29 (53.7%) | 25 (46.3%) |
| Total (Category) | 79 (56.0%) | 62 (44.0%) |
| Total (Overall) | 361 (47.4%) | 401 (52.6%) |
Employment Industries by Sex in Gordonsville
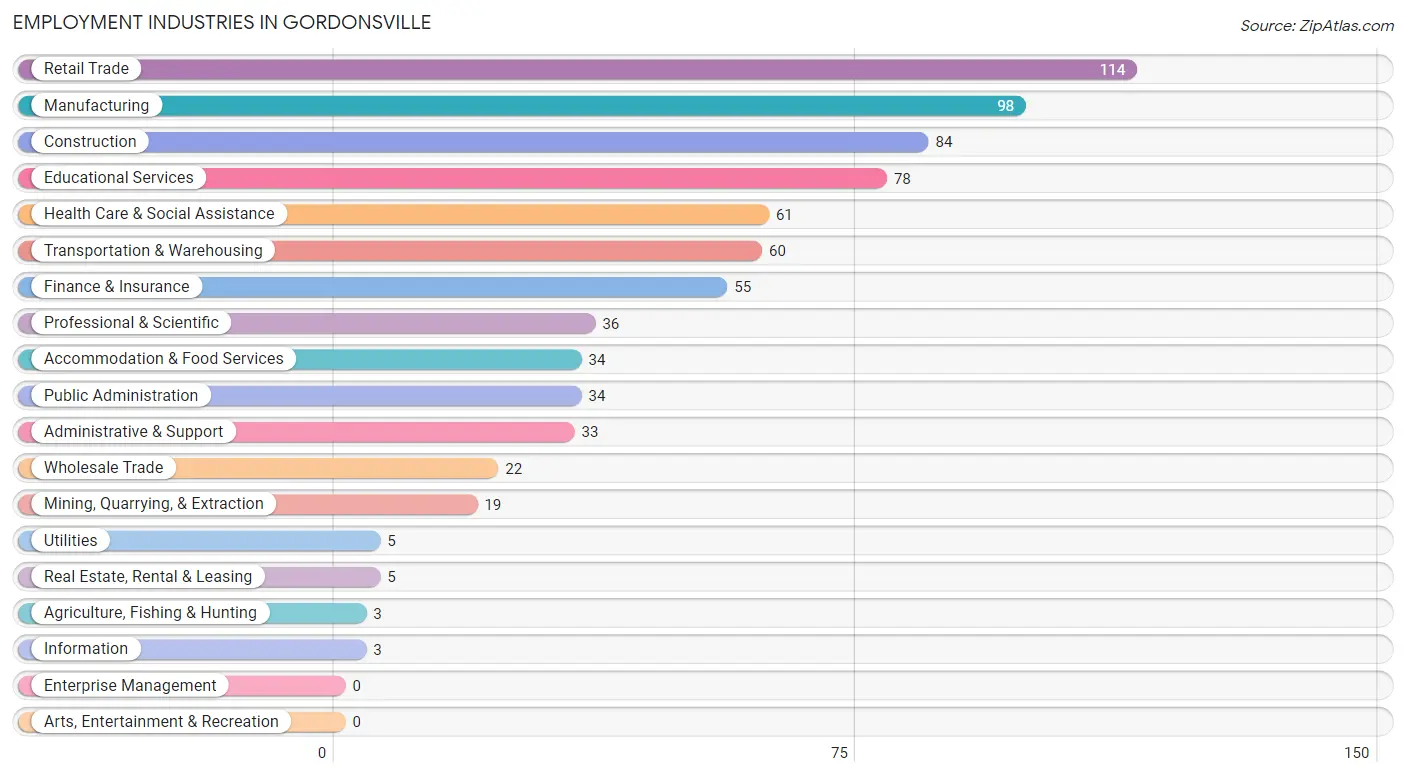
Employment Industries in Gordonsville
The major employment industries in Gordonsville include Retail Trade (114 | 15.0%), Manufacturing (98 | 12.9%), Construction (84 | 11.0%), Educational Services (78 | 10.2%), and Health Care & Social Assistance (61 | 8.0%).
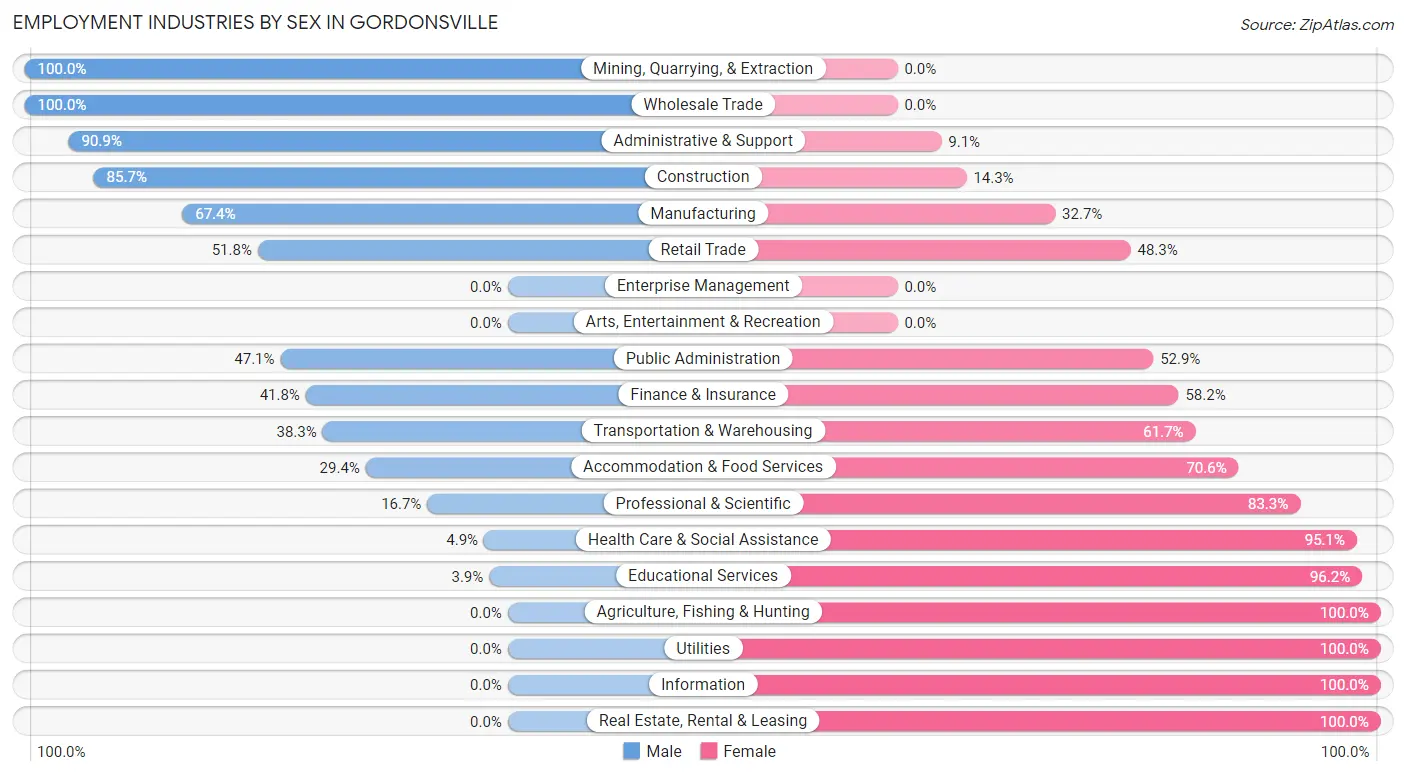
Employment Industries by Sex in Gordonsville
The Gordonsville industries that see more men than women are Mining, Quarrying, & Extraction (100.0%), Wholesale Trade (100.0%), and Administrative & Support (90.9%), whereas the industries that tend to have a higher number of women are Agriculture, Fishing & Hunting (100.0%), Utilities (100.0%), and Information (100.0%).
| Industry | Male | Female |
| Agriculture, Fishing & Hunting | 0 (0.0%) | 3 (100.0%) |
| Mining, Quarrying, & Extraction | 19 (100.0%) | 0 (0.0%) |
| Construction | 72 (85.7%) | 12 (14.3%) |
| Manufacturing | 66 (67.3%) | 32 (32.7%) |
| Wholesale Trade | 22 (100.0%) | 0 (0.0%) |
| Retail Trade | 59 (51.7%) | 55 (48.2%) |
| Transportation & Warehousing | 23 (38.3%) | 37 (61.7%) |
| Utilities | 0 (0.0%) | 5 (100.0%) |
| Information | 0 (0.0%) | 3 (100.0%) |
| Finance & Insurance | 23 (41.8%) | 32 (58.2%) |
| Real Estate, Rental & Leasing | 0 (0.0%) | 5 (100.0%) |
| Professional & Scientific | 6 (16.7%) | 30 (83.3%) |
| Enterprise Management | 0 (0.0%) | 0 (0.0%) |
| Administrative & Support | 30 (90.9%) | 3 (9.1%) |
| Educational Services | 3 (3.8%) | 75 (96.2%) |
| Health Care & Social Assistance | 3 (4.9%) | 58 (95.1%) |
| Arts, Entertainment & Recreation | 0 (0.0%) | 0 (0.0%) |
| Accommodation & Food Services | 10 (29.4%) | 24 (70.6%) |
| Public Administration | 16 (47.1%) | 18 (52.9%) |
| Total | 361 (47.4%) | 401 (52.6%) |
Education in Gordonsville
School Enrollment in Gordonsville
The most common levels of schooling among the 332 students in Gordonsville are middle school (105 | 31.6%), college / undergraduate (77 | 23.2%), and elementary school (62 | 18.7%).
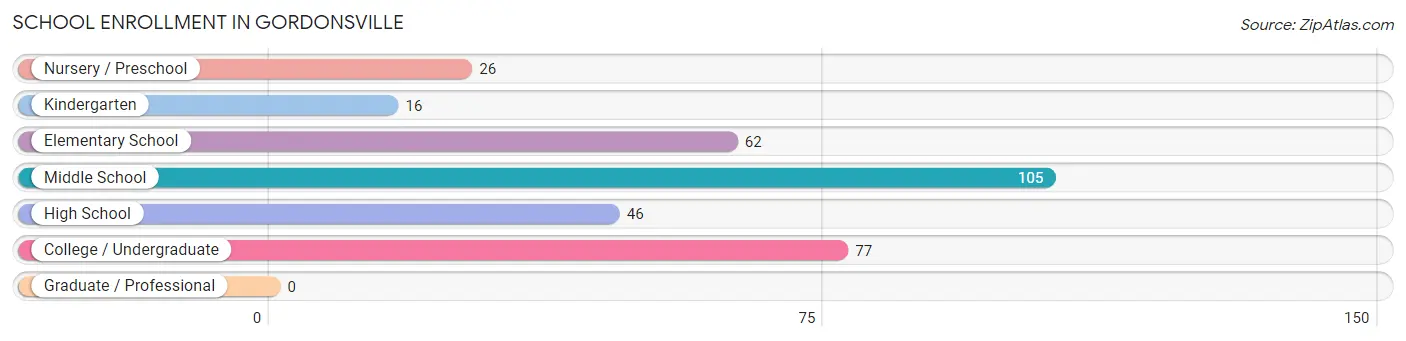
| School Level | # Students | % Students |
| Nursery / Preschool | 26 | 7.8% |
| Kindergarten | 16 | 4.8% |
| Elementary School | 62 | 18.7% |
| Middle School | 105 | 31.6% |
| High School | 46 | 13.9% |
| College / Undergraduate | 77 | 23.2% |
| Graduate / Professional | 0 | 0.0% |
| Total | 332 | 100.0% |
School Enrollment by Age by Funding Source in Gordonsville
Out of a total of 332 students who are enrolled in schools in Gordonsville, 41 (12.3%) attend a private institution, while the remaining 291 (87.7%) are enrolled in public schools. The age group of 18 to 19 year olds has the highest likelihood of being enrolled in private schools, with 15 (46.9% in the age bracket) enrolled. Conversely, the age group of 15 to 17 year olds has the lowest likelihood of being enrolled in a private school, with 29 (100.0% in the age bracket) attending a public institution.
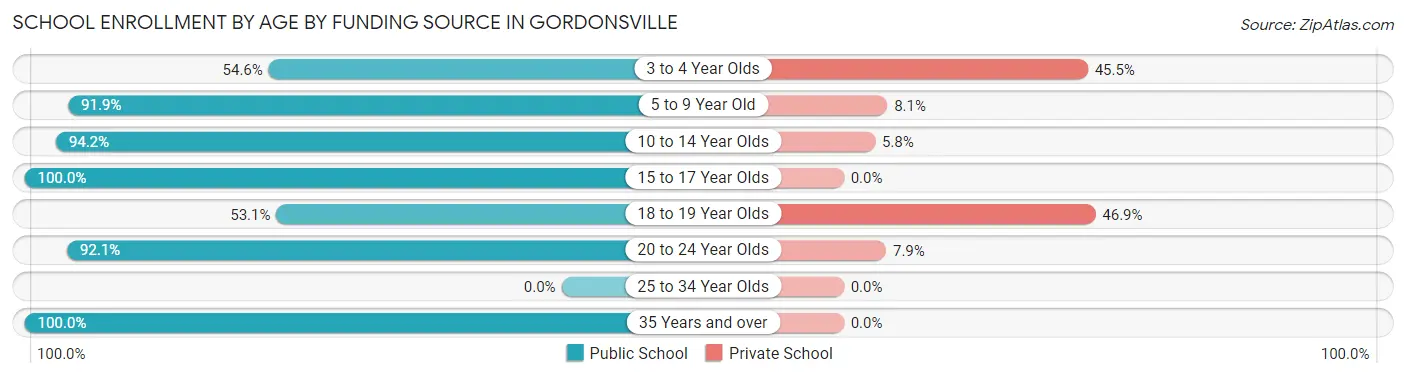
| Age Bracket | Public School | Private School |
| 3 to 4 Year Olds | 12 (54.5%) | 10 (45.5%) |
| 5 to 9 Year Old | 68 (91.9%) | 6 (8.1%) |
| 10 to 14 Year Olds | 113 (94.2%) | 7 (5.8%) |
| 15 to 17 Year Olds | 29 (100.0%) | 0 (0.0%) |
| 18 to 19 Year Olds | 17 (53.1%) | 15 (46.9%) |
| 20 to 24 Year Olds | 35 (92.1%) | 3 (7.9%) |
| 25 to 34 Year Olds | 0 (0.0%) | 0 (0.0%) |
| 35 Years and over | 17 (100.0%) | 0 (0.0%) |
| Total | 291 (87.7%) | 41 (12.3%) |
Educational Attainment by Field of Study in Gordonsville
Education (62 | 44.3%), business (16 | 11.4%), psychology (13 | 9.3%), liberal arts & history (11 | 7.9%), and arts & humanities (11 | 7.9%) are the most common fields of study among 140 individuals in Gordonsville who have obtained a bachelor's degree or higher.
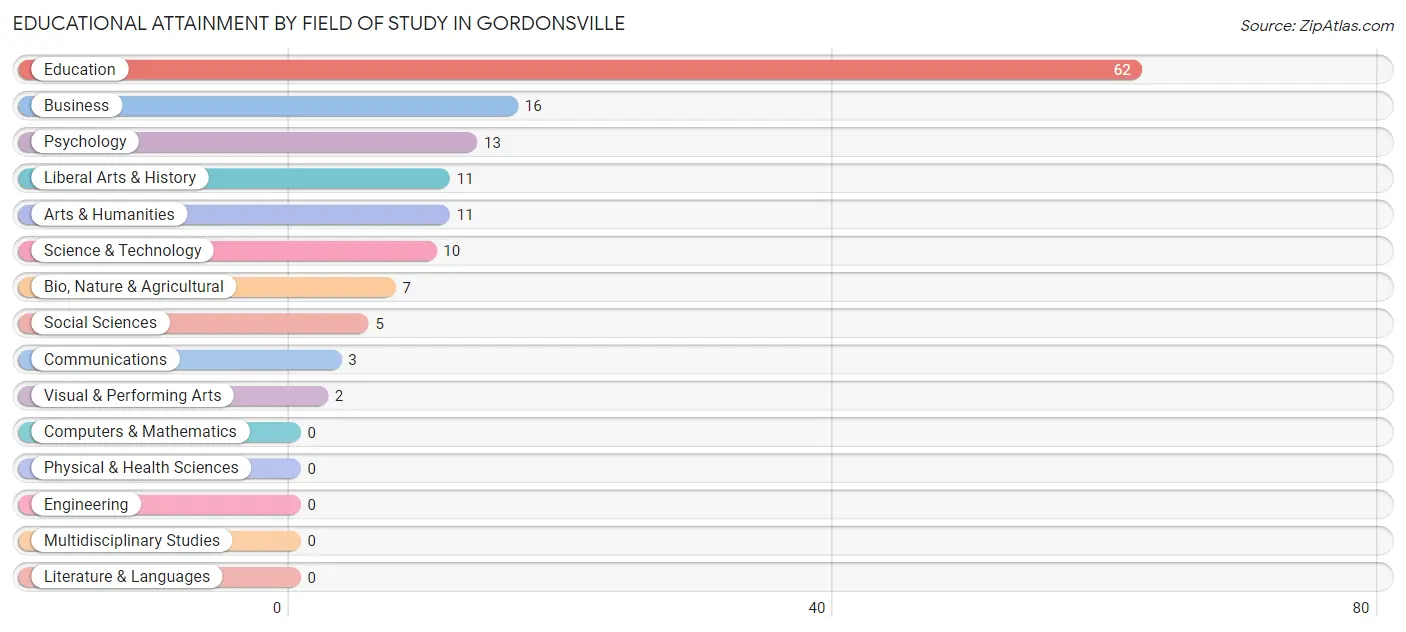
| Field of Study | # Graduates | % Graduates |
| Computers & Mathematics | 0 | 0.0% |
| Bio, Nature & Agricultural | 7 | 5.0% |
| Physical & Health Sciences | 0 | 0.0% |
| Psychology | 13 | 9.3% |
| Social Sciences | 5 | 3.6% |
| Engineering | 0 | 0.0% |
| Multidisciplinary Studies | 0 | 0.0% |
| Science & Technology | 10 | 7.1% |
| Business | 16 | 11.4% |
| Education | 62 | 44.3% |
| Literature & Languages | 0 | 0.0% |
| Liberal Arts & History | 11 | 7.9% |
| Visual & Performing Arts | 2 | 1.4% |
| Communications | 3 | 2.1% |
| Arts & Humanities | 11 | 7.9% |
| Total | 140 | 100.0% |
Transportation & Commute in Gordonsville
Vehicle Availability by Sex in Gordonsville
The most prevalent vehicle ownership categories in Gordonsville are males with 3 vehicles (132, accounting for 37.7%) and females with 3 vehicles (104, making up 33.9%).
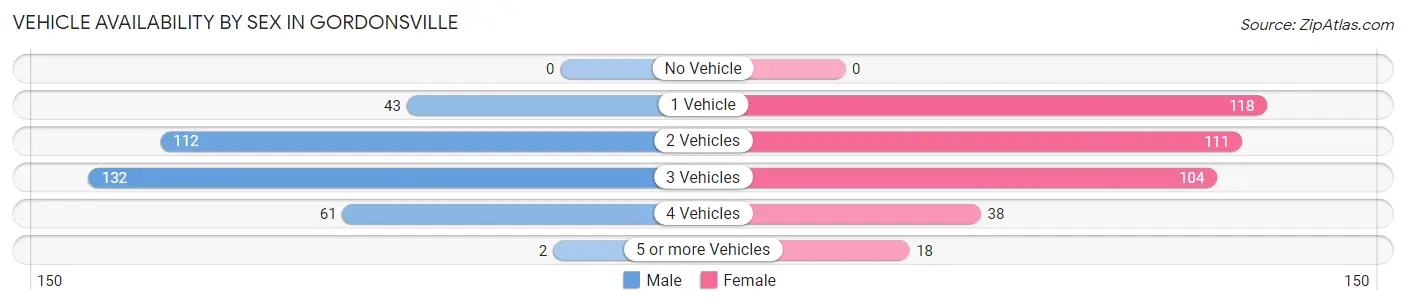
| Vehicles Available | Male | Female |
| No Vehicle | 0 (0.0%) | 0 (0.0%) |
| 1 Vehicle | 43 (12.3%) | 118 (30.3%) |
| 2 Vehicles | 112 (32.0%) | 111 (28.5%) |
| 3 Vehicles | 132 (37.7%) | 104 (26.7%) |
| 4 Vehicles | 61 (17.4%) | 38 (9.8%) |
| 5 or more Vehicles | 2 (0.6%) | 18 (4.6%) |
| Total | 350 (100.0%) | 389 (100.0%) |
Commute Time in Gordonsville
The most frequently occuring commute durations in Gordonsville are 30 to 34 minutes (137 commuters, 20.4%), 10 to 14 minutes (127 commuters, 18.9%), and 5 to 9 minutes (97 commuters, 14.4%).
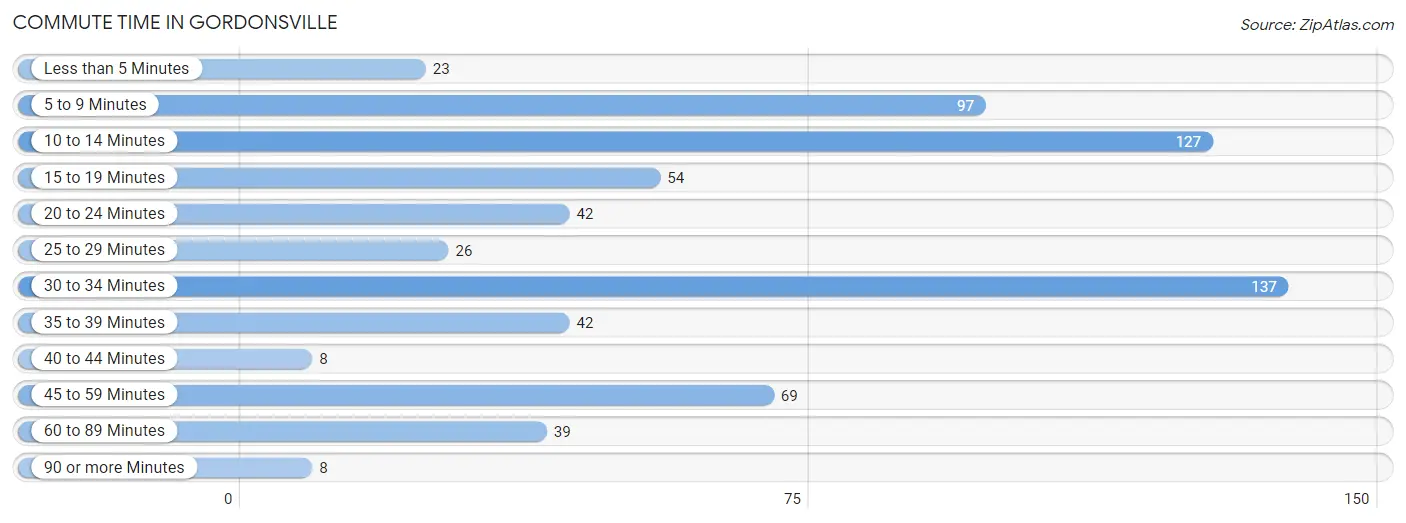
| Commute Time | # Commuters | % Commuters |
| Less than 5 Minutes | 23 | 3.4% |
| 5 to 9 Minutes | 97 | 14.4% |
| 10 to 14 Minutes | 127 | 18.9% |
| 15 to 19 Minutes | 54 | 8.0% |
| 20 to 24 Minutes | 42 | 6.2% |
| 25 to 29 Minutes | 26 | 3.9% |
| 30 to 34 Minutes | 137 | 20.4% |
| 35 to 39 Minutes | 42 | 6.2% |
| 40 to 44 Minutes | 8 | 1.2% |
| 45 to 59 Minutes | 69 | 10.3% |
| 60 to 89 Minutes | 39 | 5.8% |
| 90 or more Minutes | 8 | 1.2% |
Commute Time by Sex in Gordonsville
The most common commute times in Gordonsville are 45 to 59 minutes (64 commuters, 19.5%) for males and 30 to 34 minutes (93 commuters, 27.1%) for females.
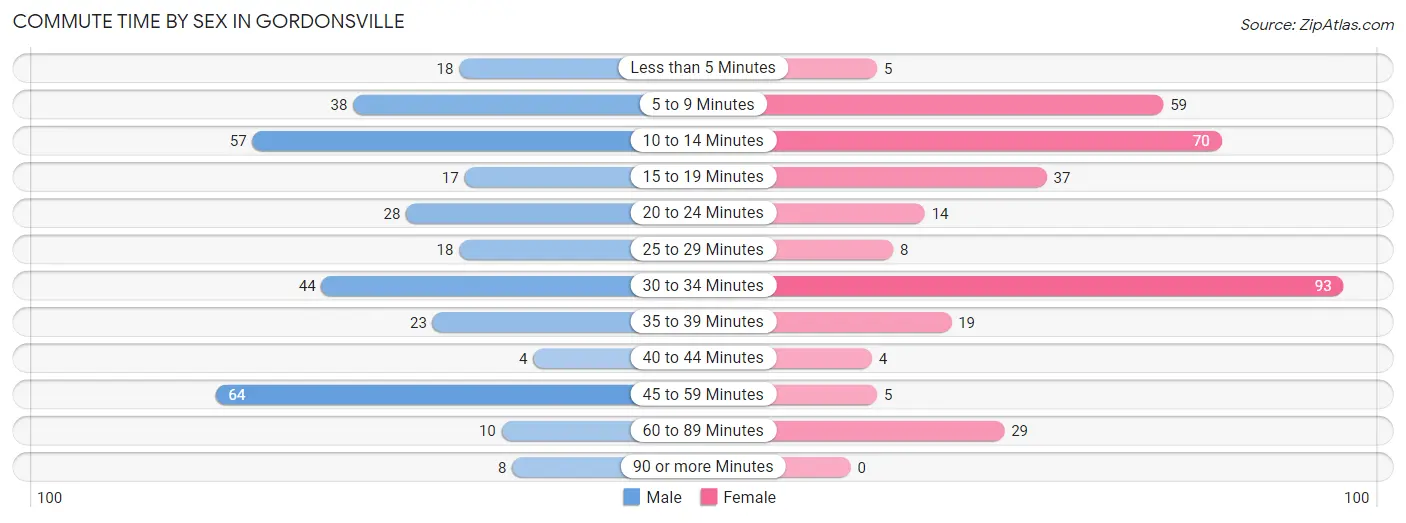
| Commute Time | Male | Female |
| Less than 5 Minutes | 18 (5.5%) | 5 (1.5%) |
| 5 to 9 Minutes | 38 (11.6%) | 59 (17.2%) |
| 10 to 14 Minutes | 57 (17.3%) | 70 (20.4%) |
| 15 to 19 Minutes | 17 (5.2%) | 37 (10.8%) |
| 20 to 24 Minutes | 28 (8.5%) | 14 (4.1%) |
| 25 to 29 Minutes | 18 (5.5%) | 8 (2.3%) |
| 30 to 34 Minutes | 44 (13.4%) | 93 (27.1%) |
| 35 to 39 Minutes | 23 (7.0%) | 19 (5.5%) |
| 40 to 44 Minutes | 4 (1.2%) | 4 (1.2%) |
| 45 to 59 Minutes | 64 (19.5%) | 5 (1.5%) |
| 60 to 89 Minutes | 10 (3.0%) | 29 (8.5%) |
| 90 or more Minutes | 8 (2.4%) | 0 (0.0%) |
Time of Departure to Work by Sex in Gordonsville
The most frequent times of departure to work in Gordonsville are 7:00 AM to 7:29 AM (82, 24.9%) for males and 7:00 AM to 7:29 AM (85, 24.8%) for females.
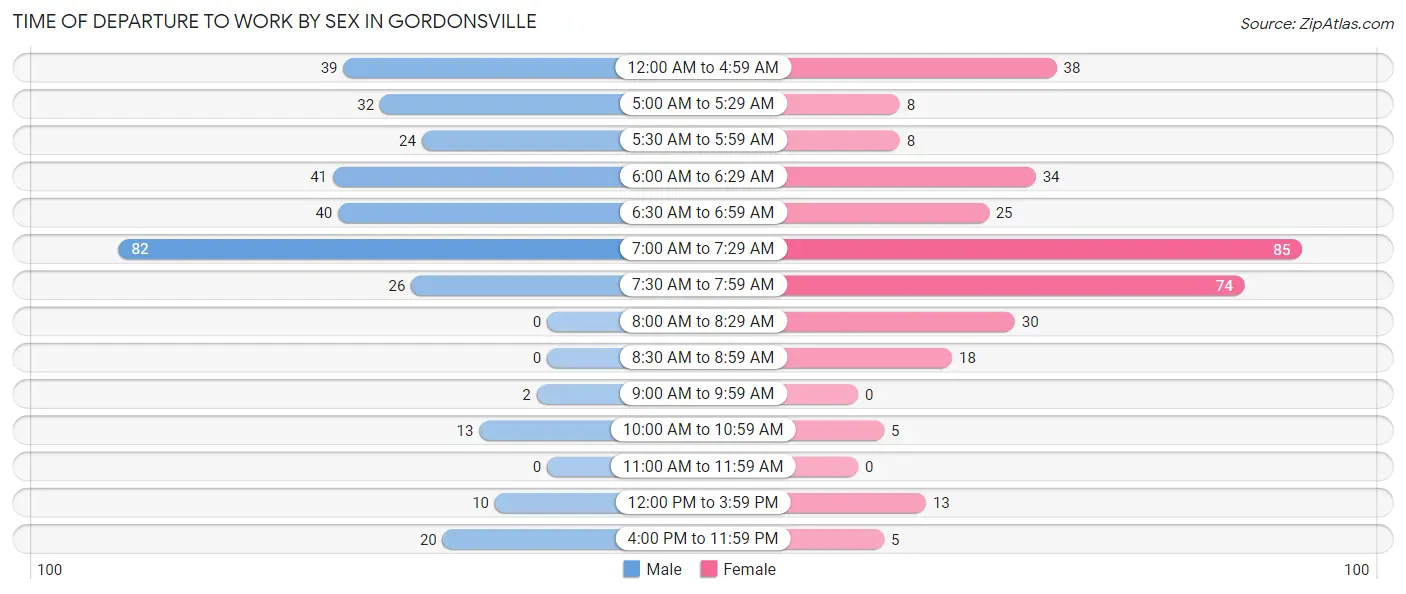
| Time of Departure | Male | Female |
| 12:00 AM to 4:59 AM | 39 (11.8%) | 38 (11.1%) |
| 5:00 AM to 5:29 AM | 32 (9.7%) | 8 (2.3%) |
| 5:30 AM to 5:59 AM | 24 (7.3%) | 8 (2.3%) |
| 6:00 AM to 6:29 AM | 41 (12.5%) | 34 (9.9%) |
| 6:30 AM to 6:59 AM | 40 (12.2%) | 25 (7.3%) |
| 7:00 AM to 7:29 AM | 82 (24.9%) | 85 (24.8%) |
| 7:30 AM to 7:59 AM | 26 (7.9%) | 74 (21.6%) |
| 8:00 AM to 8:29 AM | 0 (0.0%) | 30 (8.7%) |
| 8:30 AM to 8:59 AM | 0 (0.0%) | 18 (5.2%) |
| 9:00 AM to 9:59 AM | 2 (0.6%) | 0 (0.0%) |
| 10:00 AM to 10:59 AM | 13 (4.0%) | 5 (1.5%) |
| 11:00 AM to 11:59 AM | 0 (0.0%) | 0 (0.0%) |
| 12:00 PM to 3:59 PM | 10 (3.0%) | 13 (3.8%) |
| 4:00 PM to 11:59 PM | 20 (6.1%) | 5 (1.5%) |
| Total | 329 (100.0%) | 343 (100.0%) |
Housing Occupancy in Gordonsville
Occupancy by Ownership in Gordonsville
Of the total 575 dwellings in Gordonsville, owner-occupied units account for 390 (67.8%), while renter-occupied units make up 185 (32.2%).
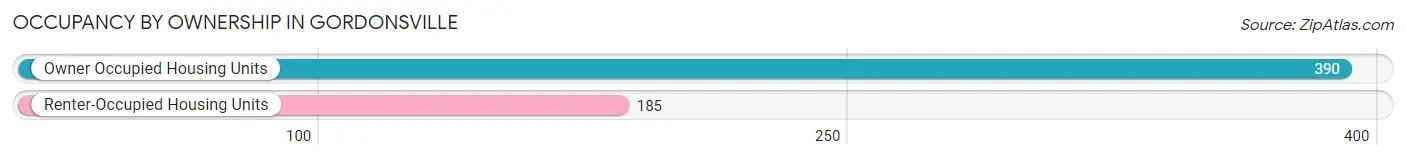
| Occupancy | # Housing Units | % Housing Units |
| Owner Occupied Housing Units | 390 | 67.8% |
| Renter-Occupied Housing Units | 185 | 32.2% |
| Total Occupied Housing Units | 575 | 100.0% |
Occupancy by Household Size in Gordonsville
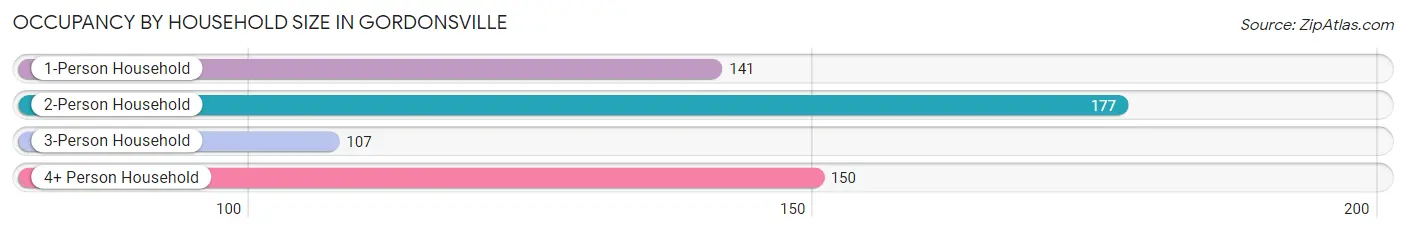
| Household Size | # Housing Units | % Housing Units |
| 1-Person Household | 141 | 24.5% |
| 2-Person Household | 177 | 30.8% |
| 3-Person Household | 107 | 18.6% |
| 4+ Person Household | 150 | 26.1% |
| Total Housing Units | 575 | 100.0% |
Occupancy by Ownership by Household Size in Gordonsville
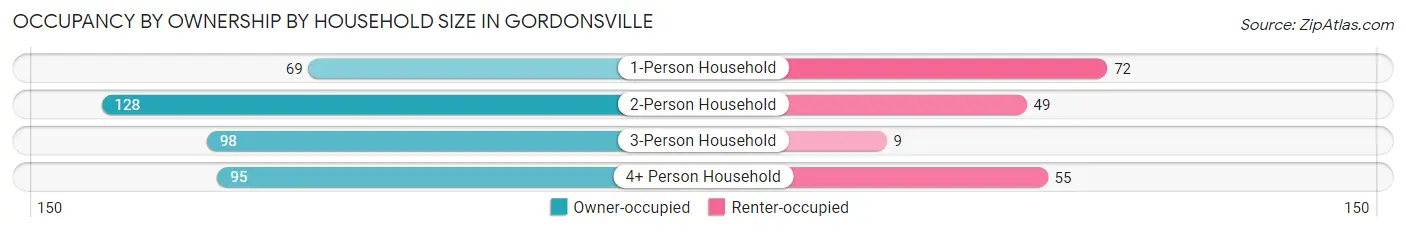
| Household Size | Owner-occupied | Renter-occupied |
| 1-Person Household | 69 (48.9%) | 72 (51.1%) |
| 2-Person Household | 128 (72.3%) | 49 (27.7%) |
| 3-Person Household | 98 (91.6%) | 9 (8.4%) |
| 4+ Person Household | 95 (63.3%) | 55 (36.7%) |
| Total Housing Units | 390 (67.8%) | 185 (32.2%) |
Occupancy by Educational Attainment in Gordonsville
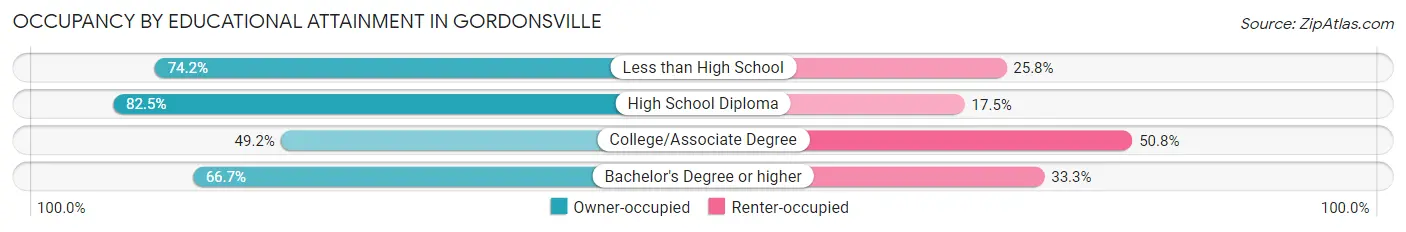
| Household Size | Owner-occupied | Renter-occupied |
| Less than High School | 46 (74.2%) | 16 (25.8%) |
| High School Diploma | 188 (82.5%) | 40 (17.5%) |
| College/Associate Degree | 96 (49.2%) | 99 (50.8%) |
| Bachelor's Degree or higher | 60 (66.7%) | 30 (33.3%) |
Occupancy by Age of Householder in Gordonsville
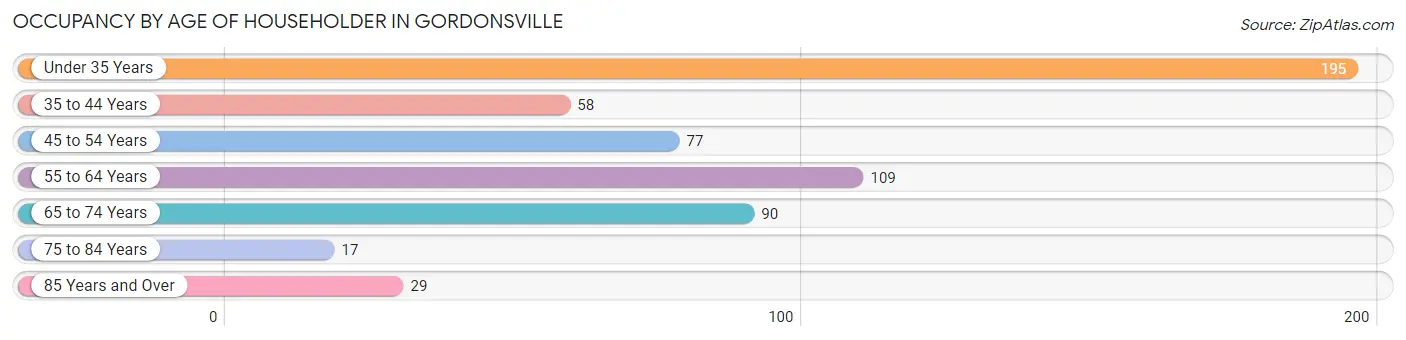
| Age Bracket | # Households | % Households |
| Under 35 Years | 195 | 33.9% |
| 35 to 44 Years | 58 | 10.1% |
| 45 to 54 Years | 77 | 13.4% |
| 55 to 64 Years | 109 | 19.0% |
| 65 to 74 Years | 90 | 15.7% |
| 75 to 84 Years | 17 | 3.0% |
| 85 Years and Over | 29 | 5.0% |
| Total | 575 | 100.0% |
Housing Finances in Gordonsville
Median Income by Occupancy in Gordonsville
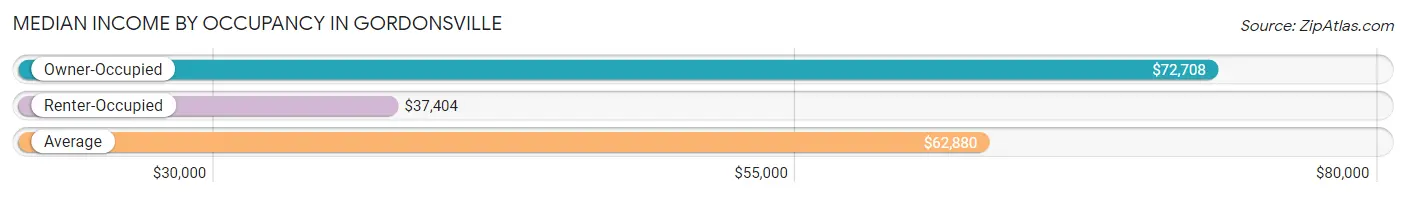
| Occupancy Type | # Households | Median Income |
| Owner-Occupied | 390 (67.8%) | $72,708 |
| Renter-Occupied | 185 (32.2%) | $37,404 |
| Average | 575 (100.0%) | $62,880 |
Occupancy by Householder Income Bracket in Gordonsville
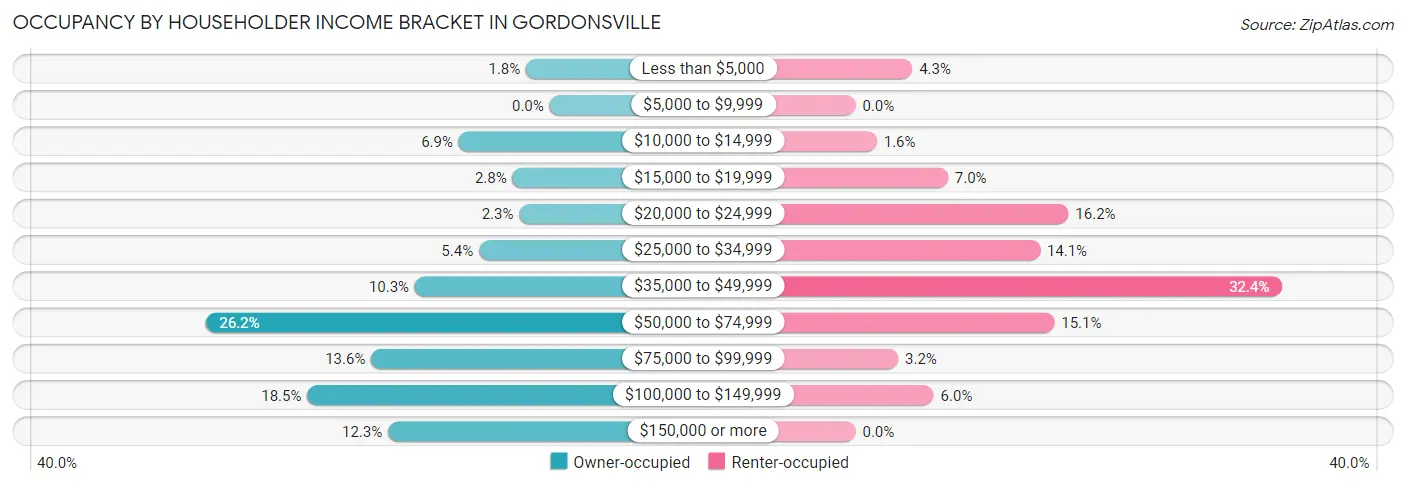
| Income Bracket | Owner-occupied | Renter-occupied |
| Less than $5,000 | 7 (1.8%) | 8 (4.3%) |
| $5,000 to $9,999 | 0 (0.0%) | 0 (0.0%) |
| $10,000 to $14,999 | 27 (6.9%) | 3 (1.6%) |
| $15,000 to $19,999 | 11 (2.8%) | 13 (7.0%) |
| $20,000 to $24,999 | 9 (2.3%) | 30 (16.2%) |
| $25,000 to $34,999 | 21 (5.4%) | 26 (14.1%) |
| $35,000 to $49,999 | 40 (10.3%) | 60 (32.4%) |
| $50,000 to $74,999 | 102 (26.2%) | 28 (15.1%) |
| $75,000 to $99,999 | 53 (13.6%) | 6 (3.2%) |
| $100,000 to $149,999 | 72 (18.5%) | 11 (5.9%) |
| $150,000 or more | 48 (12.3%) | 0 (0.0%) |
| Total | 390 (100.0%) | 185 (100.0%) |
Monthly Housing Cost Tiers in Gordonsville
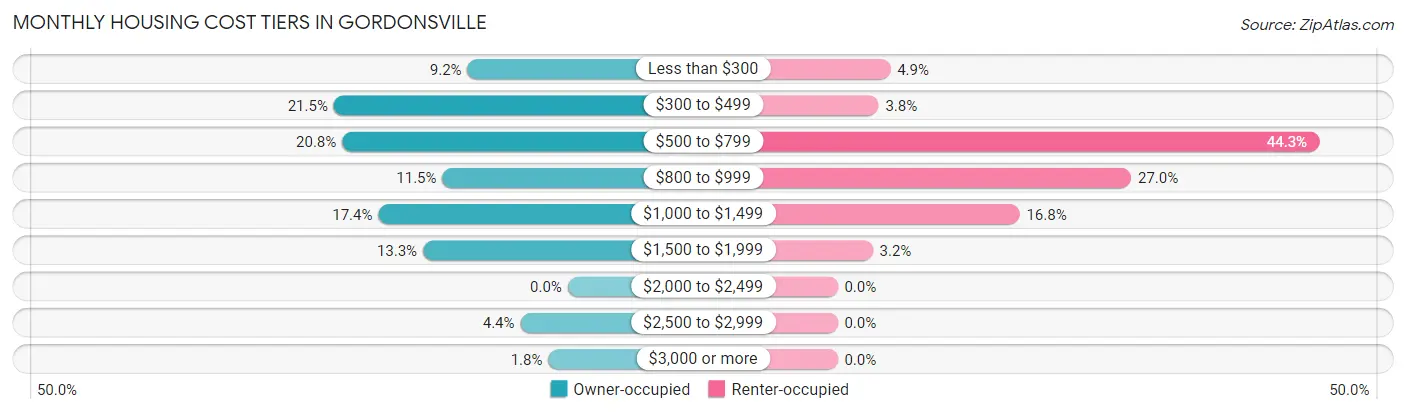
| Monthly Cost | Owner-occupied | Renter-occupied |
| Less than $300 | 36 (9.2%) | 9 (4.9%) |
| $300 to $499 | 84 (21.5%) | 7 (3.8%) |
| $500 to $799 | 81 (20.8%) | 82 (44.3%) |
| $800 to $999 | 45 (11.5%) | 50 (27.0%) |
| $1,000 to $1,499 | 68 (17.4%) | 31 (16.8%) |
| $1,500 to $1,999 | 52 (13.3%) | 6 (3.2%) |
| $2,000 to $2,499 | 0 (0.0%) | 0 (0.0%) |
| $2,500 to $2,999 | 17 (4.4%) | 0 (0.0%) |
| $3,000 or more | 7 (1.8%) | 0 (0.0%) |
| Total | 390 (100.0%) | 185 (100.0%) |
Physical Housing Characteristics in Gordonsville
Housing Structures in Gordonsville
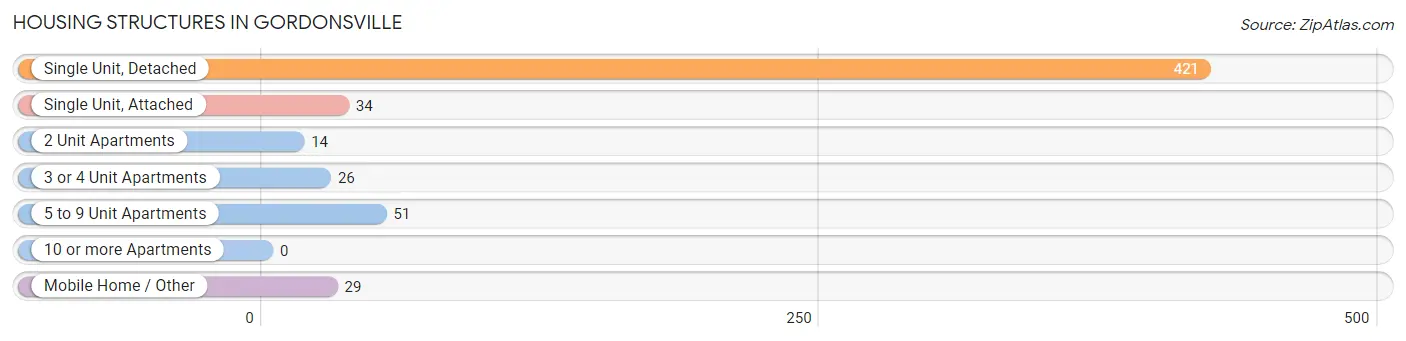
| Structure Type | # Housing Units | % Housing Units |
| Single Unit, Detached | 421 | 73.2% |
| Single Unit, Attached | 34 | 5.9% |
| 2 Unit Apartments | 14 | 2.4% |
| 3 or 4 Unit Apartments | 26 | 4.5% |
| 5 to 9 Unit Apartments | 51 | 8.9% |
| 10 or more Apartments | 0 | 0.0% |
| Mobile Home / Other | 29 | 5.0% |
| Total | 575 | 100.0% |
Housing Structures by Occupancy in Gordonsville
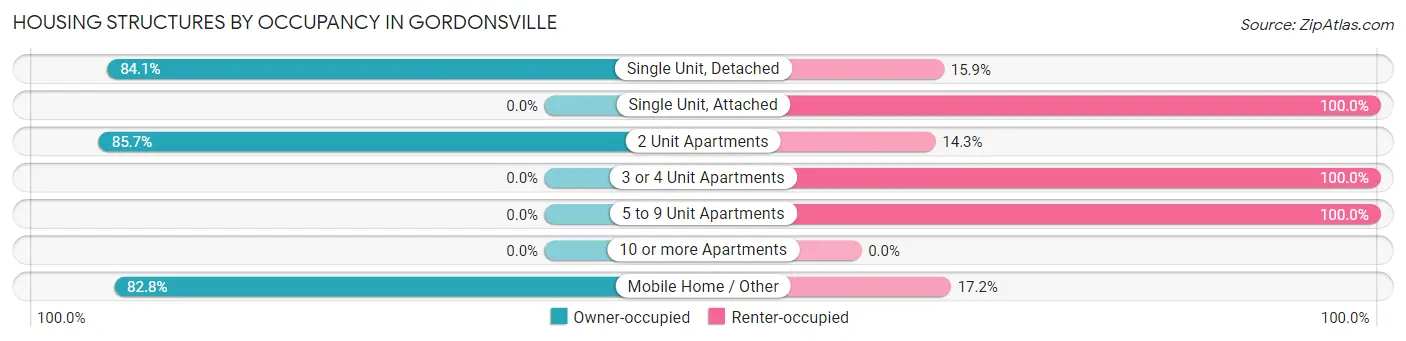
| Structure Type | Owner-occupied | Renter-occupied |
| Single Unit, Detached | 354 (84.1%) | 67 (15.9%) |
| Single Unit, Attached | 0 (0.0%) | 34 (100.0%) |
| 2 Unit Apartments | 12 (85.7%) | 2 (14.3%) |
| 3 or 4 Unit Apartments | 0 (0.0%) | 26 (100.0%) |
| 5 to 9 Unit Apartments | 0 (0.0%) | 51 (100.0%) |
| 10 or more Apartments | 0 (0.0%) | 0 (0.0%) |
| Mobile Home / Other | 24 (82.8%) | 5 (17.2%) |
| Total | 390 (67.8%) | 185 (32.2%) |
Housing Structures by Number of Rooms in Gordonsville
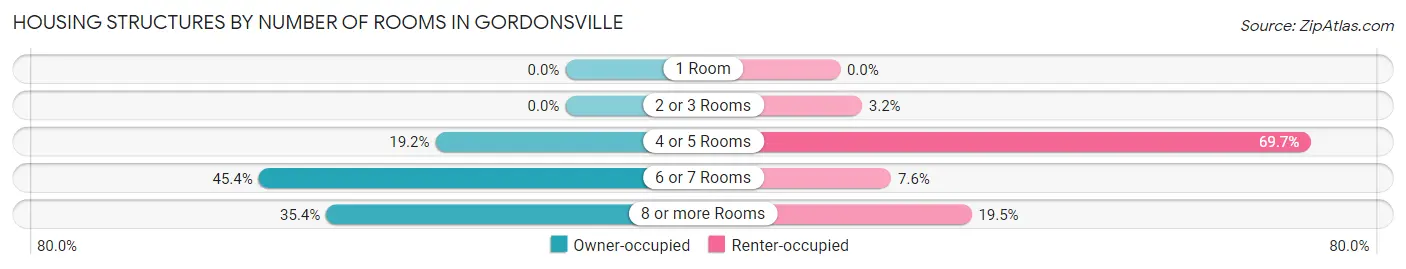
| Number of Rooms | Owner-occupied | Renter-occupied |
| 1 Room | 0 (0.0%) | 0 (0.0%) |
| 2 or 3 Rooms | 0 (0.0%) | 6 (3.2%) |
| 4 or 5 Rooms | 75 (19.2%) | 129 (69.7%) |
| 6 or 7 Rooms | 177 (45.4%) | 14 (7.6%) |
| 8 or more Rooms | 138 (35.4%) | 36 (19.5%) |
| Total | 390 (100.0%) | 185 (100.0%) |
Housing Structure by Heating Type in Gordonsville
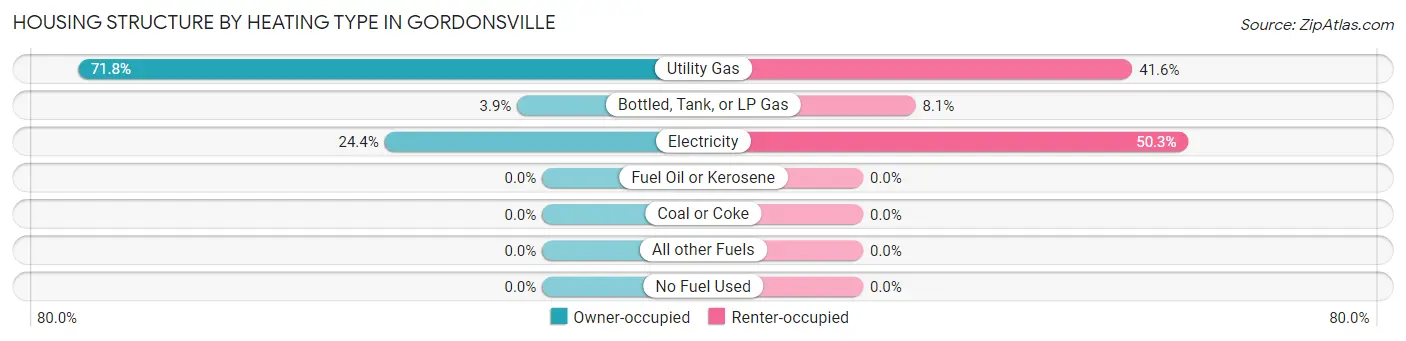
| Heating Type | Owner-occupied | Renter-occupied |
| Utility Gas | 280 (71.8%) | 77 (41.6%) |
| Bottled, Tank, or LP Gas | 15 (3.8%) | 15 (8.1%) |
| Electricity | 95 (24.4%) | 93 (50.3%) |
| Fuel Oil or Kerosene | 0 (0.0%) | 0 (0.0%) |
| Coal or Coke | 0 (0.0%) | 0 (0.0%) |
| All other Fuels | 0 (0.0%) | 0 (0.0%) |
| No Fuel Used | 0 (0.0%) | 0 (0.0%) |
| Total | 390 (100.0%) | 185 (100.0%) |
Household Vehicle Usage in Gordonsville
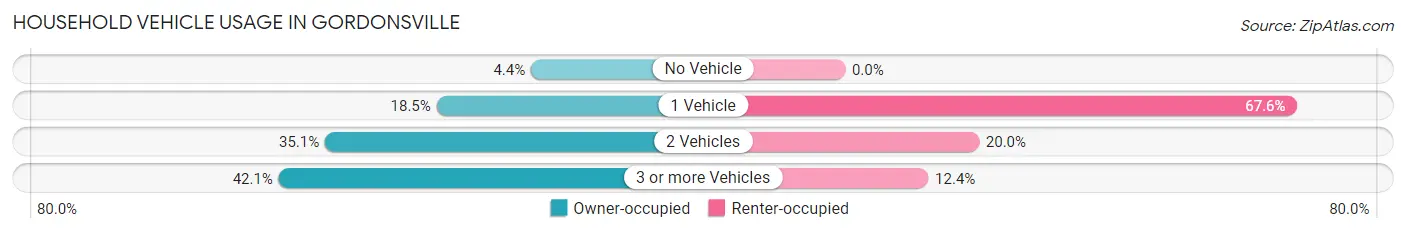
| Vehicles per Household | Owner-occupied | Renter-occupied |
| No Vehicle | 17 (4.4%) | 0 (0.0%) |
| 1 Vehicle | 72 (18.5%) | 125 (67.6%) |
| 2 Vehicles | 137 (35.1%) | 37 (20.0%) |
| 3 or more Vehicles | 164 (42.0%) | 23 (12.4%) |
| Total | 390 (100.0%) | 185 (100.0%) |
Real Estate & Mortgages in Gordonsville
Real Estate and Mortgage Overview in Gordonsville
| Characteristic | Without Mortgage | With Mortgage |
| Housing Units | 166 | 224 |
| Median Property Value | $208,300 | $221,300 |
| Median Household Income | $88,000 | $23 |
| Monthly Housing Costs | $436 | $7 |
| Real Estate Taxes | $1,133 | $17 |
Property Value by Mortgage Status in Gordonsville
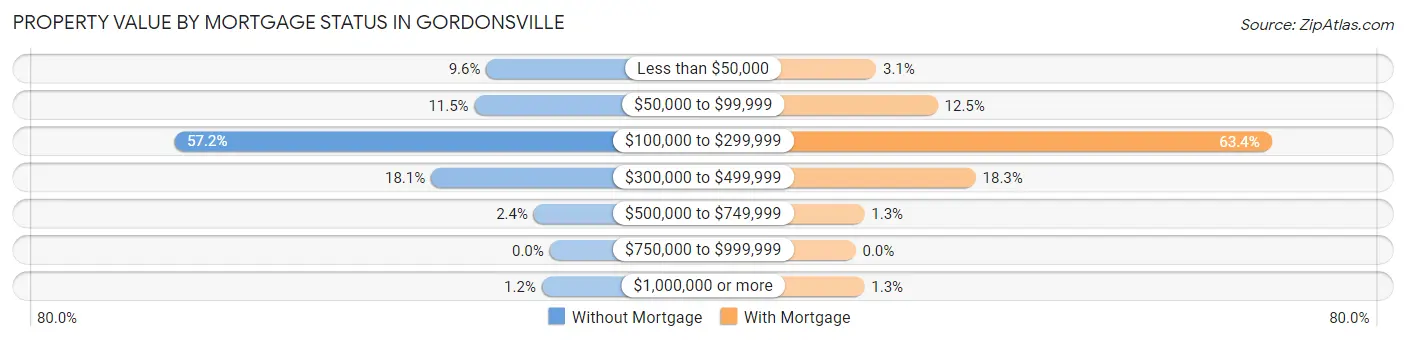
| Property Value | Without Mortgage | With Mortgage |
| Less than $50,000 | 16 (9.6%) | 7 (3.1%) |
| $50,000 to $99,999 | 19 (11.5%) | 28 (12.5%) |
| $100,000 to $299,999 | 95 (57.2%) | 142 (63.4%) |
| $300,000 to $499,999 | 30 (18.1%) | 41 (18.3%) |
| $500,000 to $749,999 | 4 (2.4%) | 3 (1.3%) |
| $750,000 to $999,999 | 0 (0.0%) | 0 (0.0%) |
| $1,000,000 or more | 2 (1.2%) | 3 (1.3%) |
| Total | 166 (100.0%) | 224 (100.0%) |
Household Income by Mortgage Status in Gordonsville
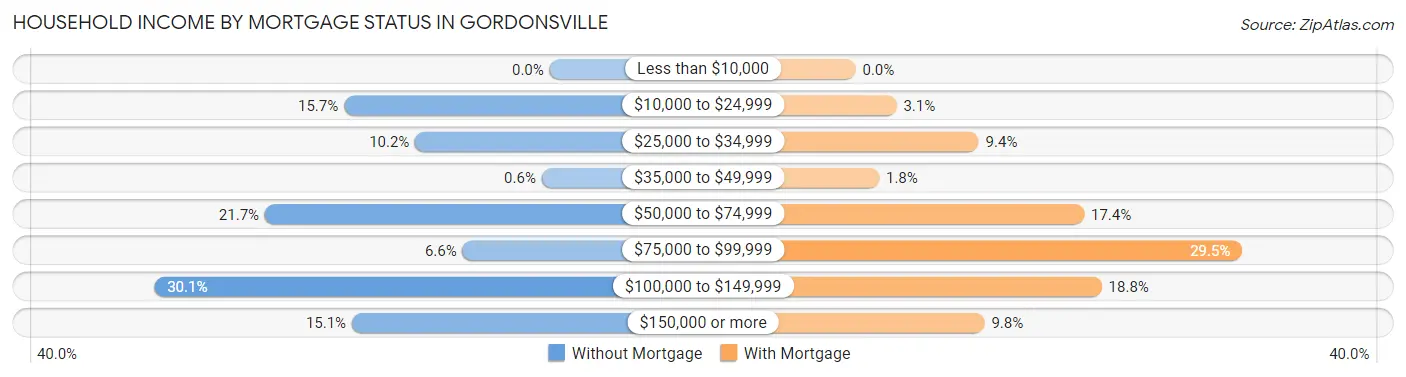
| Household Income | Without Mortgage | With Mortgage |
| Less than $10,000 | 0 (0.0%) | 0 (0.0%) |
| $10,000 to $24,999 | 26 (15.7%) | 7 (3.1%) |
| $25,000 to $34,999 | 17 (10.2%) | 21 (9.4%) |
| $35,000 to $49,999 | 1 (0.6%) | 4 (1.8%) |
| $50,000 to $74,999 | 36 (21.7%) | 39 (17.4%) |
| $75,000 to $99,999 | 11 (6.6%) | 66 (29.5%) |
| $100,000 to $149,999 | 50 (30.1%) | 42 (18.8%) |
| $150,000 or more | 25 (15.1%) | 22 (9.8%) |
| Total | 166 (100.0%) | 224 (100.0%) |
Property Value to Household Income Ratio in Gordonsville
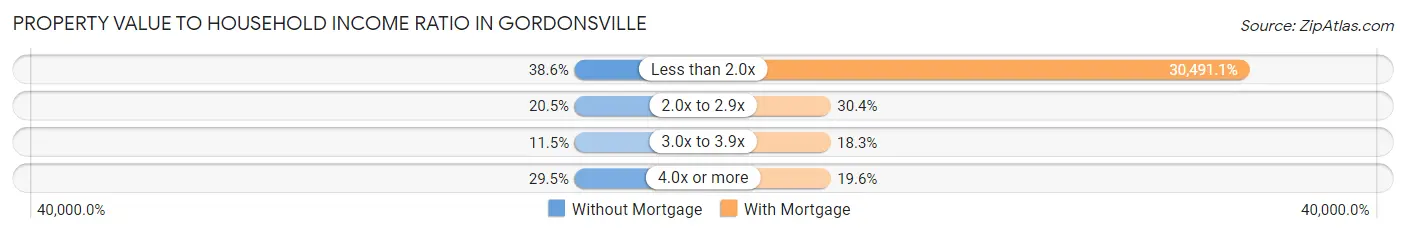
| Value-to-Income Ratio | Without Mortgage | With Mortgage |
| Less than 2.0x | 64 (38.6%) | 68,300 (30,491.1%) |
| 2.0x to 2.9x | 34 (20.5%) | 68 (30.4%) |
| 3.0x to 3.9x | 19 (11.5%) | 41 (18.3%) |
| 4.0x or more | 49 (29.5%) | 44 (19.6%) |
| Total | 166 (100.0%) | 224 (100.0%) |
Real Estate Taxes by Mortgage Status in Gordonsville
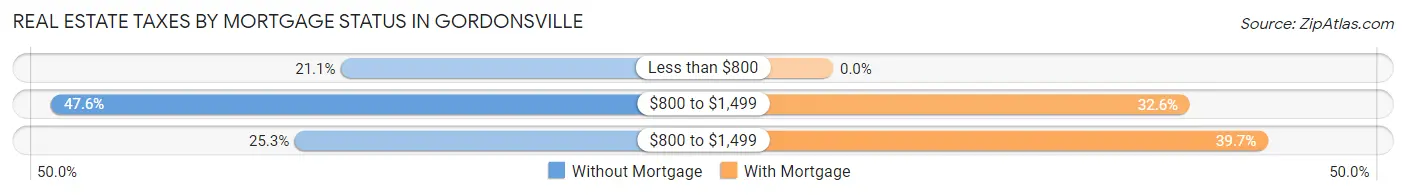
| Property Taxes | Without Mortgage | With Mortgage |
| Less than $800 | 35 (21.1%) | 0 (0.0%) |
| $800 to $1,499 | 79 (47.6%) | 73 (32.6%) |
| $800 to $1,499 | 42 (25.3%) | 89 (39.7%) |
| Total | 166 (100.0%) | 224 (100.0%) |
Health & Disability in Gordonsville
Health Insurance Coverage by Age in Gordonsville
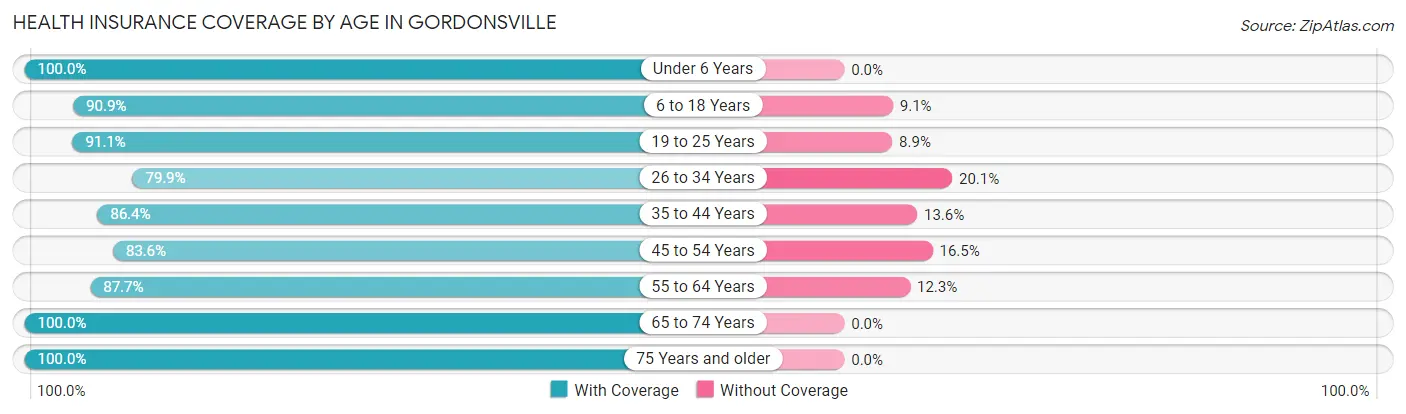
| Age Bracket | With Coverage | Without Coverage |
| Under 6 Years | 119 (100.0%) | 0 (0.0%) |
| 6 to 18 Years | 231 (90.9%) | 23 (9.1%) |
| 19 to 25 Years | 153 (91.1%) | 15 (8.9%) |
| 26 to 34 Years | 167 (79.9%) | 42 (20.1%) |
| 35 to 44 Years | 121 (86.4%) | 19 (13.6%) |
| 45 to 54 Years | 127 (83.6%) | 25 (16.5%) |
| 55 to 64 Years | 186 (87.7%) | 26 (12.3%) |
| 65 to 74 Years | 161 (100.0%) | 0 (0.0%) |
| 75 Years and older | 54 (100.0%) | 0 (0.0%) |
| Total | 1,319 (89.8%) | 150 (10.2%) |
Health Insurance Coverage by Citizenship Status in Gordonsville
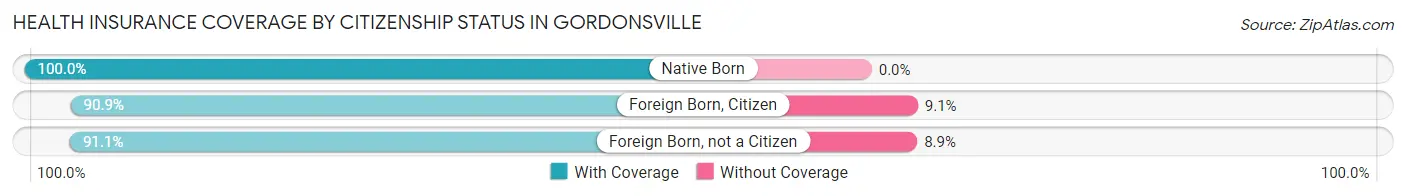
| Citizenship Status | With Coverage | Without Coverage |
| Native Born | 119 (100.0%) | 0 (0.0%) |
| Foreign Born, Citizen | 231 (90.9%) | 23 (9.1%) |
| Foreign Born, not a Citizen | 153 (91.1%) | 15 (8.9%) |
Health Insurance Coverage by Household Income in Gordonsville
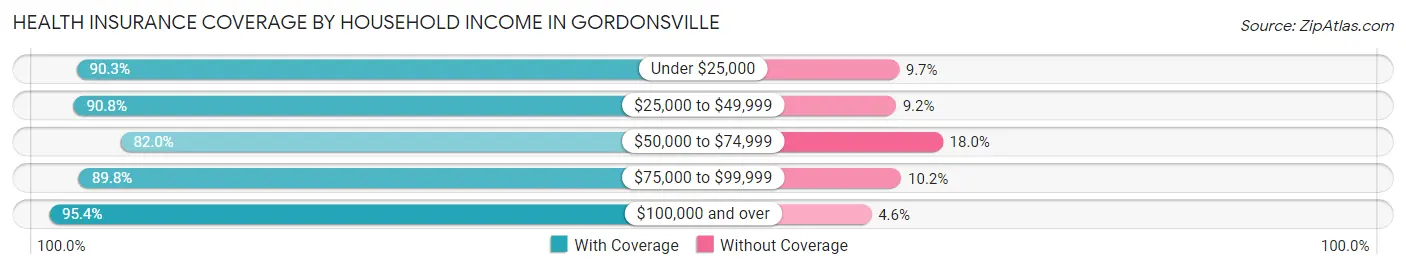
| Household Income | With Coverage | Without Coverage |
| Under $25,000 | 139 (90.3%) | 15 (9.7%) |
| $25,000 to $49,999 | 307 (90.8%) | 31 (9.2%) |
| $50,000 to $74,999 | 306 (82.0%) | 67 (18.0%) |
| $75,000 to $99,999 | 150 (89.8%) | 17 (10.2%) |
| $100,000 and over | 417 (95.4%) | 20 (4.6%) |
Public vs Private Health Insurance Coverage by Age in Gordonsville
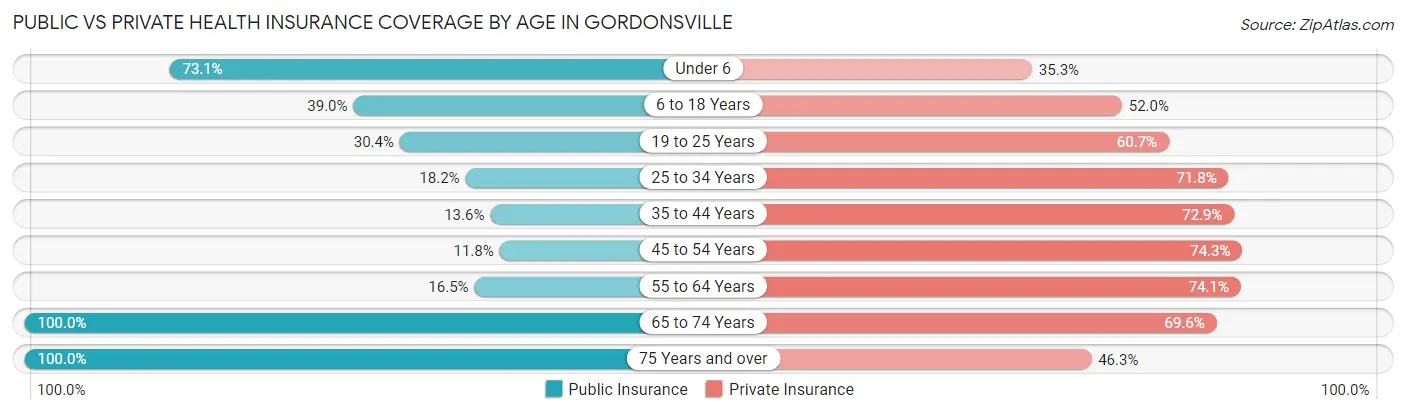
| Age Bracket | Public Insurance | Private Insurance |
| Under 6 | 87 (73.1%) | 42 (35.3%) |
| 6 to 18 Years | 99 (39.0%) | 132 (52.0%) |
| 19 to 25 Years | 51 (30.4%) | 102 (60.7%) |
| 25 to 34 Years | 38 (18.2%) | 150 (71.8%) |
| 35 to 44 Years | 19 (13.6%) | 102 (72.9%) |
| 45 to 54 Years | 18 (11.8%) | 113 (74.3%) |
| 55 to 64 Years | 35 (16.5%) | 157 (74.1%) |
| 65 to 74 Years | 161 (100.0%) | 112 (69.6%) |
| 75 Years and over | 54 (100.0%) | 25 (46.3%) |
| Total | 562 (38.3%) | 935 (63.6%) |
Disability Status by Sex by Age in Gordonsville
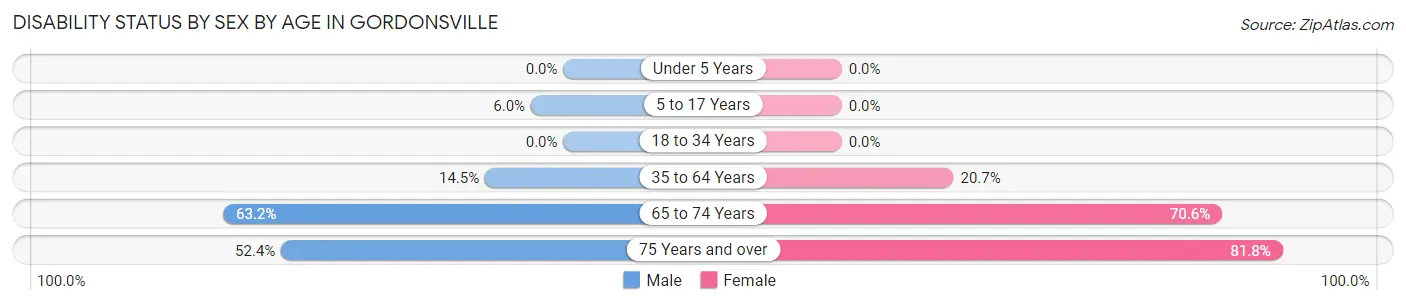
| Age Bracket | Male | Female |
| Under 5 Years | 0 (0.0%) | 0 (0.0%) |
| 5 to 17 Years | 10 (6.0%) | 0 (0.0%) |
| 18 to 34 Years | 0 (0.0%) | 0 (0.0%) |
| 35 to 64 Years | 34 (14.5%) | 56 (20.7%) |
| 65 to 74 Years | 48 (63.2%) | 60 (70.6%) |
| 75 Years and over | 11 (52.4%) | 27 (81.8%) |
Disability Class by Sex by Age in Gordonsville
Disability Class: Hearing Difficulty
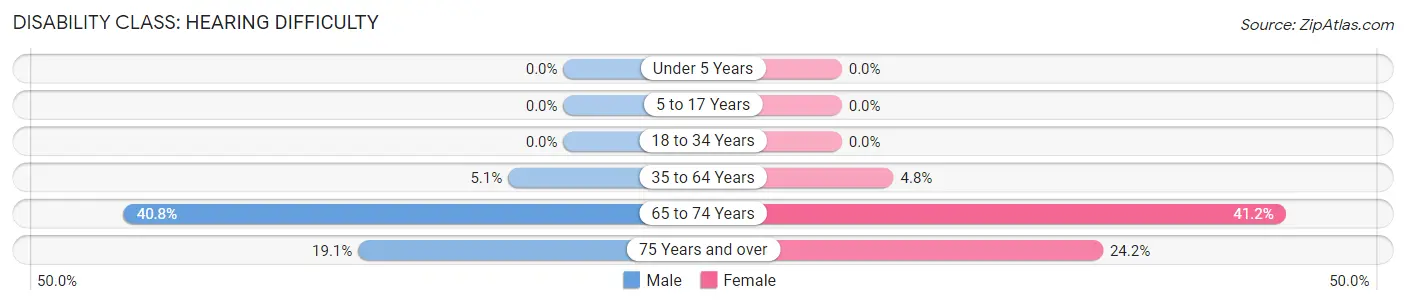
| Age Bracket | Male | Female |
| Under 5 Years | 0 (0.0%) | 0 (0.0%) |
| 5 to 17 Years | 0 (0.0%) | 0 (0.0%) |
| 18 to 34 Years | 0 (0.0%) | 0 (0.0%) |
| 35 to 64 Years | 12 (5.1%) | 13 (4.8%) |
| 65 to 74 Years | 31 (40.8%) | 35 (41.2%) |
| 75 Years and over | 4 (19.1%) | 8 (24.2%) |
Disability Class: Vision Difficulty
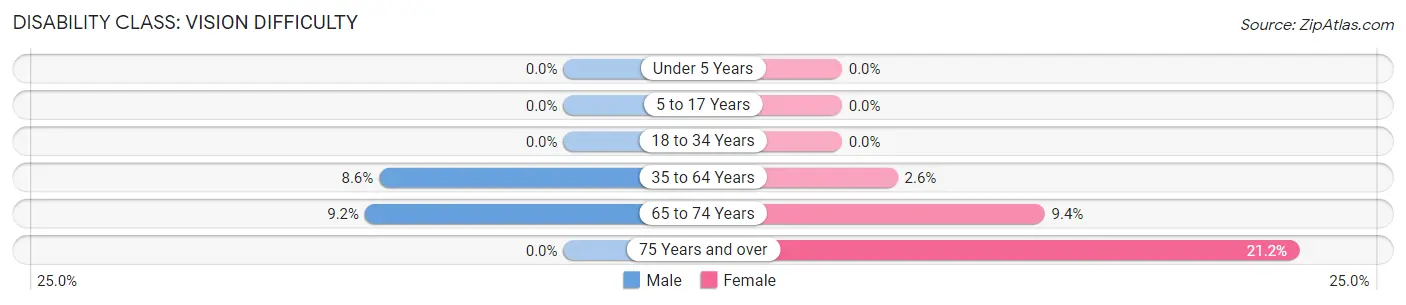
| Age Bracket | Male | Female |
| Under 5 Years | 0 (0.0%) | 0 (0.0%) |
| 5 to 17 Years | 0 (0.0%) | 0 (0.0%) |
| 18 to 34 Years | 0 (0.0%) | 0 (0.0%) |
| 35 to 64 Years | 20 (8.6%) | 7 (2.6%) |
| 65 to 74 Years | 7 (9.2%) | 8 (9.4%) |
| 75 Years and over | 0 (0.0%) | 7 (21.2%) |
Disability Class: Cognitive Difficulty
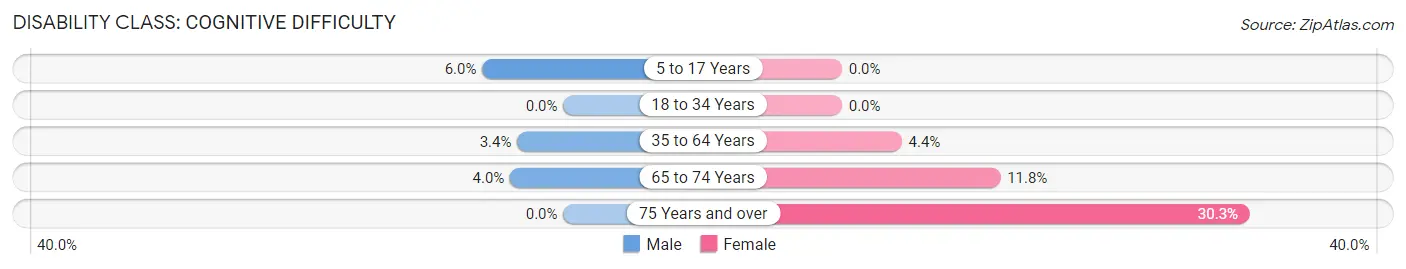
| Age Bracket | Male | Female |
| 5 to 17 Years | 10 (6.0%) | 0 (0.0%) |
| 18 to 34 Years | 0 (0.0%) | 0 (0.0%) |
| 35 to 64 Years | 8 (3.4%) | 12 (4.4%) |
| 65 to 74 Years | 3 (4.0%) | 10 (11.8%) |
| 75 Years and over | 0 (0.0%) | 10 (30.3%) |
Disability Class: Ambulatory Difficulty
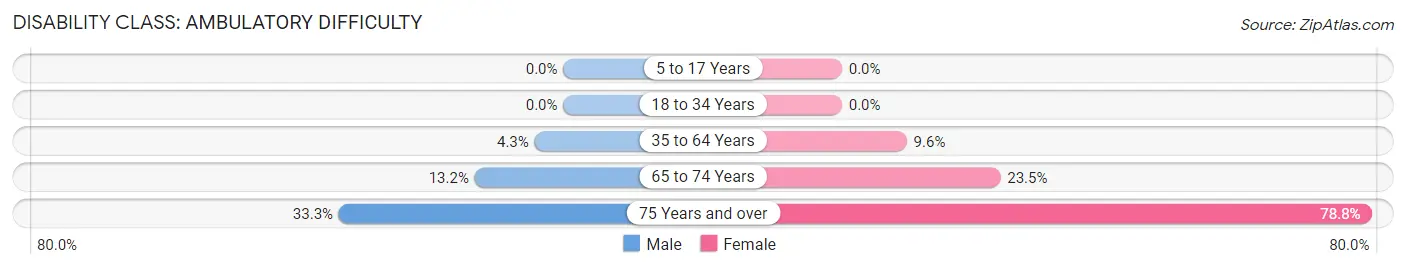
| Age Bracket | Male | Female |
| 5 to 17 Years | 0 (0.0%) | 0 (0.0%) |
| 18 to 34 Years | 0 (0.0%) | 0 (0.0%) |
| 35 to 64 Years | 10 (4.3%) | 26 (9.6%) |
| 65 to 74 Years | 10 (13.2%) | 20 (23.5%) |
| 75 Years and over | 7 (33.3%) | 26 (78.8%) |
Disability Class: Self-Care Difficulty
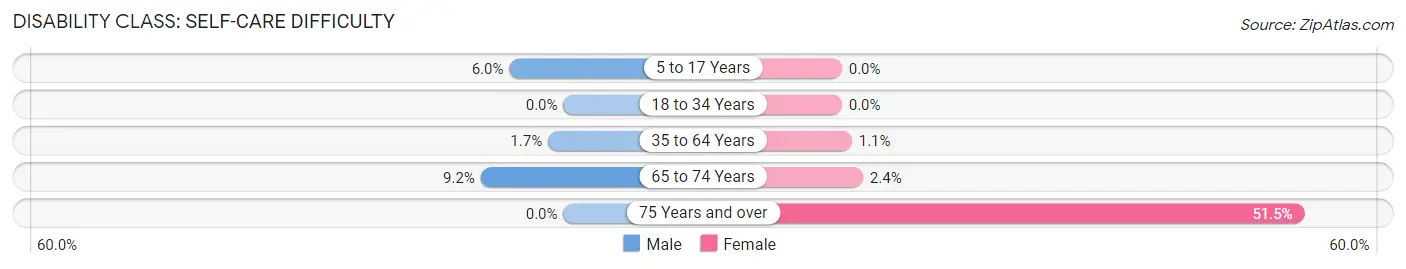
| Age Bracket | Male | Female |
| 5 to 17 Years | 10 (6.0%) | 0 (0.0%) |
| 18 to 34 Years | 0 (0.0%) | 0 (0.0%) |
| 35 to 64 Years | 4 (1.7%) | 3 (1.1%) |
| 65 to 74 Years | 7 (9.2%) | 2 (2.4%) |
| 75 Years and over | 0 (0.0%) | 17 (51.5%) |
Technology Access in Gordonsville
Computing Device Access in Gordonsville
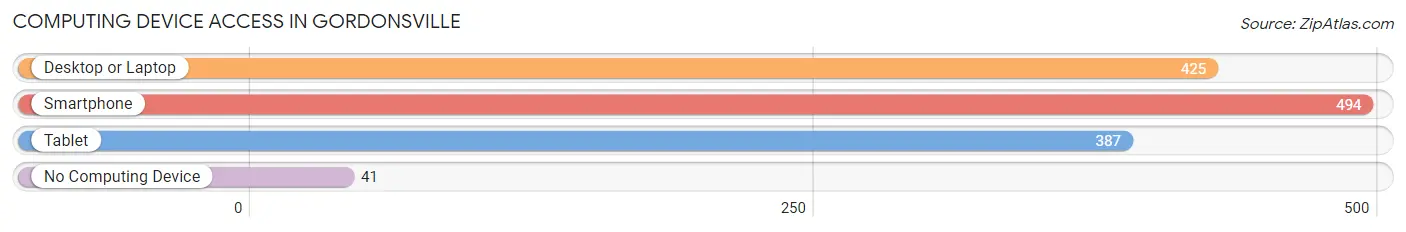
| Device Type | # Households | % Households |
| Desktop or Laptop | 425 | 73.9% |
| Smartphone | 494 | 85.9% |
| Tablet | 387 | 67.3% |
| No Computing Device | 41 | 7.1% |
| Total | 575 | 100.0% |
Internet Access in Gordonsville
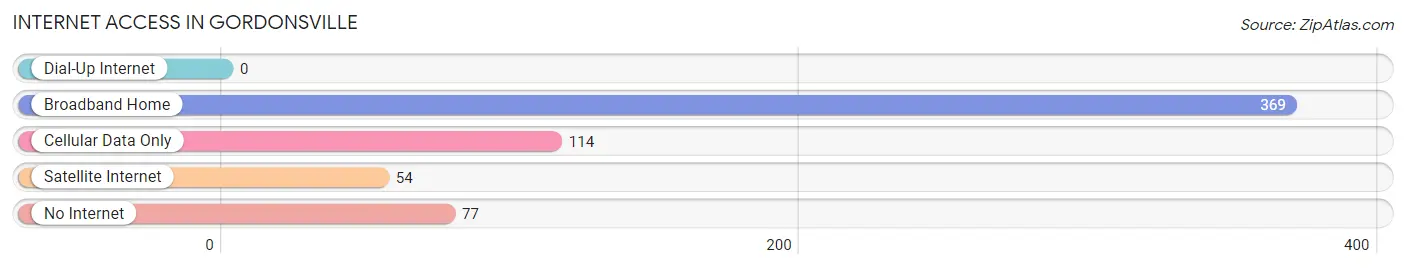
| Internet Type | # Households | % Households |
| Dial-Up Internet | 0 | 0.0% |
| Broadband Home | 369 | 64.2% |
| Cellular Data Only | 114 | 19.8% |
| Satellite Internet | 54 | 9.4% |
| No Internet | 77 | 13.4% |
| Total | 575 | 100.0% |
Gordonsville Summary
Gordonsville is a small town located in Smith County, Tennessee, United States. It is situated in the foothills of the Cumberland Plateau, approximately 30 miles northeast of Nashville. The town was founded in 1820 and named after James Gordon, a local landowner. As of the 2010 census, the population of Gordonsville was 1,845.
History
Gordonsville was founded in 1820 by James Gordon, a local landowner. The town was originally known as Gordon's Crossroads, and was later renamed Gordonsville. The town was incorporated in 1871.
Gordonsville was a major stop on the Nashville and Knoxville Railroad, which was completed in 1854. The railroad brought economic growth to the town, and it became a center for trade and commerce.
During the Civil War, Gordonsville was the site of several battles. In 1862, Confederate forces under General Braxton Bragg defeated Union forces at the Battle of Gordonsville. In 1864, Union forces under General William T. Sherman captured the town.
Geography
Gordonsville is located in Smith County, Tennessee, approximately 30 miles northeast of Nashville. The town is situated in the foothills of the Cumberland Plateau, at an elevation of 830 feet.
The town is located at the intersection of State Route 53 and State Route 141. The nearest major cities are Nashville, Knoxville, and Chattanooga.
Climate
Gordonsville has a humid subtropical climate, with hot, humid summers and mild winters. The average annual temperature is 61°F, and the average annual precipitation is 45 inches.
Demographics
As of the 2010 census, the population of Gordonsville was 1,845. The racial makeup of the town was 95.2% White, 2.2% African American, 0.3% Native American, 0.3% Asian, 0.2% from other races, and 1.9% from two or more races. Hispanic or Latino of any race were 1.2% of the population.
Economy
Gordonsville's economy is largely based on agriculture and manufacturing. The town is home to several small businesses, including a grocery store, a hardware store, and a restaurant.
The town is also home to several large employers, including a manufacturing plant and a lumber mill. The manufacturing plant produces automotive parts, and the lumber mill produces wood products.
The town is served by the Smith County School System, which includes two elementary schools, a middle school, and a high school. The town is also home to a branch of the Tennessee College of Applied Technology.
Conclusion
Gordonsville is a small town located in Smith County, Tennessee, United States. It was founded in 1820 and named after James Gordon, a local landowner. As of the 2010 census, the population of Gordonsville was 1,845. The town is situated in the foothills of the Cumberland Plateau, and is a major stop on the Nashville and Knoxville Railroad. The town's economy is largely based on agriculture and manufacturing, and it is served by the Smith County School System.
Common Questions
What is Per Capita Income in Gordonsville?
Per Capita income in Gordonsville is $32,697.
What is the Median Family Income in Gordonsville?
Median Family Income in Gordonsville is $68,800.
What is the Median Household income in Gordonsville?
Median Household Income in Gordonsville is $62,880.
What is Income or Wage Gap in Gordonsville?
Income or Wage Gap in Gordonsville is 23.1%.
Women in Gordonsville earn 76.9 cents for every dollar earned by a man.
What is Inequality or Gini Index in Gordonsville?
Inequality or Gini Index in Gordonsville is 0.46.
What is the Total Population of Gordonsville?
Total Population of Gordonsville is 1,469.
What is the Total Male Population of Gordonsville?
Total Male Population of Gordonsville is 751.
What is the Total Female Population of Gordonsville?
Total Female Population of Gordonsville is 718.
What is the Ratio of Males per 100 Females in Gordonsville?
There are 104.60 Males per 100 Females in Gordonsville.
What is the Ratio of Females per 100 Males in Gordonsville?
There are 95.61 Females per 100 Males in Gordonsville.
What is the Median Population Age in Gordonsville?
Median Population Age in Gordonsville is 34.0 Years.
What is the Average Family Size in Gordonsville
Average Family Size in Gordonsville is 3.0 People.
What is the Average Household Size in Gordonsville
Average Household Size in Gordonsville is 2.5 People.
How Large is the Labor Force in Gordonsville?
There are 779 People in the Labor Forcein in Gordonsville.
What is the Percentage of People in the Labor Force in Gordonsville?
69.1% of People are in the Labor Force in Gordonsville.
What is the Unemployment Rate in Gordonsville?
Unemployment Rate in Gordonsville is 2.2%.