New Johnsonville, TN Map & Demographics
New Johnsonville Map
New Johnsonville Overview
$30,359
PER CAPITA INCOME
$77,738
AVG FAMILY INCOME
$66,667
AVG HOUSEHOLD INCOME
35.9%
WAGE / INCOME GAP [ % ]
64.1¢/ $1
WAGE / INCOME GAP [ $ ]
0.43
INEQUALITY / GINI INDEX
1,844
TOTAL POPULATION
915
MALE POPULATION
929
FEMALE POPULATION
98.49
MALES / 100 FEMALES
101.53
FEMALES / 100 MALES
40.2
MEDIAN AGE
3.3
AVG FAMILY SIZE
3.0
AVG HOUSEHOLD SIZE
881
LABOR FORCE [ PEOPLE ]
64.0%
PERCENT IN LABOR FORCE
2.3%
UNEMPLOYMENT RATE
New Johnsonville Zip Codes
New Johnsonville Area Codes
Income in New Johnsonville
Income Overview in New Johnsonville
Per Capita Income in New Johnsonville is $30,359, while median incomes of families and households are $77,738 and $66,667 respectively.
| Characteristic | Number | Measure |
| Per Capita Income | 1,844 | $30,359 |
| Median Family Income | 476 | $77,738 |
| Mean Family Income | 476 | $74,607 |
| Median Household Income | 626 | $66,667 |
| Mean Household Income | 626 | $80,518 |
| Income Deficit | 476 | $0 |
| Wage / Income Gap (%) | 1,844 | 35.91% |
| Wage / Income Gap ($) | 1,844 | 64.09¢ per $1 |
| Gini / Inequality Index | 1,844 | 0.43 |
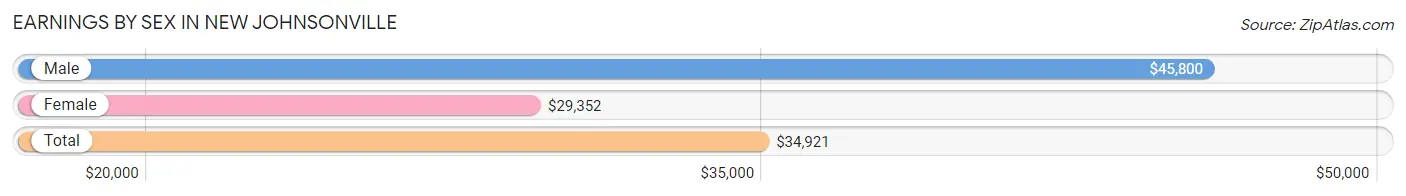
Earnings by Sex in New Johnsonville
Average Earnings in New Johnsonville are $34,921, $45,800 for men and $29,352 for women, a difference of 35.9%.
| Sex | Number | Average Earnings |
| Male | 482 (54.8%) | $45,800 |
| Female | 398 (45.2%) | $29,352 |
| Total | 880 (100.0%) | $34,921 |
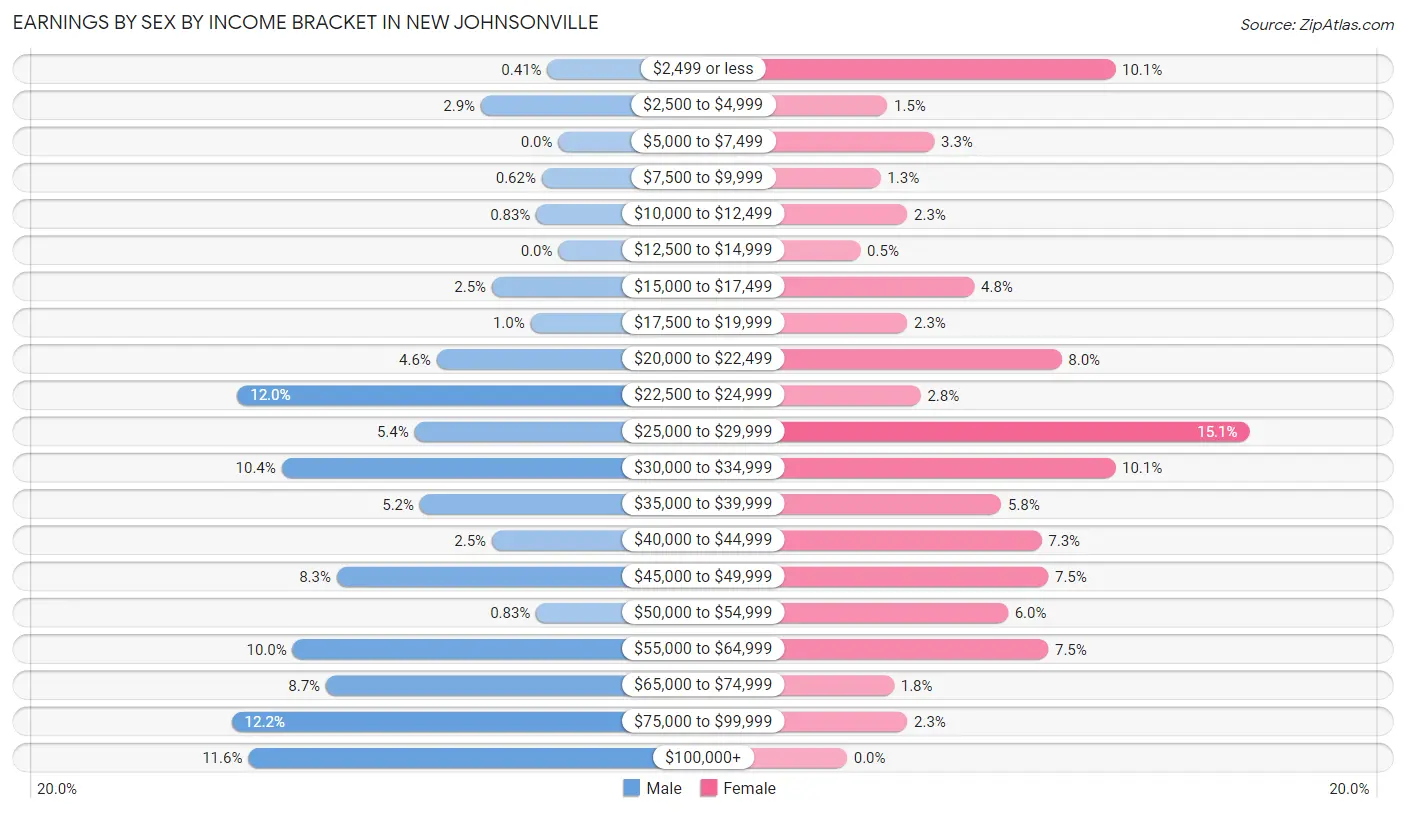
Earnings by Sex by Income Bracket in New Johnsonville
The most common earnings brackets in New Johnsonville are $75,000 to $99,999 for men (59 | 12.2%) and $25,000 to $29,999 for women (60 | 15.1%).
| Income | Male | Female |
| $2,499 or less | 2 (0.4%) | 40 (10.1%) |
| $2,500 to $4,999 | 14 (2.9%) | 6 (1.5%) |
| $5,000 to $7,499 | 0 (0.0%) | 13 (3.3%) |
| $7,500 to $9,999 | 3 (0.6%) | 5 (1.3%) |
| $10,000 to $12,499 | 4 (0.8%) | 9 (2.3%) |
| $12,500 to $14,999 | 0 (0.0%) | 2 (0.5%) |
| $15,000 to $17,499 | 12 (2.5%) | 19 (4.8%) |
| $17,500 to $19,999 | 5 (1.0%) | 9 (2.3%) |
| $20,000 to $22,499 | 22 (4.6%) | 32 (8.0%) |
| $22,500 to $24,999 | 58 (12.0%) | 11 (2.8%) |
| $25,000 to $29,999 | 26 (5.4%) | 60 (15.1%) |
| $30,000 to $34,999 | 50 (10.4%) | 40 (10.1%) |
| $35,000 to $39,999 | 25 (5.2%) | 23 (5.8%) |
| $40,000 to $44,999 | 12 (2.5%) | 29 (7.3%) |
| $45,000 to $49,999 | 40 (8.3%) | 30 (7.5%) |
| $50,000 to $54,999 | 4 (0.8%) | 24 (6.0%) |
| $55,000 to $64,999 | 48 (10.0%) | 30 (7.5%) |
| $65,000 to $74,999 | 42 (8.7%) | 7 (1.8%) |
| $75,000 to $99,999 | 59 (12.2%) | 9 (2.3%) |
| $100,000+ | 56 (11.6%) | 0 (0.0%) |
| Total | 482 (100.0%) | 398 (100.0%) |
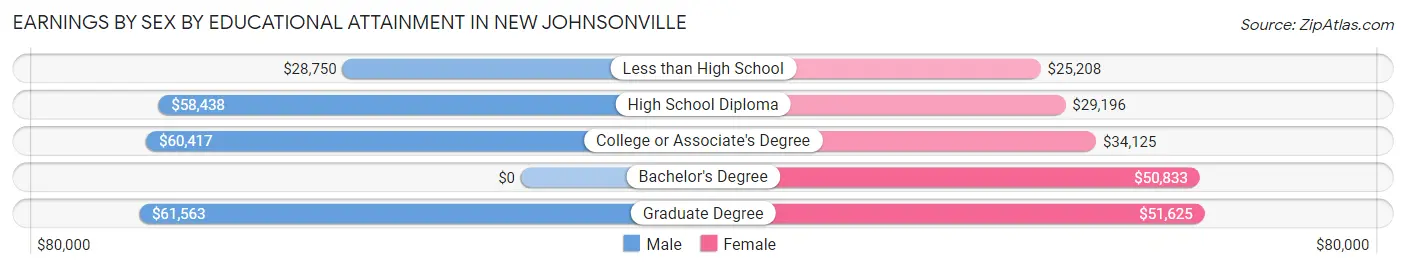
Earnings by Sex by Educational Attainment in New Johnsonville
Average earnings in New Johnsonville are $55,625 for men and $34,438 for women, a difference of 38.1%. Men with an educational attainment of graduate degree enjoy the highest average annual earnings of $61,563, while those with less than high school education earn the least with $28,750. Women with an educational attainment of graduate degree earn the most with the average annual earnings of $51,625, while those with less than high school education have the smallest earnings of $25,208.
| Educational Attainment | Male Income | Female Income |
| Less than High School | $28,750 | $25,208 |
| High School Diploma | $58,438 | $29,196 |
| College or Associate's Degree | $60,417 | $34,125 |
| Bachelor's Degree | - | - |
| Graduate Degree | $61,563 | $51,625 |
| Total | $55,625 | $34,438 |
Family Income in New Johnsonville
Family Income Brackets in New Johnsonville
According to the New Johnsonville family income data, there are 113 families falling into the $75,000 to $99,999 income range, which is the most common income bracket and makes up 23.7% of all families.
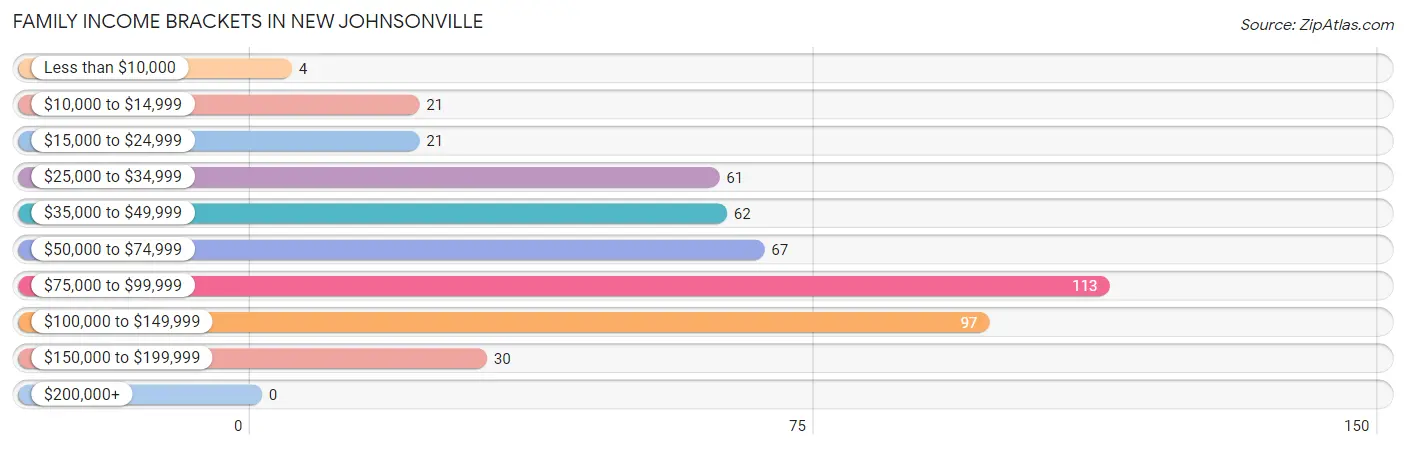
| Income Bracket | # Families | % Families |
| Less than $10,000 | 4 | 0.8% |
| $10,000 to $14,999 | 21 | 4.4% |
| $15,000 to $24,999 | 21 | 4.4% |
| $25,000 to $34,999 | 61 | 12.8% |
| $35,000 to $49,999 | 62 | 13.0% |
| $50,000 to $74,999 | 67 | 14.1% |
| $75,000 to $99,999 | 113 | 23.7% |
| $100,000 to $149,999 | 97 | 20.4% |
| $150,000 to $199,999 | 30 | 6.3% |
| $200,000+ | 0 | 0.0% |
Family Income by Famaliy Size in New Johnsonville
5-person families (23 | 4.8%) account for the highest median family income in New Johnsonville with $110,250 per family, while 2-person families (287 | 60.3%) have the highest median income of $29,271 per family member.
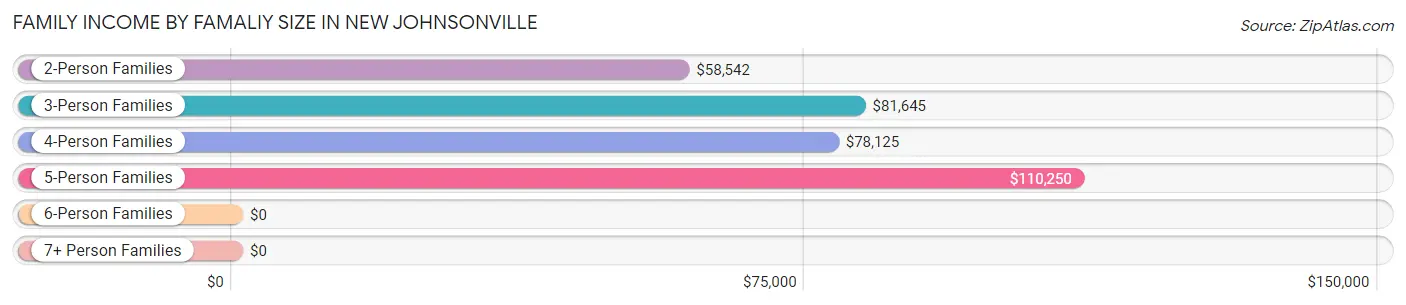
| Income Bracket | # Families | Median Income |
| 2-Person Families | 287 (60.3%) | $58,542 |
| 3-Person Families | 95 (20.0%) | $81,645 |
| 4-Person Families | 71 (14.9%) | $78,125 |
| 5-Person Families | 23 (4.8%) | $110,250 |
| 6-Person Families | 0 (0.0%) | $0 |
| 7+ Person Families | 0 (0.0%) | $0 |
| Total | 476 (100.0%) | $77,738 |
Family Income by Number of Earners in New Johnsonville
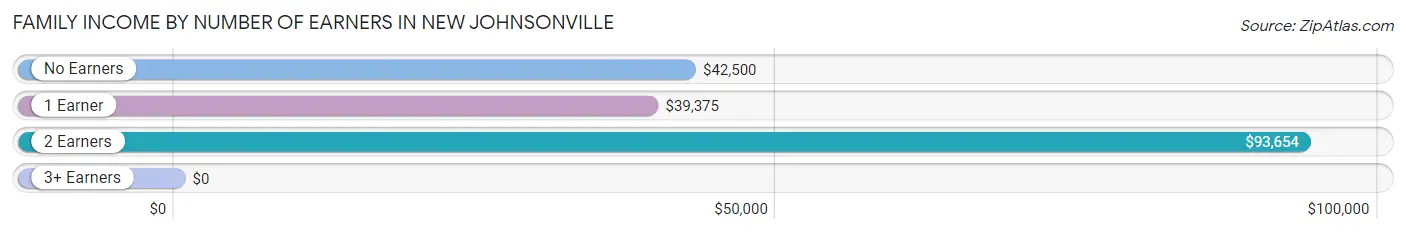
| Number of Earners | # Families | Median Income |
| No Earners | 108 (22.7%) | $42,500 |
| 1 Earner | 134 (28.1%) | $39,375 |
| 2 Earners | 216 (45.4%) | $93,654 |
| 3+ Earners | 18 (3.8%) | $0 |
| Total | 476 (100.0%) | $77,738 |
Household Income in New Johnsonville
Household Income Brackets in New Johnsonville
With 134 households falling in the category, the $75,000 to $99,999 income range is the most frequent in New Johnsonville, accounting for 21.4% of all households. In contrast, only 10 households (1.6%) fall into the less than $10,000 income bracket, making it the least populous group.
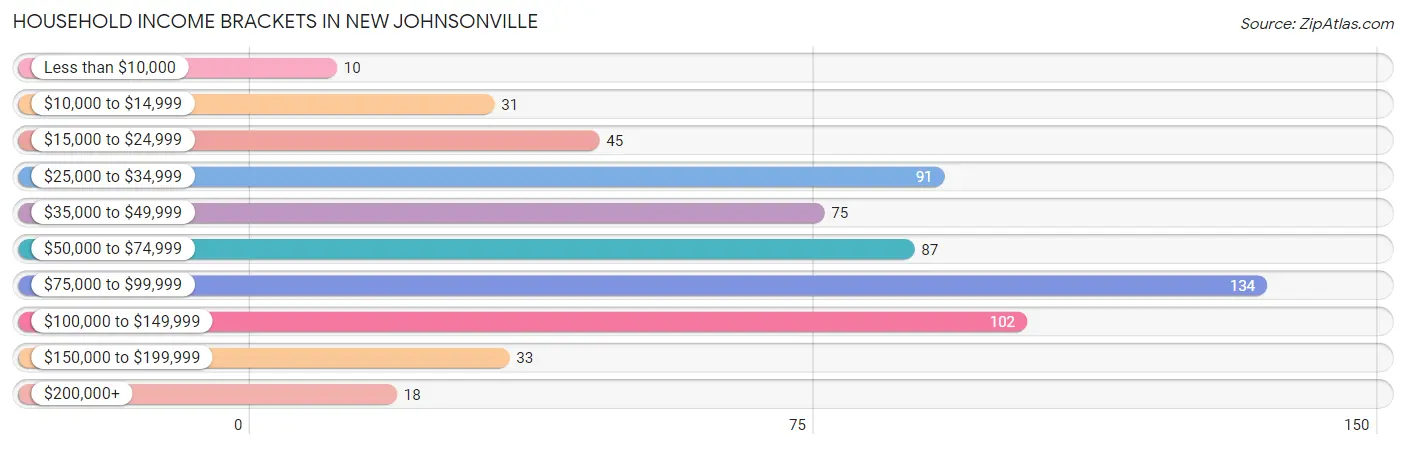
| Income Bracket | # Households | % Households |
| Less than $10,000 | 10 | 1.6% |
| $10,000 to $14,999 | 31 | 5.0% |
| $15,000 to $24,999 | 45 | 7.2% |
| $25,000 to $34,999 | 91 | 14.5% |
| $35,000 to $49,999 | 75 | 12.0% |
| $50,000 to $74,999 | 87 | 13.9% |
| $75,000 to $99,999 | 134 | 21.4% |
| $100,000 to $149,999 | 102 | 16.3% |
| $150,000 to $199,999 | 33 | 5.3% |
| $200,000+ | 18 | 2.9% |
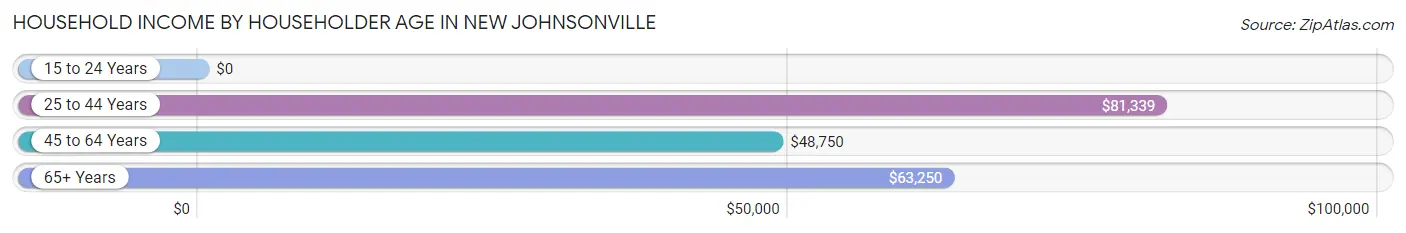
Household Income by Householder Age in New Johnsonville
The median household income in New Johnsonville is $66,667, with the highest median household income of $81,339 found in the 25 to 44 years age bracket for the primary householder. A total of 177 households (28.3%) fall into this category. Meanwhile, the 15 to 24 years age bracket for the primary householder has the lowest median household income of $0, with 19 households (3.0%) in this group.
| Income Bracket | # Households | Median Income |
| 15 to 24 Years | 19 (3.0%) | $0 |
| 25 to 44 Years | 177 (28.3%) | $81,339 |
| 45 to 64 Years | 297 (47.4%) | $48,750 |
| 65+ Years | 133 (21.2%) | $63,250 |
| Total | 626 (100.0%) | $66,667 |
Poverty in New Johnsonville
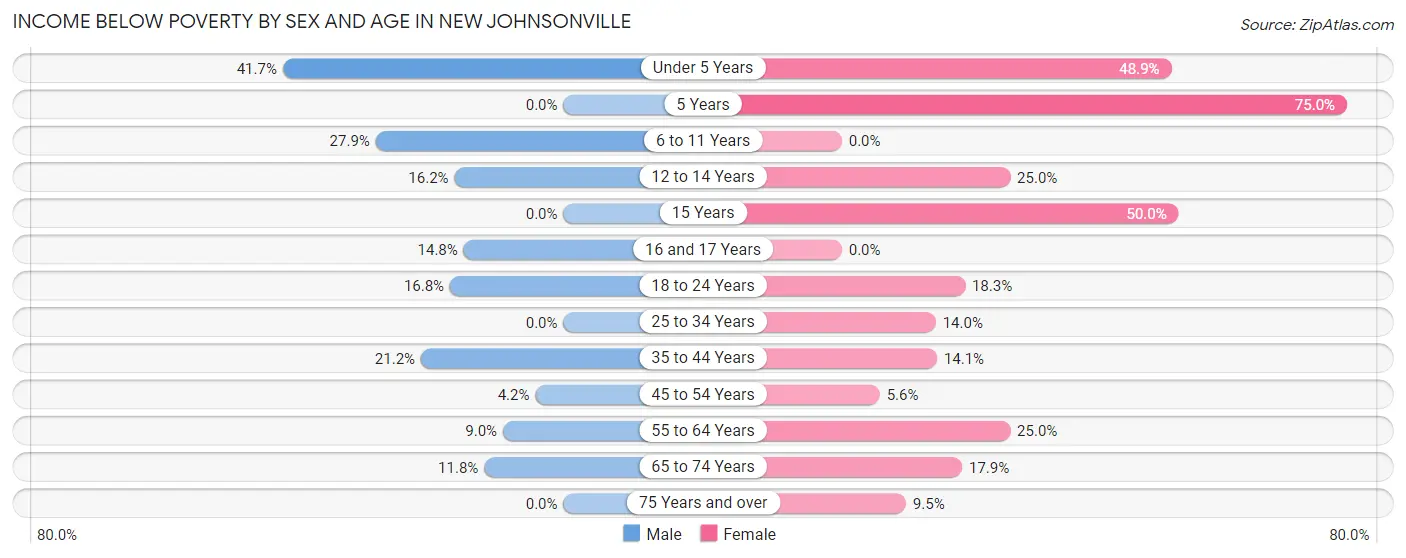
Income Below Poverty by Sex and Age in New Johnsonville
With 12.2% poverty level for males and 17.1% for females among the residents of New Johnsonville, under 5 year old males and 5 year old females are the most vulnerable to poverty, with 15 males (41.7%) and 30 females (75.0%) in their respective age groups living below the poverty level.
| Age Bracket | Male | Female |
| Under 5 Years | 15 (41.7%) | 23 (48.9%) |
| 5 Years | 0 (0.0%) | 30 (75.0%) |
| 6 to 11 Years | 17 (27.9%) | 0 (0.0%) |
| 12 to 14 Years | 11 (16.2%) | 6 (25.0%) |
| 15 Years | 0 (0.0%) | 3 (50.0%) |
| 16 and 17 Years | 4 (14.8%) | 0 (0.0%) |
| 18 to 24 Years | 16 (16.8%) | 15 (18.3%) |
| 25 to 34 Years | 0 (0.0%) | 12 (14.0%) |
| 35 to 44 Years | 22 (21.1%) | 13 (14.1%) |
| 45 to 54 Years | 6 (4.2%) | 8 (5.6%) |
| 55 to 64 Years | 14 (9.0%) | 25 (25.0%) |
| 65 to 74 Years | 6 (11.8%) | 10 (17.9%) |
| 75 Years and over | 0 (0.0%) | 6 (9.5%) |
| Total | 111 (12.2%) | 151 (17.1%) |
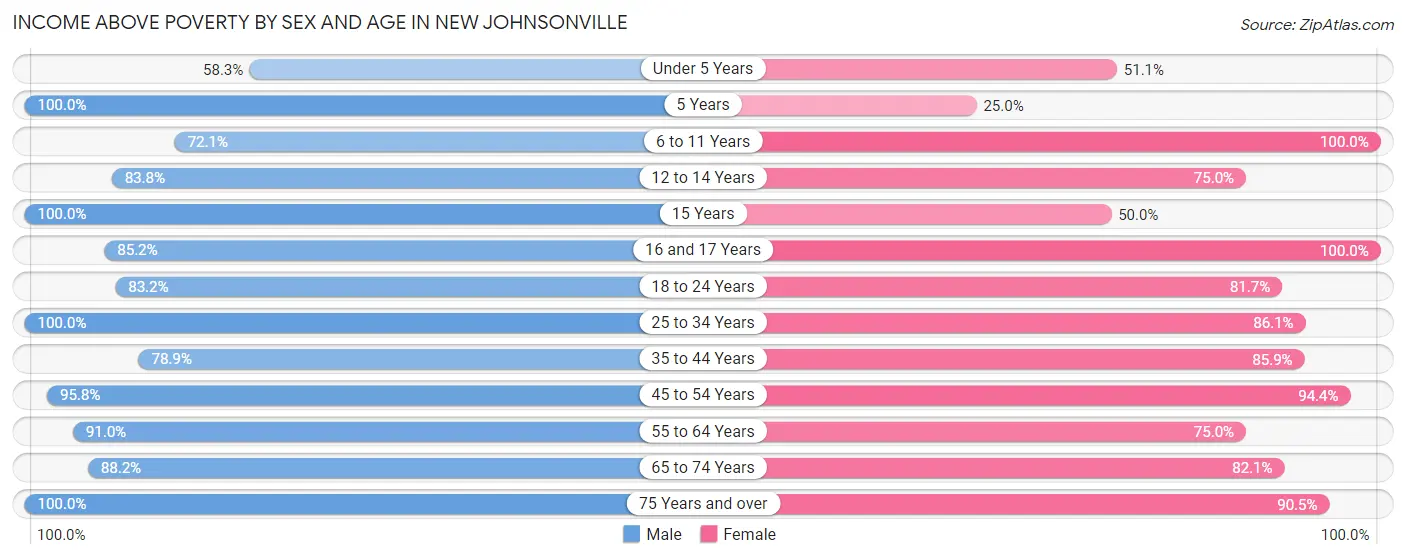
Income Above Poverty by Sex and Age in New Johnsonville
According to the poverty statistics in New Johnsonville, males aged 5 years and females aged 6 to 11 years are the age groups that are most secure financially, with 100.0% of males and 100.0% of females in these age groups living above the poverty line.
| Age Bracket | Male | Female |
| Under 5 Years | 21 (58.3%) | 24 (51.1%) |
| 5 Years | 11 (100.0%) | 10 (25.0%) |
| 6 to 11 Years | 44 (72.1%) | 110 (100.0%) |
| 12 to 14 Years | 57 (83.8%) | 18 (75.0%) |
| 15 Years | 14 (100.0%) | 3 (50.0%) |
| 16 and 17 Years | 23 (85.2%) | 36 (100.0%) |
| 18 to 24 Years | 79 (83.2%) | 67 (81.7%) |
| 25 to 34 Years | 73 (100.0%) | 74 (86.1%) |
| 35 to 44 Years | 82 (78.8%) | 79 (85.9%) |
| 45 to 54 Years | 138 (95.8%) | 134 (94.4%) |
| 55 to 64 Years | 142 (91.0%) | 75 (75.0%) |
| 65 to 74 Years | 45 (88.2%) | 46 (82.1%) |
| 75 Years and over | 69 (100.0%) | 57 (90.5%) |
| Total | 798 (87.8%) | 733 (82.9%) |
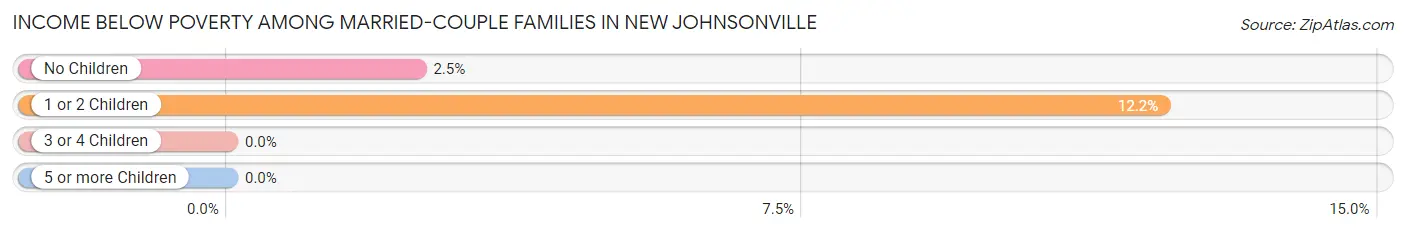
Income Below Poverty Among Married-Couple Families in New Johnsonville
The poverty statistics for married-couple families in New Johnsonville show that 5.3% or 20 of the total 377 families live below the poverty line. Families with 1 or 2 children have the highest poverty rate of 12.2%, comprising of 14 families. On the other hand, families with 3 or 4 children have the lowest poverty rate of 0.0%, which includes 0 families.
| Children | Above Poverty | Below Poverty |
| No Children | 238 (97.5%) | 6 (2.5%) |
| 1 or 2 Children | 101 (87.8%) | 14 (12.2%) |
| 3 or 4 Children | 18 (100.0%) | 0 (0.0%) |
| 5 or more Children | 0 (0.0%) | 0 (0.0%) |
| Total | 357 (94.7%) | 20 (5.3%) |
Income Below Poverty Among Single-Parent Households in New Johnsonville
According to the poverty data in New Johnsonville, 32.3% or 10 single-father households and 26.5% or 18 single-mother households are living below the poverty line. Among single-father households, those with 1 or 2 children have the highest poverty rate, with 10 households (47.6%) experiencing poverty. Likewise, among single-mother households, those with 1 or 2 children have the highest poverty rate, with 16 households (66.7%) falling below the poverty line.
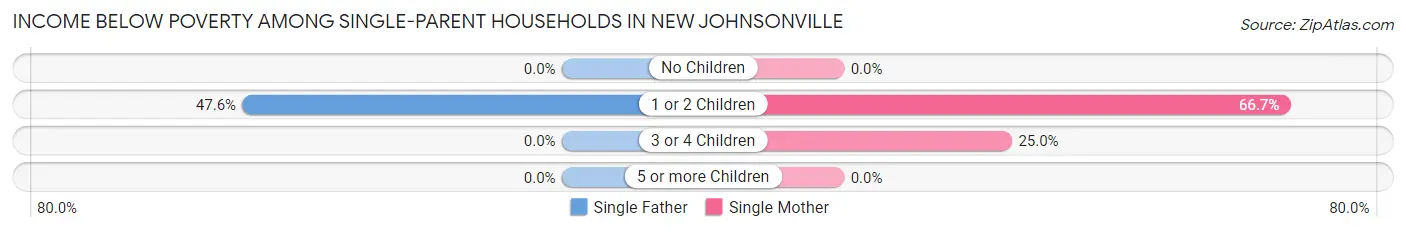
| Children | Single Father | Single Mother |
| No Children | 0 (0.0%) | 0 (0.0%) |
| 1 or 2 Children | 10 (47.6%) | 16 (66.7%) |
| 3 or 4 Children | 0 (0.0%) | 2 (25.0%) |
| 5 or more Children | 0 (0.0%) | 0 (0.0%) |
| Total | 10 (32.3%) | 18 (26.5%) |
Income Below Poverty Among Married-Couple vs Single-Parent Households in New Johnsonville
The poverty data for New Johnsonville shows that 20 of the married-couple family households (5.3%) and 28 of the single-parent households (28.3%) are living below the poverty level. Within the married-couple family households, those with 1 or 2 children have the highest poverty rate, with 14 households (12.2%) falling below the poverty line. Among the single-parent households, those with 1 or 2 children have the highest poverty rate, with 26 household (57.8%) living below poverty.
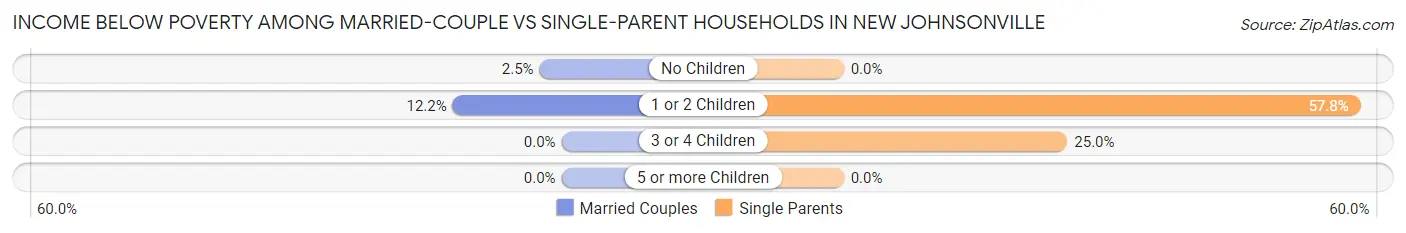
| Children | Married-Couple Families | Single-Parent Households |
| No Children | 6 (2.5%) | 0 (0.0%) |
| 1 or 2 Children | 14 (12.2%) | 26 (57.8%) |
| 3 or 4 Children | 0 (0.0%) | 2 (25.0%) |
| 5 or more Children | 0 (0.0%) | 0 (0.0%) |
| Total | 20 (5.3%) | 28 (28.3%) |
Race in New Johnsonville
The most populous races in New Johnsonville are White / Caucasian (1,666 | 90.3%), Two or more Races (113 | 6.1%), and Hispanic or Latino (41 | 2.2%).
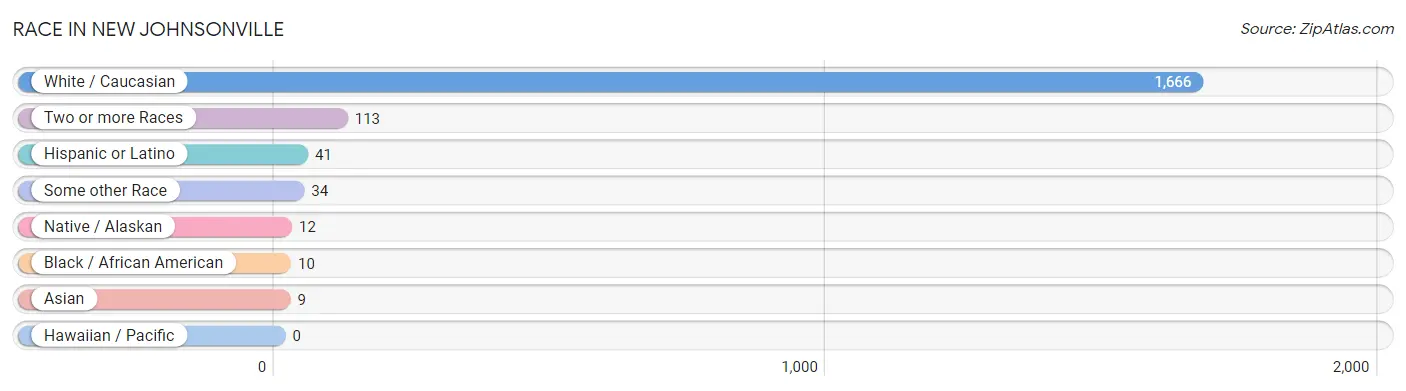
| Race | # Population | % Population |
| Asian | 9 | 0.5% |
| Black / African American | 10 | 0.5% |
| Hawaiian / Pacific | 0 | 0.0% |
| Hispanic or Latino | 41 | 2.2% |
| Native / Alaskan | 12 | 0.6% |
| White / Caucasian | 1,666 | 90.3% |
| Two or more Races | 113 | 6.1% |
| Some other Race | 34 | 1.8% |
| Total | 1,844 | 100.0% |
Ancestry in New Johnsonville
The most populous ancestries reported in New Johnsonville are American (327 | 17.7%), English (140 | 7.6%), Irish (115 | 6.2%), German (50 | 2.7%), and European (43 | 2.3%), together accounting for 36.6% of all New Johnsonville residents.
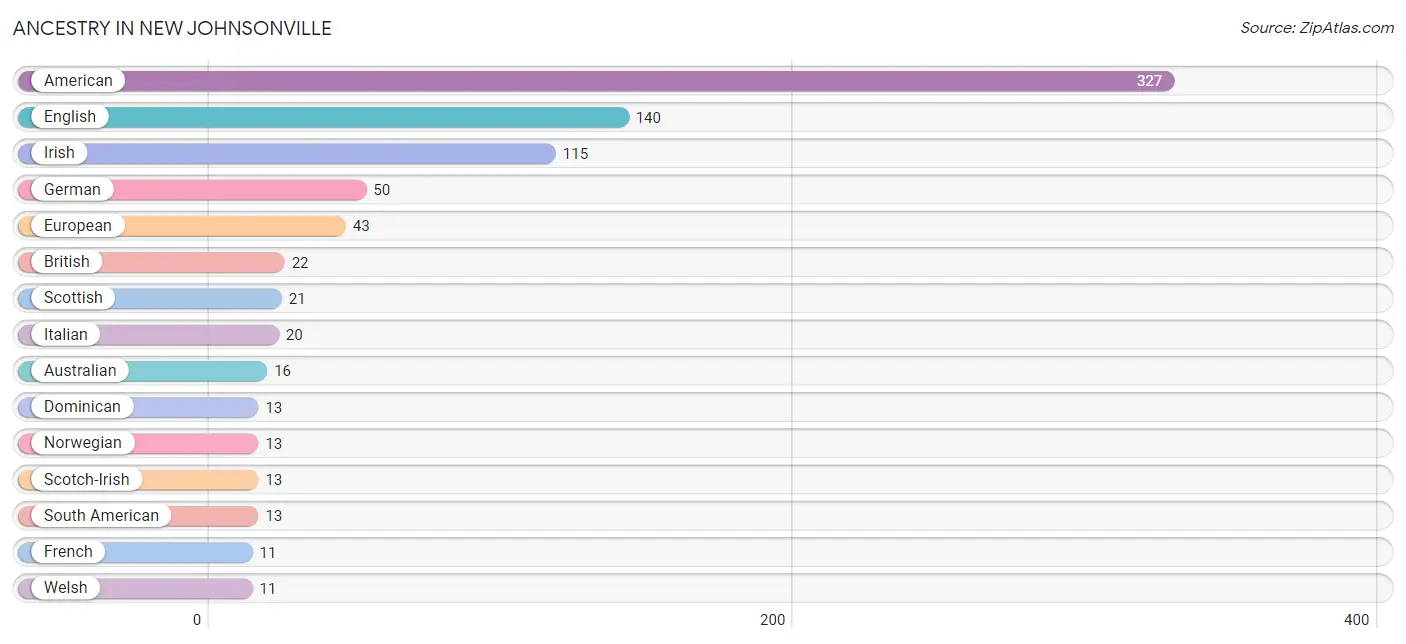
| Ancestry | # Population | % Population |
| American | 327 | 17.7% |
| Argentinean | 9 | 0.5% |
| Australian | 16 | 0.9% |
| Bhutanese | 5 | 0.3% |
| British | 22 | 1.2% |
| Cajun | 4 | 0.2% |
| Cherokee | 10 | 0.5% |
| Chippewa | 1 | 0.1% |
| Choctaw | 9 | 0.5% |
| Dominican | 13 | 0.7% |
| Dutch | 8 | 0.4% |
| Eastern European | 2 | 0.1% |
| English | 140 | 7.6% |
| European | 43 | 2.3% |
| French | 11 | 0.6% |
| German | 50 | 2.7% |
| Greek | 5 | 0.3% |
| Indian (Asian) | 7 | 0.4% |
| Irish | 115 | 6.2% |
| Italian | 20 | 1.1% |
| Korean | 10 | 0.5% |
| Mexican | 3 | 0.2% |
| Norwegian | 13 | 0.7% |
| Peruvian | 4 | 0.2% |
| Polish | 3 | 0.2% |
| Scandinavian | 3 | 0.2% |
| Scotch-Irish | 13 | 0.7% |
| Scottish | 21 | 1.1% |
| Sioux | 1 | 0.1% |
| South American | 13 | 0.7% |
| Spaniard | 9 | 0.5% |
| Swedish | 3 | 0.2% |
| Welsh | 11 | 0.6% | View All 33 Rows |
Immigrants in New Johnsonville
The most numerous immigrant groups reported in New Johnsonville came from Australia (6 | 0.3%), Oceania (6 | 0.3%), Asia (5 | 0.3%), Eastern Asia (5 | 0.3%), and Korea (5 | 0.3%), together accounting for 1.5% of all New Johnsonville residents.
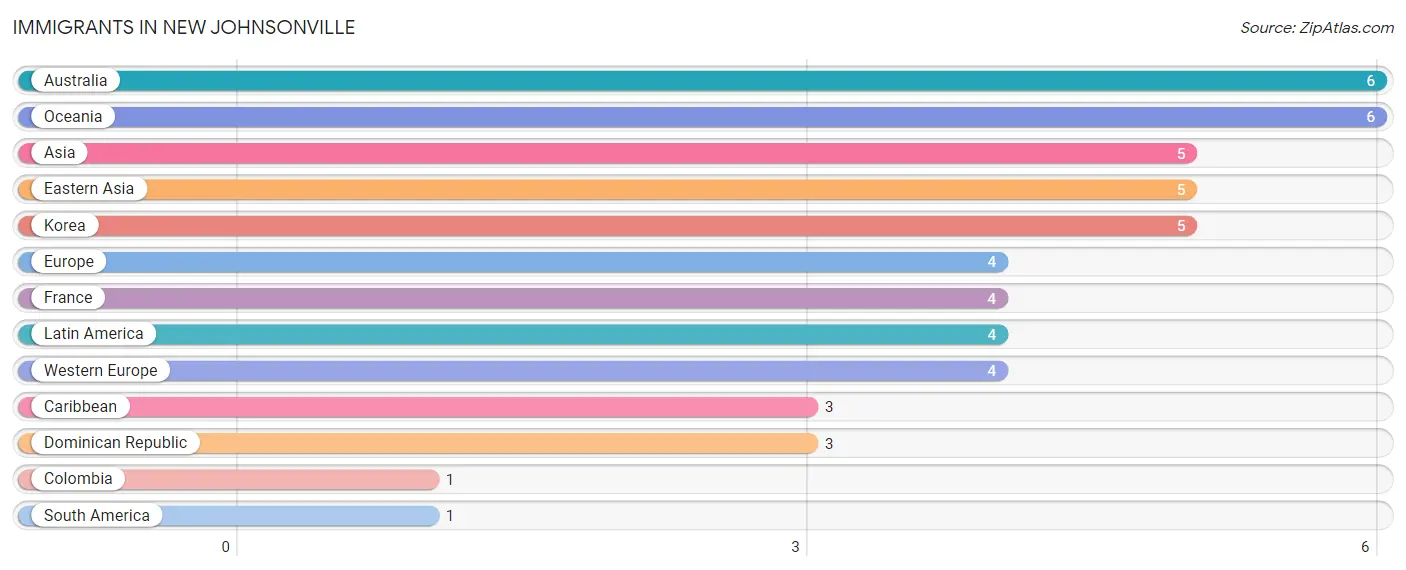
| Immigration Origin | # Population | % Population |
| Asia | 5 | 0.3% |
| Australia | 6 | 0.3% |
| Caribbean | 3 | 0.2% |
| Colombia | 1 | 0.1% |
| Dominican Republic | 3 | 0.2% |
| Eastern Asia | 5 | 0.3% |
| Europe | 4 | 0.2% |
| France | 4 | 0.2% |
| Korea | 5 | 0.3% |
| Latin America | 4 | 0.2% |
| Oceania | 6 | 0.3% |
| South America | 1 | 0.1% |
| Western Europe | 4 | 0.2% | View All 13 Rows |
Sex and Age in New Johnsonville
Sex and Age in New Johnsonville
The most populous age groups in New Johnsonville are 10 to 14 Years (102 | 11.2%) for men and 10 to 14 Years (115 | 12.4%) for women.
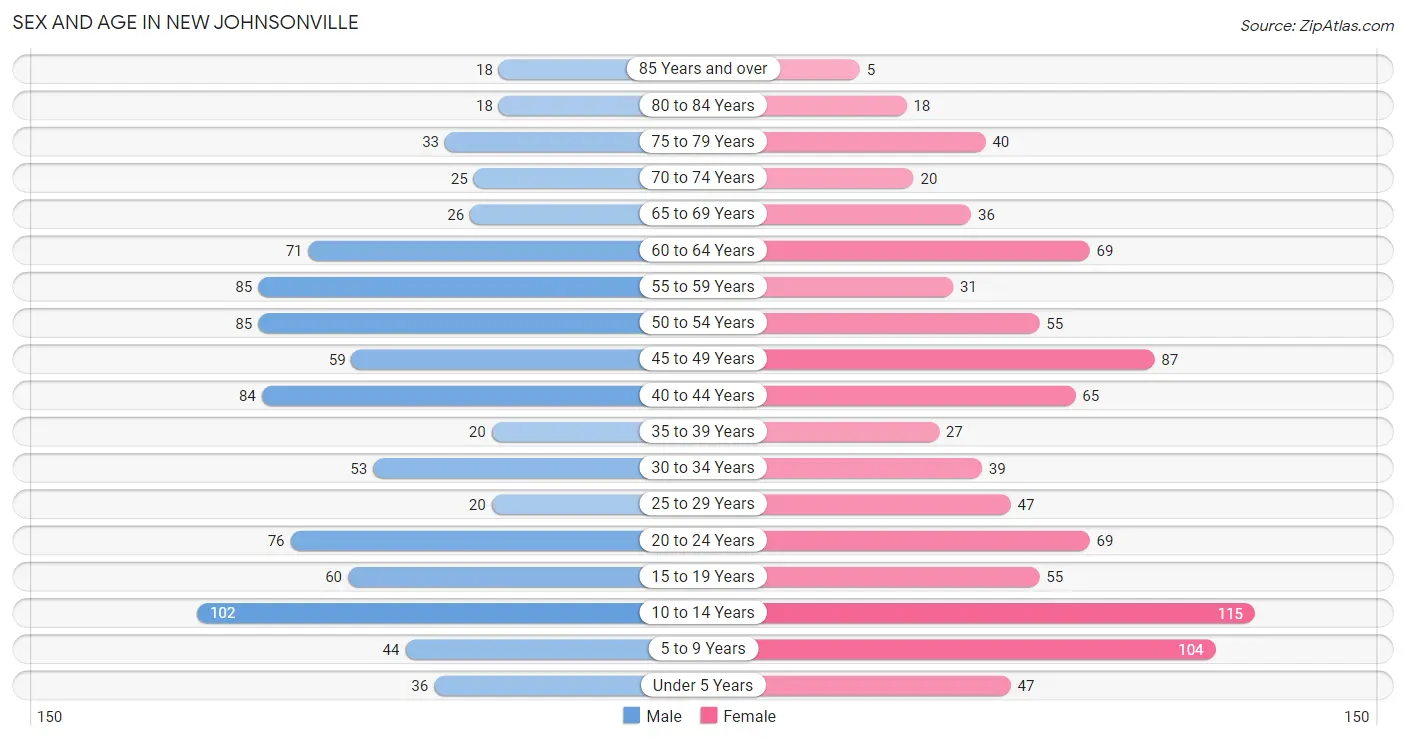
| Age Bracket | Male | Female |
| Under 5 Years | 36 (3.9%) | 47 (5.1%) |
| 5 to 9 Years | 44 (4.8%) | 104 (11.2%) |
| 10 to 14 Years | 102 (11.2%) | 115 (12.4%) |
| 15 to 19 Years | 60 (6.6%) | 55 (5.9%) |
| 20 to 24 Years | 76 (8.3%) | 69 (7.4%) |
| 25 to 29 Years | 20 (2.2%) | 47 (5.1%) |
| 30 to 34 Years | 53 (5.8%) | 39 (4.2%) |
| 35 to 39 Years | 20 (2.2%) | 27 (2.9%) |
| 40 to 44 Years | 84 (9.2%) | 65 (7.0%) |
| 45 to 49 Years | 59 (6.5%) | 87 (9.4%) |
| 50 to 54 Years | 85 (9.3%) | 55 (5.9%) |
| 55 to 59 Years | 85 (9.3%) | 31 (3.3%) |
| 60 to 64 Years | 71 (7.8%) | 69 (7.4%) |
| 65 to 69 Years | 26 (2.8%) | 36 (3.9%) |
| 70 to 74 Years | 25 (2.7%) | 20 (2.1%) |
| 75 to 79 Years | 33 (3.6%) | 40 (4.3%) |
| 80 to 84 Years | 18 (2.0%) | 18 (1.9%) |
| 85 Years and over | 18 (2.0%) | 5 (0.5%) |
| Total | 915 (100.0%) | 929 (100.0%) |
Families and Households in New Johnsonville
Median Family Size in New Johnsonville
The median family size in New Johnsonville is 3.27 persons per family, with single female/mother families (68 | 14.3%) accounting for the largest median family size of 4.01 persons per family. On the other hand, single male/father families (31 | 6.5%) represent the smallest median family size with 2.84 persons per family.
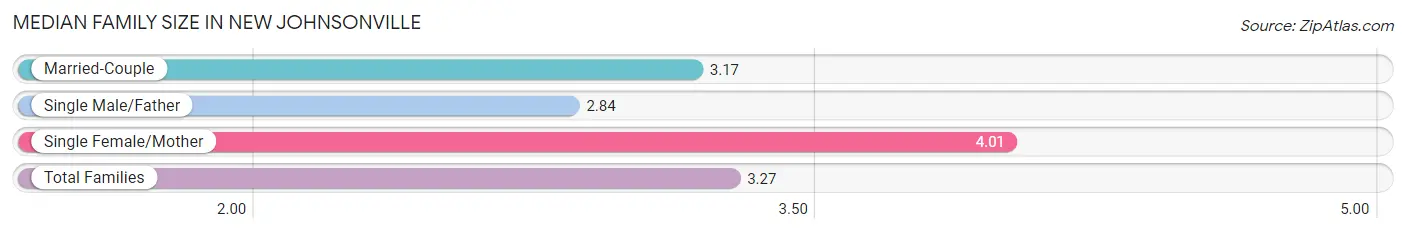
| Family Type | # Families | Family Size |
| Married-Couple | 377 (79.2%) | 3.17 |
| Single Male/Father | 31 (6.5%) | 2.84 |
| Single Female/Mother | 68 (14.3%) | 4.01 |
| Total Families | 476 (100.0%) | 3.27 |
Median Household Size in New Johnsonville
The median household size in New Johnsonville is 2.95 persons per household, with single female/mother households (68 | 10.9%) accounting for the largest median household size of 4.01 persons per household. non-family households (150 | 24.0%) represent the smallest median household size with 1.26 persons per household.
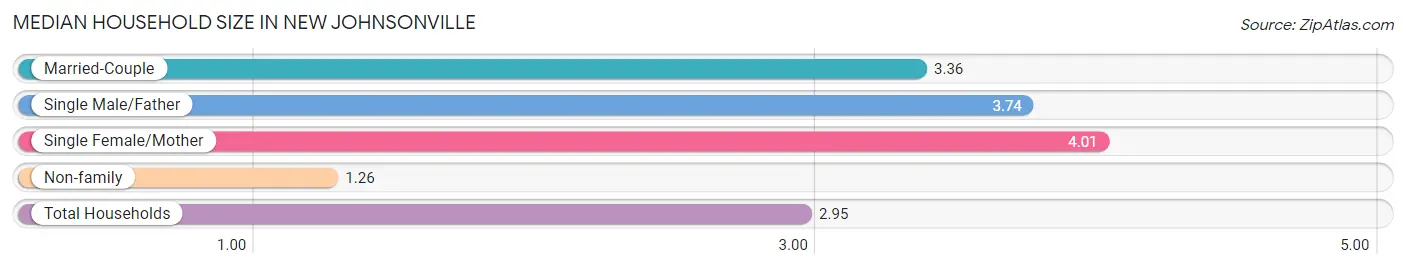
| Household Type | # Households | Household Size |
| Married-Couple | 377 (60.2%) | 3.36 |
| Single Male/Father | 31 (5.0%) | 3.74 |
| Single Female/Mother | 68 (10.9%) | 4.01 |
| Non-family | 150 (24.0%) | 1.26 |
| Total Households | 626 (100.0%) | 2.95 |
Household Size by Marriage Status in New Johnsonville
Out of a total of 626 households in New Johnsonville, 476 (76.0%) are family households, while 150 (24.0%) are nonfamily households. The most numerous type of family households are 2-person households, comprising 280, and the most common type of nonfamily households are 1-person households, comprising 130.
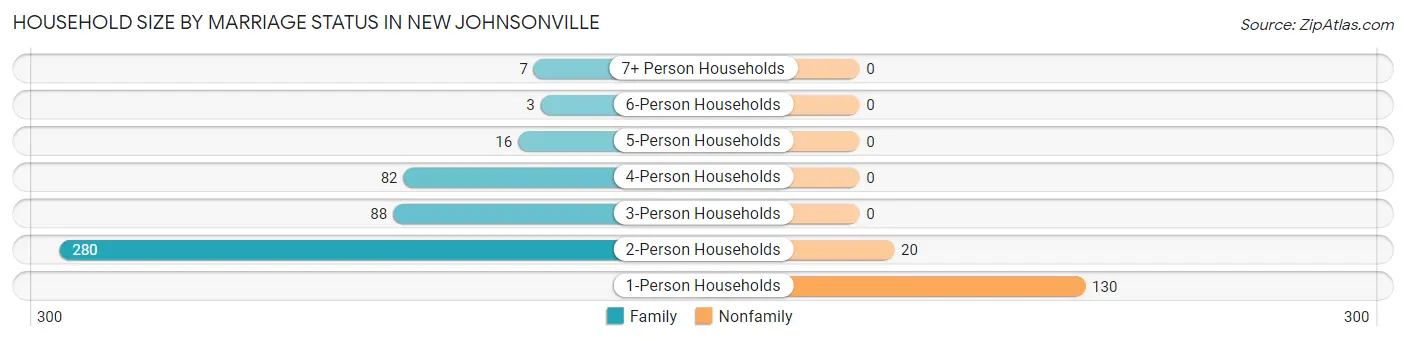
| Household Size | Family Households | Nonfamily Households |
| 1-Person Households | - | 130 (20.8%) |
| 2-Person Households | 280 (44.7%) | 20 (3.2%) |
| 3-Person Households | 88 (14.1%) | 0 (0.0%) |
| 4-Person Households | 82 (13.1%) | 0 (0.0%) |
| 5-Person Households | 16 (2.6%) | 0 (0.0%) |
| 6-Person Households | 3 (0.5%) | 0 (0.0%) |
| 7+ Person Households | 7 (1.1%) | 0 (0.0%) |
| Total | 476 (76.0%) | 150 (24.0%) |
Female Fertility in New Johnsonville
Fertility by Age in New Johnsonville
Average fertility rate in New Johnsonville is 8.0 births per 1,000 women. Women in the age bracket of 35 to 50 years have the highest fertility rate with 16.0 births per 1,000 women. Women in the age bracket of 35 to 50 years acount for 100.0% of all women with births.
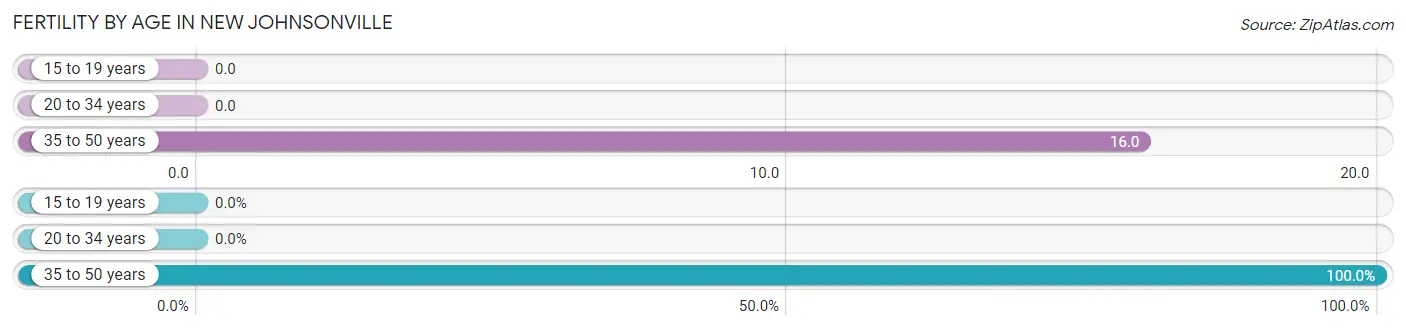
| Age Bracket | Women with Births | Births / 1,000 Women |
| 15 to 19 years | 0 (0.0%) | 0.0 |
| 20 to 34 years | 0 (0.0%) | 0.0 |
| 35 to 50 years | 3 (100.0%) | 16.0 |
| Total | 3 (100.0%) | 8.0 |
Fertility by Age by Marriage Status in New Johnsonville
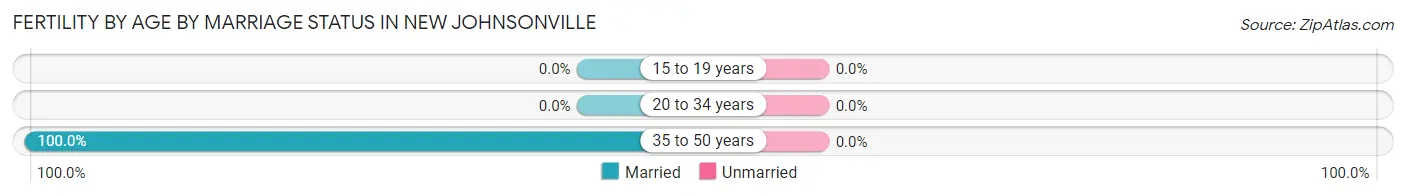
| Age Bracket | Married | Unmarried |
| 15 to 19 years | 0 (0.0%) | 0 (0.0%) |
| 20 to 34 years | 0 (0.0%) | 0 (0.0%) |
| 35 to 50 years | 3 (100.0%) | 0 (0.0%) |
| Total | 3 (100.0%) | 0 (0.0%) |
Fertility by Education in New Johnsonville
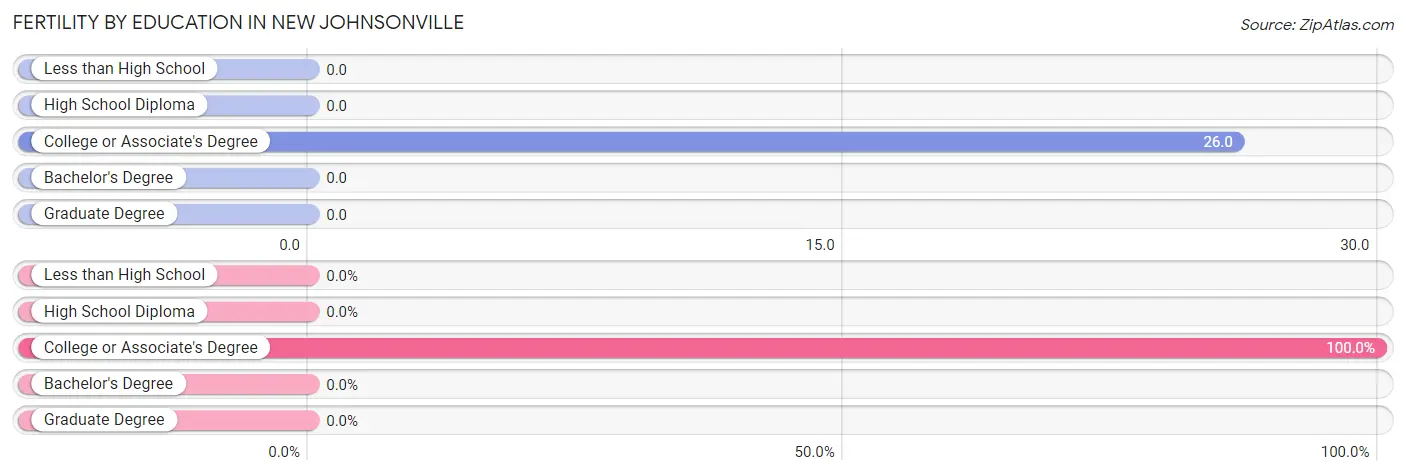
| Educational Attainment | Women with Births | Births / 1,000 Women |
| Less than High School | 0 (0.0%) | 0.0 |
| High School Diploma | 0 (0.0%) | 0.0 |
| College or Associate's Degree | 3 (100.0%) | 26.0 |
| Bachelor's Degree | 0 (0.0%) | 0.0 |
| Graduate Degree | 0 (0.0%) | 0.0 |
| Total | 3 (100.0%) | 8.0 |
Fertility by Education by Marriage Status in New Johnsonville
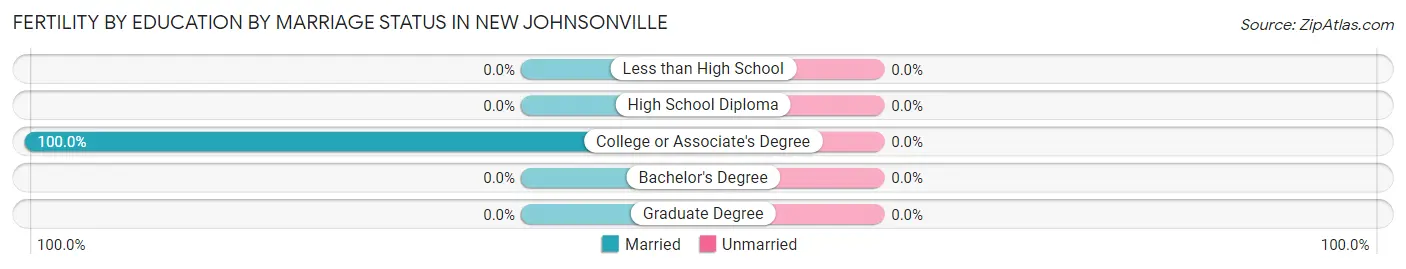
| Educational Attainment | Married | Unmarried |
| Less than High School | 0 (0.0%) | 0 (0.0%) |
| High School Diploma | 0 (0.0%) | 0 (0.0%) |
| College or Associate's Degree | 3 (100.0%) | 0 (0.0%) |
| Bachelor's Degree | 0 (0.0%) | 0 (0.0%) |
| Graduate Degree | 0 (0.0%) | 0 (0.0%) |
| Total | 3 (100.0%) | 0 (0.0%) |
Employment Characteristics in New Johnsonville
Employment by Class of Employer in New Johnsonville
Among the 838 employed individuals in New Johnsonville, private company employees (592 | 70.6%), local government employees (89 | 10.6%), and self-employed (not incorporated) (45 | 5.4%) make up the most common classes of employment.
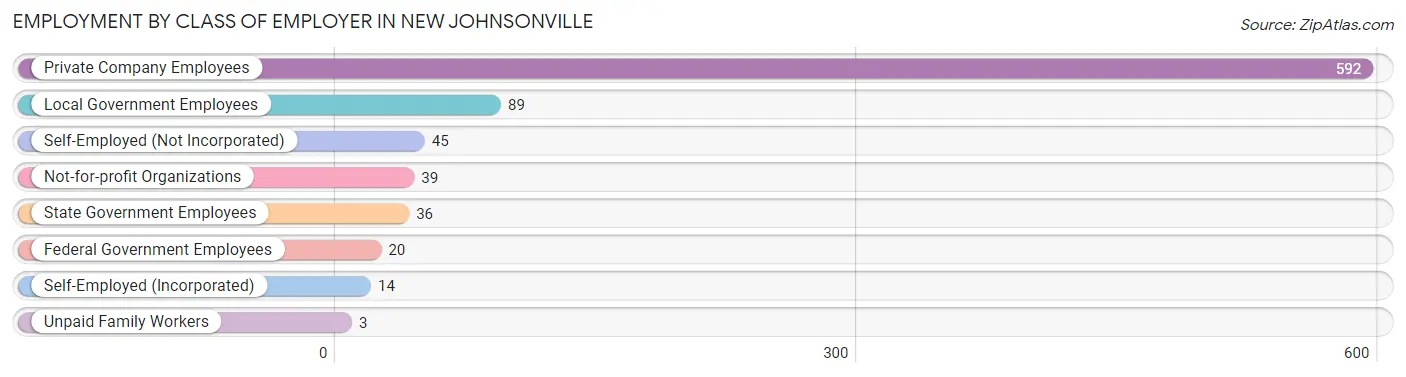
| Employer Class | # Employees | % Employees |
| Private Company Employees | 592 | 70.6% |
| Self-Employed (Incorporated) | 14 | 1.7% |
| Self-Employed (Not Incorporated) | 45 | 5.4% |
| Not-for-profit Organizations | 39 | 4.6% |
| Local Government Employees | 89 | 10.6% |
| State Government Employees | 36 | 4.3% |
| Federal Government Employees | 20 | 2.4% |
| Unpaid Family Workers | 3 | 0.4% |
| Total | 838 | 100.0% |
Employment Status by Age in New Johnsonville
According to the labor force statistics for New Johnsonville, out of the total population over 16 years of age (1,376), 64.0% or 881 individuals are in the labor force, with 2.3% or 20 of them unemployed. The age group with the highest labor force participation rate is 25 to 29 years, with 92.5% or 62 individuals in the labor force. Within the labor force, the 20 to 24 years age range has the highest percentage of unemployed individuals, with 9.6% or 12 of them being unemployed.
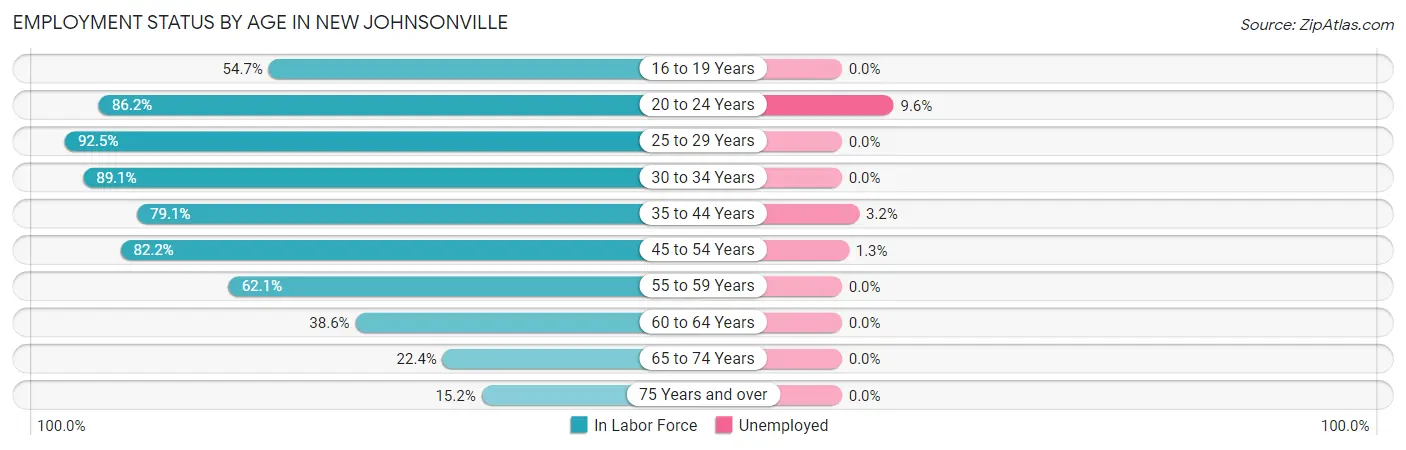
| Age Bracket | In Labor Force | Unemployed |
| 16 to 19 Years | 52 (54.7%) | 0 (0.0%) |
| 20 to 24 Years | 125 (86.2%) | 12 (9.6%) |
| 25 to 29 Years | 62 (92.5%) | 0 (0.0%) |
| 30 to 34 Years | 82 (89.1%) | 0 (0.0%) |
| 35 to 44 Years | 155 (79.1%) | 5 (3.2%) |
| 45 to 54 Years | 235 (82.2%) | 3 (1.3%) |
| 55 to 59 Years | 72 (62.1%) | 0 (0.0%) |
| 60 to 64 Years | 54 (38.6%) | 0 (0.0%) |
| 65 to 74 Years | 24 (22.4%) | 0 (0.0%) |
| 75 Years and over | 20 (15.2%) | 0 (0.0%) |
| Total | 881 (64.0%) | 20 (2.3%) |
Employment Status by Educational Attainment in New Johnsonville
According to labor force statistics for New Johnsonville, 73.6% of individuals (660) out of the total population between 25 and 64 years of age (897) are in the labor force, with 1.2% or 8 of them being unemployed. The group with the highest labor force participation rate are those with the educational attainment of bachelor's degree or higher, with 84.0% or 89 individuals in the labor force. Within the labor force, individuals with bachelor's degree or higher education have the highest percentage of unemployment, with 3.4% or 3 of them being unemployed.
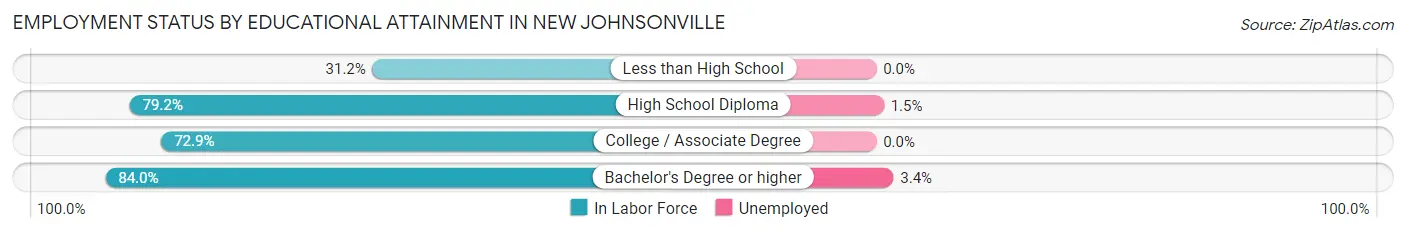
| Educational Attainment | In Labor Force | Unemployed |
| Less than High School | 24 (31.2%) | 0 (0.0%) |
| High School Diploma | 335 (79.2%) | 6 (1.5%) |
| College / Associate Degree | 212 (72.9%) | 0 (0.0%) |
| Bachelor's Degree or higher | 89 (84.0%) | 4 (3.4%) |
| Total | 660 (73.6%) | 11 (1.2%) |
Employment Occupations by Sex in New Johnsonville
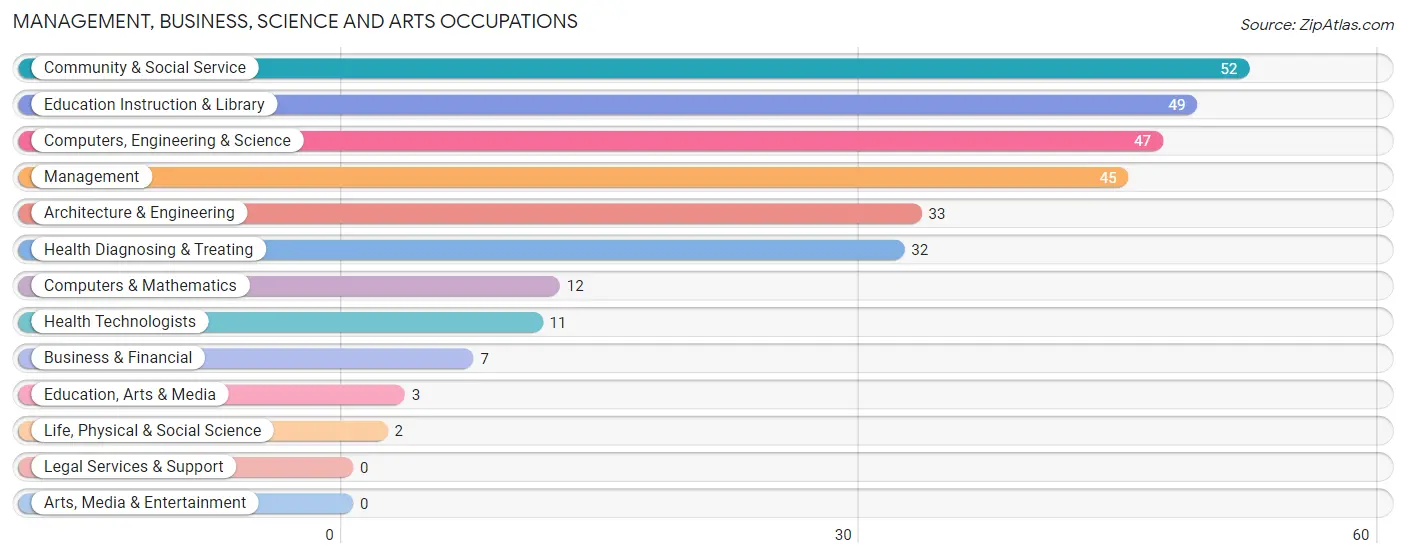
Management, Business, Science and Arts Occupations
The most common Management, Business, Science and Arts occupations in New Johnsonville are Community & Social Service (52 | 6.0%), Education Instruction & Library (49 | 5.7%), Computers, Engineering & Science (47 | 5.5%), Management (45 | 5.2%), and Architecture & Engineering (33 | 3.8%).
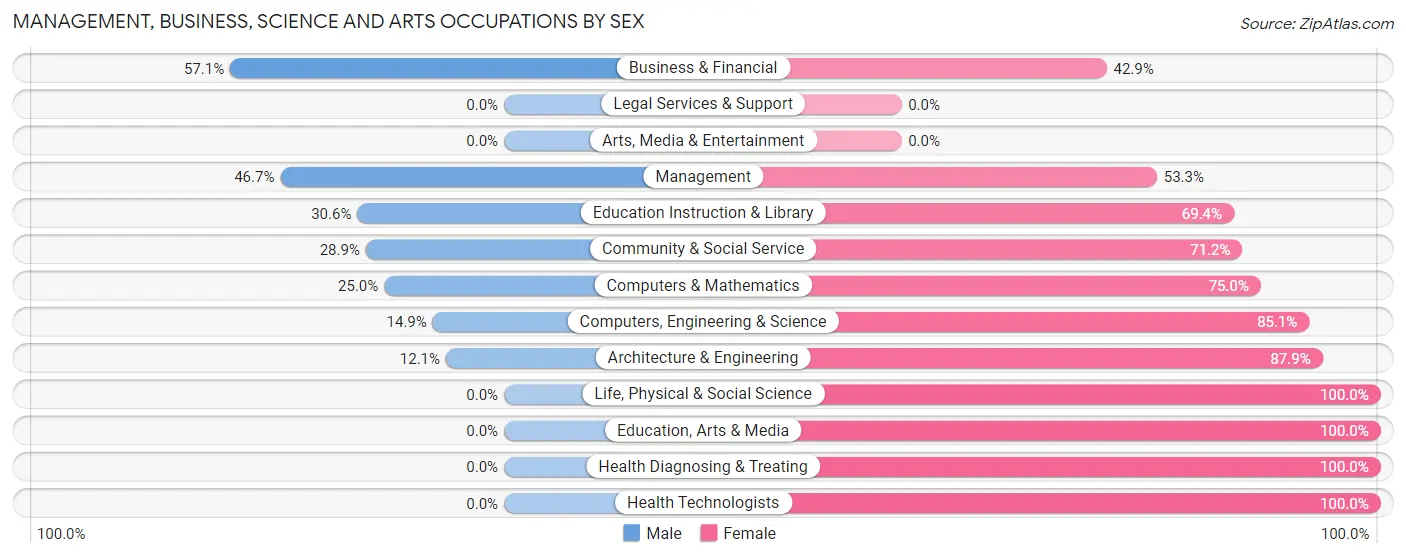
Management, Business, Science and Arts Occupations by Sex
Within the Management, Business, Science and Arts occupations in New Johnsonville, the most male-oriented occupations are Business & Financial (57.1%), Management (46.7%), and Education Instruction & Library (30.6%), while the most female-oriented occupations are Life, Physical & Social Science (100.0%), Education, Arts & Media (100.0%), and Health Diagnosing & Treating (100.0%).
| Occupation | Male | Female |
| Management | 21 (46.7%) | 24 (53.3%) |
| Business & Financial | 4 (57.1%) | 3 (42.9%) |
| Computers, Engineering & Science | 7 (14.9%) | 40 (85.1%) |
| Computers & Mathematics | 3 (25.0%) | 9 (75.0%) |
| Architecture & Engineering | 4 (12.1%) | 29 (87.9%) |
| Life, Physical & Social Science | 0 (0.0%) | 2 (100.0%) |
| Community & Social Service | 15 (28.8%) | 37 (71.2%) |
| Education, Arts & Media | 0 (0.0%) | 3 (100.0%) |
| Legal Services & Support | 0 (0.0%) | 0 (0.0%) |
| Education Instruction & Library | 15 (30.6%) | 34 (69.4%) |
| Arts, Media & Entertainment | 0 (0.0%) | 0 (0.0%) |
| Health Diagnosing & Treating | 0 (0.0%) | 32 (100.0%) |
| Health Technologists | 0 (0.0%) | 11 (100.0%) |
| Total (Category) | 47 (25.7%) | 136 (74.3%) |
| Total (Overall) | 470 (54.6%) | 391 (45.4%) |
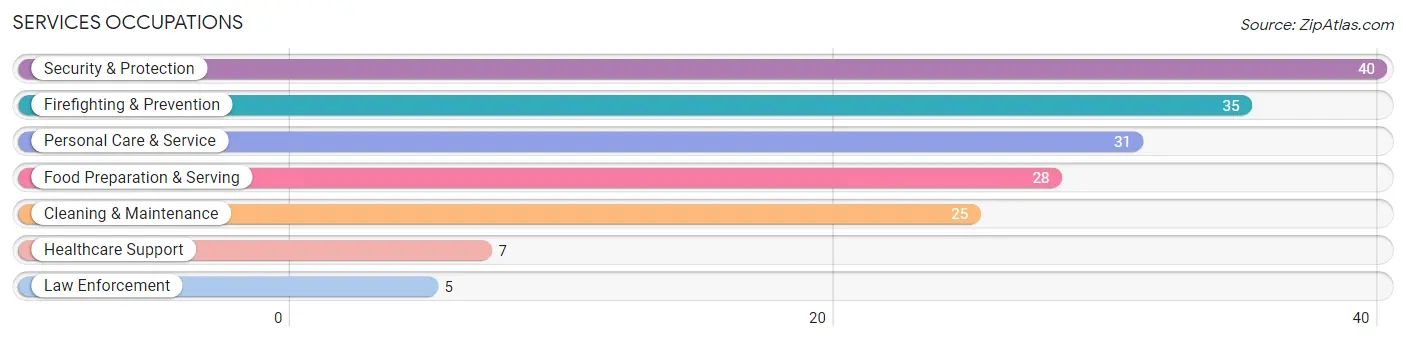
Services Occupations
The most common Services occupations in New Johnsonville are Security & Protection (40 | 4.6%), Firefighting & Prevention (35 | 4.1%), Personal Care & Service (31 | 3.6%), Food Preparation & Serving (28 | 3.3%), and Cleaning & Maintenance (25 | 2.9%).
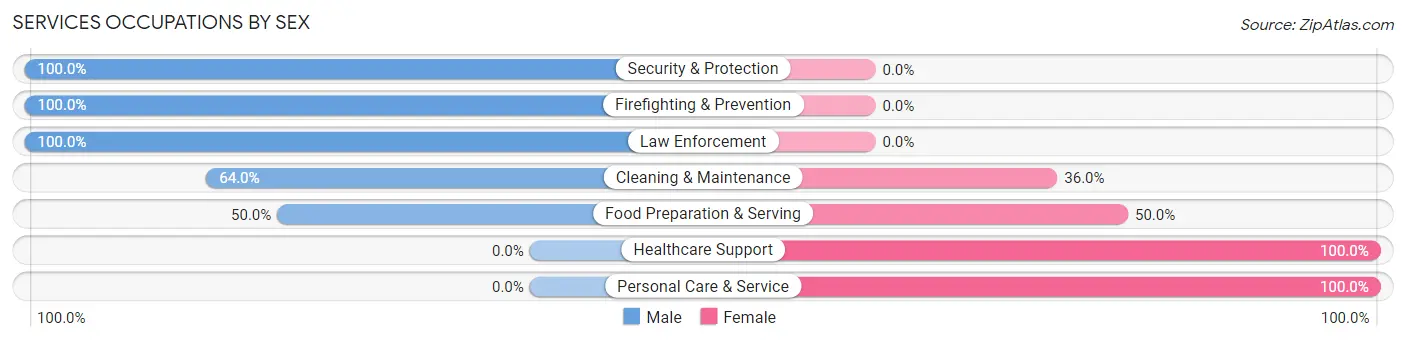
Services Occupations by Sex
Within the Services occupations in New Johnsonville, the most male-oriented occupations are Security & Protection (100.0%), Firefighting & Prevention (100.0%), and Law Enforcement (100.0%), while the most female-oriented occupations are Healthcare Support (100.0%), Personal Care & Service (100.0%), and Food Preparation & Serving (50.0%).
| Occupation | Male | Female |
| Healthcare Support | 0 (0.0%) | 7 (100.0%) |
| Security & Protection | 40 (100.0%) | 0 (0.0%) |
| Firefighting & Prevention | 35 (100.0%) | 0 (0.0%) |
| Law Enforcement | 5 (100.0%) | 0 (0.0%) |
| Food Preparation & Serving | 14 (50.0%) | 14 (50.0%) |
| Cleaning & Maintenance | 16 (64.0%) | 9 (36.0%) |
| Personal Care & Service | 0 (0.0%) | 31 (100.0%) |
| Total (Category) | 70 (53.4%) | 61 (46.6%) |
| Total (Overall) | 470 (54.6%) | 391 (45.4%) |
Sales and Office Occupations
The most common Sales and Office occupations in New Johnsonville are Office & Administration (116 | 13.5%), and Sales & Related (81 | 9.4%).

Sales and Office Occupations by Sex
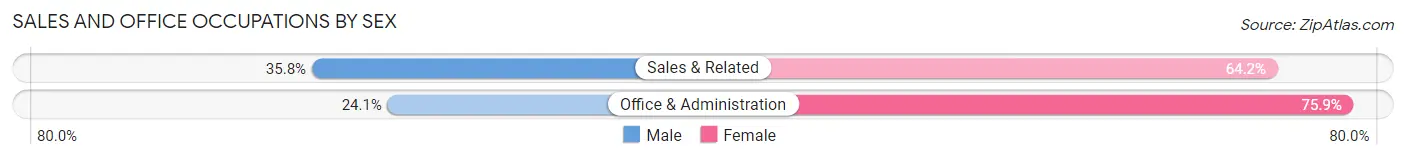
| Occupation | Male | Female |
| Sales & Related | 29 (35.8%) | 52 (64.2%) |
| Office & Administration | 28 (24.1%) | 88 (75.9%) |
| Total (Category) | 57 (28.9%) | 140 (71.1%) |
| Total (Overall) | 470 (54.6%) | 391 (45.4%) |
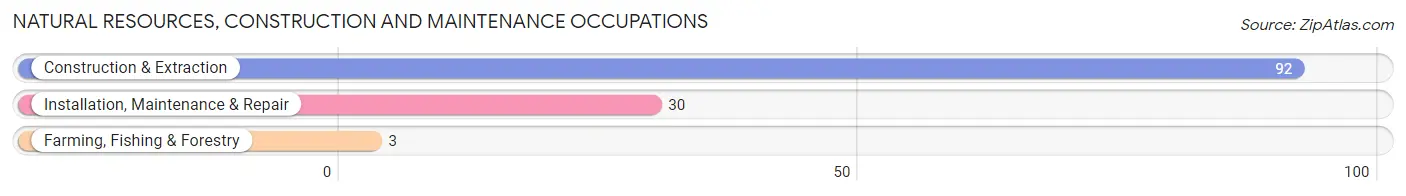
Natural Resources, Construction and Maintenance Occupations
The most common Natural Resources, Construction and Maintenance occupations in New Johnsonville are Construction & Extraction (92 | 10.7%), Installation, Maintenance & Repair (30 | 3.5%), and Farming, Fishing & Forestry (3 | 0.4%).
Natural Resources, Construction and Maintenance Occupations by Sex
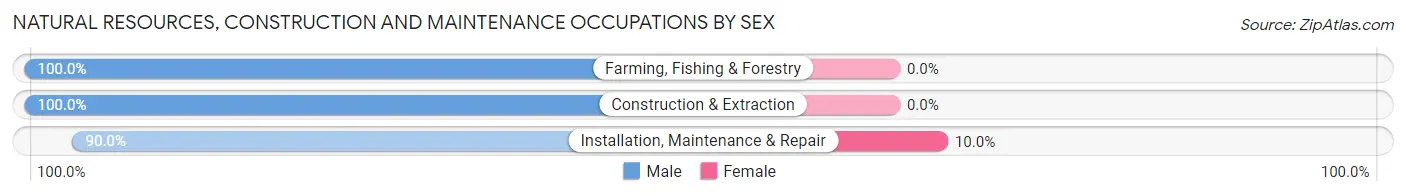
| Occupation | Male | Female |
| Farming, Fishing & Forestry | 3 (100.0%) | 0 (0.0%) |
| Construction & Extraction | 92 (100.0%) | 0 (0.0%) |
| Installation, Maintenance & Repair | 27 (90.0%) | 3 (10.0%) |
| Total (Category) | 122 (97.6%) | 3 (2.4%) |
| Total (Overall) | 470 (54.6%) | 391 (45.4%) |
Production, Transportation and Moving Occupations
The most common Production, Transportation and Moving occupations in New Johnsonville are Production (133 | 15.4%), Material Moving (49 | 5.7%), and Transportation (43 | 5.0%).
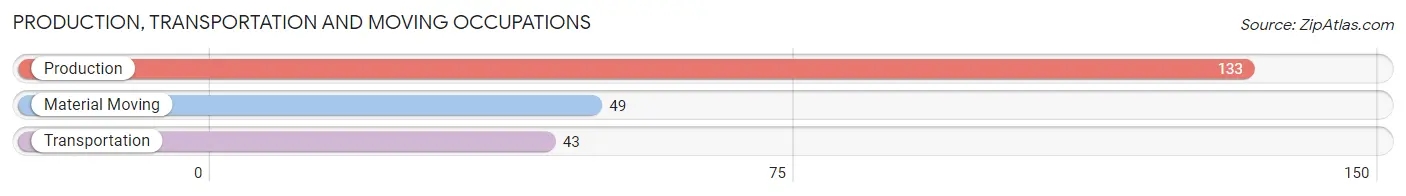
Production, Transportation and Moving Occupations by Sex
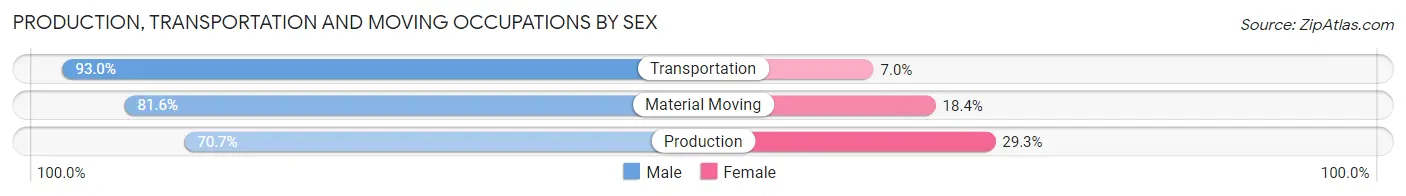
| Occupation | Male | Female |
| Production | 94 (70.7%) | 39 (29.3%) |
| Transportation | 40 (93.0%) | 3 (7.0%) |
| Material Moving | 40 (81.6%) | 9 (18.4%) |
| Total (Category) | 174 (77.3%) | 51 (22.7%) |
| Total (Overall) | 470 (54.6%) | 391 (45.4%) |
Employment Industries by Sex in New Johnsonville
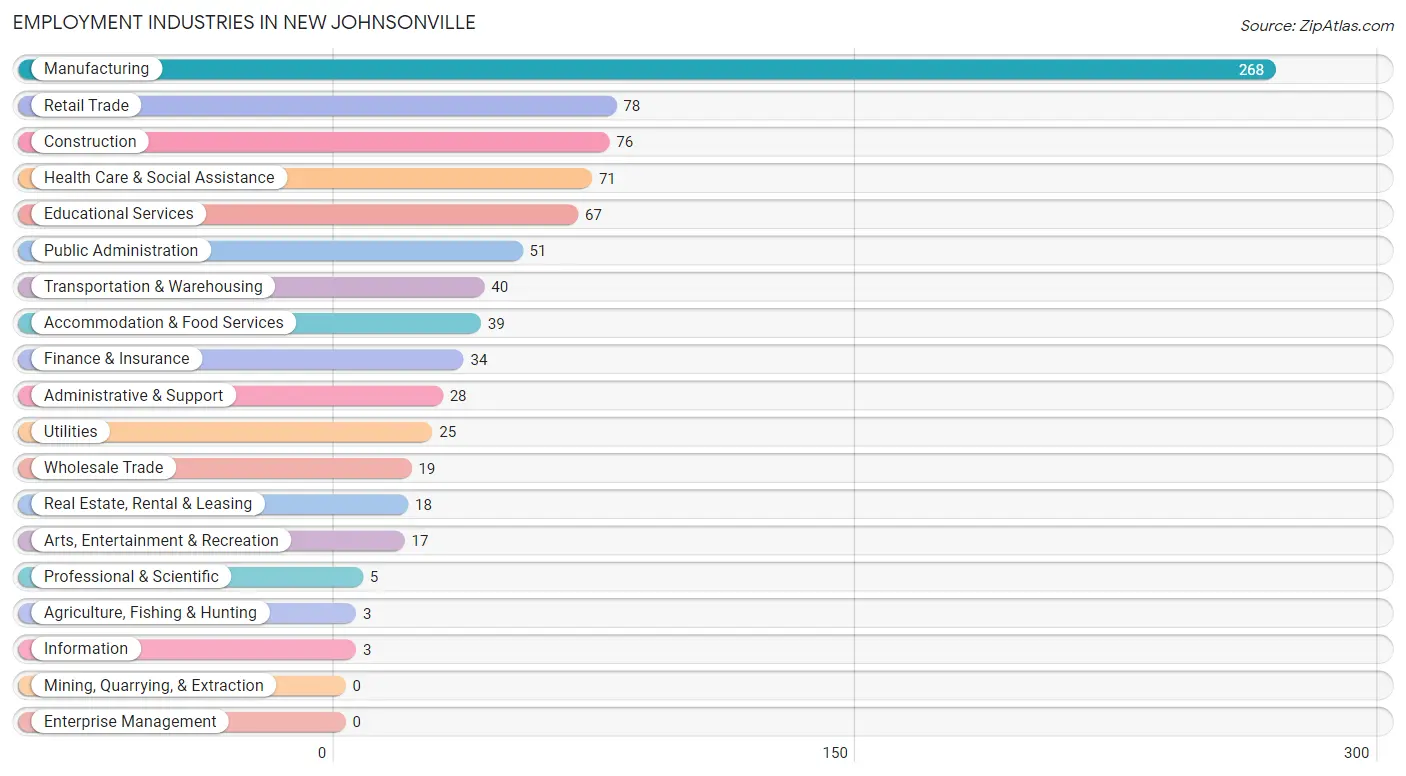
Employment Industries in New Johnsonville
The major employment industries in New Johnsonville include Manufacturing (268 | 31.1%), Retail Trade (78 | 9.1%), Construction (76 | 8.8%), Health Care & Social Assistance (71 | 8.3%), and Educational Services (67 | 7.8%).
Employment Industries by Sex in New Johnsonville
The New Johnsonville industries that see more men than women are Agriculture, Fishing & Hunting (100.0%), Information (100.0%), and Construction (97.4%), whereas the industries that tend to have a higher number of women are Professional & Scientific (100.0%), Health Care & Social Assistance (93.0%), and Real Estate, Rental & Leasing (88.9%).
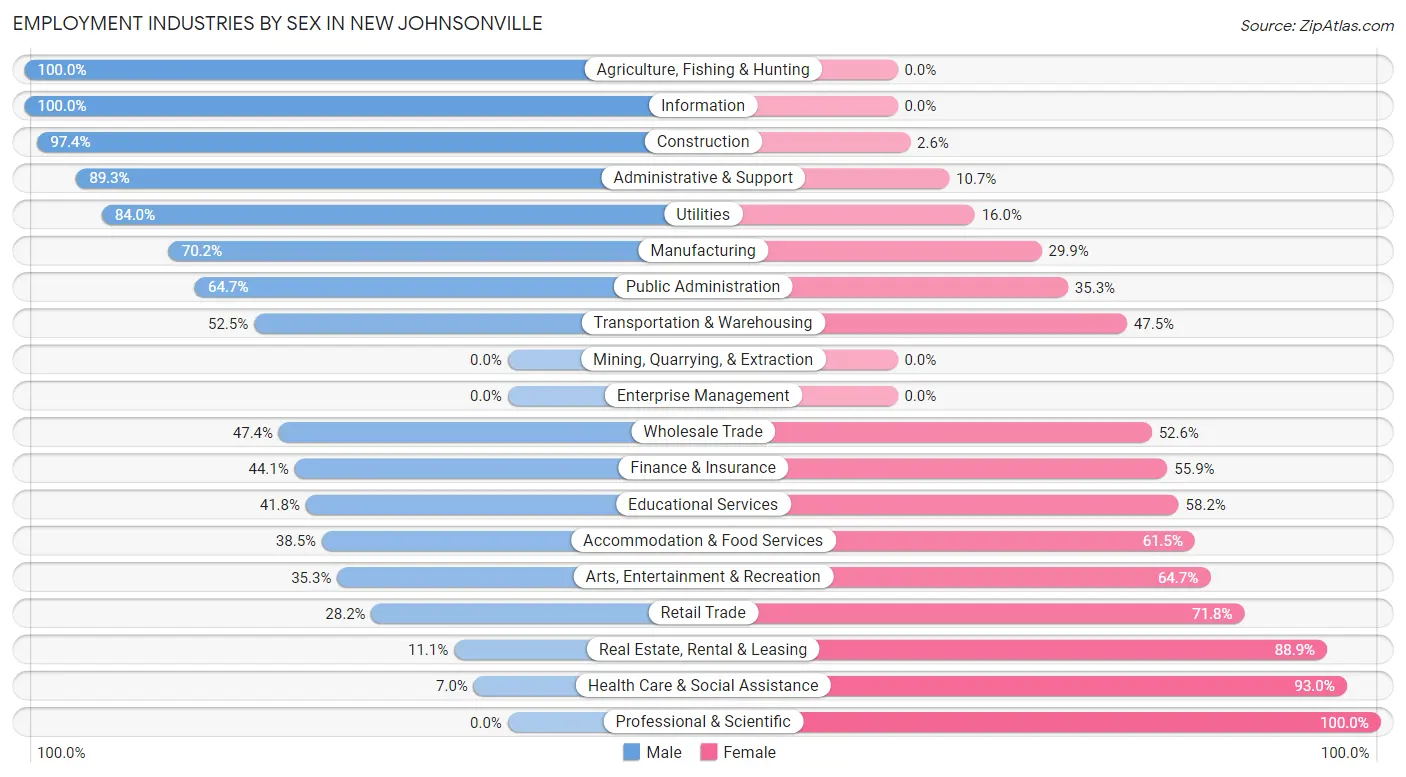
| Industry | Male | Female |
| Agriculture, Fishing & Hunting | 3 (100.0%) | 0 (0.0%) |
| Mining, Quarrying, & Extraction | 0 (0.0%) | 0 (0.0%) |
| Construction | 74 (97.4%) | 2 (2.6%) |
| Manufacturing | 188 (70.2%) | 80 (29.8%) |
| Wholesale Trade | 9 (47.4%) | 10 (52.6%) |
| Retail Trade | 22 (28.2%) | 56 (71.8%) |
| Transportation & Warehousing | 21 (52.5%) | 19 (47.5%) |
| Utilities | 21 (84.0%) | 4 (16.0%) |
| Information | 3 (100.0%) | 0 (0.0%) |
| Finance & Insurance | 15 (44.1%) | 19 (55.9%) |
| Real Estate, Rental & Leasing | 2 (11.1%) | 16 (88.9%) |
| Professional & Scientific | 0 (0.0%) | 5 (100.0%) |
| Enterprise Management | 0 (0.0%) | 0 (0.0%) |
| Administrative & Support | 25 (89.3%) | 3 (10.7%) |
| Educational Services | 28 (41.8%) | 39 (58.2%) |
| Health Care & Social Assistance | 5 (7.0%) | 66 (93.0%) |
| Arts, Entertainment & Recreation | 6 (35.3%) | 11 (64.7%) |
| Accommodation & Food Services | 15 (38.5%) | 24 (61.5%) |
| Public Administration | 33 (64.7%) | 18 (35.3%) |
| Total | 470 (54.6%) | 391 (45.4%) |
Education in New Johnsonville
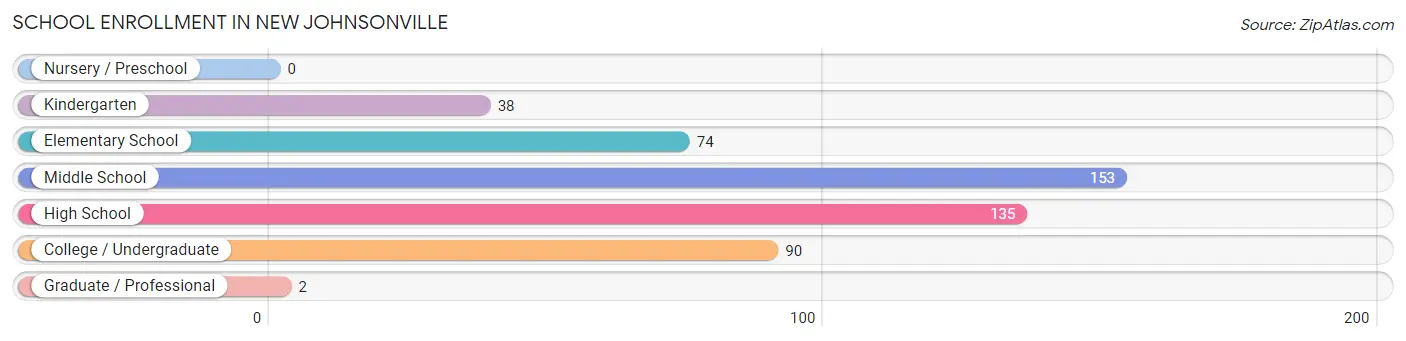
School Enrollment in New Johnsonville
The most common levels of schooling among the 492 students in New Johnsonville are middle school (153 | 31.1%), high school (135 | 27.4%), and college / undergraduate (90 | 18.3%).
| School Level | # Students | % Students |
| Nursery / Preschool | 0 | 0.0% |
| Kindergarten | 38 | 7.7% |
| Elementary School | 74 | 15.0% |
| Middle School | 153 | 31.1% |
| High School | 135 | 27.4% |
| College / Undergraduate | 90 | 18.3% |
| Graduate / Professional | 2 | 0.4% |
| Total | 492 | 100.0% |
School Enrollment by Age by Funding Source in New Johnsonville
Out of a total of 492 students who are enrolled in schools in New Johnsonville, 6 (1.2%) attend a private institution, while the remaining 486 (98.8%) are enrolled in public schools. The age group of 10 to 14 year olds has the highest likelihood of being enrolled in private schools, with 6 (3.0% in the age bracket) enrolled. Conversely, the age group of 5 to 9 year old has the lowest likelihood of being enrolled in a private school, with 103 (100.0% in the age bracket) attending a public institution.
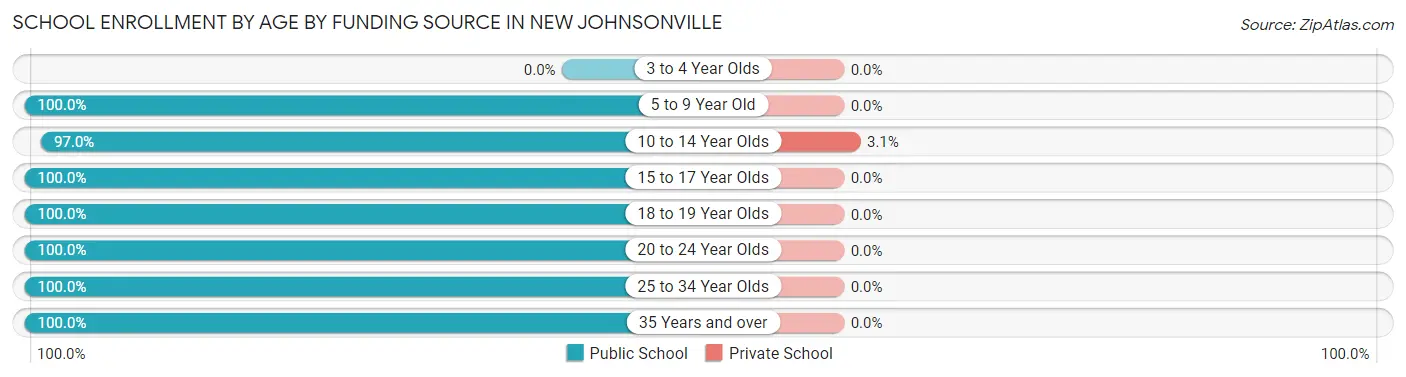
| Age Bracket | Public School | Private School |
| 3 to 4 Year Olds | 0 (0.0%) | 0 (0.0%) |
| 5 to 9 Year Old | 103 (100.0%) | 0 (0.0%) |
| 10 to 14 Year Olds | 191 (97.0%) | 6 (3.0%) |
| 15 to 17 Year Olds | 83 (100.0%) | 0 (0.0%) |
| 18 to 19 Year Olds | 17 (100.0%) | 0 (0.0%) |
| 20 to 24 Year Olds | 42 (100.0%) | 0 (0.0%) |
| 25 to 34 Year Olds | 6 (100.0%) | 0 (0.0%) |
| 35 Years and over | 44 (100.0%) | 0 (0.0%) |
| Total | 486 (98.8%) | 6 (1.2%) |
Educational Attainment by Field of Study in New Johnsonville
Business (29 | 21.0%), education (28 | 20.3%), science & technology (27 | 19.6%), literature & languages (10 | 7.2%), and communications (9 | 6.5%) are the most common fields of study among 138 individuals in New Johnsonville who have obtained a bachelor's degree or higher.
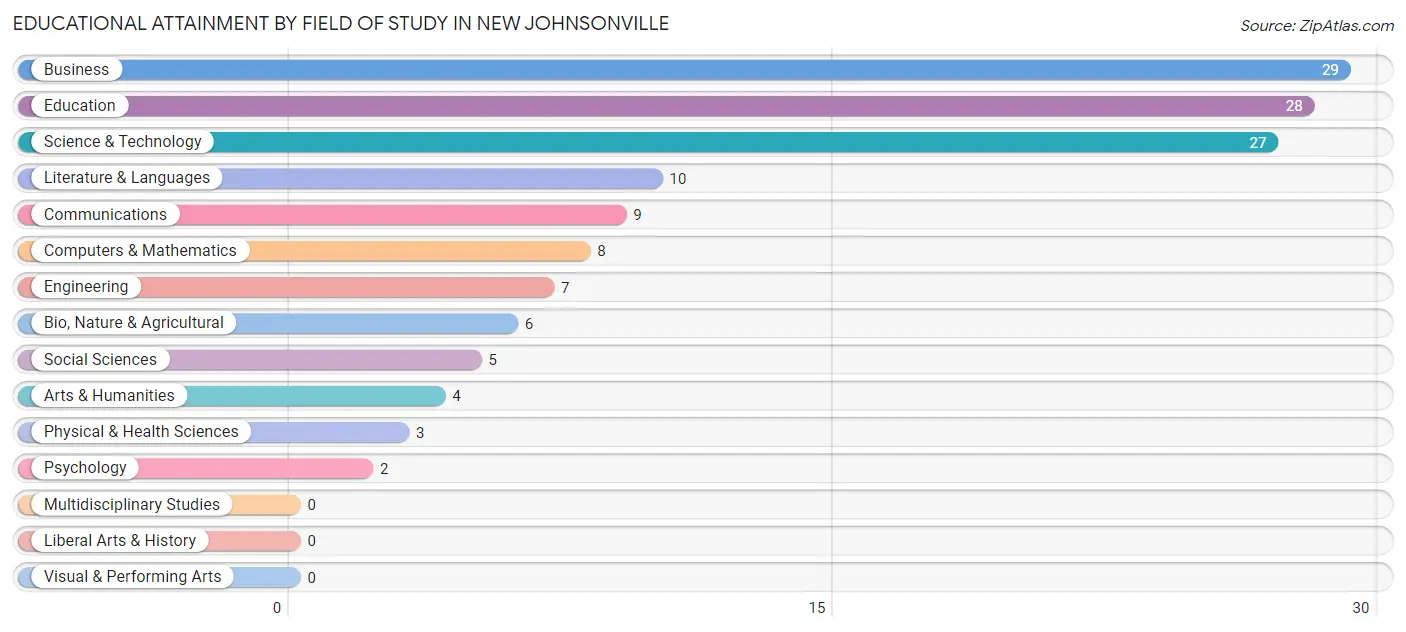
| Field of Study | # Graduates | % Graduates |
| Computers & Mathematics | 8 | 5.8% |
| Bio, Nature & Agricultural | 6 | 4.3% |
| Physical & Health Sciences | 3 | 2.2% |
| Psychology | 2 | 1.5% |
| Social Sciences | 5 | 3.6% |
| Engineering | 7 | 5.1% |
| Multidisciplinary Studies | 0 | 0.0% |
| Science & Technology | 27 | 19.6% |
| Business | 29 | 21.0% |
| Education | 28 | 20.3% |
| Literature & Languages | 10 | 7.2% |
| Liberal Arts & History | 0 | 0.0% |
| Visual & Performing Arts | 0 | 0.0% |
| Communications | 9 | 6.5% |
| Arts & Humanities | 4 | 2.9% |
| Total | 138 | 100.0% |
Transportation & Commute in New Johnsonville
Vehicle Availability by Sex in New Johnsonville
The most prevalent vehicle ownership categories in New Johnsonville are males with 3 vehicles (173, accounting for 38.4%) and females with 3 vehicles (133, making up 44.6%).
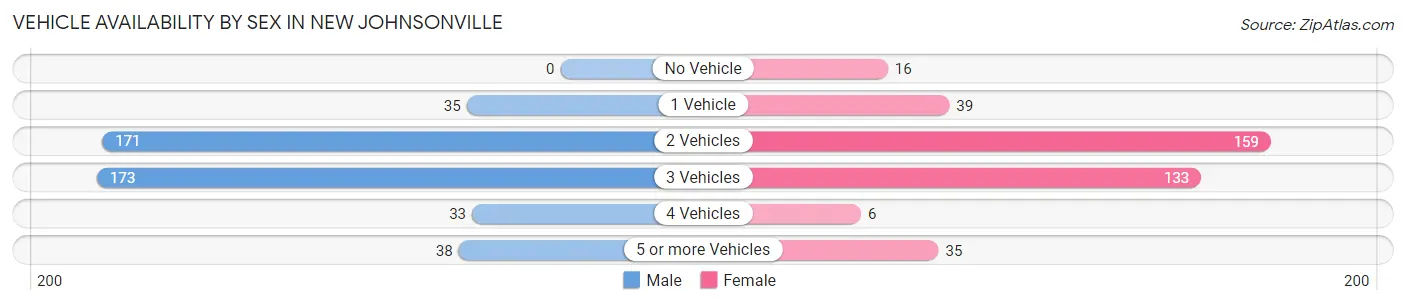
| Vehicles Available | Male | Female |
| No Vehicle | 0 (0.0%) | 16 (4.1%) |
| 1 Vehicle | 35 (7.8%) | 39 (10.1%) |
| 2 Vehicles | 171 (38.0%) | 159 (41.0%) |
| 3 Vehicles | 173 (38.4%) | 133 (34.3%) |
| 4 Vehicles | 33 (7.3%) | 6 (1.5%) |
| 5 or more Vehicles | 38 (8.4%) | 35 (9.0%) |
| Total | 450 (100.0%) | 388 (100.0%) |
Commute Time in New Johnsonville
The most frequently occuring commute durations in New Johnsonville are 5 to 9 minutes (238 commuters, 29.4%), 10 to 14 minutes (137 commuters, 16.9%), and 15 to 19 minutes (123 commuters, 15.2%).
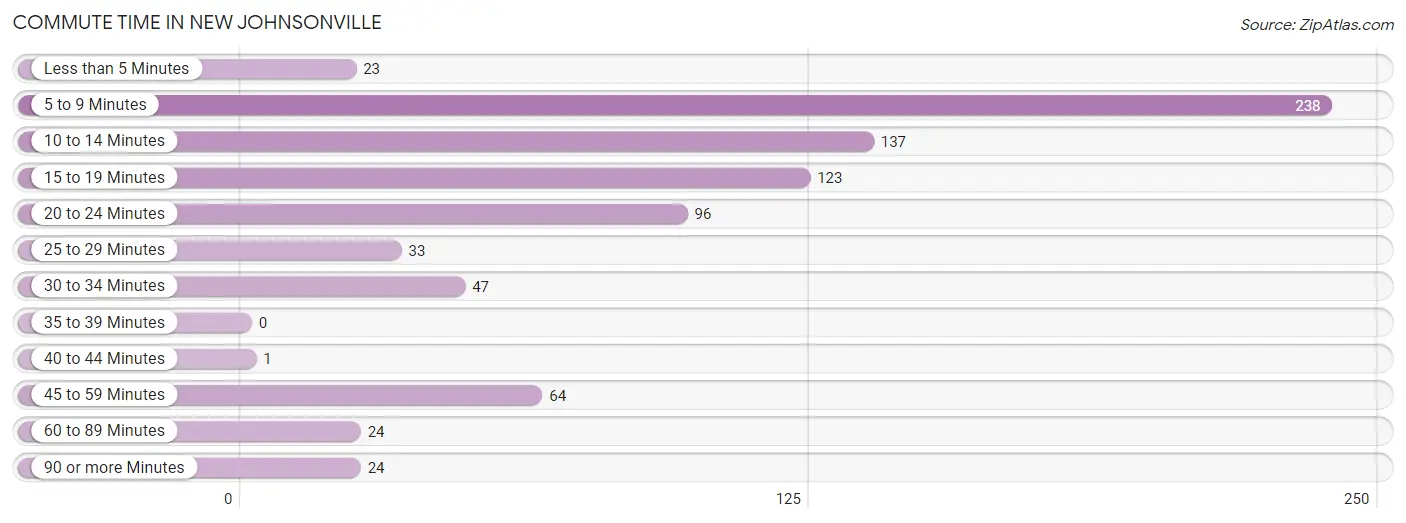
| Commute Time | # Commuters | % Commuters |
| Less than 5 Minutes | 23 | 2.8% |
| 5 to 9 Minutes | 238 | 29.4% |
| 10 to 14 Minutes | 137 | 16.9% |
| 15 to 19 Minutes | 123 | 15.2% |
| 20 to 24 Minutes | 96 | 11.8% |
| 25 to 29 Minutes | 33 | 4.1% |
| 30 to 34 Minutes | 47 | 5.8% |
| 35 to 39 Minutes | 0 | 0.0% |
| 40 to 44 Minutes | 1 | 0.1% |
| 45 to 59 Minutes | 64 | 7.9% |
| 60 to 89 Minutes | 24 | 3.0% |
| 90 or more Minutes | 24 | 3.0% |
Commute Time by Sex in New Johnsonville
The most common commute times in New Johnsonville are 5 to 9 minutes (141 commuters, 32.6%) for males and 5 to 9 minutes (97 commuters, 25.7%) for females.
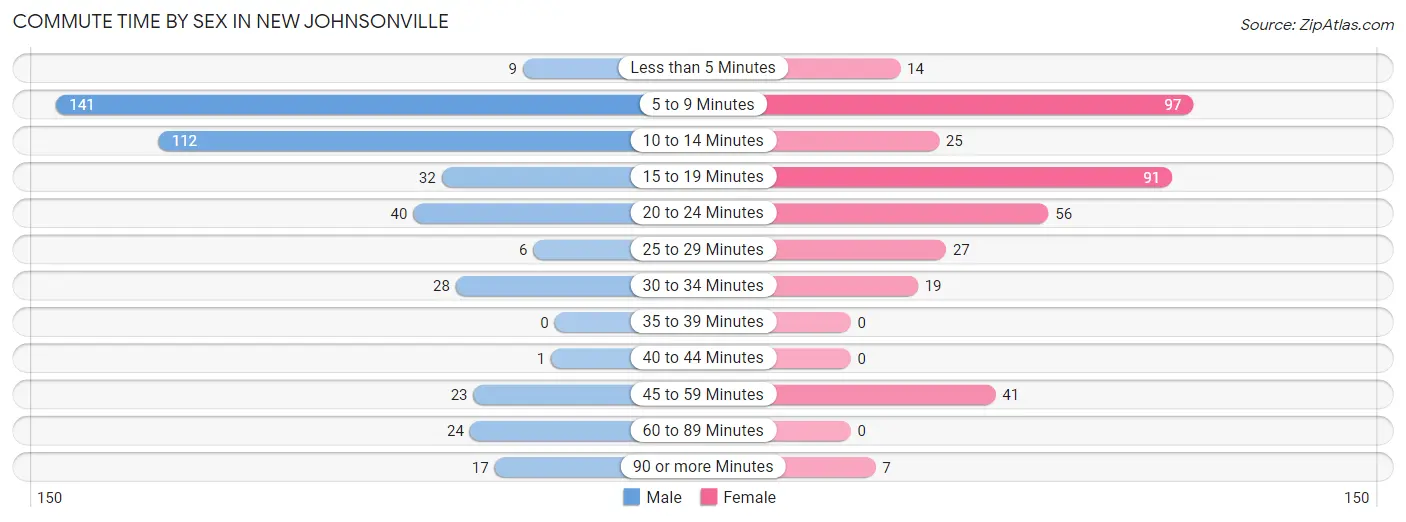
| Commute Time | Male | Female |
| Less than 5 Minutes | 9 (2.1%) | 14 (3.7%) |
| 5 to 9 Minutes | 141 (32.6%) | 97 (25.7%) |
| 10 to 14 Minutes | 112 (25.9%) | 25 (6.6%) |
| 15 to 19 Minutes | 32 (7.4%) | 91 (24.1%) |
| 20 to 24 Minutes | 40 (9.2%) | 56 (14.8%) |
| 25 to 29 Minutes | 6 (1.4%) | 27 (7.2%) |
| 30 to 34 Minutes | 28 (6.5%) | 19 (5.0%) |
| 35 to 39 Minutes | 0 (0.0%) | 0 (0.0%) |
| 40 to 44 Minutes | 1 (0.2%) | 0 (0.0%) |
| 45 to 59 Minutes | 23 (5.3%) | 41 (10.9%) |
| 60 to 89 Minutes | 24 (5.5%) | 0 (0.0%) |
| 90 or more Minutes | 17 (3.9%) | 7 (1.9%) |
Time of Departure to Work by Sex in New Johnsonville
The most frequent times of departure to work in New Johnsonville are 12:00 AM to 4:59 AM (80, 18.5%) for males and 7:00 AM to 7:29 AM (110, 29.2%) for females.
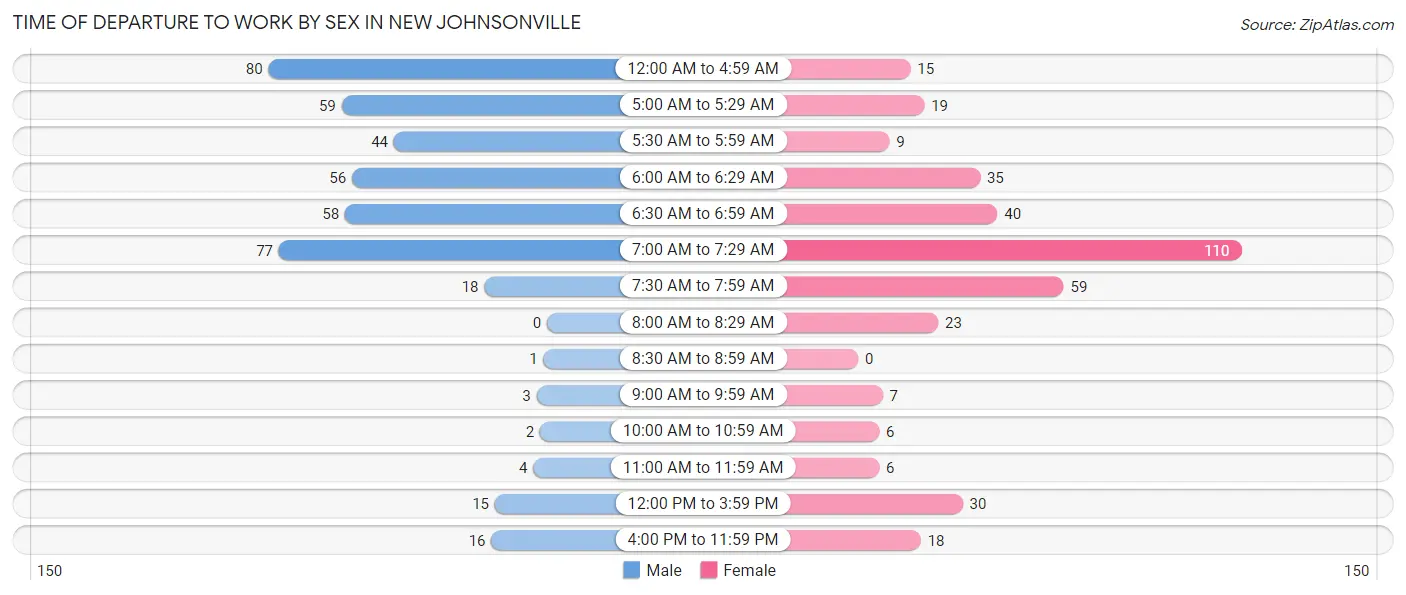
| Time of Departure | Male | Female |
| 12:00 AM to 4:59 AM | 80 (18.5%) | 15 (4.0%) |
| 5:00 AM to 5:29 AM | 59 (13.6%) | 19 (5.0%) |
| 5:30 AM to 5:59 AM | 44 (10.2%) | 9 (2.4%) |
| 6:00 AM to 6:29 AM | 56 (12.9%) | 35 (9.3%) |
| 6:30 AM to 6:59 AM | 58 (13.4%) | 40 (10.6%) |
| 7:00 AM to 7:29 AM | 77 (17.8%) | 110 (29.2%) |
| 7:30 AM to 7:59 AM | 18 (4.2%) | 59 (15.7%) |
| 8:00 AM to 8:29 AM | 0 (0.0%) | 23 (6.1%) |
| 8:30 AM to 8:59 AM | 1 (0.2%) | 0 (0.0%) |
| 9:00 AM to 9:59 AM | 3 (0.7%) | 7 (1.9%) |
| 10:00 AM to 10:59 AM | 2 (0.5%) | 6 (1.6%) |
| 11:00 AM to 11:59 AM | 4 (0.9%) | 6 (1.6%) |
| 12:00 PM to 3:59 PM | 15 (3.5%) | 30 (8.0%) |
| 4:00 PM to 11:59 PM | 16 (3.7%) | 18 (4.8%) |
| Total | 433 (100.0%) | 377 (100.0%) |
Housing Occupancy in New Johnsonville
Occupancy by Ownership in New Johnsonville
Of the total 626 dwellings in New Johnsonville, owner-occupied units account for 518 (82.8%), while renter-occupied units make up 108 (17.2%).
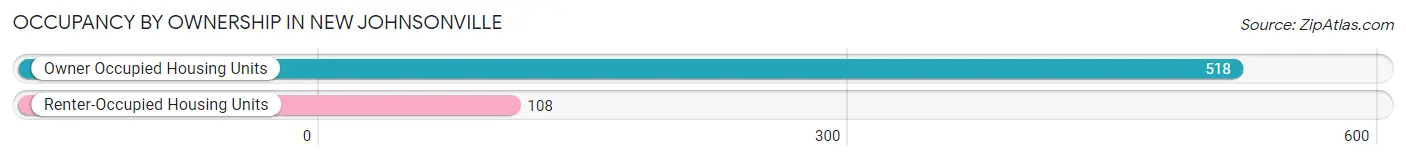
| Occupancy | # Housing Units | % Housing Units |
| Owner Occupied Housing Units | 518 | 82.8% |
| Renter-Occupied Housing Units | 108 | 17.2% |
| Total Occupied Housing Units | 626 | 100.0% |
Occupancy by Household Size in New Johnsonville
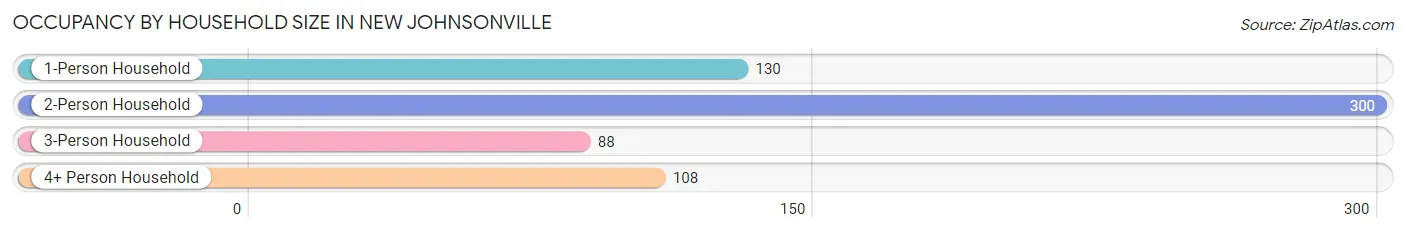
| Household Size | # Housing Units | % Housing Units |
| 1-Person Household | 130 | 20.8% |
| 2-Person Household | 300 | 47.9% |
| 3-Person Household | 88 | 14.1% |
| 4+ Person Household | 108 | 17.2% |
| Total Housing Units | 626 | 100.0% |
Occupancy by Ownership by Household Size in New Johnsonville
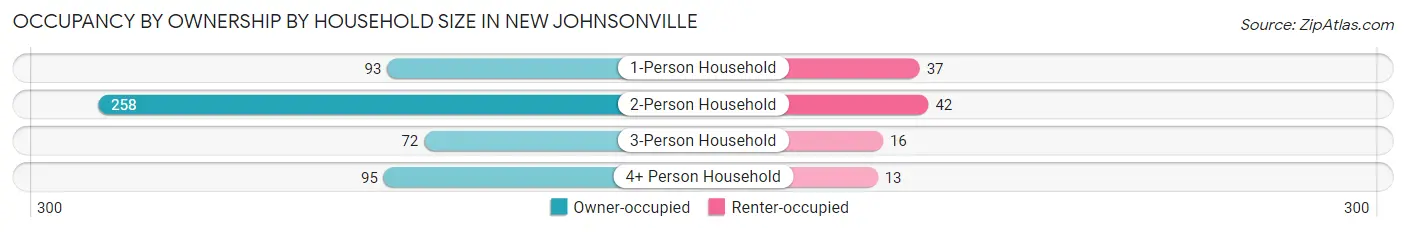
| Household Size | Owner-occupied | Renter-occupied |
| 1-Person Household | 93 (71.5%) | 37 (28.5%) |
| 2-Person Household | 258 (86.0%) | 42 (14.0%) |
| 3-Person Household | 72 (81.8%) | 16 (18.2%) |
| 4+ Person Household | 95 (88.0%) | 13 (12.0%) |
| Total Housing Units | 518 (82.8%) | 108 (17.2%) |
Occupancy by Educational Attainment in New Johnsonville
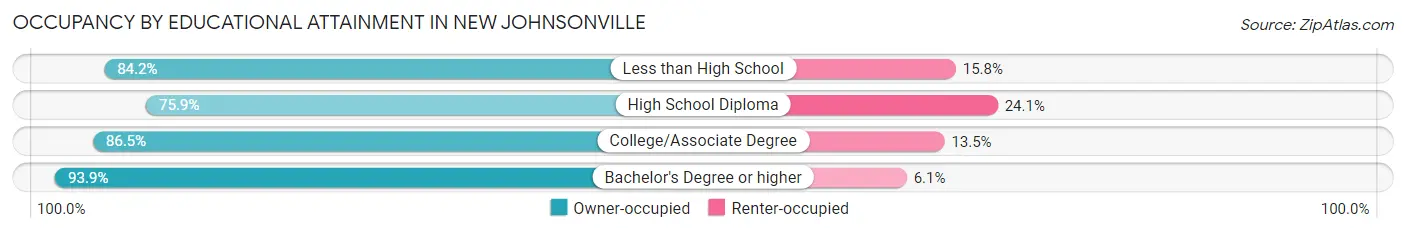
| Household Size | Owner-occupied | Renter-occupied |
| Less than High School | 48 (84.2%) | 9 (15.8%) |
| High School Diploma | 211 (75.9%) | 67 (24.1%) |
| College/Associate Degree | 166 (86.5%) | 26 (13.5%) |
| Bachelor's Degree or higher | 93 (93.9%) | 6 (6.1%) |
Occupancy by Age of Householder in New Johnsonville
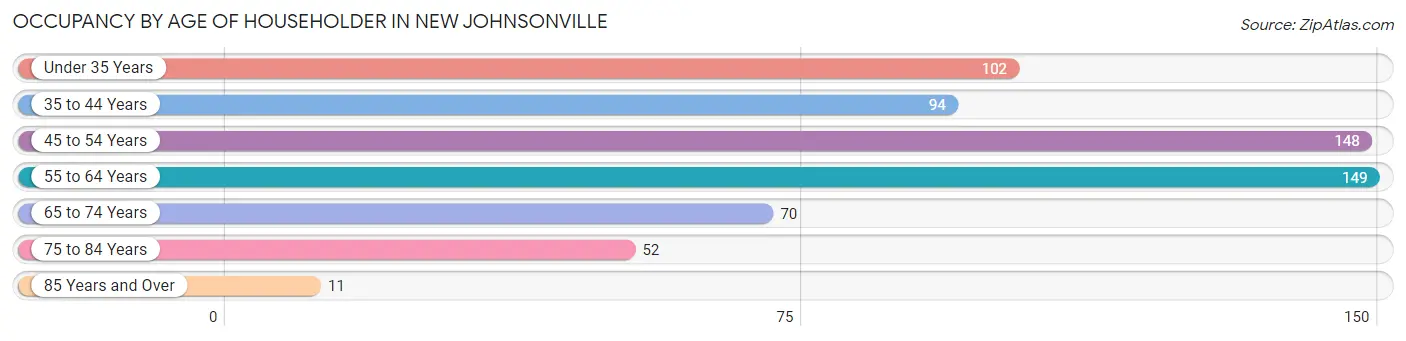
| Age Bracket | # Households | % Households |
| Under 35 Years | 102 | 16.3% |
| 35 to 44 Years | 94 | 15.0% |
| 45 to 54 Years | 148 | 23.6% |
| 55 to 64 Years | 149 | 23.8% |
| 65 to 74 Years | 70 | 11.2% |
| 75 to 84 Years | 52 | 8.3% |
| 85 Years and Over | 11 | 1.8% |
| Total | 626 | 100.0% |
Housing Finances in New Johnsonville
Median Income by Occupancy in New Johnsonville
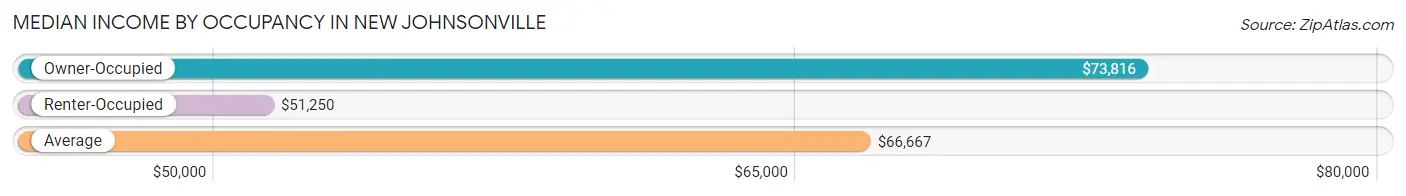
| Occupancy Type | # Households | Median Income |
| Owner-Occupied | 518 (82.8%) | $73,816 |
| Renter-Occupied | 108 (17.2%) | $51,250 |
| Average | 626 (100.0%) | $66,667 |
Occupancy by Householder Income Bracket in New Johnsonville
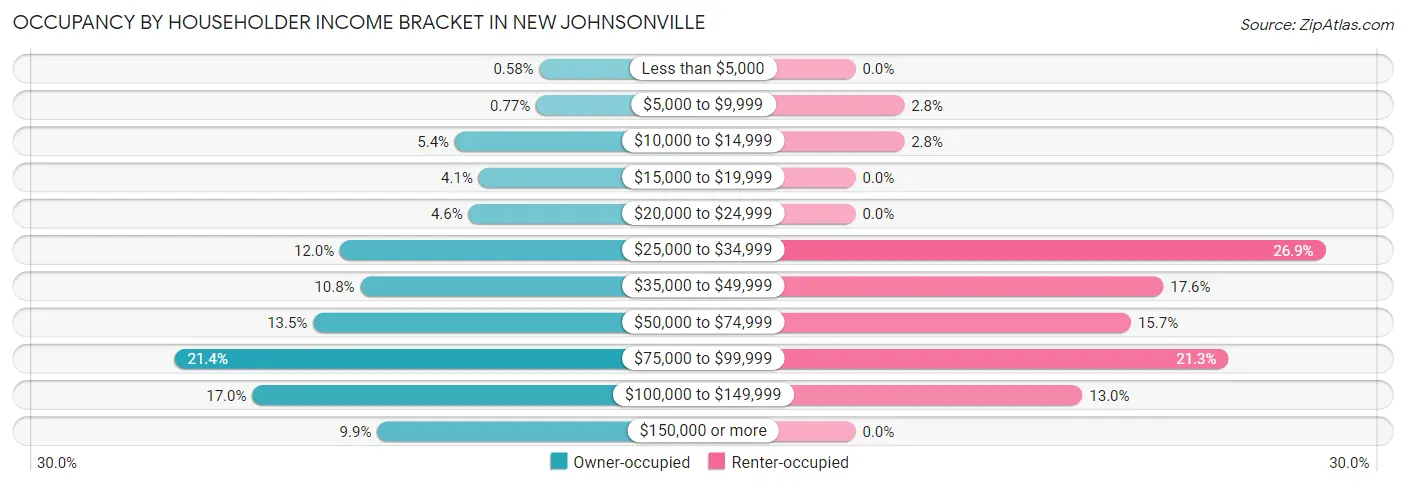
| Income Bracket | Owner-occupied | Renter-occupied |
| Less than $5,000 | 3 (0.6%) | 0 (0.0%) |
| $5,000 to $9,999 | 4 (0.8%) | 3 (2.8%) |
| $10,000 to $14,999 | 28 (5.4%) | 3 (2.8%) |
| $15,000 to $19,999 | 21 (4.1%) | 0 (0.0%) |
| $20,000 to $24,999 | 24 (4.6%) | 0 (0.0%) |
| $25,000 to $34,999 | 62 (12.0%) | 29 (26.9%) |
| $35,000 to $49,999 | 56 (10.8%) | 19 (17.6%) |
| $50,000 to $74,999 | 70 (13.5%) | 17 (15.7%) |
| $75,000 to $99,999 | 111 (21.4%) | 23 (21.3%) |
| $100,000 to $149,999 | 88 (17.0%) | 14 (13.0%) |
| $150,000 or more | 51 (9.9%) | 0 (0.0%) |
| Total | 518 (100.0%) | 108 (100.0%) |
Monthly Housing Cost Tiers in New Johnsonville
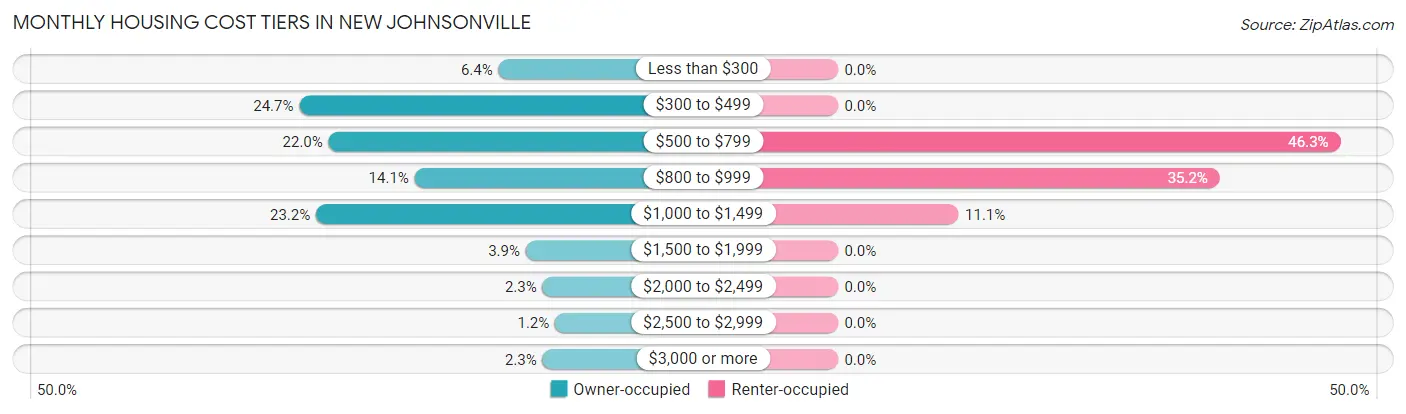
| Monthly Cost | Owner-occupied | Renter-occupied |
| Less than $300 | 33 (6.4%) | 0 (0.0%) |
| $300 to $499 | 128 (24.7%) | 0 (0.0%) |
| $500 to $799 | 114 (22.0%) | 50 (46.3%) |
| $800 to $999 | 73 (14.1%) | 38 (35.2%) |
| $1,000 to $1,499 | 120 (23.2%) | 12 (11.1%) |
| $1,500 to $1,999 | 20 (3.9%) | 0 (0.0%) |
| $2,000 to $2,499 | 12 (2.3%) | 0 (0.0%) |
| $2,500 to $2,999 | 6 (1.2%) | 0 (0.0%) |
| $3,000 or more | 12 (2.3%) | 0 (0.0%) |
| Total | 518 (100.0%) | 108 (100.0%) |
Physical Housing Characteristics in New Johnsonville
Housing Structures in New Johnsonville
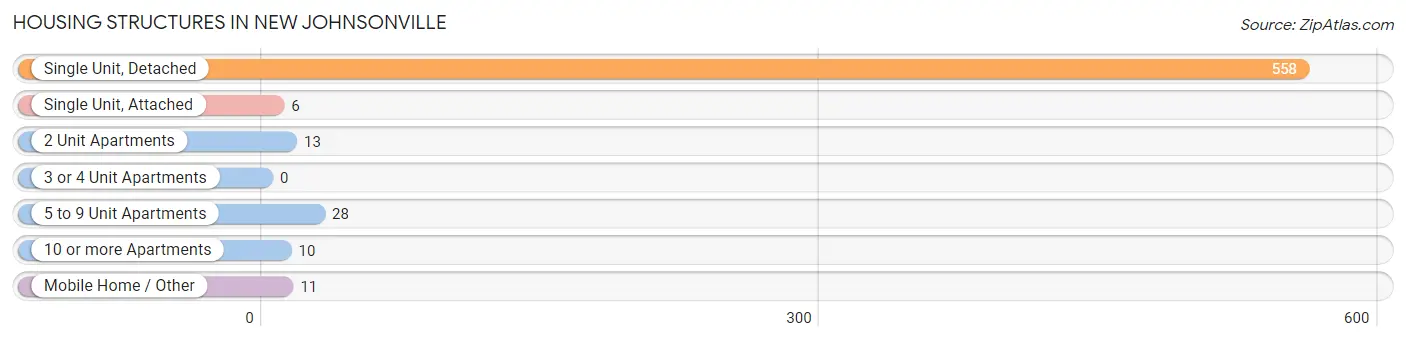
| Structure Type | # Housing Units | % Housing Units |
| Single Unit, Detached | 558 | 89.1% |
| Single Unit, Attached | 6 | 1.0% |
| 2 Unit Apartments | 13 | 2.1% |
| 3 or 4 Unit Apartments | 0 | 0.0% |
| 5 to 9 Unit Apartments | 28 | 4.5% |
| 10 or more Apartments | 10 | 1.6% |
| Mobile Home / Other | 11 | 1.8% |
| Total | 626 | 100.0% |
Housing Structures by Occupancy in New Johnsonville
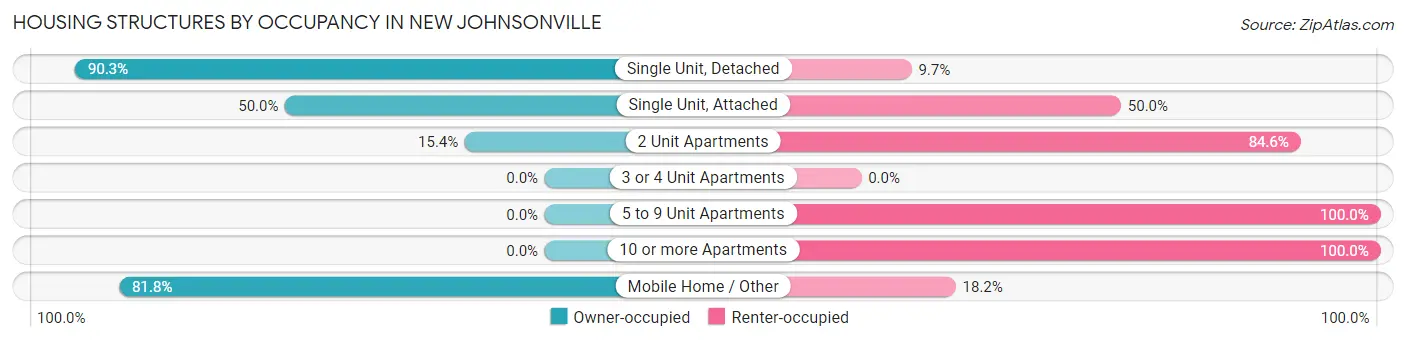
| Structure Type | Owner-occupied | Renter-occupied |
| Single Unit, Detached | 504 (90.3%) | 54 (9.7%) |
| Single Unit, Attached | 3 (50.0%) | 3 (50.0%) |
| 2 Unit Apartments | 2 (15.4%) | 11 (84.6%) |
| 3 or 4 Unit Apartments | 0 (0.0%) | 0 (0.0%) |
| 5 to 9 Unit Apartments | 0 (0.0%) | 28 (100.0%) |
| 10 or more Apartments | 0 (0.0%) | 10 (100.0%) |
| Mobile Home / Other | 9 (81.8%) | 2 (18.2%) |
| Total | 518 (82.8%) | 108 (17.2%) |
Housing Structures by Number of Rooms in New Johnsonville
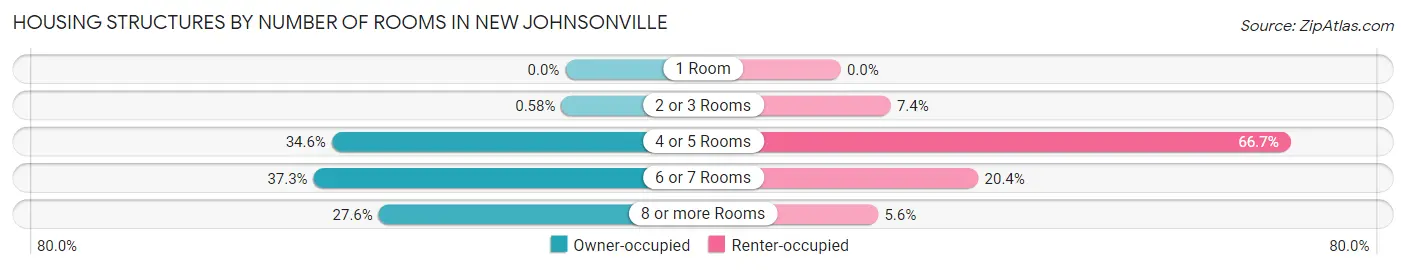
| Number of Rooms | Owner-occupied | Renter-occupied |
| 1 Room | 0 (0.0%) | 0 (0.0%) |
| 2 or 3 Rooms | 3 (0.6%) | 8 (7.4%) |
| 4 or 5 Rooms | 179 (34.6%) | 72 (66.7%) |
| 6 or 7 Rooms | 193 (37.3%) | 22 (20.4%) |
| 8 or more Rooms | 143 (27.6%) | 6 (5.6%) |
| Total | 518 (100.0%) | 108 (100.0%) |
Housing Structure by Heating Type in New Johnsonville
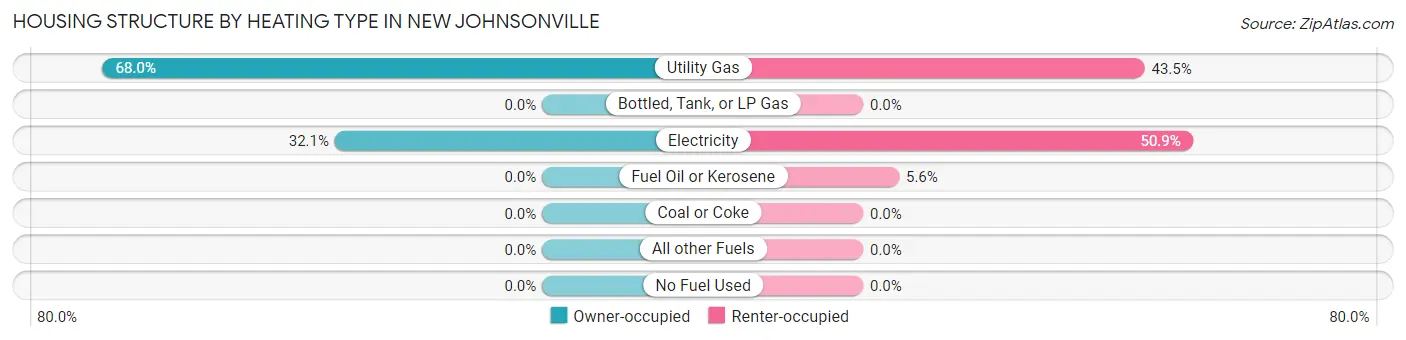
| Heating Type | Owner-occupied | Renter-occupied |
| Utility Gas | 352 (67.9%) | 47 (43.5%) |
| Bottled, Tank, or LP Gas | 0 (0.0%) | 0 (0.0%) |
| Electricity | 166 (32.1%) | 55 (50.9%) |
| Fuel Oil or Kerosene | 0 (0.0%) | 6 (5.6%) |
| Coal or Coke | 0 (0.0%) | 0 (0.0%) |
| All other Fuels | 0 (0.0%) | 0 (0.0%) |
| No Fuel Used | 0 (0.0%) | 0 (0.0%) |
| Total | 518 (100.0%) | 108 (100.0%) |
Household Vehicle Usage in New Johnsonville
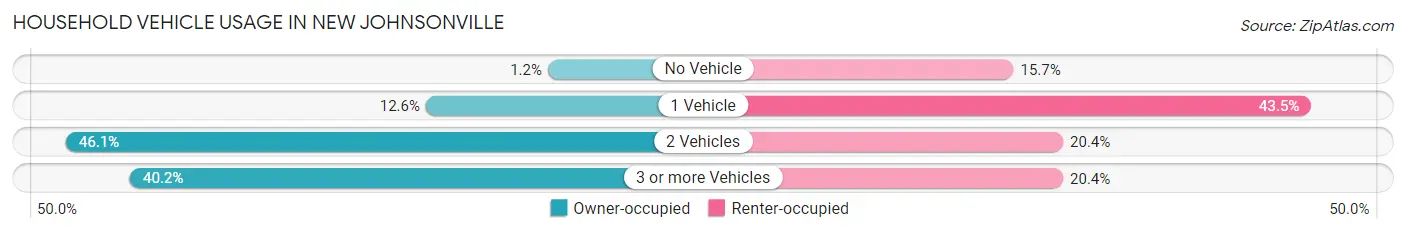
| Vehicles per Household | Owner-occupied | Renter-occupied |
| No Vehicle | 6 (1.2%) | 17 (15.7%) |
| 1 Vehicle | 65 (12.6%) | 47 (43.5%) |
| 2 Vehicles | 239 (46.1%) | 22 (20.4%) |
| 3 or more Vehicles | 208 (40.2%) | 22 (20.4%) |
| Total | 518 (100.0%) | 108 (100.0%) |
Real Estate & Mortgages in New Johnsonville
Real Estate and Mortgage Overview in New Johnsonville
| Characteristic | Without Mortgage | With Mortgage |
| Housing Units | 229 | 289 |
| Median Property Value | $123,600 | $145,600 |
| Median Household Income | $51,776 | $45 |
| Monthly Housing Costs | $418 | $12 |
| Real Estate Taxes | $782 | $12 |
Property Value by Mortgage Status in New Johnsonville
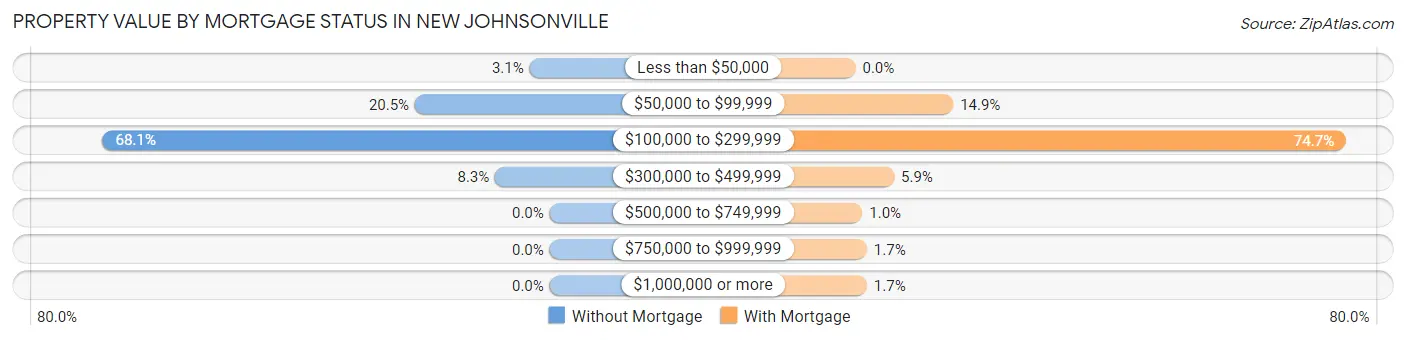
| Property Value | Without Mortgage | With Mortgage |
| Less than $50,000 | 7 (3.1%) | 0 (0.0%) |
| $50,000 to $99,999 | 47 (20.5%) | 43 (14.9%) |
| $100,000 to $299,999 | 156 (68.1%) | 216 (74.7%) |
| $300,000 to $499,999 | 19 (8.3%) | 17 (5.9%) |
| $500,000 to $749,999 | 0 (0.0%) | 3 (1.0%) |
| $750,000 to $999,999 | 0 (0.0%) | 5 (1.7%) |
| $1,000,000 or more | 0 (0.0%) | 5 (1.7%) |
| Total | 229 (100.0%) | 289 (100.0%) |
Household Income by Mortgage Status in New Johnsonville
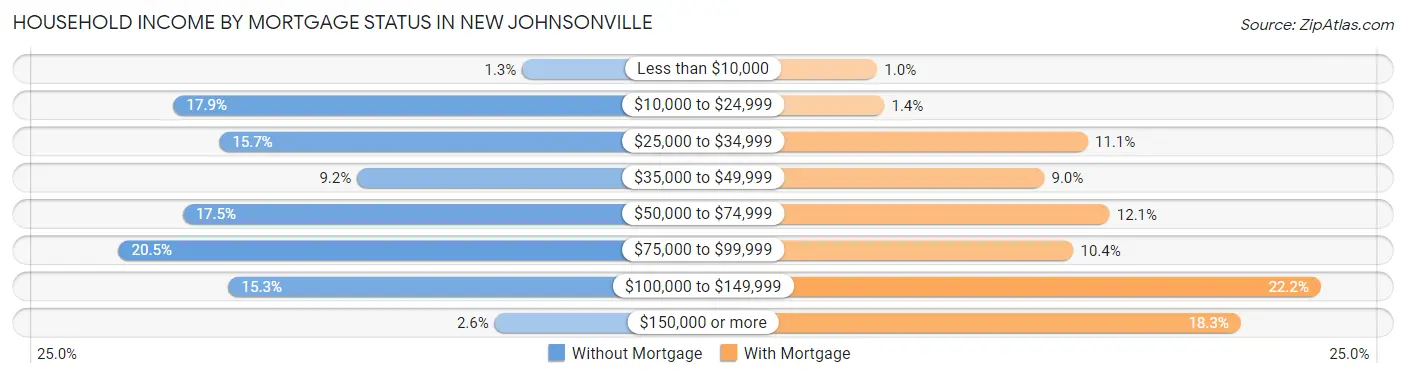
| Household Income | Without Mortgage | With Mortgage |
| Less than $10,000 | 3 (1.3%) | 3 (1.0%) |
| $10,000 to $24,999 | 41 (17.9%) | 4 (1.4%) |
| $25,000 to $34,999 | 36 (15.7%) | 32 (11.1%) |
| $35,000 to $49,999 | 21 (9.2%) | 26 (9.0%) |
| $50,000 to $74,999 | 40 (17.5%) | 35 (12.1%) |
| $75,000 to $99,999 | 47 (20.5%) | 30 (10.4%) |
| $100,000 to $149,999 | 35 (15.3%) | 64 (22.2%) |
| $150,000 or more | 6 (2.6%) | 53 (18.3%) |
| Total | 229 (100.0%) | 289 (100.0%) |
Property Value to Household Income Ratio in New Johnsonville
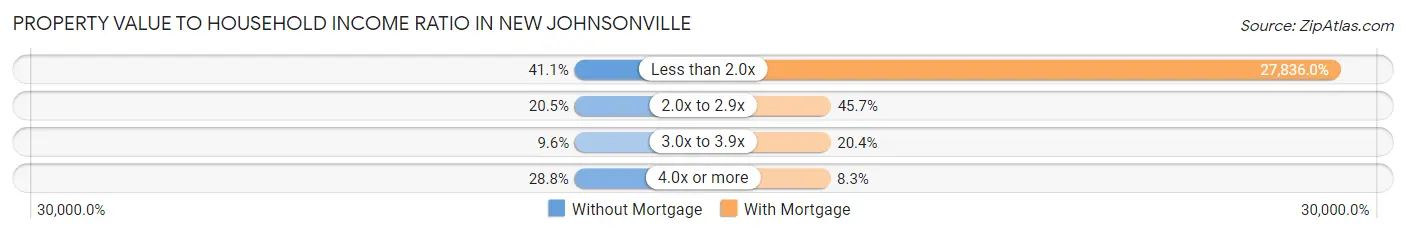
| Value-to-Income Ratio | Without Mortgage | With Mortgage |
| Less than 2.0x | 94 (41.0%) | 80,446 (27,836.0%) |
| 2.0x to 2.9x | 47 (20.5%) | 132 (45.7%) |
| 3.0x to 3.9x | 22 (9.6%) | 59 (20.4%) |
| 4.0x or more | 66 (28.8%) | 24 (8.3%) |
| Total | 229 (100.0%) | 289 (100.0%) |
Real Estate Taxes by Mortgage Status in New Johnsonville
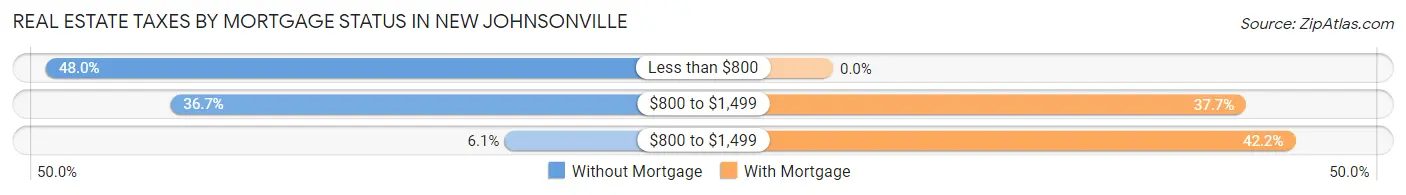
| Property Taxes | Without Mortgage | With Mortgage |
| Less than $800 | 110 (48.0%) | 0 (0.0%) |
| $800 to $1,499 | 84 (36.7%) | 109 (37.7%) |
| $800 to $1,499 | 14 (6.1%) | 122 (42.2%) |
| Total | 229 (100.0%) | 289 (100.0%) |
Health & Disability in New Johnsonville
Health Insurance Coverage by Age in New Johnsonville
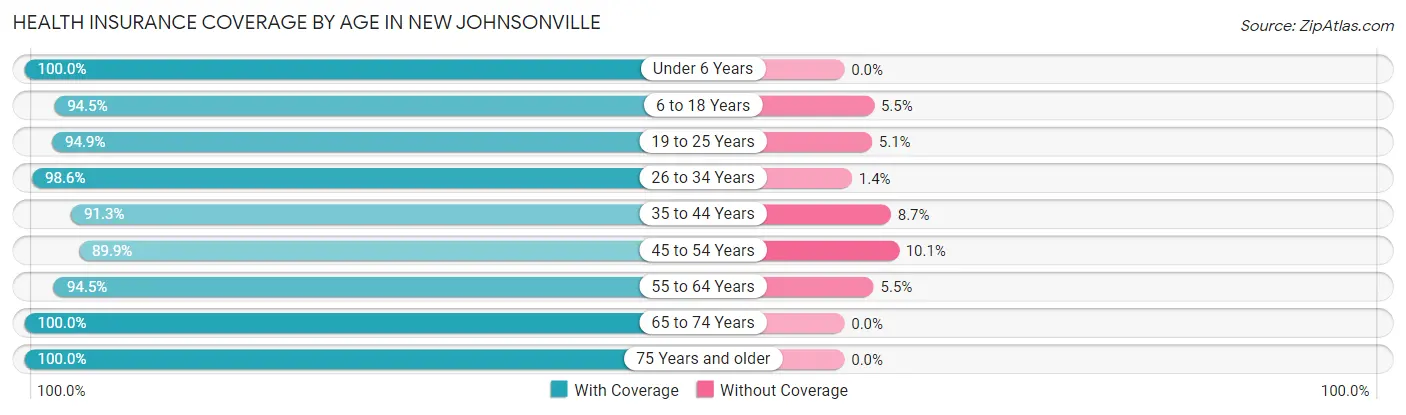
| Age Bracket | With Coverage | Without Coverage |
| Under 6 Years | 134 (100.0%) | 0 (0.0%) |
| 6 to 18 Years | 393 (94.5%) | 23 (5.5%) |
| 19 to 25 Years | 166 (94.9%) | 9 (5.1%) |
| 26 to 34 Years | 140 (98.6%) | 2 (1.4%) |
| 35 to 44 Years | 179 (91.3%) | 17 (8.7%) |
| 45 to 54 Years | 257 (89.9%) | 29 (10.1%) |
| 55 to 64 Years | 242 (94.5%) | 14 (5.5%) |
| 65 to 74 Years | 107 (100.0%) | 0 (0.0%) |
| 75 Years and older | 132 (100.0%) | 0 (0.0%) |
| Total | 1,750 (94.9%) | 94 (5.1%) |
Health Insurance Coverage by Citizenship Status in New Johnsonville
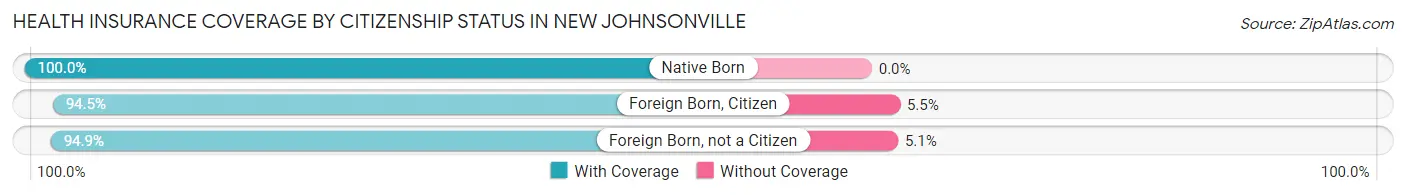
| Citizenship Status | With Coverage | Without Coverage |
| Native Born | 134 (100.0%) | 0 (0.0%) |
| Foreign Born, Citizen | 393 (94.5%) | 23 (5.5%) |
| Foreign Born, not a Citizen | 166 (94.9%) | 9 (5.1%) |
Health Insurance Coverage by Household Income in New Johnsonville
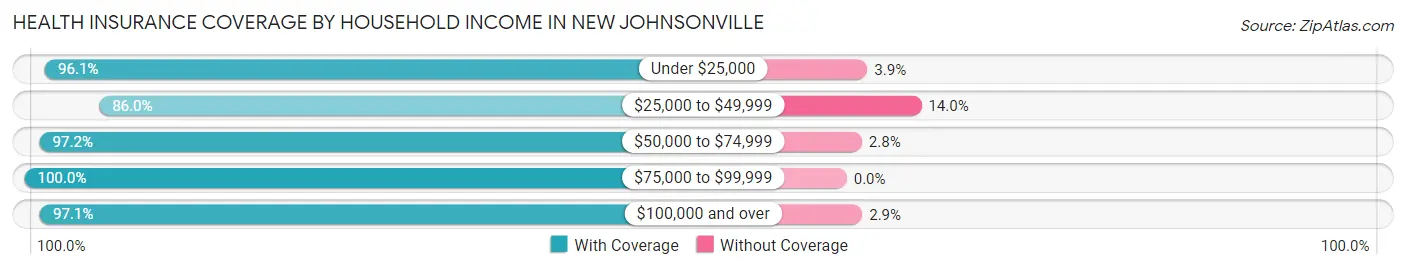
| Household Income | With Coverage | Without Coverage |
| Under $25,000 | 224 (96.1%) | 9 (3.9%) |
| $25,000 to $49,999 | 375 (86.0%) | 61 (14.0%) |
| $50,000 to $74,999 | 240 (97.2%) | 7 (2.8%) |
| $75,000 to $99,999 | 342 (100.0%) | 0 (0.0%) |
| $100,000 and over | 569 (97.1%) | 17 (2.9%) |
Public vs Private Health Insurance Coverage by Age in New Johnsonville
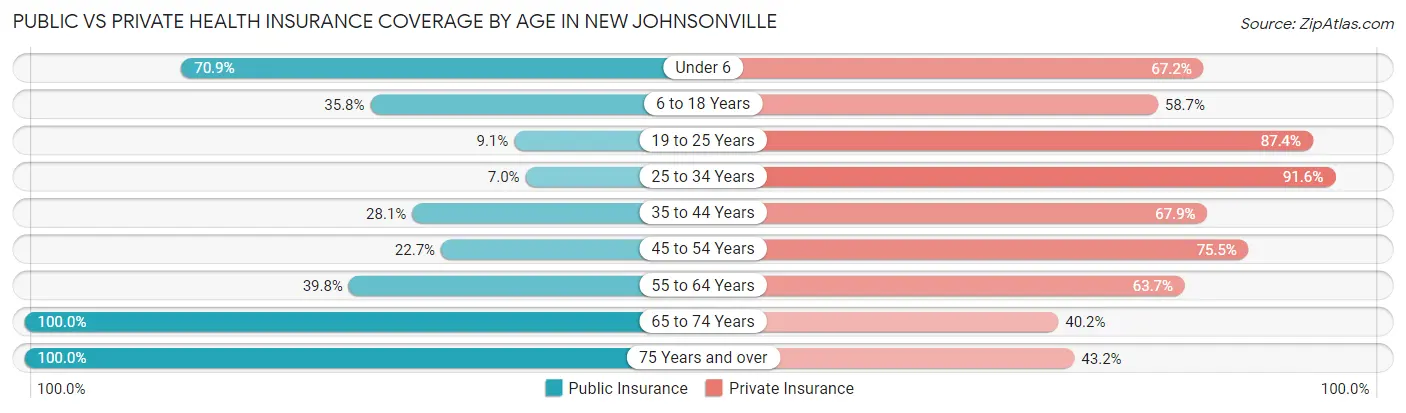
| Age Bracket | Public Insurance | Private Insurance |
| Under 6 | 95 (70.9%) | 90 (67.2%) |
| 6 to 18 Years | 149 (35.8%) | 244 (58.7%) |
| 19 to 25 Years | 16 (9.1%) | 153 (87.4%) |
| 25 to 34 Years | 10 (7.0%) | 130 (91.5%) |
| 35 to 44 Years | 55 (28.1%) | 133 (67.9%) |
| 45 to 54 Years | 65 (22.7%) | 216 (75.5%) |
| 55 to 64 Years | 102 (39.8%) | 163 (63.7%) |
| 65 to 74 Years | 107 (100.0%) | 43 (40.2%) |
| 75 Years and over | 132 (100.0%) | 57 (43.2%) |
| Total | 731 (39.6%) | 1,229 (66.6%) |
Disability Status by Sex by Age in New Johnsonville
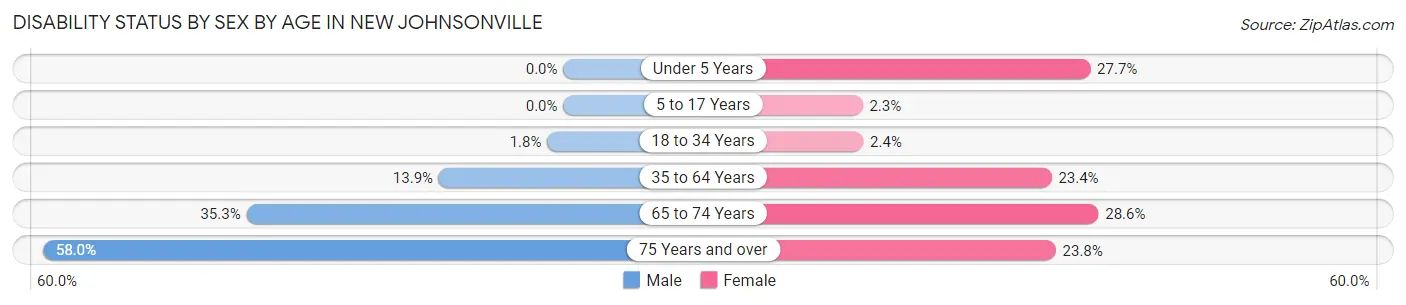
| Age Bracket | Male | Female |
| Under 5 Years | 0 (0.0%) | 13 (27.7%) |
| 5 to 17 Years | 0 (0.0%) | 6 (2.3%) |
| 18 to 34 Years | 3 (1.8%) | 4 (2.4%) |
| 35 to 64 Years | 56 (13.9%) | 78 (23.4%) |
| 65 to 74 Years | 18 (35.3%) | 16 (28.6%) |
| 75 Years and over | 40 (58.0%) | 15 (23.8%) |
Disability Class by Sex by Age in New Johnsonville
Disability Class: Hearing Difficulty
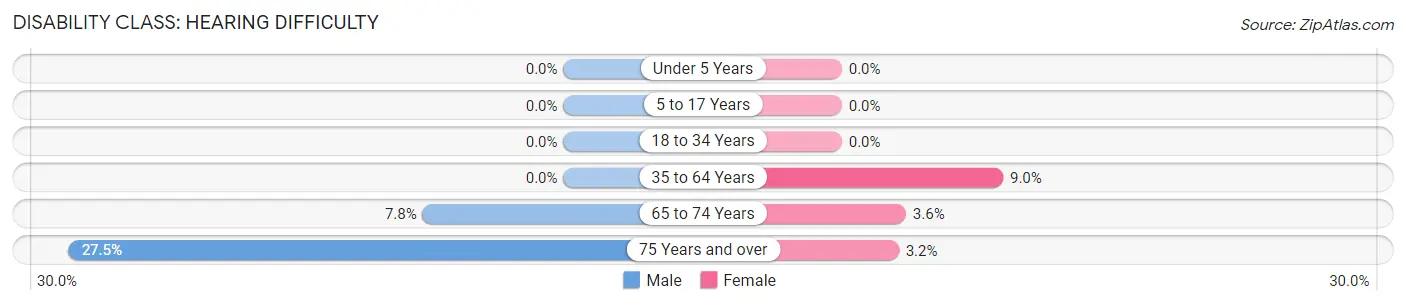
| Age Bracket | Male | Female |
| Under 5 Years | 0 (0.0%) | 0 (0.0%) |
| 5 to 17 Years | 0 (0.0%) | 0 (0.0%) |
| 18 to 34 Years | 0 (0.0%) | 0 (0.0%) |
| 35 to 64 Years | 0 (0.0%) | 30 (9.0%) |
| 65 to 74 Years | 4 (7.8%) | 2 (3.6%) |
| 75 Years and over | 19 (27.5%) | 2 (3.2%) |
Disability Class: Vision Difficulty
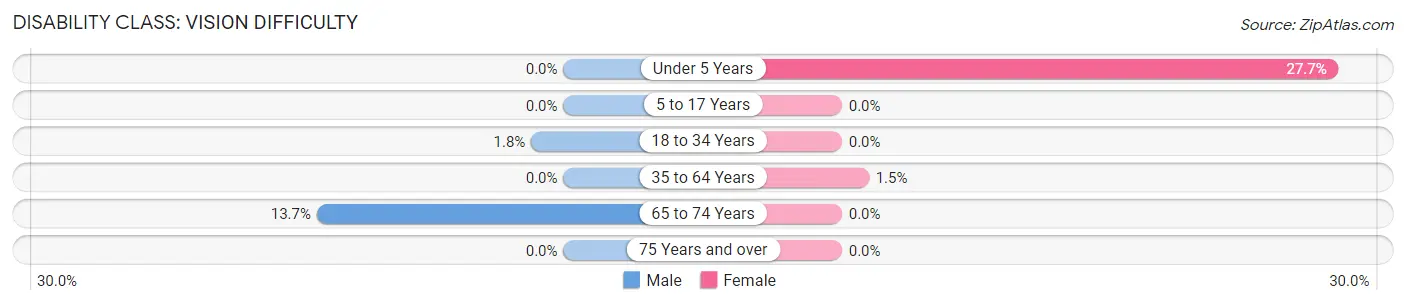
| Age Bracket | Male | Female |
| Under 5 Years | 0 (0.0%) | 13 (27.7%) |
| 5 to 17 Years | 0 (0.0%) | 0 (0.0%) |
| 18 to 34 Years | 3 (1.8%) | 0 (0.0%) |
| 35 to 64 Years | 0 (0.0%) | 5 (1.5%) |
| 65 to 74 Years | 7 (13.7%) | 0 (0.0%) |
| 75 Years and over | 0 (0.0%) | 0 (0.0%) |
Disability Class: Cognitive Difficulty
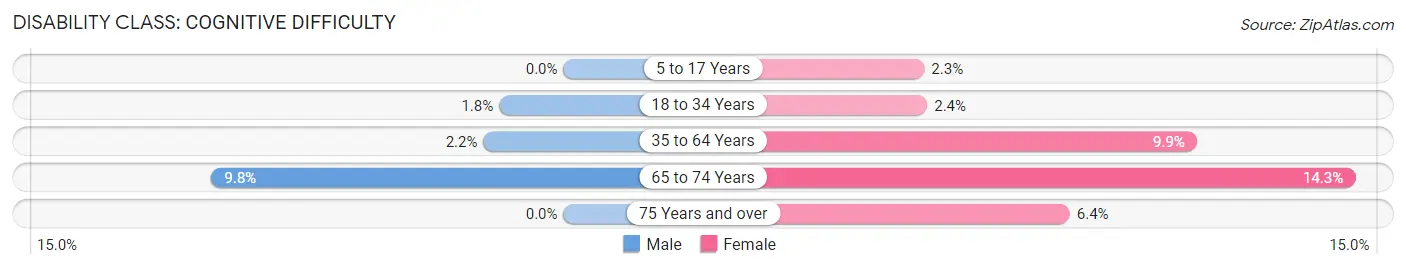
| Age Bracket | Male | Female |
| 5 to 17 Years | 0 (0.0%) | 6 (2.3%) |
| 18 to 34 Years | 3 (1.8%) | 4 (2.4%) |
| 35 to 64 Years | 9 (2.2%) | 33 (9.9%) |
| 65 to 74 Years | 5 (9.8%) | 8 (14.3%) |
| 75 Years and over | 0 (0.0%) | 4 (6.4%) |
Disability Class: Ambulatory Difficulty
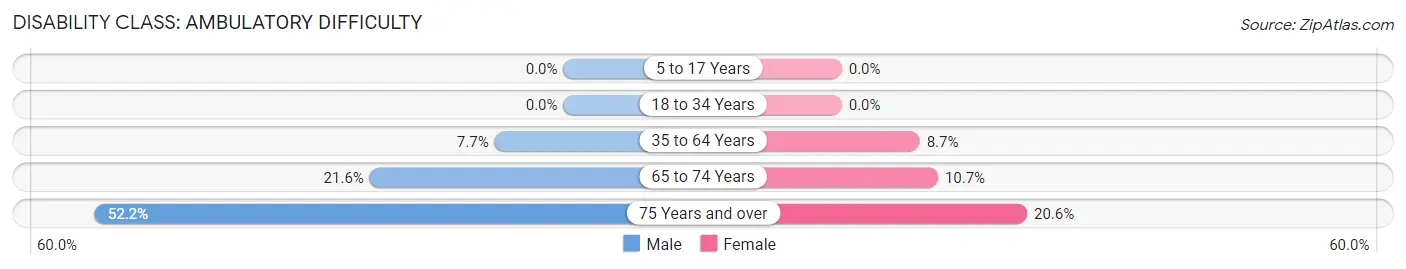
| Age Bracket | Male | Female |
| 5 to 17 Years | 0 (0.0%) | 0 (0.0%) |
| 18 to 34 Years | 0 (0.0%) | 0 (0.0%) |
| 35 to 64 Years | 31 (7.7%) | 29 (8.7%) |
| 65 to 74 Years | 11 (21.6%) | 6 (10.7%) |
| 75 Years and over | 36 (52.2%) | 13 (20.6%) |
Disability Class: Self-Care Difficulty
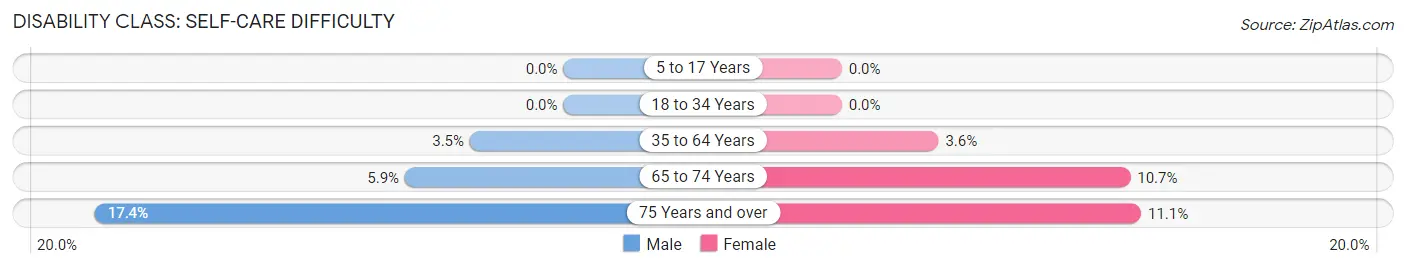
| Age Bracket | Male | Female |
| 5 to 17 Years | 0 (0.0%) | 0 (0.0%) |
| 18 to 34 Years | 0 (0.0%) | 0 (0.0%) |
| 35 to 64 Years | 14 (3.5%) | 12 (3.6%) |
| 65 to 74 Years | 3 (5.9%) | 6 (10.7%) |
| 75 Years and over | 12 (17.4%) | 7 (11.1%) |
Technology Access in New Johnsonville
Computing Device Access in New Johnsonville
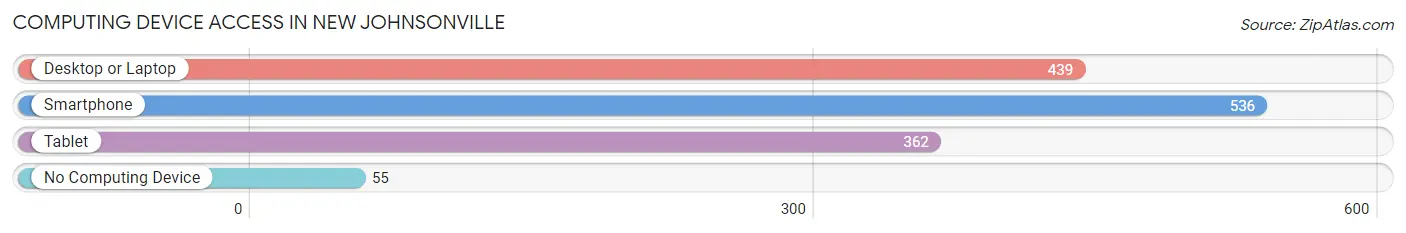
| Device Type | # Households | % Households |
| Desktop or Laptop | 439 | 70.1% |
| Smartphone | 536 | 85.6% |
| Tablet | 362 | 57.8% |
| No Computing Device | 55 | 8.8% |
| Total | 626 | 100.0% |
Internet Access in New Johnsonville
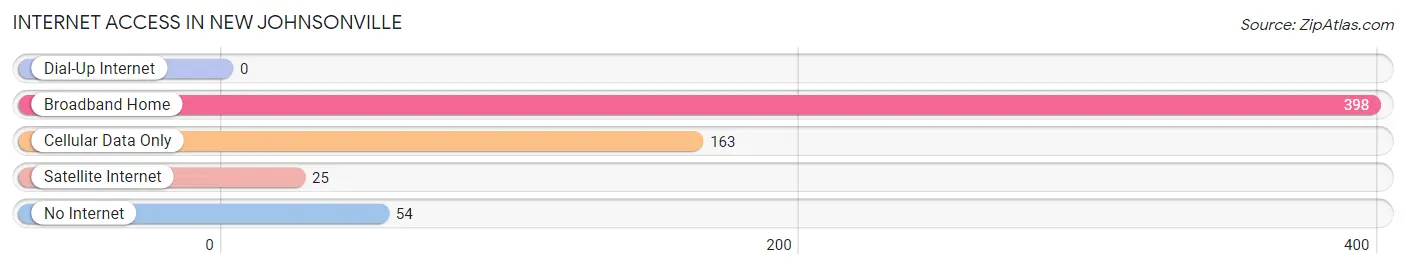
| Internet Type | # Households | % Households |
| Dial-Up Internet | 0 | 0.0% |
| Broadband Home | 398 | 63.6% |
| Cellular Data Only | 163 | 26.0% |
| Satellite Internet | 25 | 4.0% |
| No Internet | 54 | 8.6% |
| Total | 626 | 100.0% |
New Johnsonville Summary
Johnsonville, Tennessee is a small town located in Humphreys County, Tennessee. It is situated on the banks of the Tennessee River, approximately 30 miles northwest of Nashville. The town was founded in 1820 and was named after the Johnson family, who were among the first settlers in the area.
History
The area that is now Johnsonville was first settled in the early 1800s by the Johnson family. The family had moved to the area from North Carolina and established a homestead on the banks of the Tennessee River. The town was officially founded in 1820 and was named after the Johnson family.
In the early years, Johnsonville was a small farming community. The town was home to a variety of crops, including cotton, corn, and tobacco. The town also had a few small businesses, including a general store, a blacksmith shop, and a gristmill.
In the late 1800s, the town began to grow and develop. The railroad came to Johnsonville in 1887, connecting the town to the larger cities of Nashville and Memphis. This allowed for the growth of the town’s economy and population.
In the early 1900s, Johnsonville began to experience a period of growth and prosperity. The town was home to several businesses, including a cotton gin, a sawmill, and a brickyard. The town also had a variety of churches, schools, and other civic organizations.
In the mid-1900s, Johnsonville began to experience a period of decline. The railroad was abandoned in the 1950s, and the town’s economy began to suffer. The population of the town began to decline as well, and by the 1970s, the town had become a virtual ghost town.
In the late 1990s, Johnsonville began to experience a period of revitalization. The town was designated as a historic district in 1998, and the town’s economy began to improve. The population of the town began to increase, and today, Johnsonville is a thriving small town with a population of approximately 1,000 people.
Geography
Johnsonville is located in Humphreys County, Tennessee. The town is situated on the banks of the Tennessee River, approximately 30 miles northwest of Nashville. The town is located in a rural area, and the surrounding landscape is mostly flat and rolling hills.
The climate in Johnsonville is humid subtropical, with hot summers and mild winters. The average annual temperature is around 65 degrees Fahrenheit, and the average annual precipitation is around 45 inches.
Economy
The economy of Johnsonville is largely based on agriculture. The town is home to several farms, and the surrounding area is home to a variety of crops, including cotton, corn, and tobacco. The town also has a few small businesses, including a general store, a blacksmith shop, and a gristmill.
The town is also home to a few manufacturing companies, including a furniture factory and a plastics factory. The town is also home to a few restaurants and other small businesses.
Demographics
As of the 2010 census, the population of Johnsonville was 1,000 people. The racial makeup of the town was 97.2% White, 0.7% African American, 0.3% Native American, 0.2% Asian, and 1.6% from other races.
The median household income in Johnsonville was $35,000, and the median family income was $41,000. The per capita income in the town was $17,000. The poverty rate in the town was 17.3%.
Conclusion
Johnsonville, Tennessee is a small town located in Humphreys County, Tennessee. The town was founded in 1820 and was named after the Johnson family, who were among the first settlers in the area. The town has experienced periods of growth and decline throughout its history, but today, it is a thriving small town with a population of approximately 1,000 people. The economy of Johnsonville is largely based on agriculture, and the town is home to several small businesses. The racial makeup of the town is mostly White, with a small percentage of African American, Native American, and Asian residents.
Common Questions
What is Per Capita Income in New Johnsonville?
Per Capita income in New Johnsonville is $30,359.
What is the Median Family Income in New Johnsonville?
Median Family Income in New Johnsonville is $77,738.
What is the Median Household income in New Johnsonville?
Median Household Income in New Johnsonville is $66,667.
What is Income or Wage Gap in New Johnsonville?
Income or Wage Gap in New Johnsonville is 35.9%.
Women in New Johnsonville earn 64.1 cents for every dollar earned by a man.
What is Inequality or Gini Index in New Johnsonville?
Inequality or Gini Index in New Johnsonville is 0.43.
What is the Total Population of New Johnsonville?
Total Population of New Johnsonville is 1,844.
What is the Total Male Population of New Johnsonville?
Total Male Population of New Johnsonville is 915.
What is the Total Female Population of New Johnsonville?
Total Female Population of New Johnsonville is 929.
What is the Ratio of Males per 100 Females in New Johnsonville?
There are 98.49 Males per 100 Females in New Johnsonville.
What is the Ratio of Females per 100 Males in New Johnsonville?
There are 101.53 Females per 100 Males in New Johnsonville.
What is the Median Population Age in New Johnsonville?
Median Population Age in New Johnsonville is 40.2 Years.
What is the Average Family Size in New Johnsonville
Average Family Size in New Johnsonville is 3.3 People.
What is the Average Household Size in New Johnsonville
Average Household Size in New Johnsonville is 3.0 People.
How Large is the Labor Force in New Johnsonville?
There are 881 People in the Labor Forcein in New Johnsonville.
What is the Percentage of People in the Labor Force in New Johnsonville?
64.0% of People are in the Labor Force in New Johnsonville.
What is the Unemployment Rate in New Johnsonville?
Unemployment Rate in New Johnsonville is 2.3%.