Lynnville, TN Map & Demographics
Lynnville Map
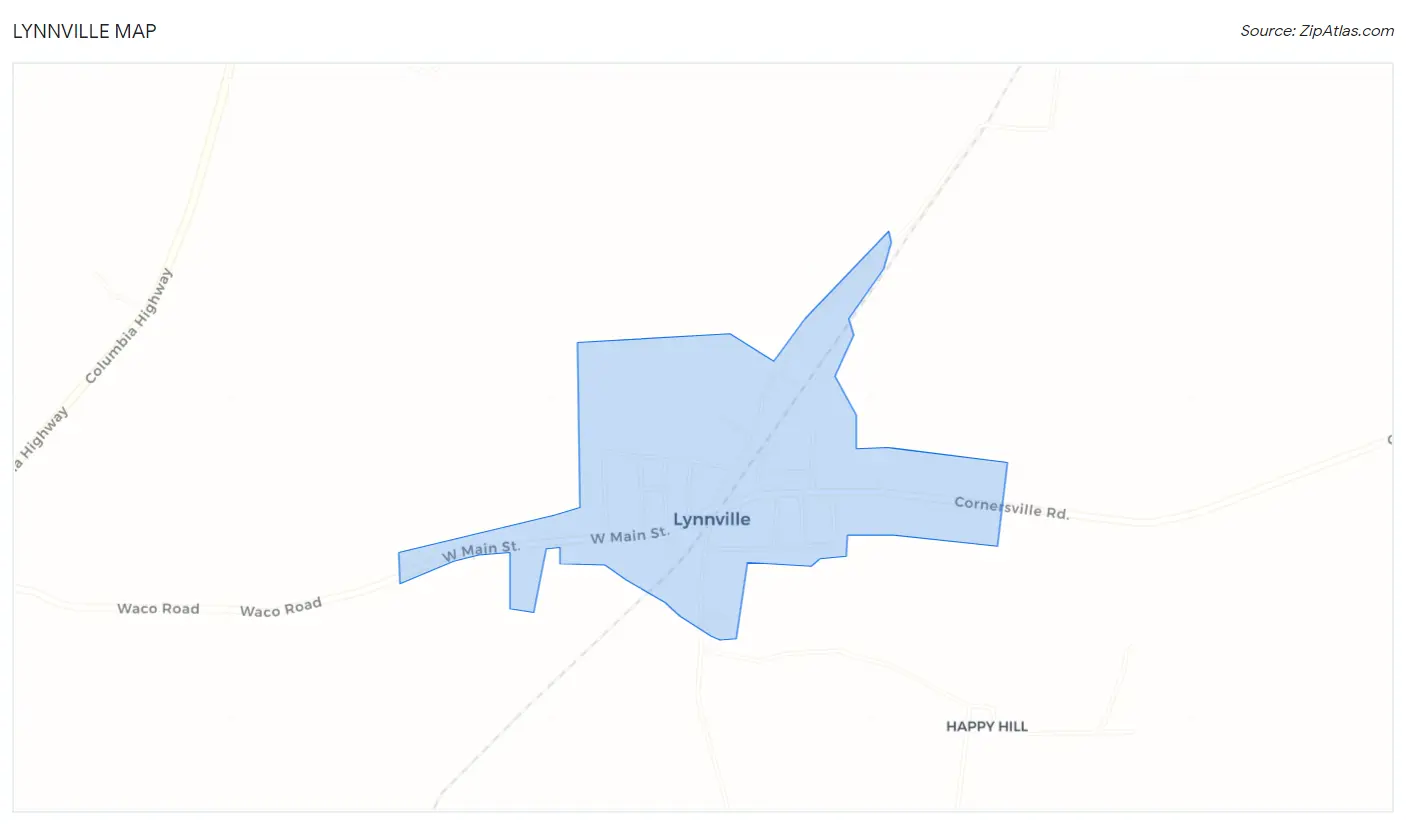
Lynnville Overview
$34,880
PER CAPITA INCOME
$62,083
AVG FAMILY INCOME
$57,500
AVG HOUSEHOLD INCOME
$8,883
FAMILY INCOME DEFICIT
0.37
INEQUALITY / GINI INDEX
382
TOTAL POPULATION
179
MALE POPULATION
203
FEMALE POPULATION
88.18
MALES / 100 FEMALES
113.41
FEMALES / 100 MALES
45.1
MEDIAN AGE
3.4
AVG FAMILY SIZE
2.2
AVG HOUSEHOLD SIZE
177
LABOR FORCE [ PEOPLE ]
61.2%
PERCENT IN LABOR FORCE
15.3%
UNEMPLOYMENT RATE
Lynnville Zip Codes
Lynnville Area Codes
Income in Lynnville
Income Overview in Lynnville
Per Capita Income in Lynnville is $34,880, while median incomes of families and households are $62,083 and $57,500 respectively.
| Characteristic | Number | Measure |
| Per Capita Income | 382 | $34,880 |
| Median Family Income | 83 | $62,083 |
| Mean Family Income | 83 | $73,395 |
| Median Household Income | 172 | $57,500 |
| Mean Household Income | 172 | $75,557 |
| Income Deficit | 83 | $8,883 |
| Wage / Income Gap (%) | 382 | 0.00% |
| Wage / Income Gap ($) | 382 | 100.00¢ per $1 |
| Gini / Inequality Index | 382 | 0.37 |
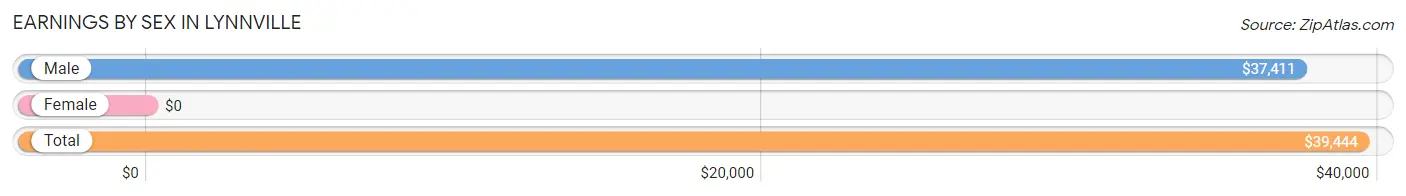
Earnings by Sex in Lynnville
| Sex | Number | Average Earnings |
| Male | 95 (51.6%) | $37,411 |
| Female | 89 (48.4%) | $0 |
| Total | 184 (100.0%) | $39,444 |
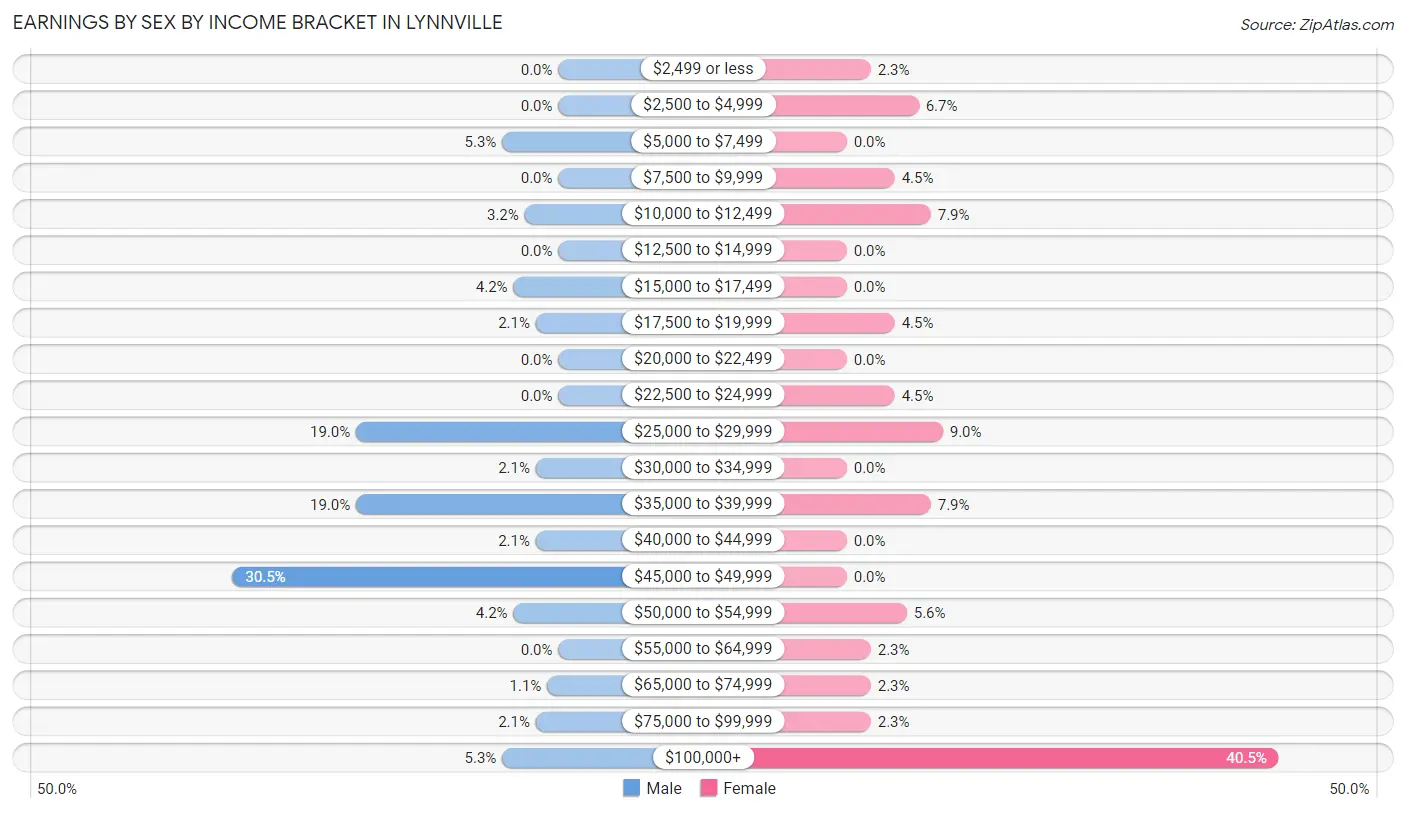
Earnings by Sex by Income Bracket in Lynnville
The most common earnings brackets in Lynnville are $45,000 to $49,999 for men (29 | 30.5%) and $100,000+ for women (36 | 40.5%).
| Income | Male | Female |
| $2,499 or less | 0 (0.0%) | 2 (2.2%) |
| $2,500 to $4,999 | 0 (0.0%) | 6 (6.7%) |
| $5,000 to $7,499 | 5 (5.3%) | 0 (0.0%) |
| $7,500 to $9,999 | 0 (0.0%) | 4 (4.5%) |
| $10,000 to $12,499 | 3 (3.2%) | 7 (7.9%) |
| $12,500 to $14,999 | 0 (0.0%) | 0 (0.0%) |
| $15,000 to $17,499 | 4 (4.2%) | 0 (0.0%) |
| $17,500 to $19,999 | 2 (2.1%) | 4 (4.5%) |
| $20,000 to $22,499 | 0 (0.0%) | 0 (0.0%) |
| $22,500 to $24,999 | 0 (0.0%) | 4 (4.5%) |
| $25,000 to $29,999 | 18 (19.0%) | 8 (9.0%) |
| $30,000 to $34,999 | 2 (2.1%) | 0 (0.0%) |
| $35,000 to $39,999 | 18 (19.0%) | 7 (7.9%) |
| $40,000 to $44,999 | 2 (2.1%) | 0 (0.0%) |
| $45,000 to $49,999 | 29 (30.5%) | 0 (0.0%) |
| $50,000 to $54,999 | 4 (4.2%) | 5 (5.6%) |
| $55,000 to $64,999 | 0 (0.0%) | 2 (2.2%) |
| $65,000 to $74,999 | 1 (1.1%) | 2 (2.2%) |
| $75,000 to $99,999 | 2 (2.1%) | 2 (2.2%) |
| $100,000+ | 5 (5.3%) | 36 (40.5%) |
| Total | 95 (100.0%) | 89 (100.0%) |
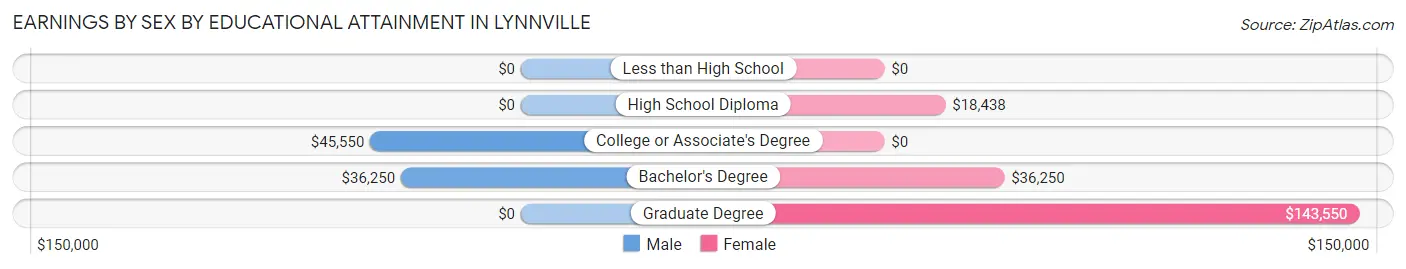
Earnings by Sex by Educational Attainment in Lynnville
| Educational Attainment | Male Income | Female Income |
| Less than High School | - | - |
| High School Diploma | - | - |
| College or Associate's Degree | $45,550 | $0 |
| Bachelor's Degree | $36,250 | $36,250 |
| Graduate Degree | - | - |
| Total | $37,232 | $0 |
Family Income in Lynnville
Family Income Brackets in Lynnville
According to the Lynnville family income data, there are 36 families falling into the $50,000 to $74,999 income range, which is the most common income bracket and makes up 43.4% of all families. Conversely, the $25,000 to $34,999 income bracket is the least frequent group with only 1 families (1.2%) belonging to this category.
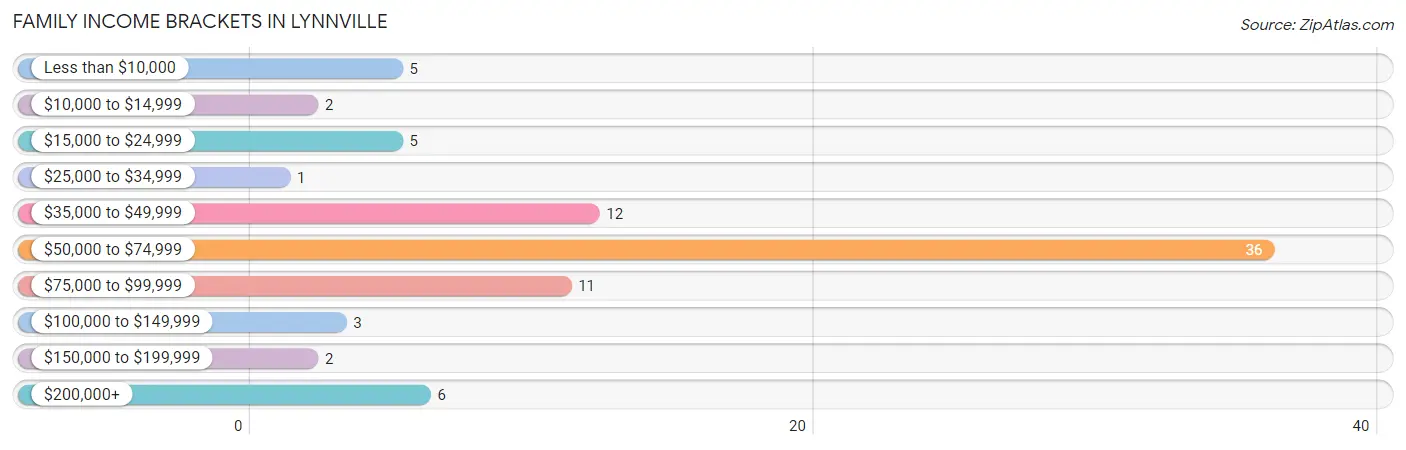
| Income Bracket | # Families | % Families |
| Less than $10,000 | 5 | 6.0% |
| $10,000 to $14,999 | 2 | 2.4% |
| $15,000 to $24,999 | 5 | 6.0% |
| $25,000 to $34,999 | 1 | 1.2% |
| $35,000 to $49,999 | 12 | 14.5% |
| $50,000 to $74,999 | 36 | 43.4% |
| $75,000 to $99,999 | 11 | 13.3% |
| $100,000 to $149,999 | 3 | 3.6% |
| $150,000 to $199,999 | 2 | 2.4% |
| $200,000+ | 6 | 7.2% |
Family Income by Famaliy Size in Lynnville
3-person families (15 | 18.1%) account for the highest median family income in Lynnville with $74,028 per family, while 2-person families (46 | 55.4%) have the highest median income of $26,750 per family member.
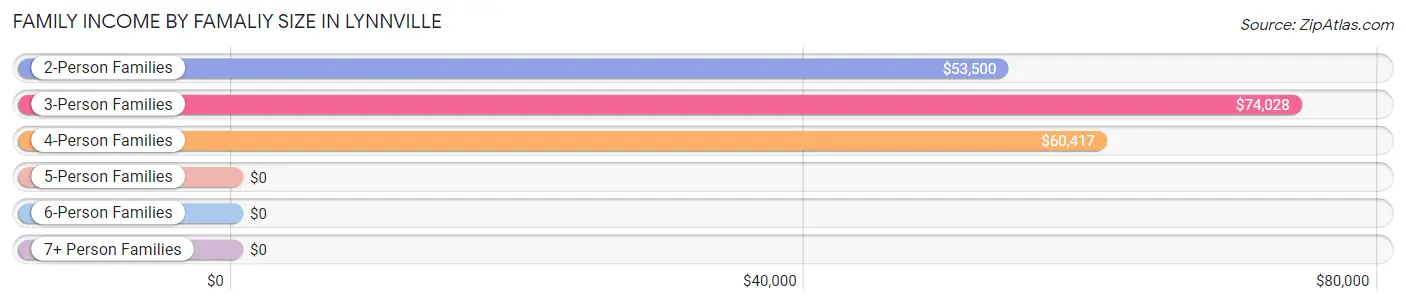
| Income Bracket | # Families | Median Income |
| 2-Person Families | 46 (55.4%) | $53,500 |
| 3-Person Families | 15 (18.1%) | $74,028 |
| 4-Person Families | 17 (20.5%) | $60,417 |
| 5-Person Families | 3 (3.6%) | $0 |
| 6-Person Families | 2 (2.4%) | $0 |
| 7+ Person Families | 0 (0.0%) | $0 |
| Total | 83 (100.0%) | $62,083 |
Family Income by Number of Earners in Lynnville
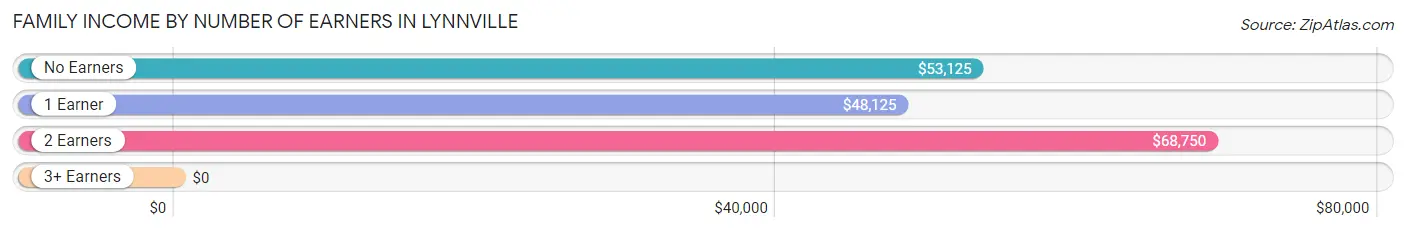
| Number of Earners | # Families | Median Income |
| No Earners | 16 (19.3%) | $53,125 |
| 1 Earner | 29 (34.9%) | $48,125 |
| 2 Earners | 36 (43.4%) | $68,750 |
| 3+ Earners | 2 (2.4%) | $0 |
| Total | 83 (100.0%) | $62,083 |
Household Income in Lynnville
Household Income Brackets in Lynnville
With 39 households falling in the category, the $50,000 to $74,999 income range is the most frequent in Lynnville, accounting for 22.7% of all households. In contrast, only 2 households (1.2%) fall into the $150,000 to $199,999 income bracket, making it the least populous group.
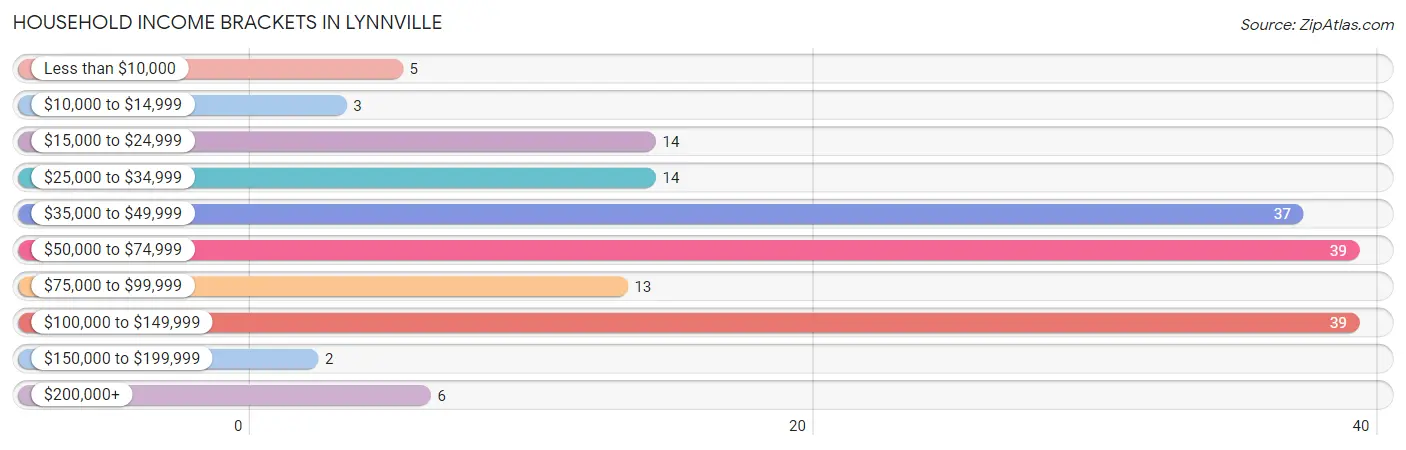
| Income Bracket | # Households | % Households |
| Less than $10,000 | 5 | 2.9% |
| $10,000 to $14,999 | 3 | 1.7% |
| $15,000 to $24,999 | 14 | 8.1% |
| $25,000 to $34,999 | 14 | 8.1% |
| $35,000 to $49,999 | 37 | 21.5% |
| $50,000 to $74,999 | 39 | 22.7% |
| $75,000 to $99,999 | 13 | 7.6% |
| $100,000 to $149,999 | 39 | 22.7% |
| $150,000 to $199,999 | 2 | 1.2% |
| $200,000+ | 6 | 3.5% |
Household Income by Householder Age in Lynnville
The median household income in Lynnville is $57,500, with the highest median household income of $56,250 found in the 25 to 44 years age bracket for the primary householder. A total of 38 households (22.1%) fall into this category. Meanwhile, the 15 to 24 years age bracket for the primary householder has the lowest median household income of $0, with 2 households (1.2%) in this group.
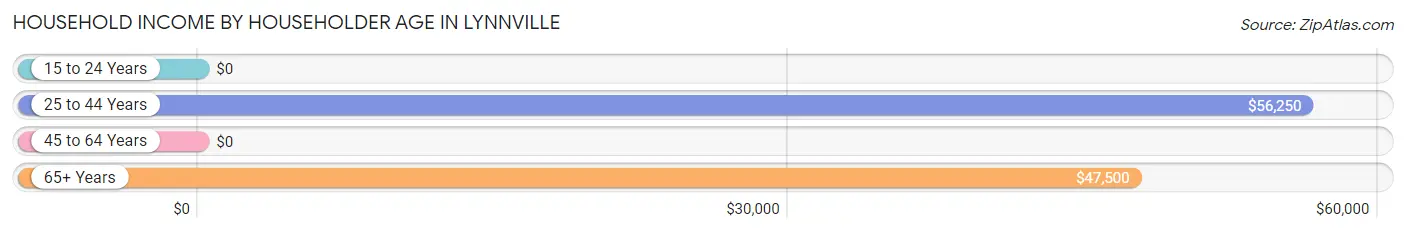
| Income Bracket | # Households | Median Income |
| 15 to 24 Years | 2 (1.2%) | $0 |
| 25 to 44 Years | 38 (22.1%) | $56,250 |
| 45 to 64 Years | 82 (47.7%) | $0 |
| 65+ Years | 50 (29.1%) | $47,500 |
| Total | 172 (100.0%) | $57,500 |
Poverty in Lynnville
Income Below Poverty by Sex and Age in Lynnville
With 9.5% poverty level for males and 13.8% for females among the residents of Lynnville, 5 year old males and 5 year old females are the most vulnerable to poverty, with 2 males (100.0%) and 2 females (100.0%) in their respective age groups living below the poverty level.
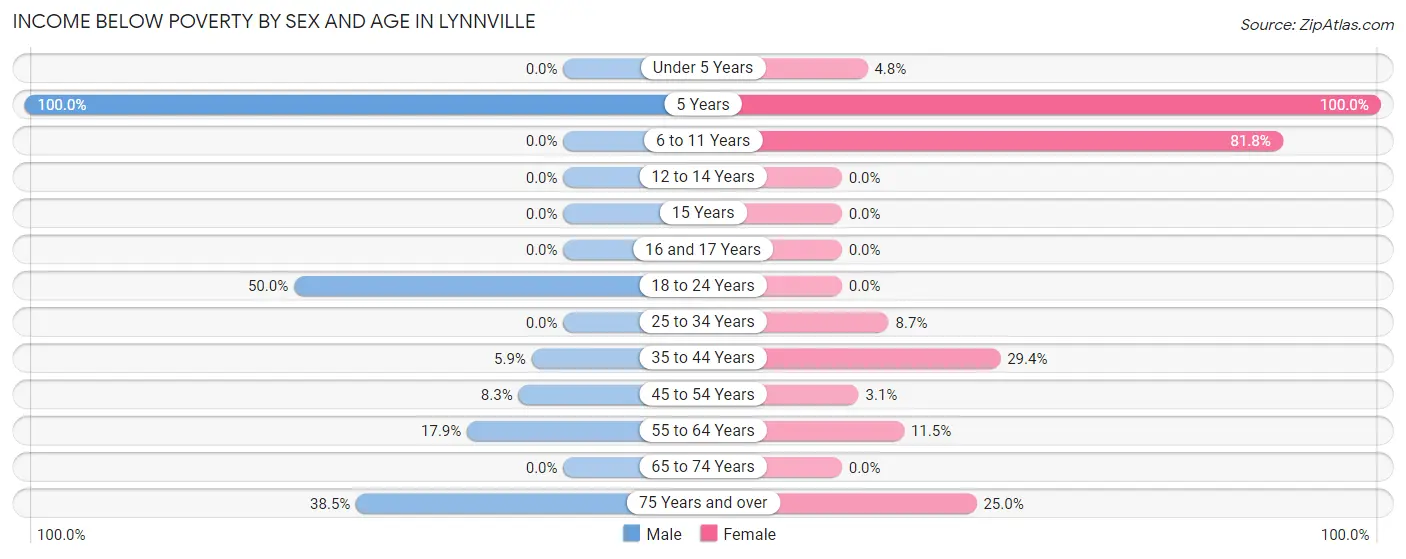
| Age Bracket | Male | Female |
| Under 5 Years | 0 (0.0%) | 2 (4.8%) |
| 5 Years | 2 (100.0%) | 2 (100.0%) |
| 6 to 11 Years | 0 (0.0%) | 9 (81.8%) |
| 12 to 14 Years | 0 (0.0%) | 0 (0.0%) |
| 15 Years | 0 (0.0%) | 0 (0.0%) |
| 16 and 17 Years | 0 (0.0%) | 0 (0.0%) |
| 18 to 24 Years | 2 (50.0%) | 0 (0.0%) |
| 25 to 34 Years | 0 (0.0%) | 2 (8.7%) |
| 35 to 44 Years | 1 (5.9%) | 5 (29.4%) |
| 45 to 54 Years | 2 (8.3%) | 1 (3.1%) |
| 55 to 64 Years | 5 (17.9%) | 3 (11.5%) |
| 65 to 74 Years | 0 (0.0%) | 0 (0.0%) |
| 75 Years and over | 5 (38.5%) | 4 (25.0%) |
| Total | 17 (9.5%) | 28 (13.8%) |
Income Above Poverty by Sex and Age in Lynnville
According to the poverty statistics in Lynnville, males aged under 5 years and females aged 16 and 17 years are the age groups that are most secure financially, with 100.0% of males and 100.0% of females in these age groups living above the poverty line.
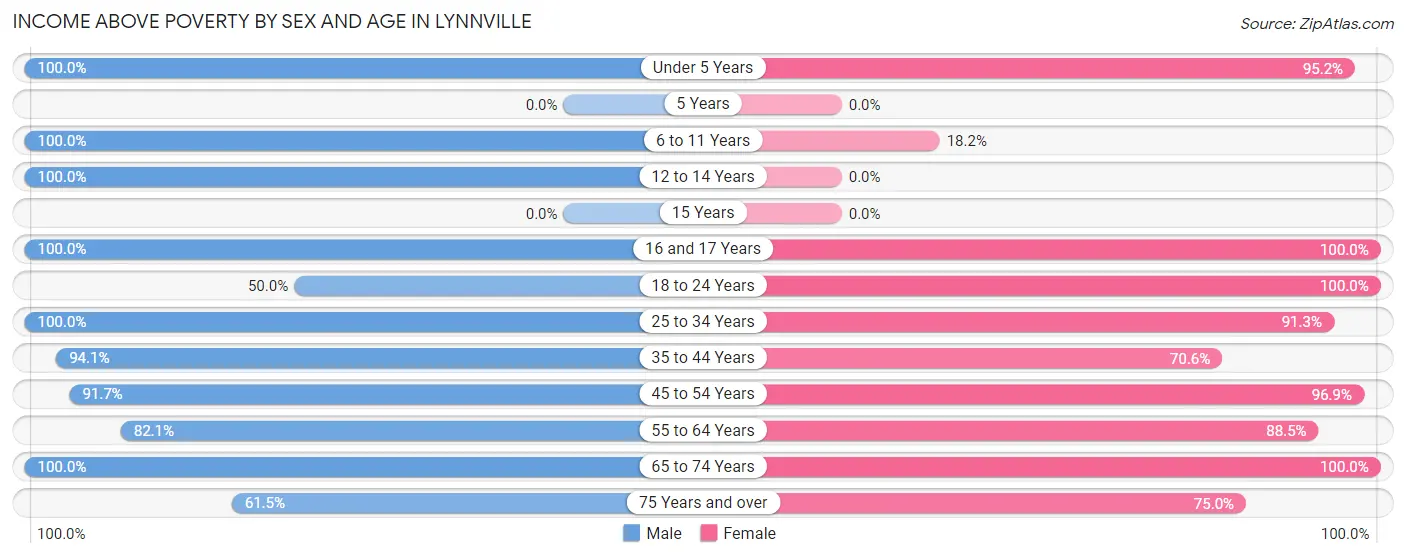
| Age Bracket | Male | Female |
| Under 5 Years | 19 (100.0%) | 40 (95.2%) |
| 5 Years | 0 (0.0%) | 0 (0.0%) |
| 6 to 11 Years | 3 (100.0%) | 2 (18.2%) |
| 12 to 14 Years | 14 (100.0%) | 0 (0.0%) |
| 15 Years | 0 (0.0%) | 0 (0.0%) |
| 16 and 17 Years | 2 (100.0%) | 3 (100.0%) |
| 18 to 24 Years | 2 (50.0%) | 4 (100.0%) |
| 25 to 34 Years | 27 (100.0%) | 21 (91.3%) |
| 35 to 44 Years | 16 (94.1%) | 12 (70.6%) |
| 45 to 54 Years | 22 (91.7%) | 31 (96.9%) |
| 55 to 64 Years | 23 (82.1%) | 23 (88.5%) |
| 65 to 74 Years | 26 (100.0%) | 27 (100.0%) |
| 75 Years and over | 8 (61.5%) | 12 (75.0%) |
| Total | 162 (90.5%) | 175 (86.2%) |
Income Below Poverty Among Married-Couple Families in Lynnville
The poverty statistics for married-couple families in Lynnville show that 6.9% or 5 of the total 73 families live below the poverty line. Families with 3 or 4 children have the highest poverty rate of 100.0%, comprising of 2 families. On the other hand, families with 1 or 2 children have the lowest poverty rate of 0.0%, which includes 0 families.
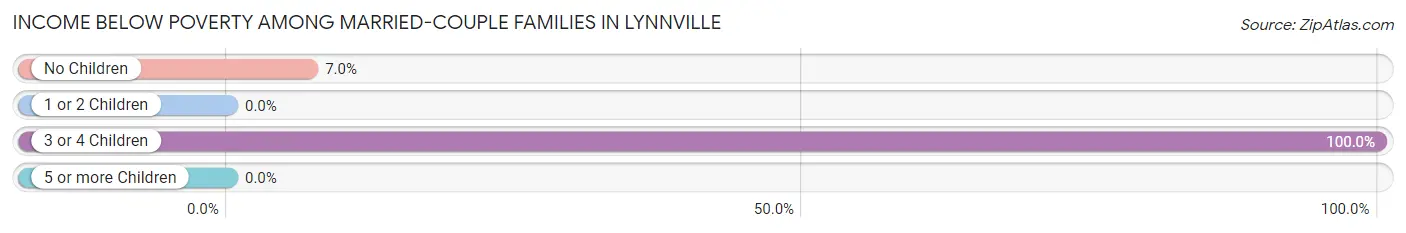
| Children | Above Poverty | Below Poverty |
| No Children | 40 (93.0%) | 3 (7.0%) |
| 1 or 2 Children | 28 (100.0%) | 0 (0.0%) |
| 3 or 4 Children | 0 (0.0%) | 2 (100.0%) |
| 5 or more Children | 0 (0.0%) | 0 (0.0%) |
| Total | 68 (93.1%) | 5 (6.9%) |
Income Below Poverty Among Single-Parent Households in Lynnville
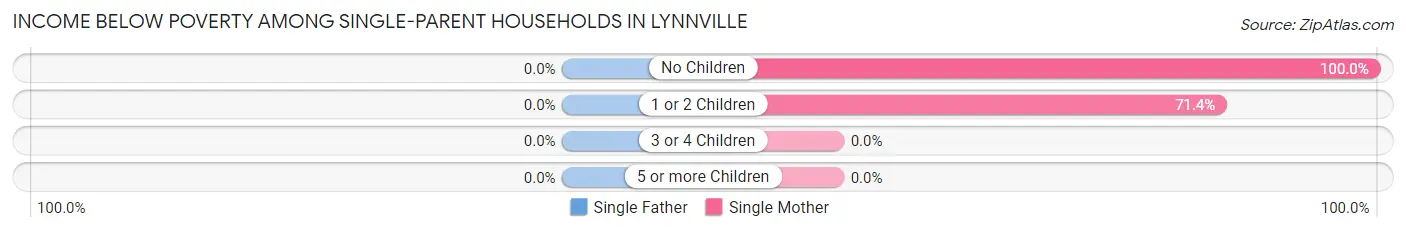
| Children | Single Father | Single Mother |
| No Children | 0 (0.0%) | 2 (100.0%) |
| 1 or 2 Children | 0 (0.0%) | 5 (71.4%) |
| 3 or 4 Children | 0 (0.0%) | 0 (0.0%) |
| 5 or more Children | 0 (0.0%) | 0 (0.0%) |
| Total | 0 (0.0%) | 7 (77.8%) |
Income Below Poverty Among Married-Couple vs Single-Parent Households in Lynnville
The poverty data for Lynnville shows that 5 of the married-couple family households (6.9%) and 7 of the single-parent households (70.0%) are living below the poverty level. Within the married-couple family households, those with 3 or 4 children have the highest poverty rate, with 2 households (100.0%) falling below the poverty line. Among the single-parent households, those with 1 or 2 children have the highest poverty rate, with 5 household (71.4%) living below poverty.
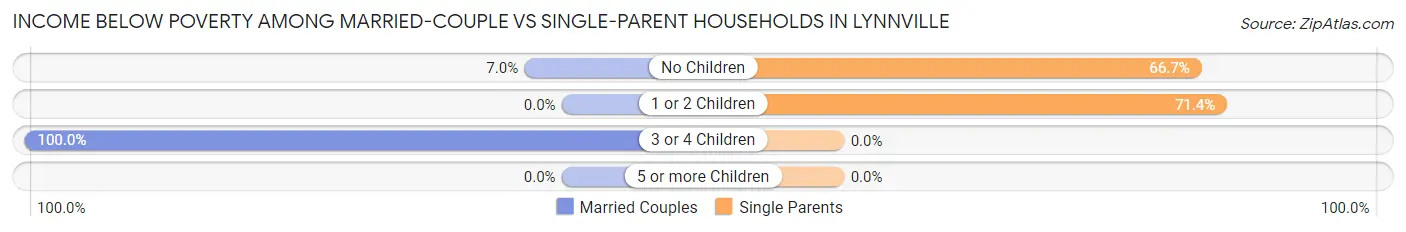
| Children | Married-Couple Families | Single-Parent Households |
| No Children | 3 (7.0%) | 2 (66.7%) |
| 1 or 2 Children | 0 (0.0%) | 5 (71.4%) |
| 3 or 4 Children | 2 (100.0%) | 0 (0.0%) |
| 5 or more Children | 0 (0.0%) | 0 (0.0%) |
| Total | 5 (6.9%) | 7 (70.0%) |
Race in Lynnville
The most populous races in Lynnville are White / Caucasian (355 | 92.9%), Two or more Races (20 | 5.2%), and Black / African American (4 | 1.1%).
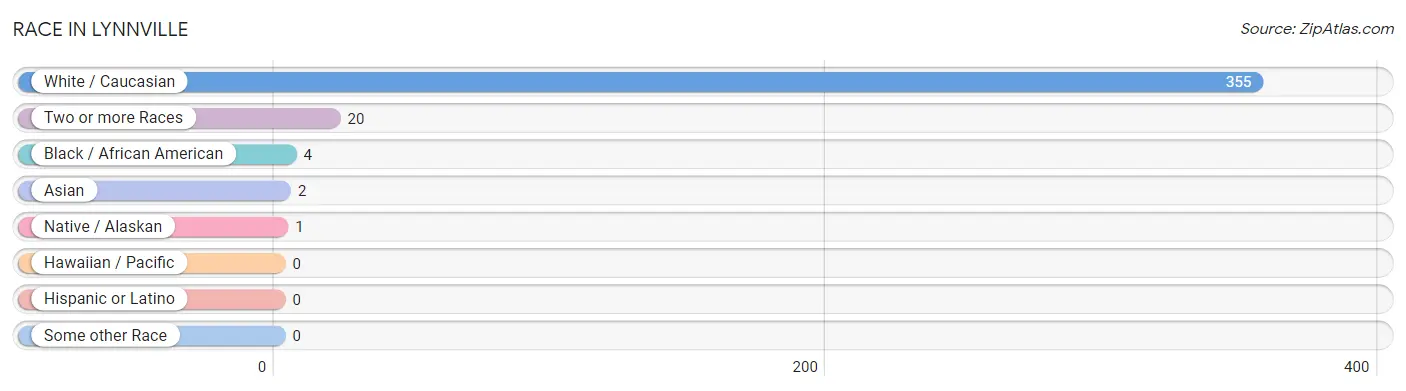
| Race | # Population | % Population |
| Asian | 2 | 0.5% |
| Black / African American | 4 | 1.1% |
| Hawaiian / Pacific | 0 | 0.0% |
| Hispanic or Latino | 0 | 0.0% |
| Native / Alaskan | 1 | 0.3% |
| White / Caucasian | 355 | 92.9% |
| Two or more Races | 20 | 5.2% |
| Some other Race | 0 | 0.0% |
| Total | 382 | 100.0% |
Ancestry in Lynnville
The most populous ancestries reported in Lynnville are English (106 | 27.8%), American (53 | 13.9%), German (53 | 13.9%), Scotch-Irish (38 | 10.0%), and Irish (20 | 5.2%), together accounting for 70.7% of all Lynnville residents.
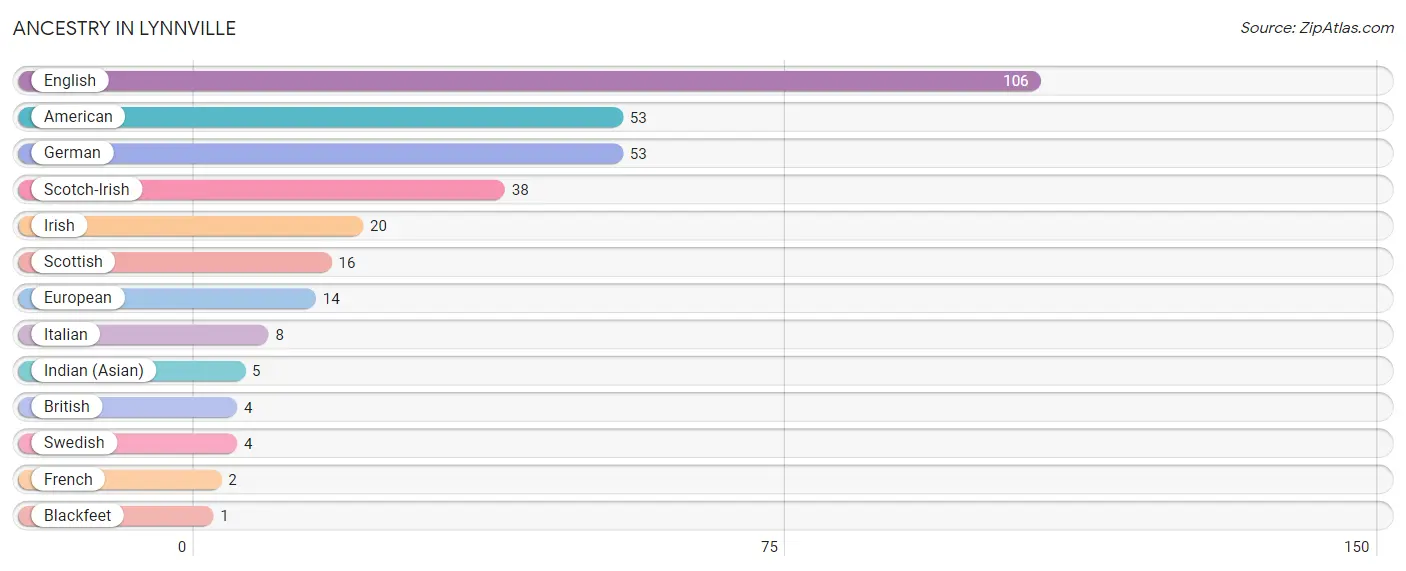
| Ancestry | # Population | % Population |
| American | 53 | 13.9% |
| Blackfeet | 1 | 0.3% |
| British | 4 | 1.1% |
| English | 106 | 27.8% |
| European | 14 | 3.7% |
| French | 2 | 0.5% |
| German | 53 | 13.9% |
| Indian (Asian) | 5 | 1.3% |
| Irish | 20 | 5.2% |
| Italian | 8 | 2.1% |
| Scotch-Irish | 38 | 10.0% |
| Scottish | 16 | 4.2% |
| Swedish | 4 | 1.1% | View All 13 Rows |
Immigrants in Lynnville
The most numerous immigrant groups reported in Lynnville came from Europe (2 | 0.5%), Italy (2 | 0.5%), and Southern Europe (2 | 0.5%), together accounting for 1.6% of all Lynnville residents.
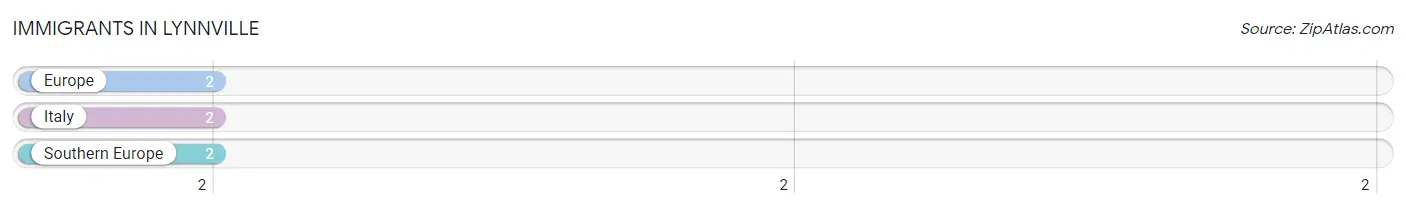
| Immigration Origin | # Population | % Population |
| Europe | 2 | 0.5% |
| Italy | 2 | 0.5% |
| Southern Europe | 2 | 0.5% | View All 3 Rows |
Sex and Age in Lynnville
Sex and Age in Lynnville
The most populous age groups in Lynnville are 60 to 64 Years (27 | 15.1%) for men and Under 5 Years (42 | 20.7%) for women.
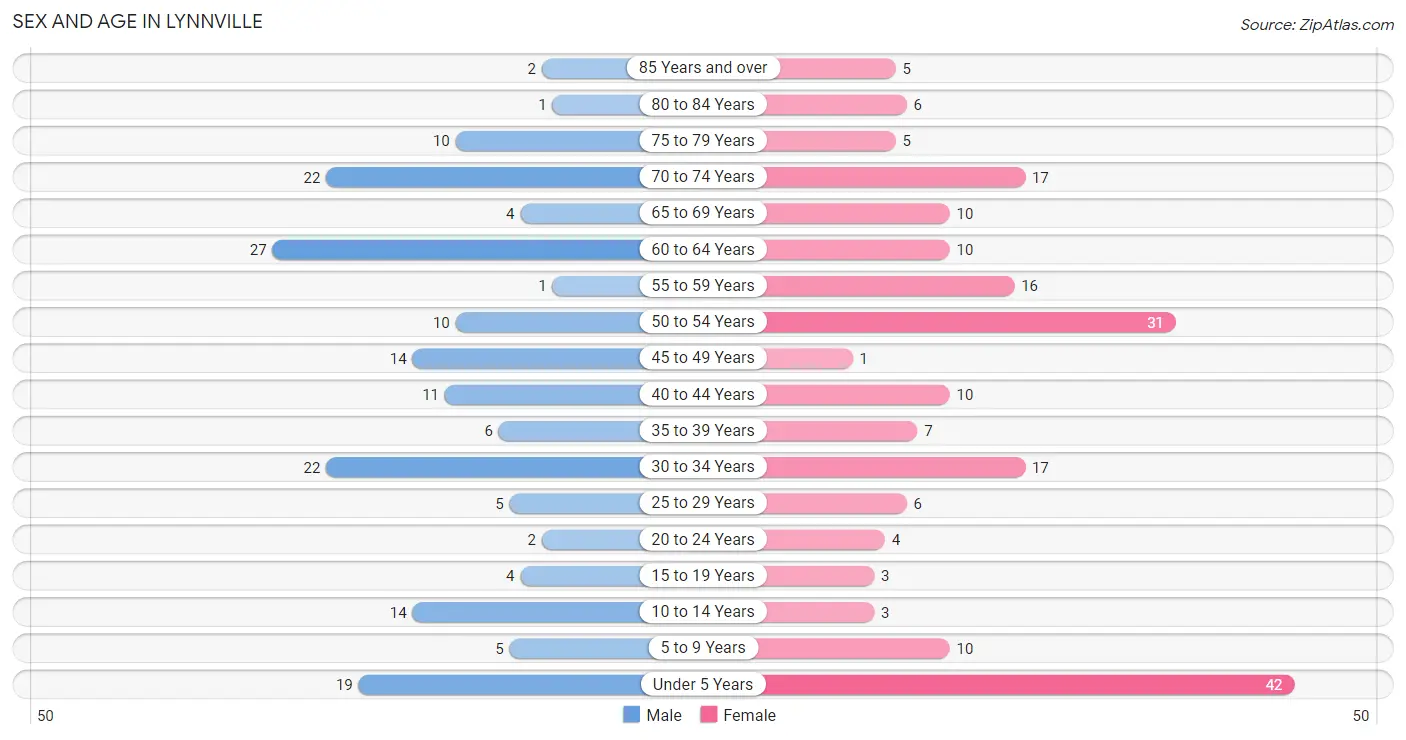
| Age Bracket | Male | Female |
| Under 5 Years | 19 (10.6%) | 42 (20.7%) |
| 5 to 9 Years | 5 (2.8%) | 10 (4.9%) |
| 10 to 14 Years | 14 (7.8%) | 3 (1.5%) |
| 15 to 19 Years | 4 (2.2%) | 3 (1.5%) |
| 20 to 24 Years | 2 (1.1%) | 4 (2.0%) |
| 25 to 29 Years | 5 (2.8%) | 6 (3.0%) |
| 30 to 34 Years | 22 (12.3%) | 17 (8.4%) |
| 35 to 39 Years | 6 (3.4%) | 7 (3.5%) |
| 40 to 44 Years | 11 (6.1%) | 10 (4.9%) |
| 45 to 49 Years | 14 (7.8%) | 1 (0.5%) |
| 50 to 54 Years | 10 (5.6%) | 31 (15.3%) |
| 55 to 59 Years | 1 (0.6%) | 16 (7.9%) |
| 60 to 64 Years | 27 (15.1%) | 10 (4.9%) |
| 65 to 69 Years | 4 (2.2%) | 10 (4.9%) |
| 70 to 74 Years | 22 (12.3%) | 17 (8.4%) |
| 75 to 79 Years | 10 (5.6%) | 5 (2.5%) |
| 80 to 84 Years | 1 (0.6%) | 6 (3.0%) |
| 85 Years and over | 2 (1.1%) | 5 (2.5%) |
| Total | 179 (100.0%) | 203 (100.0%) |
Families and Households in Lynnville
Median Family Size in Lynnville
The median family size in Lynnville is 3.40 persons per family, with married-couple families (73 | 87.9%) accounting for the largest median family size of 3.41 persons per family. On the other hand, single male/father families (1 | 1.2%) represent the smallest median family size with 3.00 persons per family.
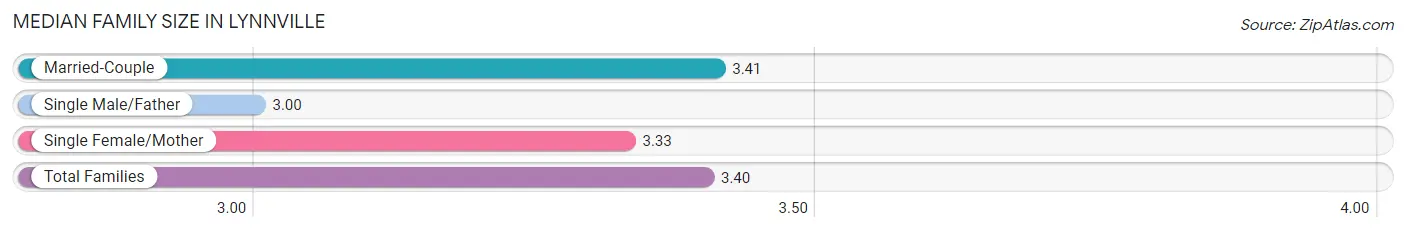
| Family Type | # Families | Family Size |
| Married-Couple | 73 (87.9%) | 3.41 |
| Single Male/Father | 1 (1.2%) | 3.00 |
| Single Female/Mother | 9 (10.8%) | 3.33 |
| Total Families | 83 (100.0%) | 3.40 |
Median Household Size in Lynnville
The median household size in Lynnville is 2.22 persons per household, with single female/mother households (9 | 5.2%) accounting for the largest median household size of 4.44 persons per household. non-family households (89 | 51.7%) represent the smallest median household size with 1.01 persons per household.
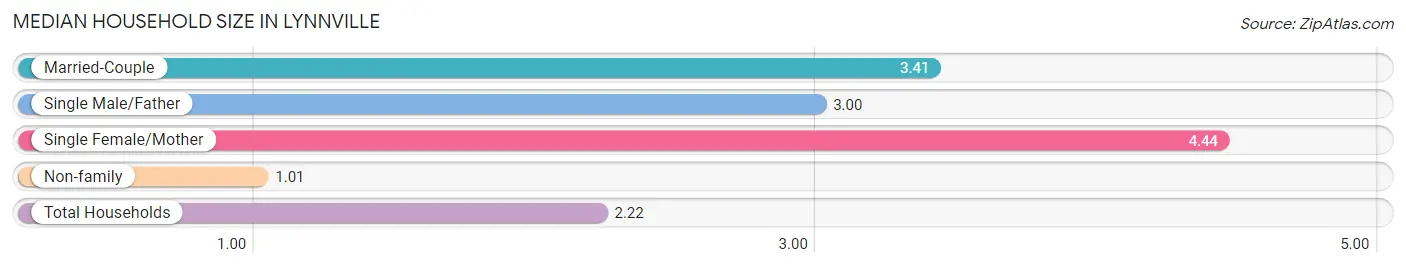
| Household Type | # Households | Household Size |
| Married-Couple | 73 (42.4%) | 3.41 |
| Single Male/Father | 1 (0.6%) | 3.00 |
| Single Female/Mother | 9 (5.2%) | 4.44 |
| Non-family | 89 (51.7%) | 1.01 |
| Total Households | 172 (100.0%) | 2.22 |
Household Size by Marriage Status in Lynnville
Out of a total of 172 households in Lynnville, 83 (48.3%) are family households, while 89 (51.7%) are nonfamily households. The most numerous type of family households are 2-person households, comprising 42, and the most common type of nonfamily households are 1-person households, comprising 87.
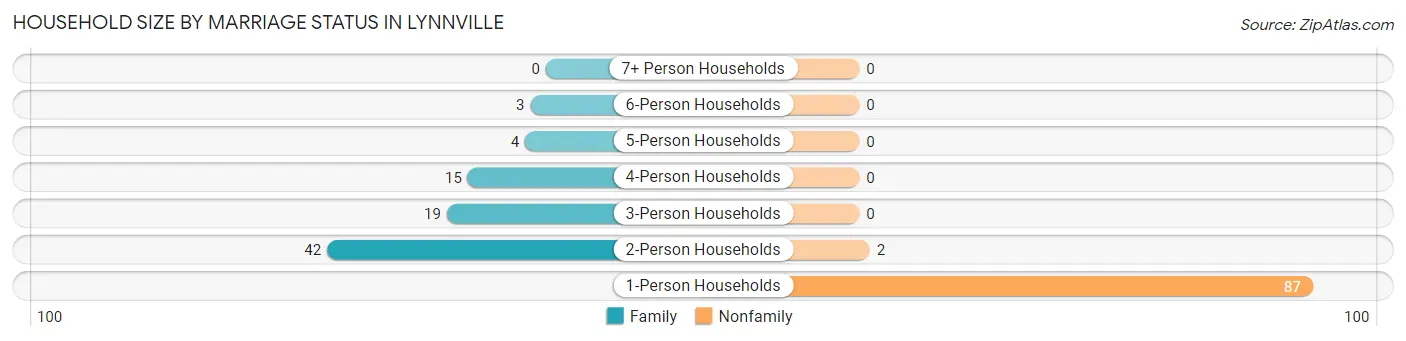
| Household Size | Family Households | Nonfamily Households |
| 1-Person Households | - | 87 (50.6%) |
| 2-Person Households | 42 (24.4%) | 2 (1.2%) |
| 3-Person Households | 19 (11.1%) | 0 (0.0%) |
| 4-Person Households | 15 (8.7%) | 0 (0.0%) |
| 5-Person Households | 4 (2.3%) | 0 (0.0%) |
| 6-Person Households | 3 (1.7%) | 0 (0.0%) |
| 7+ Person Households | 0 (0.0%) | 0 (0.0%) |
| Total | 83 (48.3%) | 89 (51.7%) |
Female Fertility in Lynnville
Fertility by Age in Lynnville
Average fertility rate in Lynnville is 167.0 births per 1,000 women. Women in the age bracket of 20 to 34 years have the highest fertility rate with 296.0 births per 1,000 women. Women in the age bracket of 20 to 34 years acount for 100.0% of all women with births.
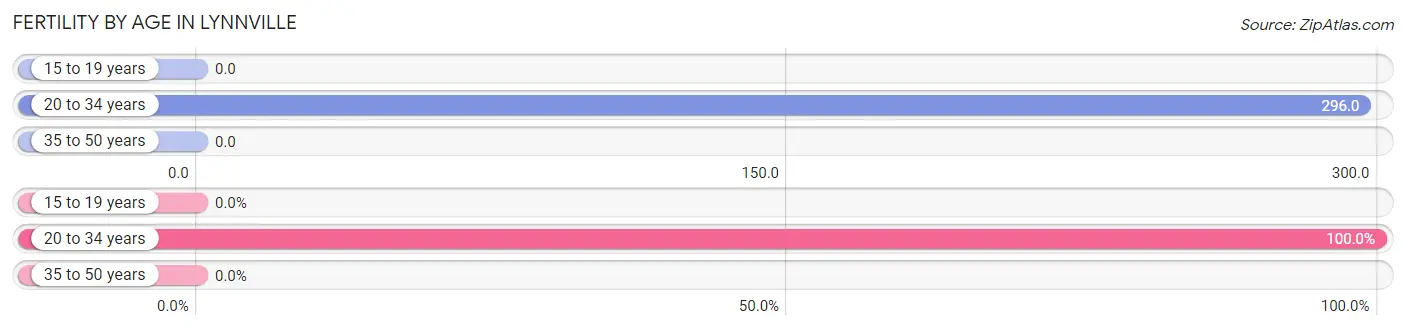
| Age Bracket | Women with Births | Births / 1,000 Women |
| 15 to 19 years | 0 (0.0%) | 0.0 |
| 20 to 34 years | 8 (100.0%) | 296.0 |
| 35 to 50 years | 0 (0.0%) | 0.0 |
| Total | 8 (100.0%) | 167.0 |
Fertility by Age by Marriage Status in Lynnville
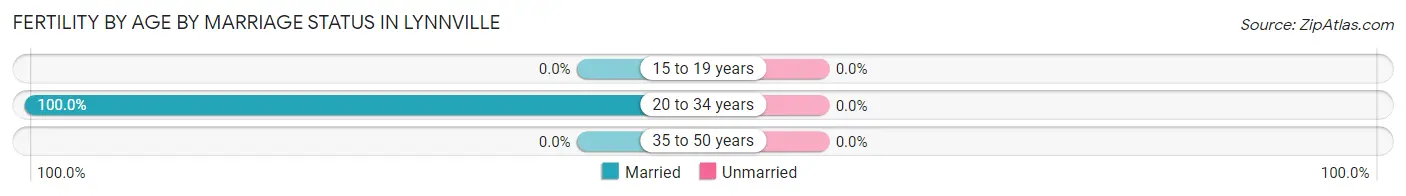
| Age Bracket | Married | Unmarried |
| 15 to 19 years | 0 (0.0%) | 0 (0.0%) |
| 20 to 34 years | 8 (100.0%) | 0 (0.0%) |
| 35 to 50 years | 0 (0.0%) | 0 (0.0%) |
| Total | 8 (100.0%) | 0 (0.0%) |
Fertility by Education in Lynnville
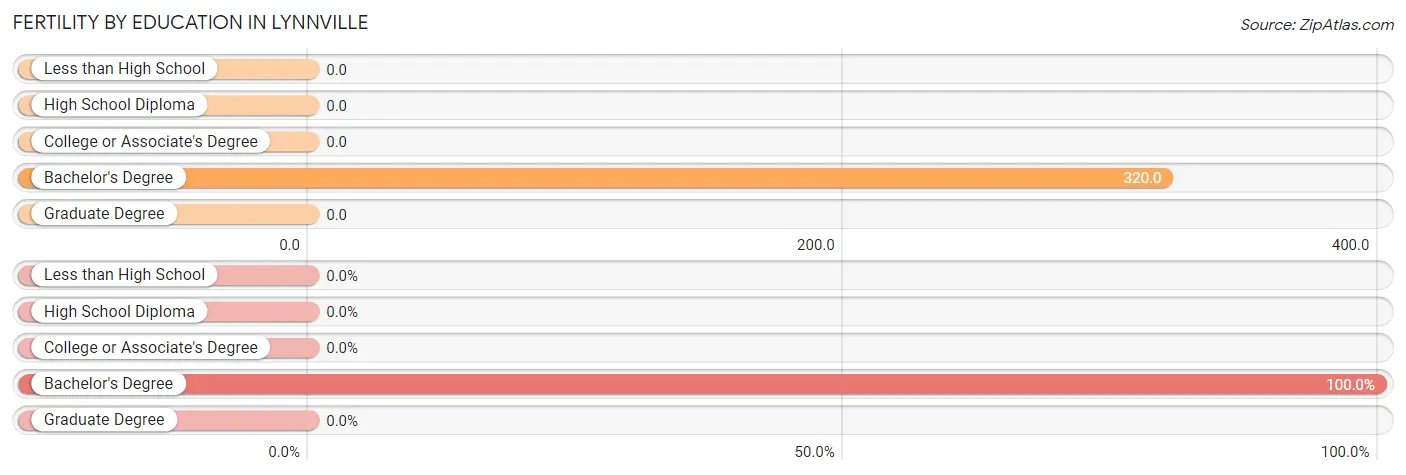
| Educational Attainment | Women with Births | Births / 1,000 Women |
| Less than High School | 0 (0.0%) | 0.0 |
| High School Diploma | 0 (0.0%) | 0.0 |
| College or Associate's Degree | 0 (0.0%) | 0.0 |
| Bachelor's Degree | 8 (100.0%) | 320.0 |
| Graduate Degree | 0 (0.0%) | 0.0 |
| Total | 8 (100.0%) | 167.0 |
Fertility by Education by Marriage Status in Lynnville
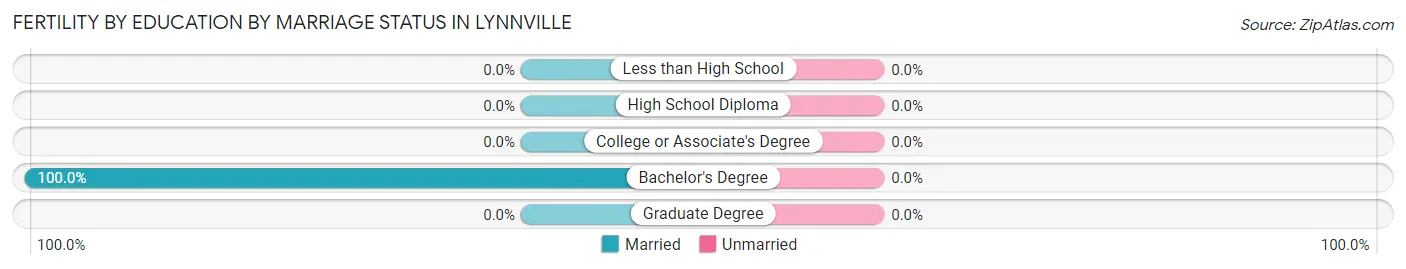
| Educational Attainment | Married | Unmarried |
| Less than High School | 0 (0.0%) | 0 (0.0%) |
| High School Diploma | 0 (0.0%) | 0 (0.0%) |
| College or Associate's Degree | 0 (0.0%) | 0 (0.0%) |
| Bachelor's Degree | 8 (100.0%) | 0 (0.0%) |
| Graduate Degree | 0 (0.0%) | 0 (0.0%) |
| Total | 8 (100.0%) | 0 (0.0%) |
Employment Characteristics in Lynnville
Employment by Class of Employer in Lynnville
Among the 145 employed individuals in Lynnville, private company employees (103 | 71.0%), self-employed (not incorporated) (16 | 11.0%), and not-for-profit organizations (15 | 10.3%) make up the most common classes of employment.
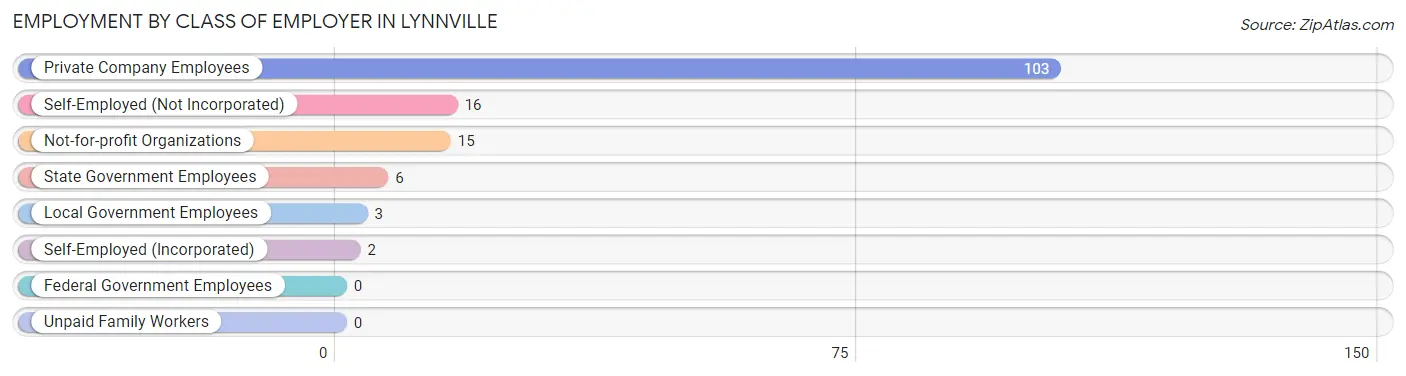
| Employer Class | # Employees | % Employees |
| Private Company Employees | 103 | 71.0% |
| Self-Employed (Incorporated) | 2 | 1.4% |
| Self-Employed (Not Incorporated) | 16 | 11.0% |
| Not-for-profit Organizations | 15 | 10.3% |
| Local Government Employees | 3 | 2.1% |
| State Government Employees | 6 | 4.1% |
| Federal Government Employees | 0 | 0.0% |
| Unpaid Family Workers | 0 | 0.0% |
| Total | 145 | 100.0% |
Employment Status by Age in Lynnville
According to the labor force statistics for Lynnville, out of the total population over 16 years of age (289), 61.2% or 177 individuals are in the labor force, with 15.3% or 27 of them unemployed. The age group with the highest labor force participation rate is 25 to 29 years, with 100.0% or 11 individuals in the labor force. Within the labor force, the 45 to 54 years age range has the highest percentage of unemployed individuals, with 47.2% or 25 of them being unemployed.
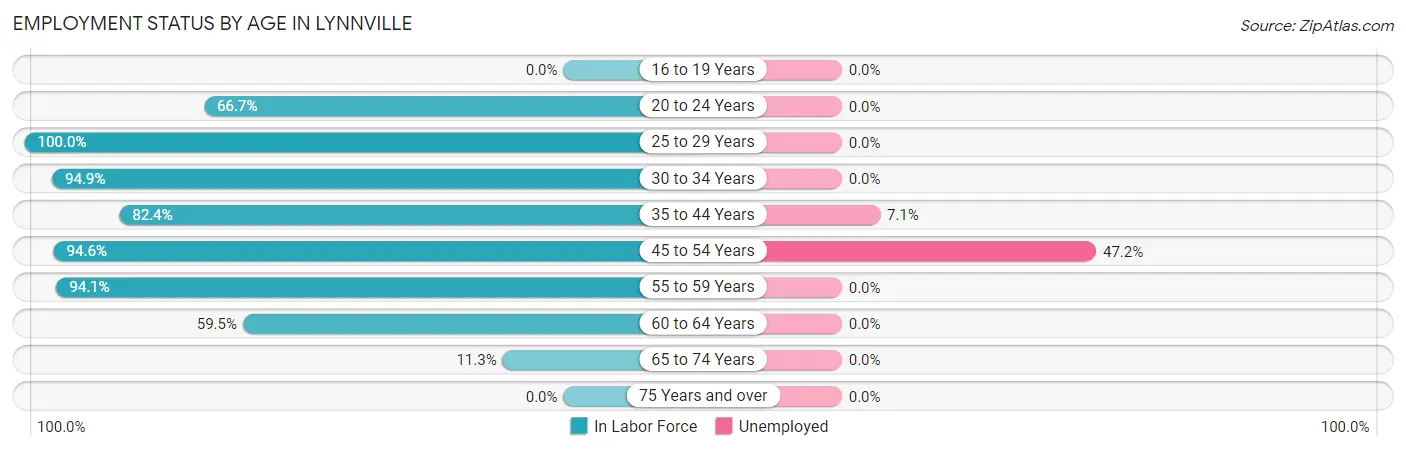
| Age Bracket | In Labor Force | Unemployed |
| 16 to 19 Years | 0 (0.0%) | 0 (0.0%) |
| 20 to 24 Years | 4 (66.7%) | 0 (0.0%) |
| 25 to 29 Years | 11 (100.0%) | 0 (0.0%) |
| 30 to 34 Years | 37 (94.9%) | 0 (0.0%) |
| 35 to 44 Years | 28 (82.4%) | 2 (7.1%) |
| 45 to 54 Years | 53 (94.6%) | 25 (47.2%) |
| 55 to 59 Years | 16 (94.1%) | 0 (0.0%) |
| 60 to 64 Years | 22 (59.5%) | 0 (0.0%) |
| 65 to 74 Years | 6 (11.3%) | 0 (0.0%) |
| 75 Years and over | 0 (0.0%) | 0 (0.0%) |
| Total | 177 (61.2%) | 27 (15.3%) |
Employment Status by Educational Attainment in Lynnville
According to labor force statistics for Lynnville, 86.1% of individuals (167) out of the total population between 25 and 64 years of age (194) are in the labor force, with 16.2% or 27 of them being unemployed. The group with the highest labor force participation rate are those with the educational attainment of bachelor's degree or higher, with 98.9% or 93 individuals in the labor force. Within the labor force, individuals with bachelor's degree or higher education have the highest percentage of unemployment, with 26.9% or 25 of them being unemployed.
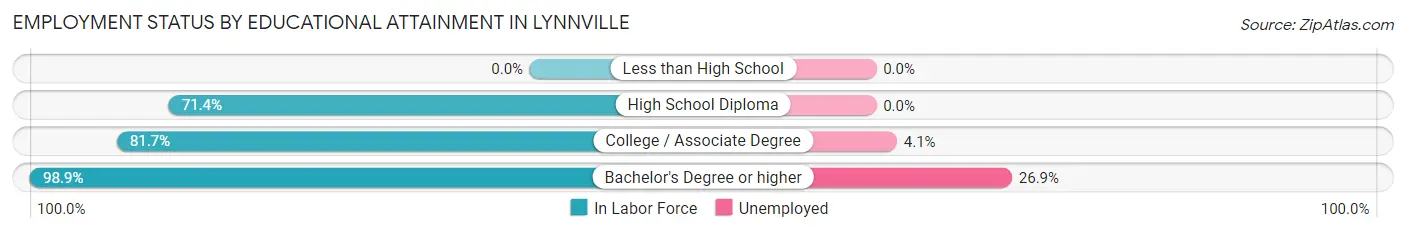
| Educational Attainment | In Labor Force | Unemployed |
| Less than High School | 0 (0.0%) | 0 (0.0%) |
| High School Diploma | 25 (71.4%) | 0 (0.0%) |
| College / Associate Degree | 49 (81.7%) | 2 (4.1%) |
| Bachelor's Degree or higher | 93 (98.9%) | 25 (26.9%) |
| Total | 167 (86.1%) | 31 (16.2%) |
Employment Occupations by Sex in Lynnville
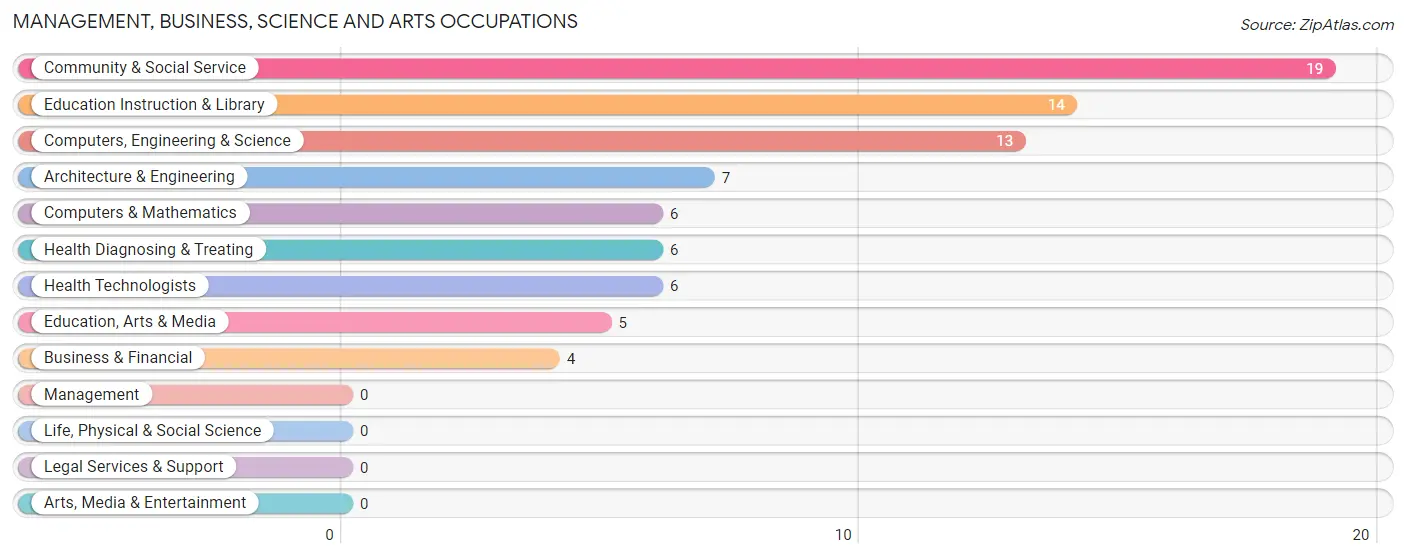
Management, Business, Science and Arts Occupations
The most common Management, Business, Science and Arts occupations in Lynnville are Community & Social Service (19 | 12.7%), Education Instruction & Library (14 | 9.3%), Computers, Engineering & Science (13 | 8.7%), Architecture & Engineering (7 | 4.7%), and Computers & Mathematics (6 | 4.0%).
Management, Business, Science and Arts Occupations by Sex
Within the Management, Business, Science and Arts occupations in Lynnville, the most male-oriented occupations are Architecture & Engineering (100.0%), Education, Arts & Media (100.0%), and Computers, Engineering & Science (69.2%), while the most female-oriented occupations are Business & Financial (100.0%), Health Diagnosing & Treating (100.0%), and Health Technologists (100.0%).
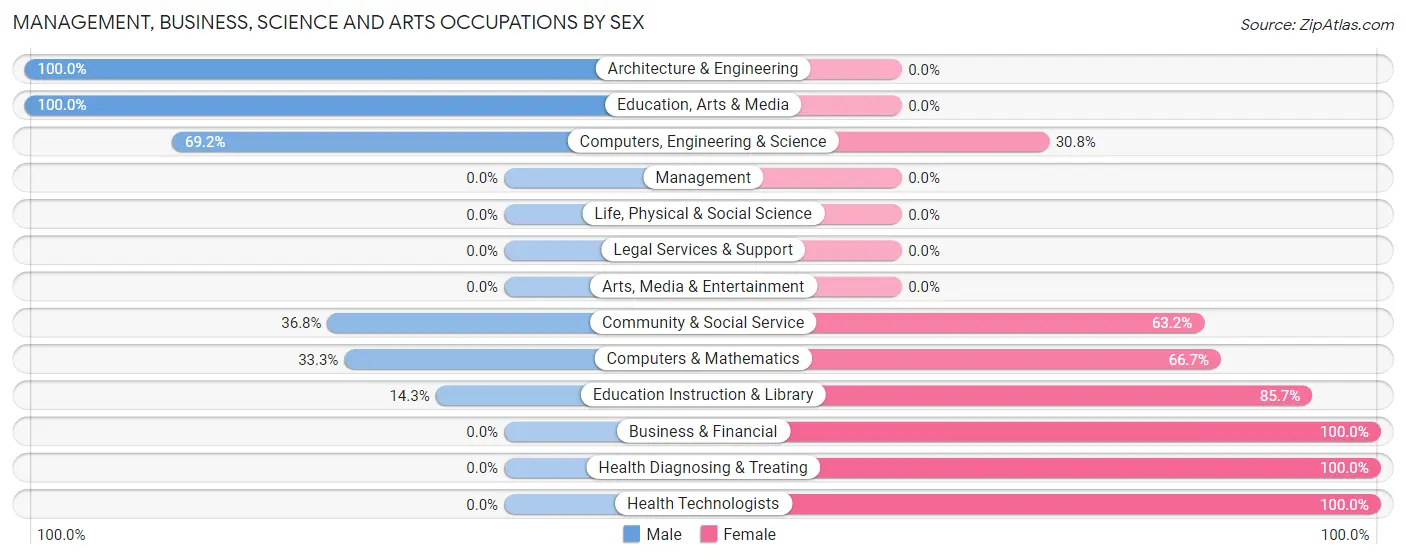
| Occupation | Male | Female |
| Management | 0 (0.0%) | 0 (0.0%) |
| Business & Financial | 0 (0.0%) | 4 (100.0%) |
| Computers, Engineering & Science | 9 (69.2%) | 4 (30.8%) |
| Computers & Mathematics | 2 (33.3%) | 4 (66.7%) |
| Architecture & Engineering | 7 (100.0%) | 0 (0.0%) |
| Life, Physical & Social Science | 0 (0.0%) | 0 (0.0%) |
| Community & Social Service | 7 (36.8%) | 12 (63.2%) |
| Education, Arts & Media | 5 (100.0%) | 0 (0.0%) |
| Legal Services & Support | 0 (0.0%) | 0 (0.0%) |
| Education Instruction & Library | 2 (14.3%) | 12 (85.7%) |
| Arts, Media & Entertainment | 0 (0.0%) | 0 (0.0%) |
| Health Diagnosing & Treating | 0 (0.0%) | 6 (100.0%) |
| Health Technologists | 0 (0.0%) | 6 (100.0%) |
| Total (Category) | 16 (38.1%) | 26 (61.9%) |
| Total (Overall) | 86 (57.3%) | 64 (42.7%) |
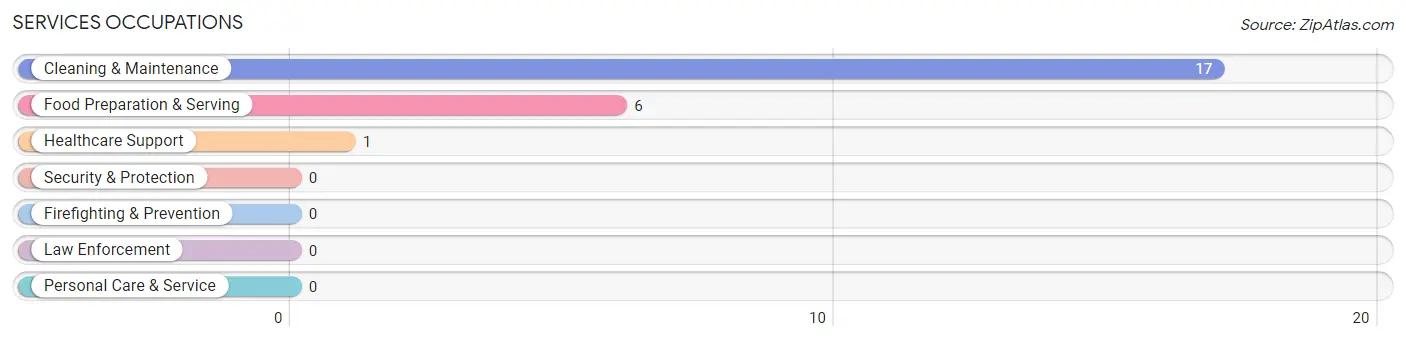
Services Occupations
The most common Services occupations in Lynnville are Cleaning & Maintenance (17 | 11.3%), Food Preparation & Serving (6 | 4.0%), and Healthcare Support (1 | 0.7%).
Services Occupations by Sex
Within the Services occupations in Lynnville, the most male-oriented occupations are Cleaning & Maintenance (64.7%), and Food Preparation & Serving (16.7%), while the most female-oriented occupations are Healthcare Support (100.0%), Food Preparation & Serving (83.3%), and Cleaning & Maintenance (35.3%).
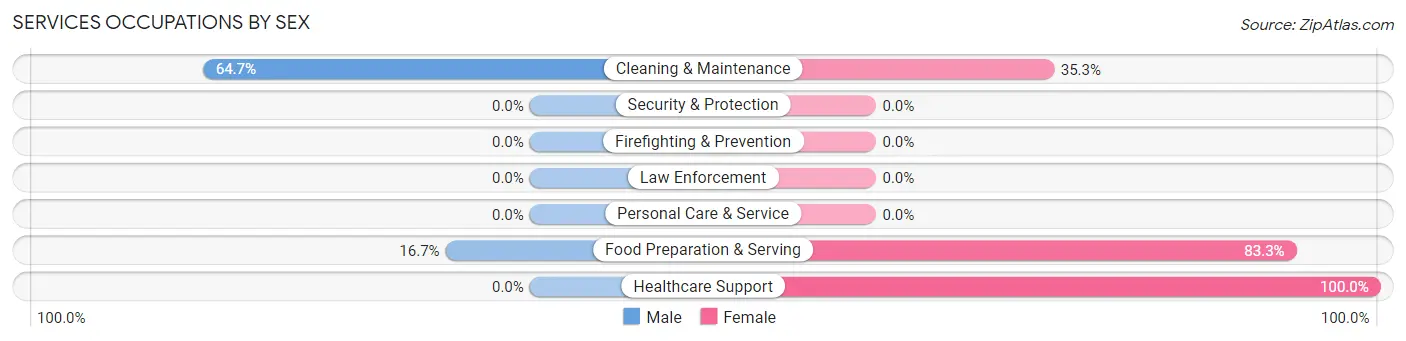
| Occupation | Male | Female |
| Healthcare Support | 0 (0.0%) | 1 (100.0%) |
| Security & Protection | 0 (0.0%) | 0 (0.0%) |
| Firefighting & Prevention | 0 (0.0%) | 0 (0.0%) |
| Law Enforcement | 0 (0.0%) | 0 (0.0%) |
| Food Preparation & Serving | 1 (16.7%) | 5 (83.3%) |
| Cleaning & Maintenance | 11 (64.7%) | 6 (35.3%) |
| Personal Care & Service | 0 (0.0%) | 0 (0.0%) |
| Total (Category) | 12 (50.0%) | 12 (50.0%) |
| Total (Overall) | 86 (57.3%) | 64 (42.7%) |
Sales and Office Occupations
The most common Sales and Office occupations in Lynnville are Sales & Related (22 | 14.7%), and Office & Administration (14 | 9.3%).
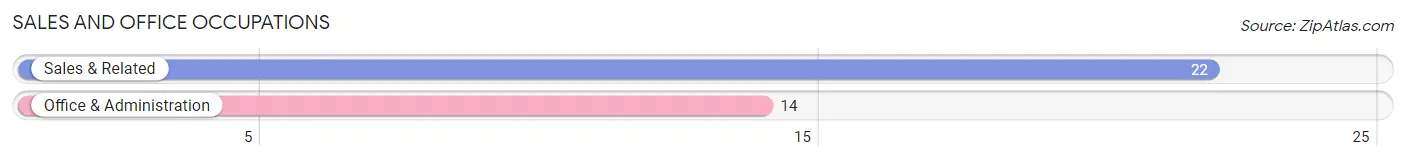
Sales and Office Occupations by Sex
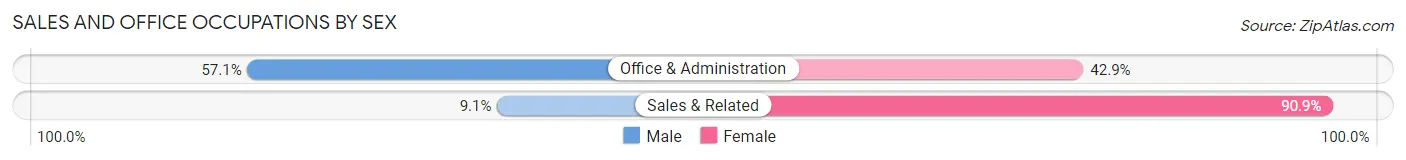
| Occupation | Male | Female |
| Sales & Related | 2 (9.1%) | 20 (90.9%) |
| Office & Administration | 8 (57.1%) | 6 (42.9%) |
| Total (Category) | 10 (27.8%) | 26 (72.2%) |
| Total (Overall) | 86 (57.3%) | 64 (42.7%) |
Natural Resources, Construction and Maintenance Occupations
The most common Natural Resources, Construction and Maintenance occupations in Lynnville are Installation, Maintenance & Repair (16 | 10.7%), Construction & Extraction (11 | 7.3%), and Farming, Fishing & Forestry (3 | 2.0%).
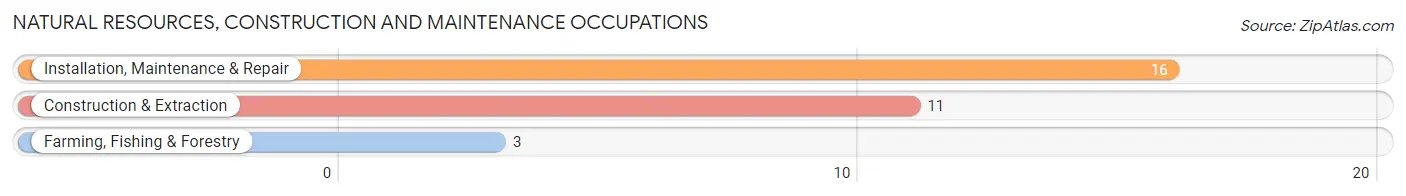
Natural Resources, Construction and Maintenance Occupations by Sex
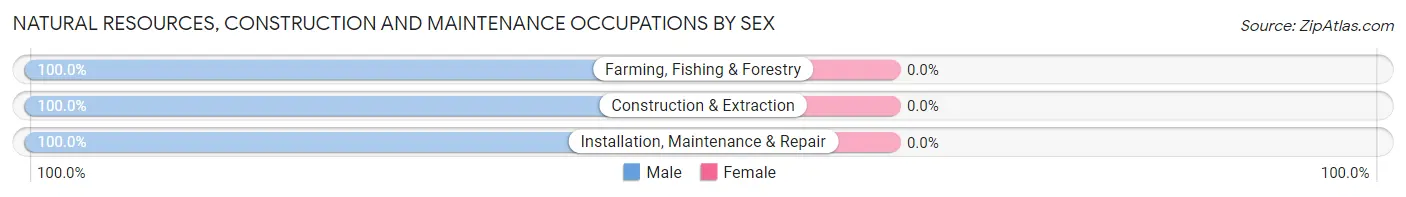
| Occupation | Male | Female |
| Farming, Fishing & Forestry | 3 (100.0%) | 0 (0.0%) |
| Construction & Extraction | 11 (100.0%) | 0 (0.0%) |
| Installation, Maintenance & Repair | 16 (100.0%) | 0 (0.0%) |
| Total (Category) | 30 (100.0%) | 0 (0.0%) |
| Total (Overall) | 86 (57.3%) | 64 (42.7%) |
Production, Transportation and Moving Occupations
The most common Production, Transportation and Moving occupations in Lynnville are Material Moving (10 | 6.7%), and Production (8 | 5.3%).
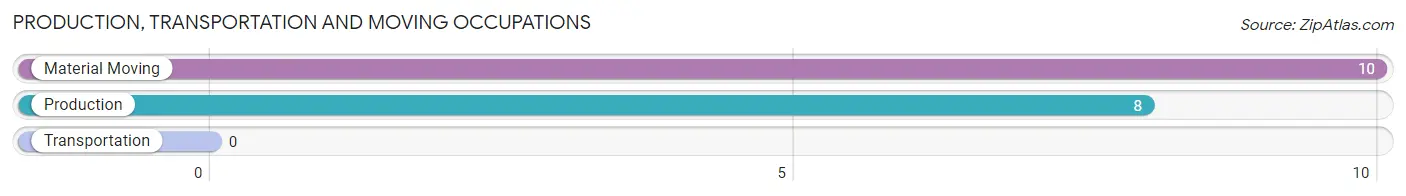
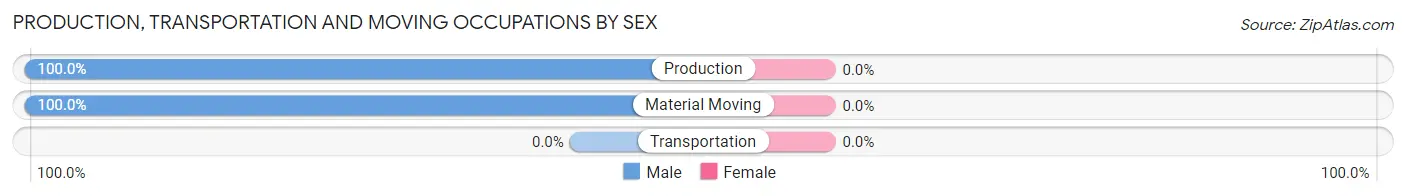
Production, Transportation and Moving Occupations by Sex
| Occupation | Male | Female |
| Production | 8 (100.0%) | 0 (0.0%) |
| Transportation | 0 (0.0%) | 0 (0.0%) |
| Material Moving | 10 (100.0%) | 0 (0.0%) |
| Total (Category) | 18 (100.0%) | 0 (0.0%) |
| Total (Overall) | 86 (57.3%) | 64 (42.7%) |
Employment Industries by Sex in Lynnville
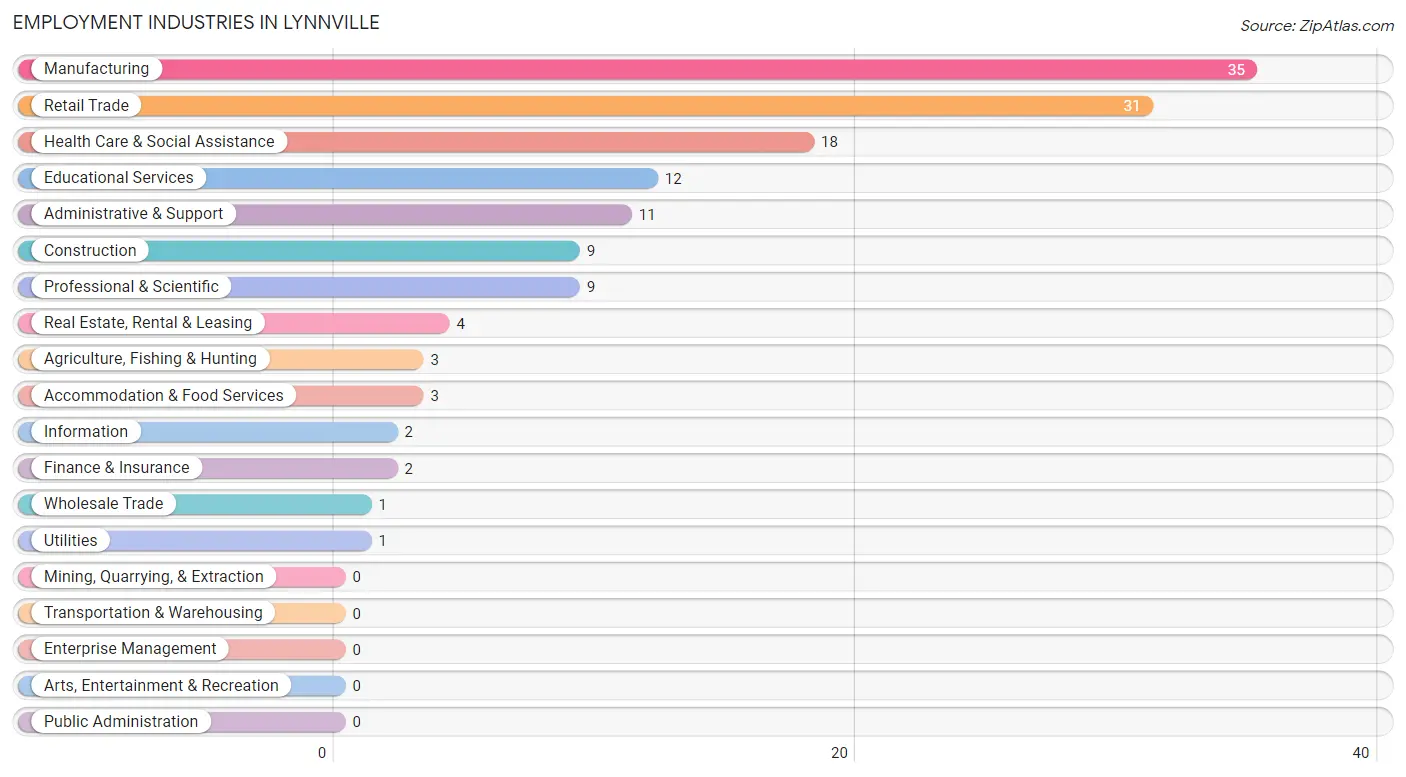
Employment Industries in Lynnville
The major employment industries in Lynnville include Manufacturing (35 | 23.3%), Retail Trade (31 | 20.7%), Health Care & Social Assistance (18 | 12.0%), Educational Services (12 | 8.0%), and Administrative & Support (11 | 7.3%).
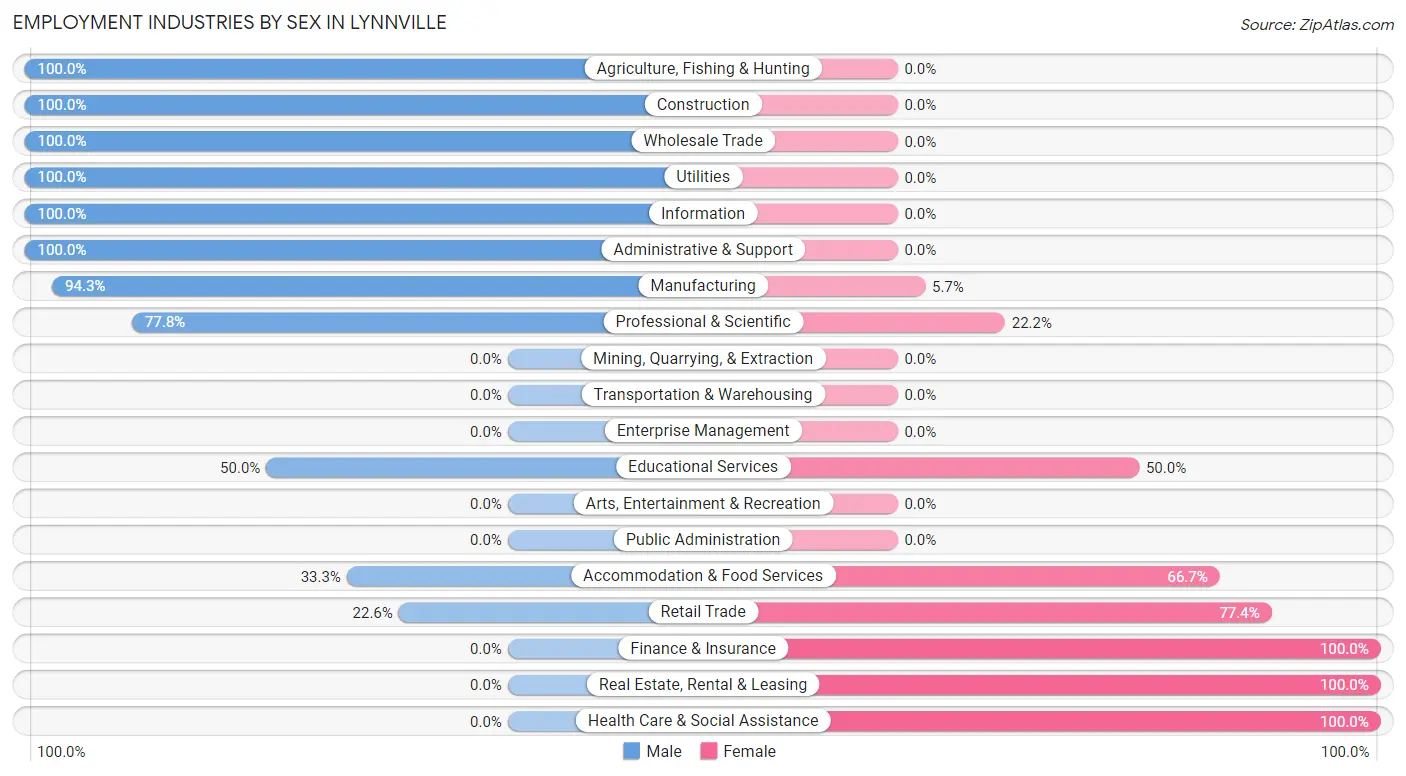
Employment Industries by Sex in Lynnville
The Lynnville industries that see more men than women are Agriculture, Fishing & Hunting (100.0%), Construction (100.0%), and Wholesale Trade (100.0%), whereas the industries that tend to have a higher number of women are Finance & Insurance (100.0%), Real Estate, Rental & Leasing (100.0%), and Health Care & Social Assistance (100.0%).
| Industry | Male | Female |
| Agriculture, Fishing & Hunting | 3 (100.0%) | 0 (0.0%) |
| Mining, Quarrying, & Extraction | 0 (0.0%) | 0 (0.0%) |
| Construction | 9 (100.0%) | 0 (0.0%) |
| Manufacturing | 33 (94.3%) | 2 (5.7%) |
| Wholesale Trade | 1 (100.0%) | 0 (0.0%) |
| Retail Trade | 7 (22.6%) | 24 (77.4%) |
| Transportation & Warehousing | 0 (0.0%) | 0 (0.0%) |
| Utilities | 1 (100.0%) | 0 (0.0%) |
| Information | 2 (100.0%) | 0 (0.0%) |
| Finance & Insurance | 0 (0.0%) | 2 (100.0%) |
| Real Estate, Rental & Leasing | 0 (0.0%) | 4 (100.0%) |
| Professional & Scientific | 7 (77.8%) | 2 (22.2%) |
| Enterprise Management | 0 (0.0%) | 0 (0.0%) |
| Administrative & Support | 11 (100.0%) | 0 (0.0%) |
| Educational Services | 6 (50.0%) | 6 (50.0%) |
| Health Care & Social Assistance | 0 (0.0%) | 18 (100.0%) |
| Arts, Entertainment & Recreation | 0 (0.0%) | 0 (0.0%) |
| Accommodation & Food Services | 1 (33.3%) | 2 (66.7%) |
| Public Administration | 0 (0.0%) | 0 (0.0%) |
| Total | 86 (57.3%) | 64 (42.7%) |
Education in Lynnville
School Enrollment in Lynnville
The most common levels of schooling among the 54 students in Lynnville are nursery / preschool (15 | 27.8%), middle school (15 | 27.8%), and elementary school (11 | 20.4%).
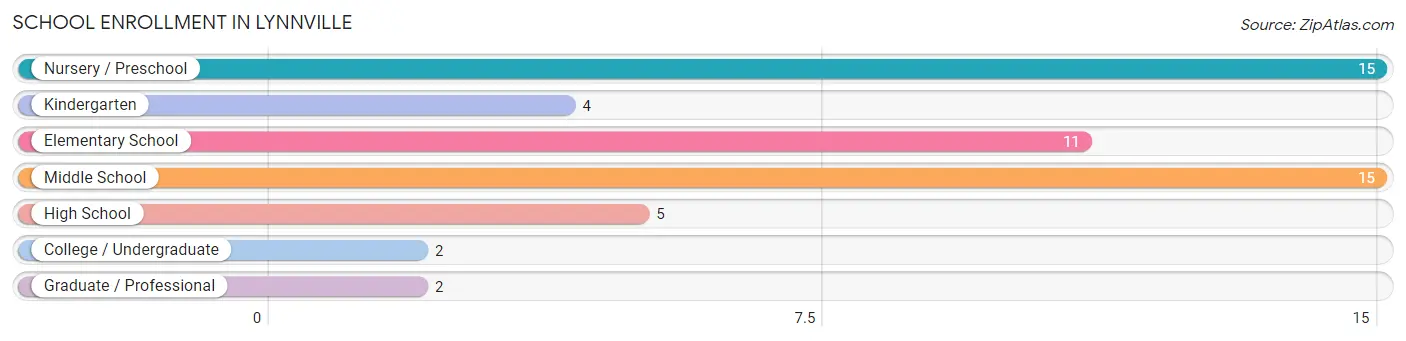
| School Level | # Students | % Students |
| Nursery / Preschool | 15 | 27.8% |
| Kindergarten | 4 | 7.4% |
| Elementary School | 11 | 20.4% |
| Middle School | 15 | 27.8% |
| High School | 5 | 9.3% |
| College / Undergraduate | 2 | 3.7% |
| Graduate / Professional | 2 | 3.7% |
| Total | 54 | 100.0% |
School Enrollment by Age by Funding Source in Lynnville
Out of a total of 54 students who are enrolled in schools in Lynnville, 18 (33.3%) attend a private institution, while the remaining 36 (66.7%) are enrolled in public schools. The age group of 18 to 19 year olds has the highest likelihood of being enrolled in private schools, with 2 (100.0% in the age bracket) enrolled. Conversely, the age group of 15 to 17 year olds has the lowest likelihood of being enrolled in a private school, with 5 (100.0% in the age bracket) attending a public institution.
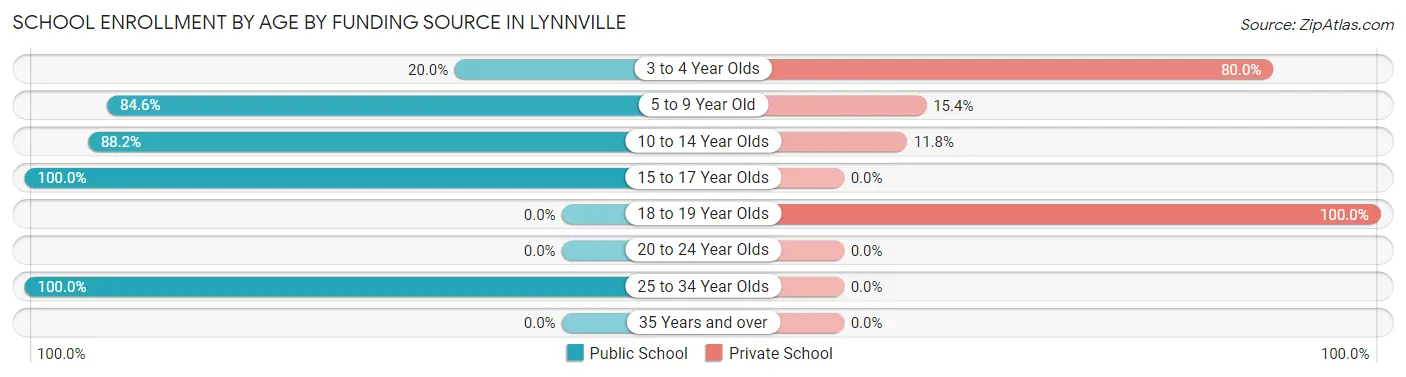
| Age Bracket | Public School | Private School |
| 3 to 4 Year Olds | 3 (20.0%) | 12 (80.0%) |
| 5 to 9 Year Old | 11 (84.6%) | 2 (15.4%) |
| 10 to 14 Year Olds | 15 (88.2%) | 2 (11.8%) |
| 15 to 17 Year Olds | 5 (100.0%) | 0 (0.0%) |
| 18 to 19 Year Olds | 0 (0.0%) | 2 (100.0%) |
| 20 to 24 Year Olds | 0 (0.0%) | 0 (0.0%) |
| 25 to 34 Year Olds | 2 (100.0%) | 0 (0.0%) |
| 35 Years and over | 0 (0.0%) | 0 (0.0%) |
| Total | 36 (66.7%) | 18 (33.3%) |
Educational Attainment by Field of Study in Lynnville
Physical & health sciences (25 | 21.9%), education (23 | 20.2%), business (15 | 13.2%), science & technology (12 | 10.5%), and liberal arts & history (11 | 9.7%) are the most common fields of study among 114 individuals in Lynnville who have obtained a bachelor's degree or higher.
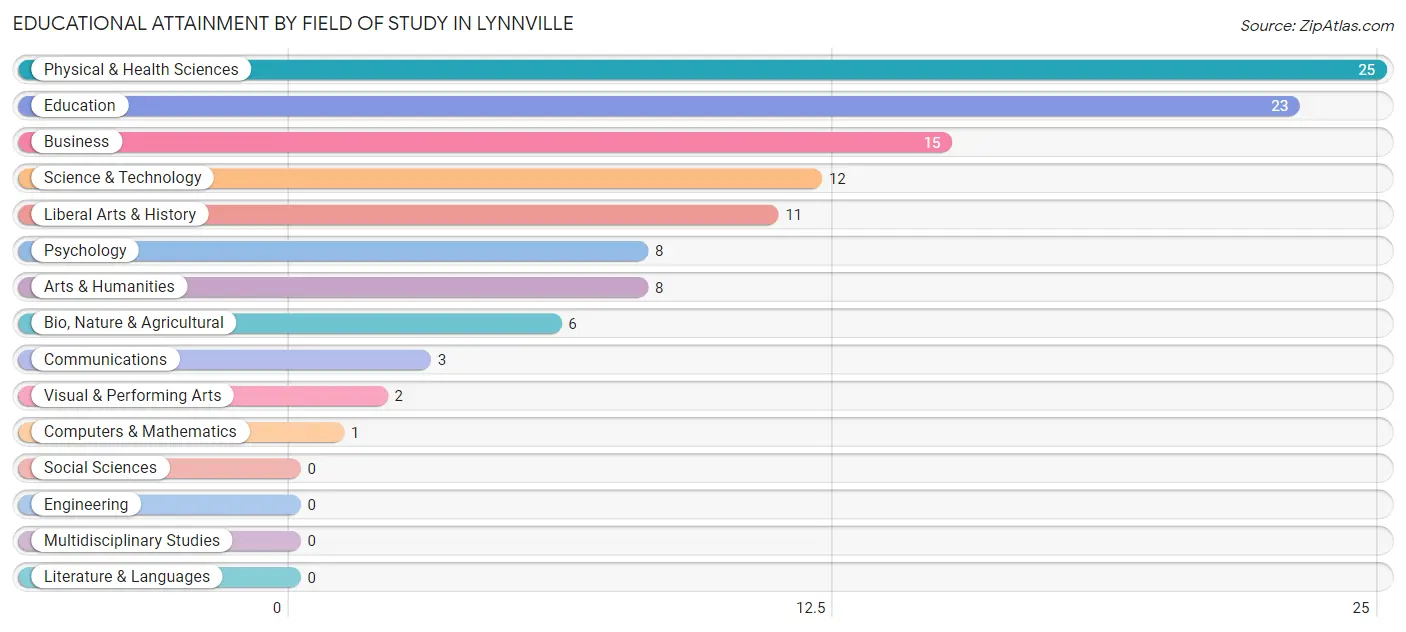
| Field of Study | # Graduates | % Graduates |
| Computers & Mathematics | 1 | 0.9% |
| Bio, Nature & Agricultural | 6 | 5.3% |
| Physical & Health Sciences | 25 | 21.9% |
| Psychology | 8 | 7.0% |
| Social Sciences | 0 | 0.0% |
| Engineering | 0 | 0.0% |
| Multidisciplinary Studies | 0 | 0.0% |
| Science & Technology | 12 | 10.5% |
| Business | 15 | 13.2% |
| Education | 23 | 20.2% |
| Literature & Languages | 0 | 0.0% |
| Liberal Arts & History | 11 | 9.7% |
| Visual & Performing Arts | 2 | 1.8% |
| Communications | 3 | 2.6% |
| Arts & Humanities | 8 | 7.0% |
| Total | 114 | 100.0% |
Transportation & Commute in Lynnville
Vehicle Availability by Sex in Lynnville
The most prevalent vehicle ownership categories in Lynnville are males with 2 vehicles (56, accounting for 69.1%) and females with 2 vehicles (33, making up 87.5%).
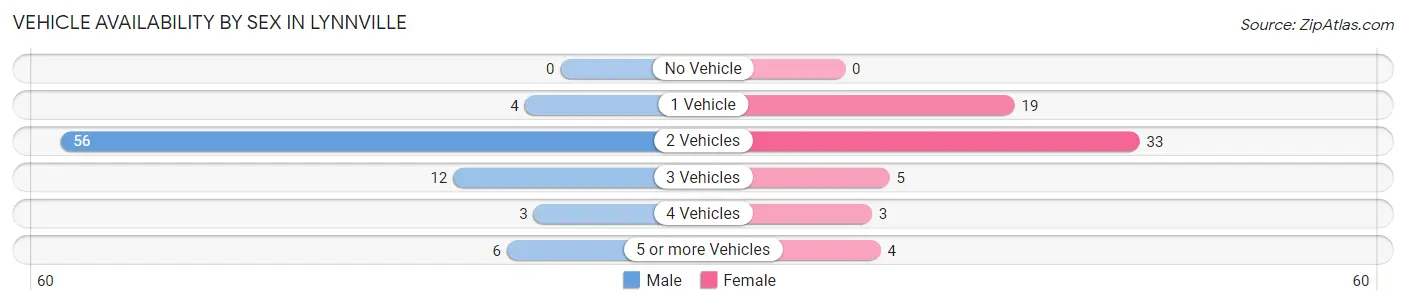
| Vehicles Available | Male | Female |
| No Vehicle | 0 (0.0%) | 0 (0.0%) |
| 1 Vehicle | 4 (4.9%) | 19 (29.7%) |
| 2 Vehicles | 56 (69.1%) | 33 (51.6%) |
| 3 Vehicles | 12 (14.8%) | 5 (7.8%) |
| 4 Vehicles | 3 (3.7%) | 3 (4.7%) |
| 5 or more Vehicles | 6 (7.4%) | 4 (6.2%) |
| Total | 81 (100.0%) | 64 (100.0%) |
Commute Time in Lynnville
The most frequently occuring commute durations in Lynnville are 30 to 34 minutes (35 commuters, 27.3%), 25 to 29 minutes (28 commuters, 21.9%), and 45 to 59 minutes (15 commuters, 11.7%).
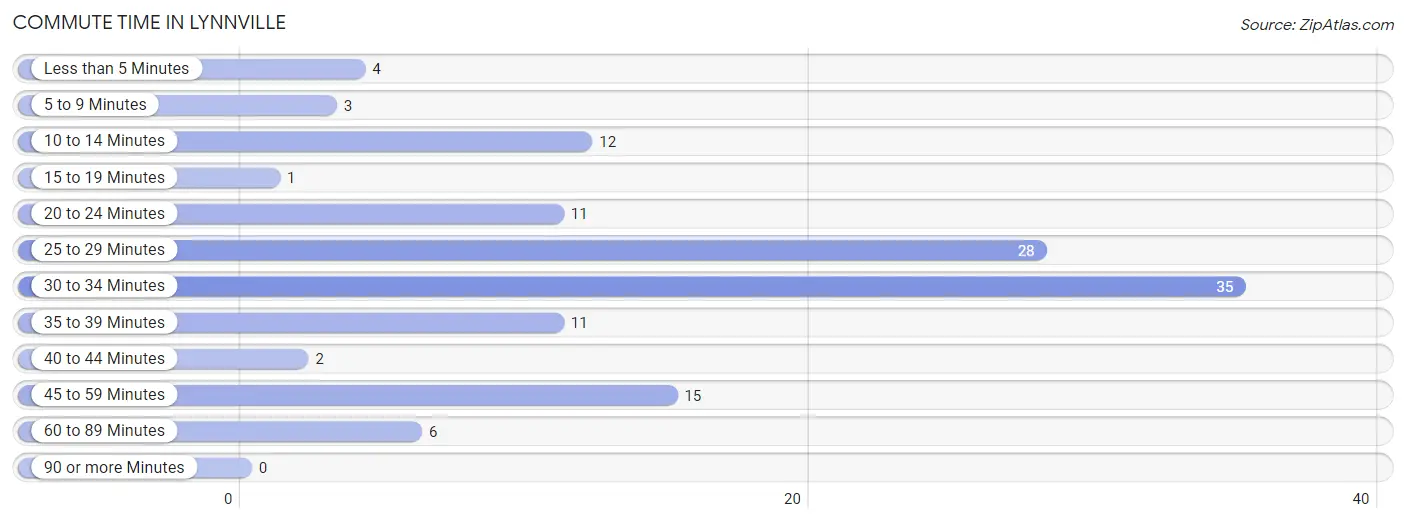
| Commute Time | # Commuters | % Commuters |
| Less than 5 Minutes | 4 | 3.1% |
| 5 to 9 Minutes | 3 | 2.3% |
| 10 to 14 Minutes | 12 | 9.4% |
| 15 to 19 Minutes | 1 | 0.8% |
| 20 to 24 Minutes | 11 | 8.6% |
| 25 to 29 Minutes | 28 | 21.9% |
| 30 to 34 Minutes | 35 | 27.3% |
| 35 to 39 Minutes | 11 | 8.6% |
| 40 to 44 Minutes | 2 | 1.6% |
| 45 to 59 Minutes | 15 | 11.7% |
| 60 to 89 Minutes | 6 | 4.7% |
| 90 or more Minutes | 0 | 0.0% |
Commute Time by Sex in Lynnville
The most common commute times in Lynnville are 25 to 29 minutes (20 commuters, 27.8%) for males and 30 to 34 minutes (17 commuters, 30.4%) for females.
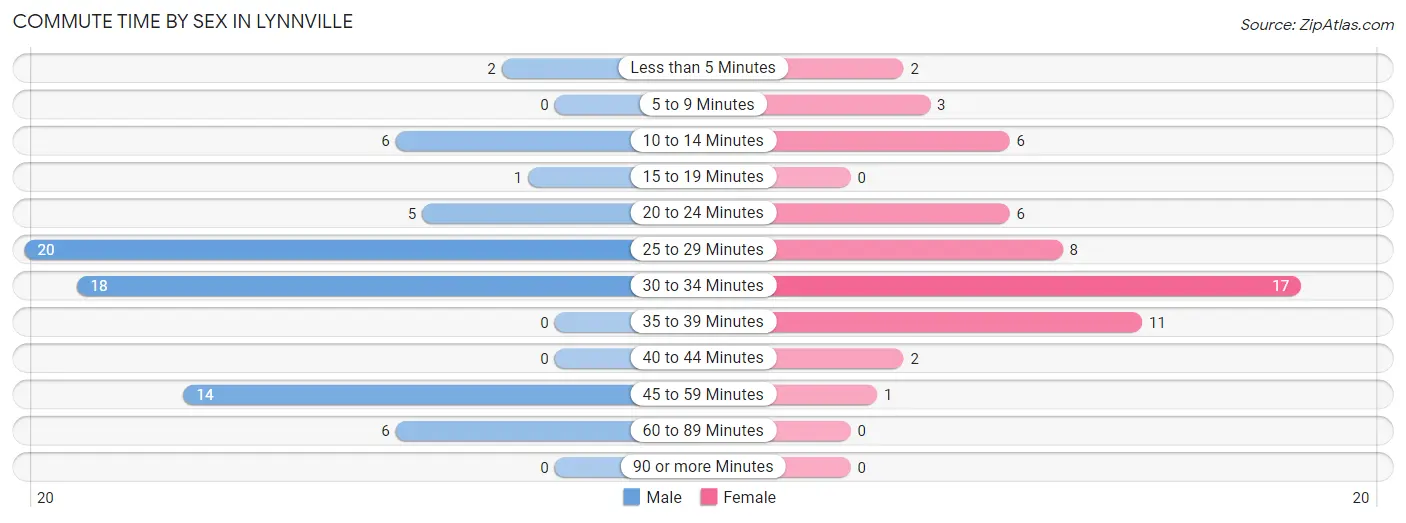
| Commute Time | Male | Female |
| Less than 5 Minutes | 2 (2.8%) | 2 (3.6%) |
| 5 to 9 Minutes | 0 (0.0%) | 3 (5.4%) |
| 10 to 14 Minutes | 6 (8.3%) | 6 (10.7%) |
| 15 to 19 Minutes | 1 (1.4%) | 0 (0.0%) |
| 20 to 24 Minutes | 5 (6.9%) | 6 (10.7%) |
| 25 to 29 Minutes | 20 (27.8%) | 8 (14.3%) |
| 30 to 34 Minutes | 18 (25.0%) | 17 (30.4%) |
| 35 to 39 Minutes | 0 (0.0%) | 11 (19.6%) |
| 40 to 44 Minutes | 0 (0.0%) | 2 (3.6%) |
| 45 to 59 Minutes | 14 (19.4%) | 1 (1.8%) |
| 60 to 89 Minutes | 6 (8.3%) | 0 (0.0%) |
| 90 or more Minutes | 0 (0.0%) | 0 (0.0%) |
Time of Departure to Work by Sex in Lynnville
The most frequent times of departure to work in Lynnville are 12:00 AM to 4:59 AM (19, 26.4%) for males and 7:00 AM to 7:29 AM (21, 37.5%) for females.
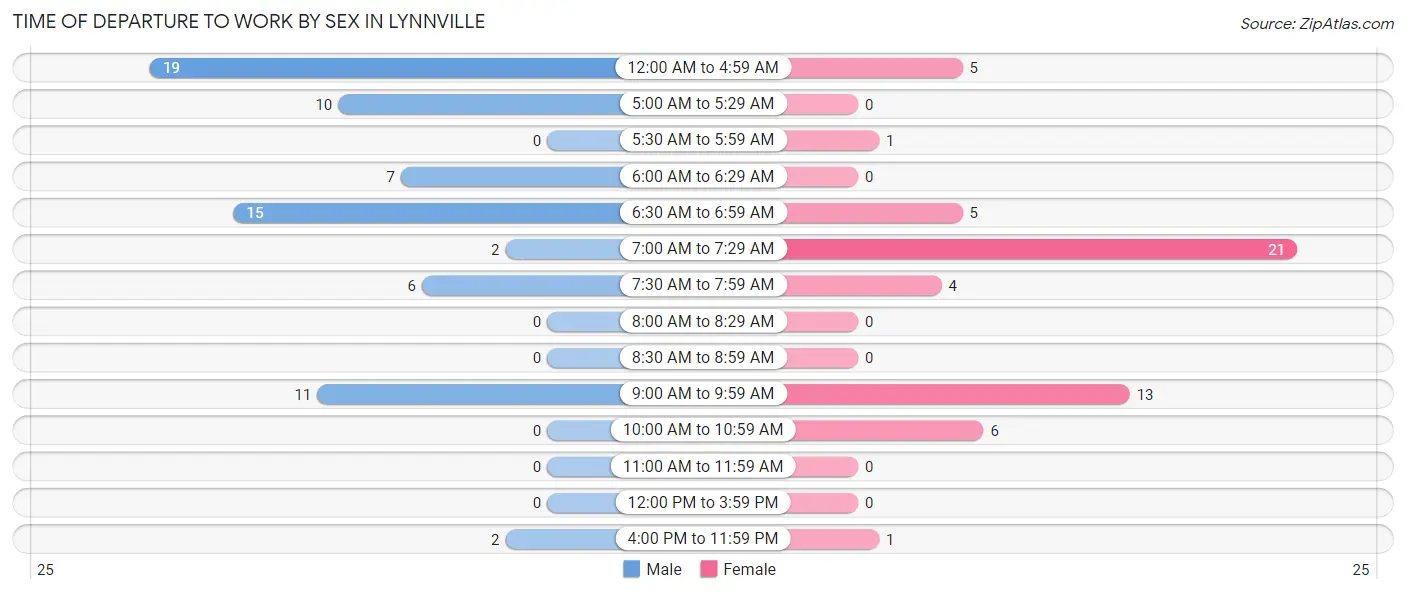
| Time of Departure | Male | Female |
| 12:00 AM to 4:59 AM | 19 (26.4%) | 5 (8.9%) |
| 5:00 AM to 5:29 AM | 10 (13.9%) | 0 (0.0%) |
| 5:30 AM to 5:59 AM | 0 (0.0%) | 1 (1.8%) |
| 6:00 AM to 6:29 AM | 7 (9.7%) | 0 (0.0%) |
| 6:30 AM to 6:59 AM | 15 (20.8%) | 5 (8.9%) |
| 7:00 AM to 7:29 AM | 2 (2.8%) | 21 (37.5%) |
| 7:30 AM to 7:59 AM | 6 (8.3%) | 4 (7.1%) |
| 8:00 AM to 8:29 AM | 0 (0.0%) | 0 (0.0%) |
| 8:30 AM to 8:59 AM | 0 (0.0%) | 0 (0.0%) |
| 9:00 AM to 9:59 AM | 11 (15.3%) | 13 (23.2%) |
| 10:00 AM to 10:59 AM | 0 (0.0%) | 6 (10.7%) |
| 11:00 AM to 11:59 AM | 0 (0.0%) | 0 (0.0%) |
| 12:00 PM to 3:59 PM | 0 (0.0%) | 0 (0.0%) |
| 4:00 PM to 11:59 PM | 2 (2.8%) | 1 (1.8%) |
| Total | 72 (100.0%) | 56 (100.0%) |
Housing Occupancy in Lynnville
Occupancy by Ownership in Lynnville
Of the total 172 dwellings in Lynnville, owner-occupied units account for 143 (83.1%), while renter-occupied units make up 29 (16.9%).
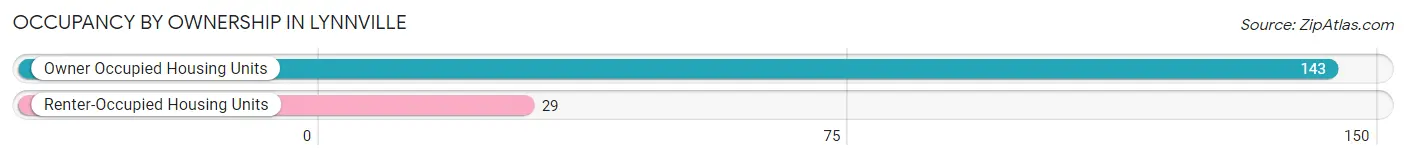
| Occupancy | # Housing Units | % Housing Units |
| Owner Occupied Housing Units | 143 | 83.1% |
| Renter-Occupied Housing Units | 29 | 16.9% |
| Total Occupied Housing Units | 172 | 100.0% |
Occupancy by Household Size in Lynnville
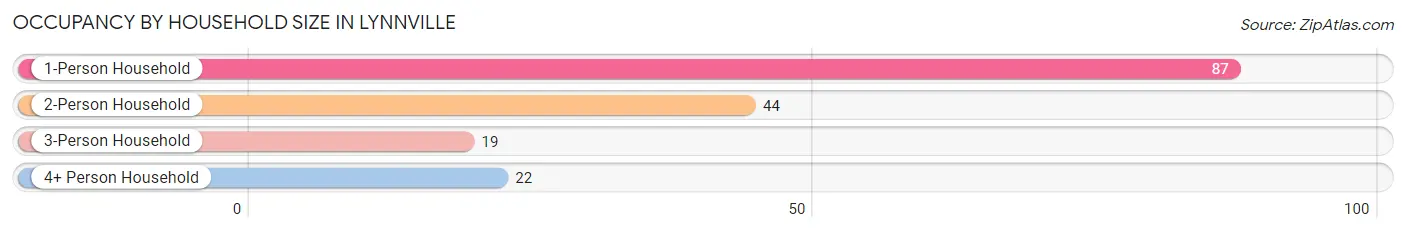
| Household Size | # Housing Units | % Housing Units |
| 1-Person Household | 87 | 50.6% |
| 2-Person Household | 44 | 25.6% |
| 3-Person Household | 19 | 11.1% |
| 4+ Person Household | 22 | 12.8% |
| Total Housing Units | 172 | 100.0% |
Occupancy by Ownership by Household Size in Lynnville
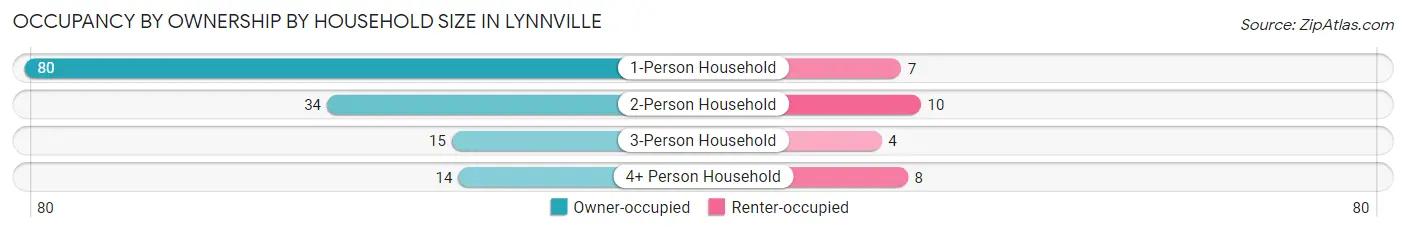
| Household Size | Owner-occupied | Renter-occupied |
| 1-Person Household | 80 (91.9%) | 7 (8.1%) |
| 2-Person Household | 34 (77.3%) | 10 (22.7%) |
| 3-Person Household | 15 (78.9%) | 4 (21.0%) |
| 4+ Person Household | 14 (63.6%) | 8 (36.4%) |
| Total Housing Units | 143 (83.1%) | 29 (16.9%) |
Occupancy by Educational Attainment in Lynnville
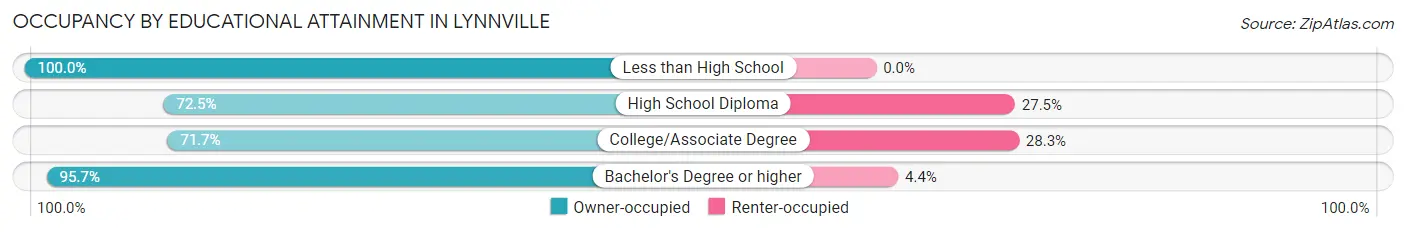
| Household Size | Owner-occupied | Renter-occupied |
| Less than High School | 10 (100.0%) | 0 (0.0%) |
| High School Diploma | 29 (72.5%) | 11 (27.5%) |
| College/Associate Degree | 38 (71.7%) | 15 (28.3%) |
| Bachelor's Degree or higher | 66 (95.7%) | 3 (4.3%) |
Occupancy by Age of Householder in Lynnville
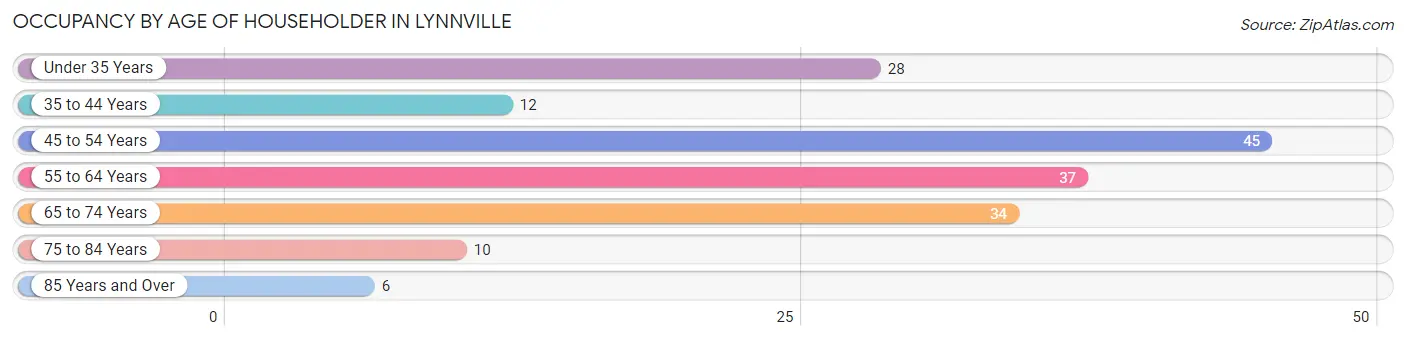
| Age Bracket | # Households | % Households |
| Under 35 Years | 28 | 16.3% |
| 35 to 44 Years | 12 | 7.0% |
| 45 to 54 Years | 45 | 26.2% |
| 55 to 64 Years | 37 | 21.5% |
| 65 to 74 Years | 34 | 19.8% |
| 75 to 84 Years | 10 | 5.8% |
| 85 Years and Over | 6 | 3.5% |
| Total | 172 | 100.0% |
Housing Finances in Lynnville
Median Income by Occupancy in Lynnville
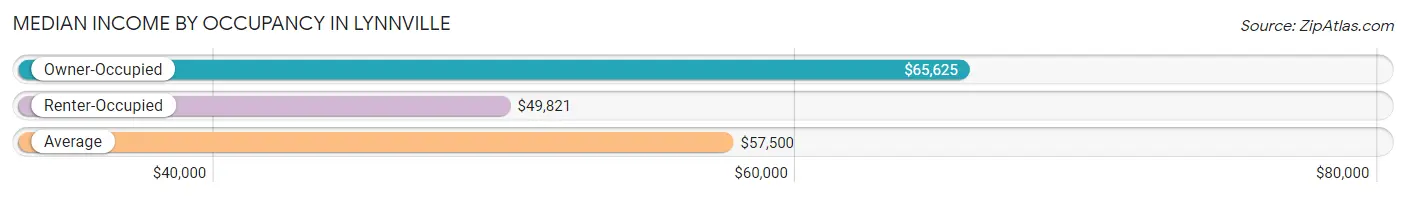
| Occupancy Type | # Households | Median Income |
| Owner-Occupied | 143 (83.1%) | $65,625 |
| Renter-Occupied | 29 (16.9%) | $49,821 |
| Average | 172 (100.0%) | $57,500 |
Occupancy by Householder Income Bracket in Lynnville
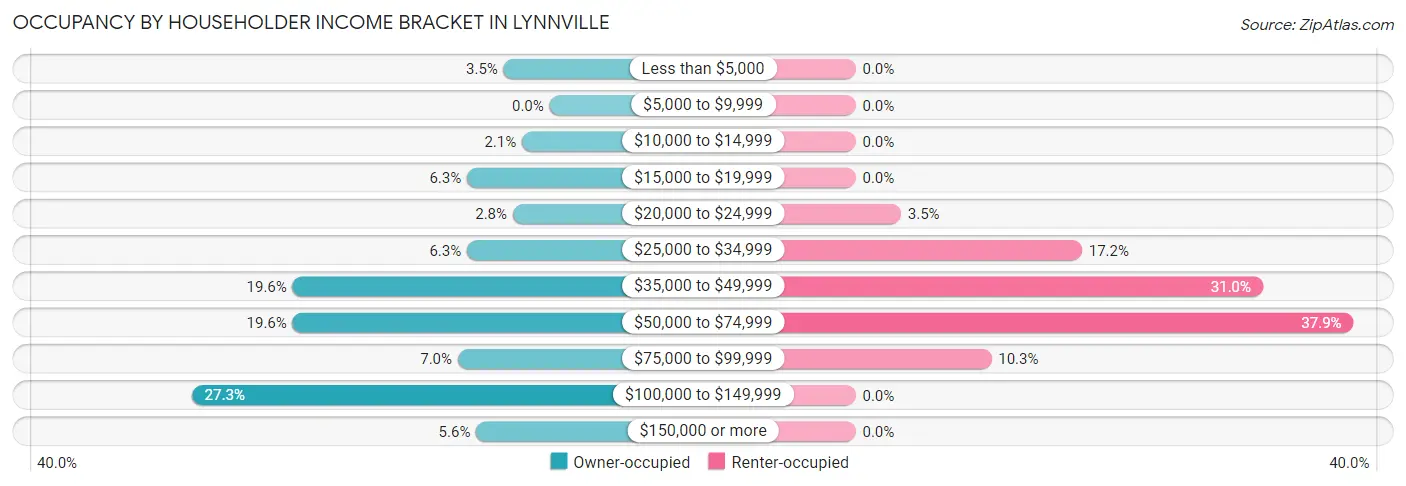
| Income Bracket | Owner-occupied | Renter-occupied |
| Less than $5,000 | 5 (3.5%) | 0 (0.0%) |
| $5,000 to $9,999 | 0 (0.0%) | 0 (0.0%) |
| $10,000 to $14,999 | 3 (2.1%) | 0 (0.0%) |
| $15,000 to $19,999 | 9 (6.3%) | 0 (0.0%) |
| $20,000 to $24,999 | 4 (2.8%) | 1 (3.5%) |
| $25,000 to $34,999 | 9 (6.3%) | 5 (17.2%) |
| $35,000 to $49,999 | 28 (19.6%) | 9 (31.0%) |
| $50,000 to $74,999 | 28 (19.6%) | 11 (37.9%) |
| $75,000 to $99,999 | 10 (7.0%) | 3 (10.3%) |
| $100,000 to $149,999 | 39 (27.3%) | 0 (0.0%) |
| $150,000 or more | 8 (5.6%) | 0 (0.0%) |
| Total | 143 (100.0%) | 29 (100.0%) |
Monthly Housing Cost Tiers in Lynnville
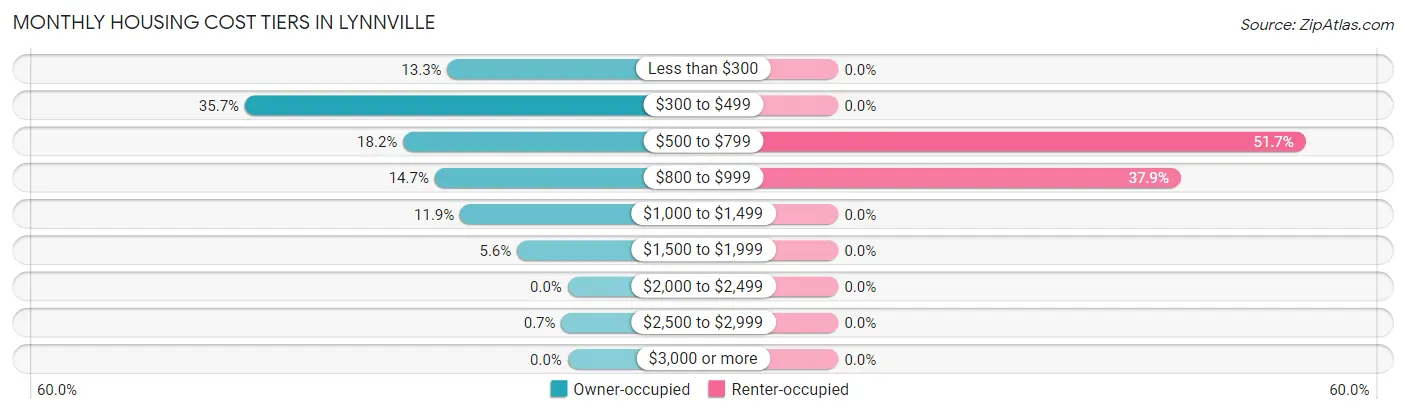
| Monthly Cost | Owner-occupied | Renter-occupied |
| Less than $300 | 19 (13.3%) | 0 (0.0%) |
| $300 to $499 | 51 (35.7%) | 0 (0.0%) |
| $500 to $799 | 26 (18.2%) | 15 (51.7%) |
| $800 to $999 | 21 (14.7%) | 11 (37.9%) |
| $1,000 to $1,499 | 17 (11.9%) | 0 (0.0%) |
| $1,500 to $1,999 | 8 (5.6%) | 0 (0.0%) |
| $2,000 to $2,499 | 0 (0.0%) | 0 (0.0%) |
| $2,500 to $2,999 | 1 (0.7%) | 0 (0.0%) |
| $3,000 or more | 0 (0.0%) | 0 (0.0%) |
| Total | 143 (100.0%) | 29 (100.0%) |
Physical Housing Characteristics in Lynnville
Housing Structures in Lynnville
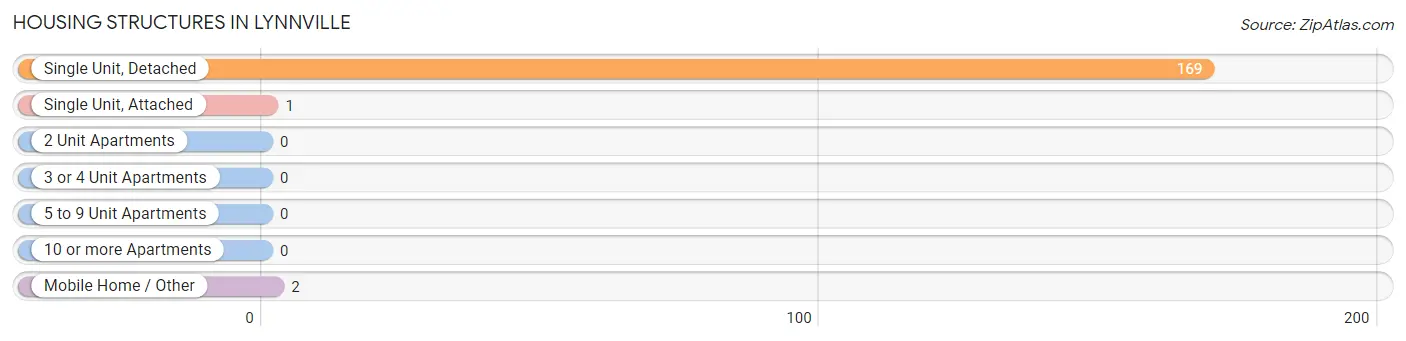
| Structure Type | # Housing Units | % Housing Units |
| Single Unit, Detached | 169 | 98.3% |
| Single Unit, Attached | 1 | 0.6% |
| 2 Unit Apartments | 0 | 0.0% |
| 3 or 4 Unit Apartments | 0 | 0.0% |
| 5 to 9 Unit Apartments | 0 | 0.0% |
| 10 or more Apartments | 0 | 0.0% |
| Mobile Home / Other | 2 | 1.2% |
| Total | 172 | 100.0% |
Housing Structures by Occupancy in Lynnville
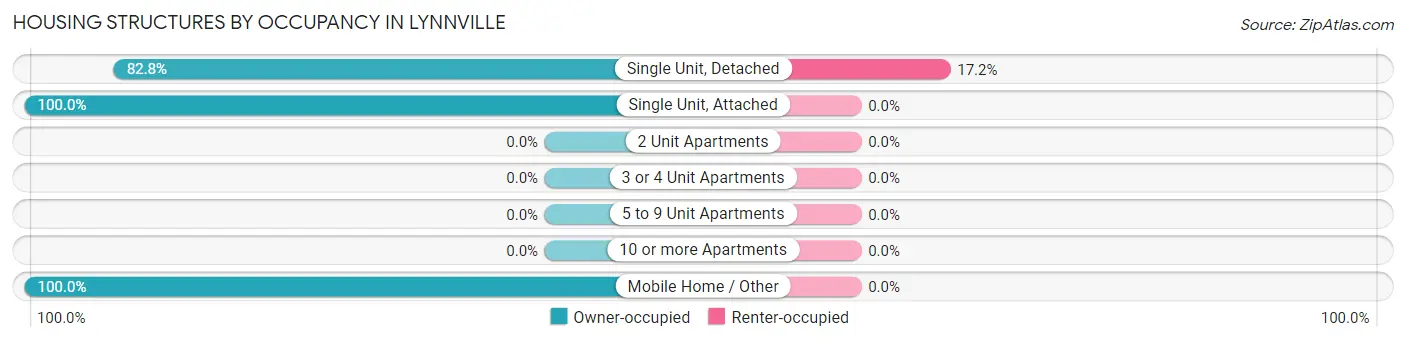
| Structure Type | Owner-occupied | Renter-occupied |
| Single Unit, Detached | 140 (82.8%) | 29 (17.2%) |
| Single Unit, Attached | 1 (100.0%) | 0 (0.0%) |
| 2 Unit Apartments | 0 (0.0%) | 0 (0.0%) |
| 3 or 4 Unit Apartments | 0 (0.0%) | 0 (0.0%) |
| 5 to 9 Unit Apartments | 0 (0.0%) | 0 (0.0%) |
| 10 or more Apartments | 0 (0.0%) | 0 (0.0%) |
| Mobile Home / Other | 2 (100.0%) | 0 (0.0%) |
| Total | 143 (83.1%) | 29 (16.9%) |
Housing Structures by Number of Rooms in Lynnville
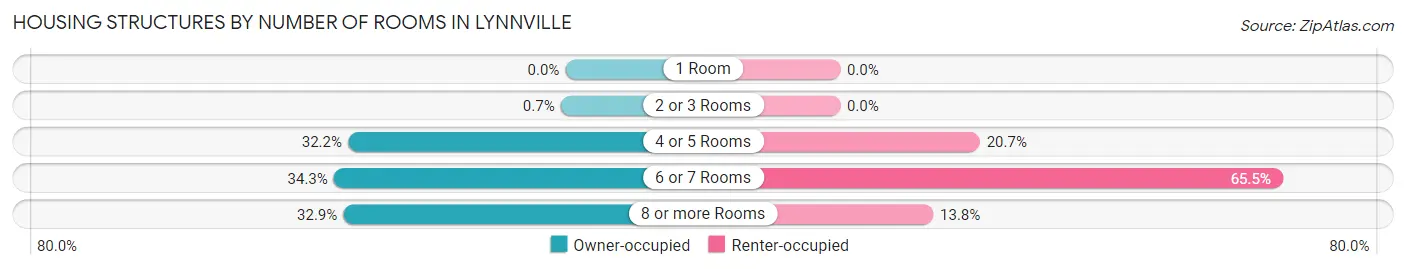
| Number of Rooms | Owner-occupied | Renter-occupied |
| 1 Room | 0 (0.0%) | 0 (0.0%) |
| 2 or 3 Rooms | 1 (0.7%) | 0 (0.0%) |
| 4 or 5 Rooms | 46 (32.2%) | 6 (20.7%) |
| 6 or 7 Rooms | 49 (34.3%) | 19 (65.5%) |
| 8 or more Rooms | 47 (32.9%) | 4 (13.8%) |
| Total | 143 (100.0%) | 29 (100.0%) |
Housing Structure by Heating Type in Lynnville
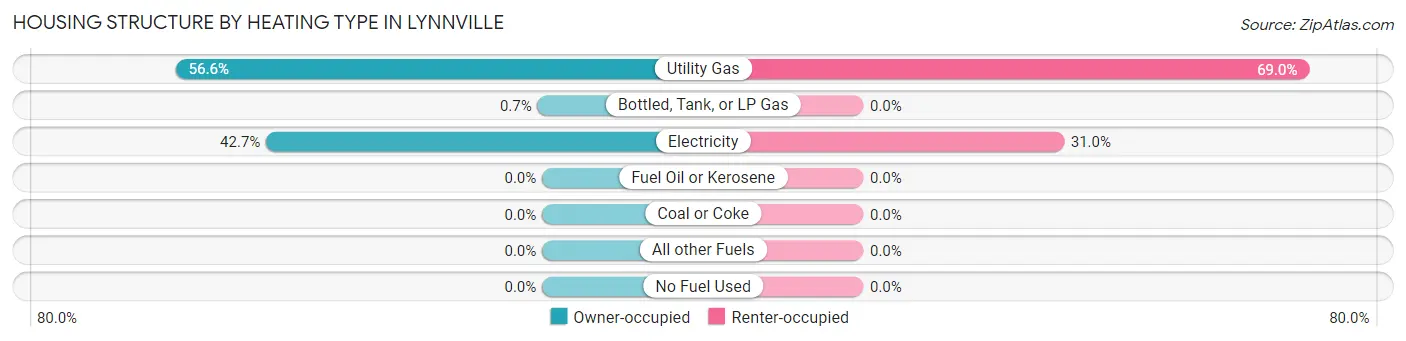
| Heating Type | Owner-occupied | Renter-occupied |
| Utility Gas | 81 (56.6%) | 20 (69.0%) |
| Bottled, Tank, or LP Gas | 1 (0.7%) | 0 (0.0%) |
| Electricity | 61 (42.7%) | 9 (31.0%) |
| Fuel Oil or Kerosene | 0 (0.0%) | 0 (0.0%) |
| Coal or Coke | 0 (0.0%) | 0 (0.0%) |
| All other Fuels | 0 (0.0%) | 0 (0.0%) |
| No Fuel Used | 0 (0.0%) | 0 (0.0%) |
| Total | 143 (100.0%) | 29 (100.0%) |
Household Vehicle Usage in Lynnville
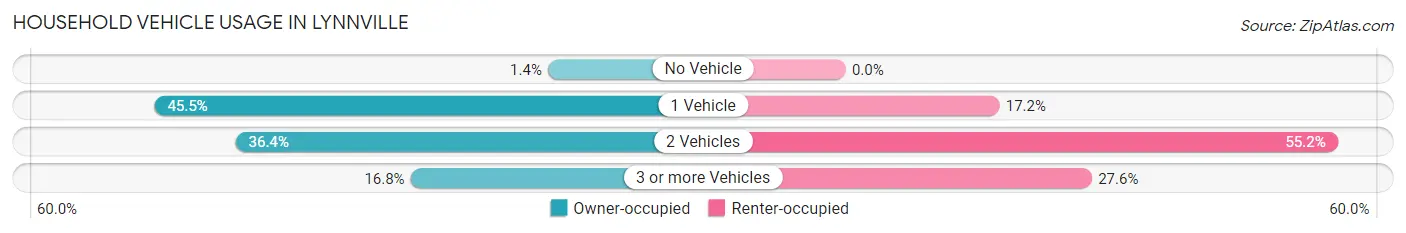
| Vehicles per Household | Owner-occupied | Renter-occupied |
| No Vehicle | 2 (1.4%) | 0 (0.0%) |
| 1 Vehicle | 65 (45.5%) | 5 (17.2%) |
| 2 Vehicles | 52 (36.4%) | 16 (55.2%) |
| 3 or more Vehicles | 24 (16.8%) | 8 (27.6%) |
| Total | 143 (100.0%) | 29 (100.0%) |
Real Estate & Mortgages in Lynnville
Real Estate and Mortgage Overview in Lynnville
| Characteristic | Without Mortgage | With Mortgage |
| Housing Units | 83 | 60 |
| Median Property Value | $101,300 | $116,700 |
| Median Household Income | - | - |
| Monthly Housing Costs | $378 | $0 |
| Real Estate Taxes | $613 | $2 |
Property Value by Mortgage Status in Lynnville
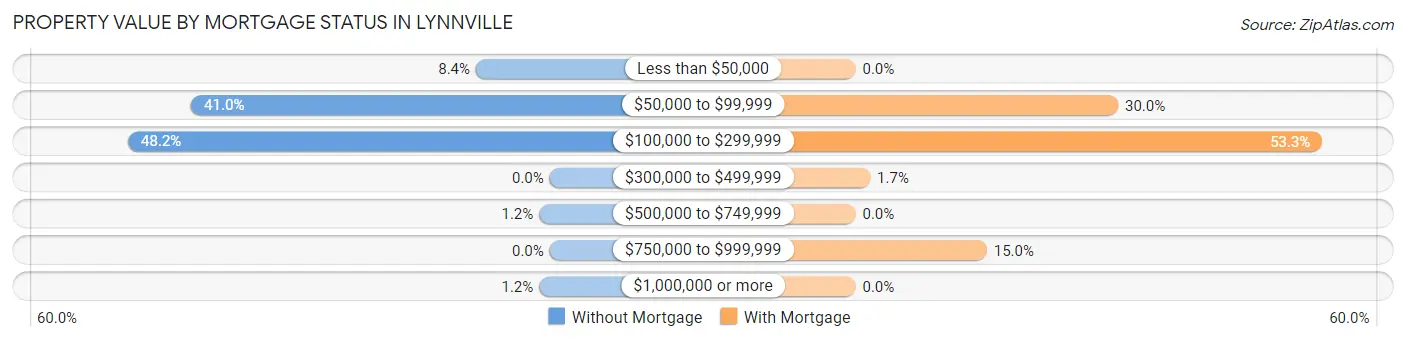
| Property Value | Without Mortgage | With Mortgage |
| Less than $50,000 | 7 (8.4%) | 0 (0.0%) |
| $50,000 to $99,999 | 34 (41.0%) | 18 (30.0%) |
| $100,000 to $299,999 | 40 (48.2%) | 32 (53.3%) |
| $300,000 to $499,999 | 0 (0.0%) | 1 (1.7%) |
| $500,000 to $749,999 | 1 (1.2%) | 0 (0.0%) |
| $750,000 to $999,999 | 0 (0.0%) | 9 (15.0%) |
| $1,000,000 or more | 1 (1.2%) | 0 (0.0%) |
| Total | 83 (100.0%) | 60 (100.0%) |
Household Income by Mortgage Status in Lynnville
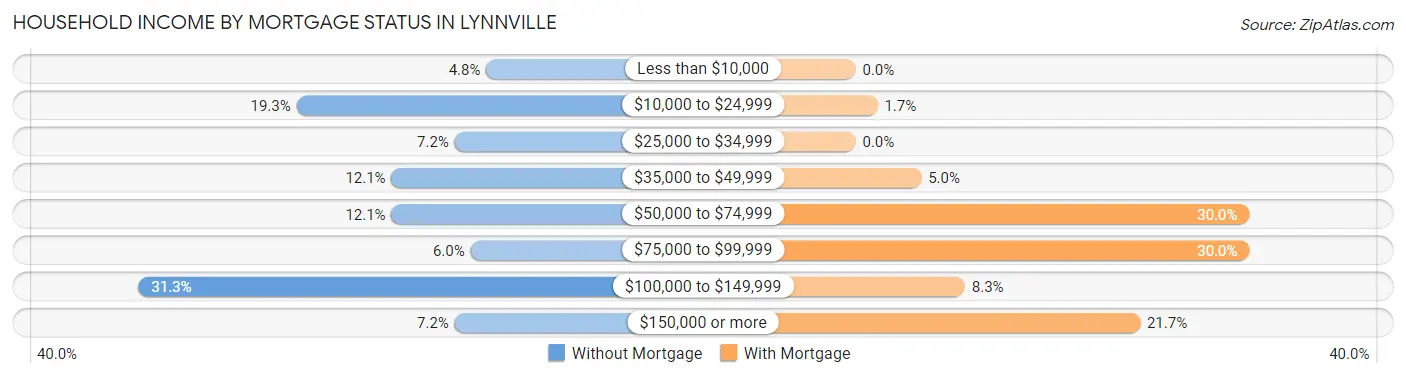
| Household Income | Without Mortgage | With Mortgage |
| Less than $10,000 | 4 (4.8%) | 0 (0.0%) |
| $10,000 to $24,999 | 16 (19.3%) | 1 (1.7%) |
| $25,000 to $34,999 | 6 (7.2%) | 0 (0.0%) |
| $35,000 to $49,999 | 10 (12.0%) | 3 (5.0%) |
| $50,000 to $74,999 | 10 (12.0%) | 18 (30.0%) |
| $75,000 to $99,999 | 5 (6.0%) | 18 (30.0%) |
| $100,000 to $149,999 | 26 (31.3%) | 5 (8.3%) |
| $150,000 or more | 6 (7.2%) | 13 (21.7%) |
| Total | 83 (100.0%) | 60 (100.0%) |
Property Value to Household Income Ratio in Lynnville
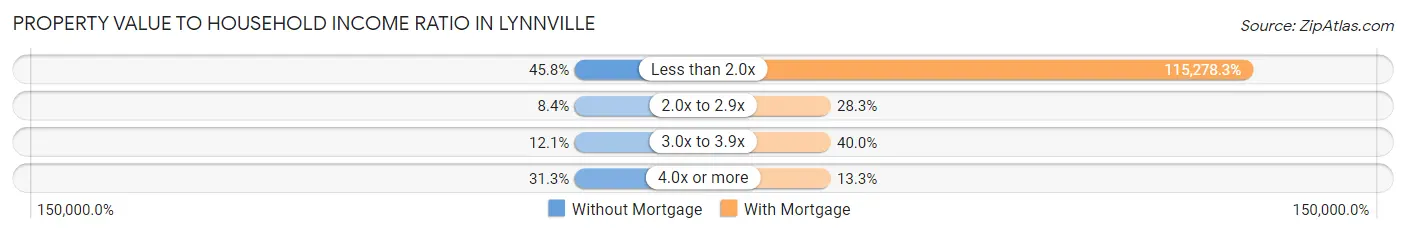
| Value-to-Income Ratio | Without Mortgage | With Mortgage |
| Less than 2.0x | 38 (45.8%) | 69,167 (115,278.3%) |
| 2.0x to 2.9x | 7 (8.4%) | 17 (28.3%) |
| 3.0x to 3.9x | 10 (12.0%) | 24 (40.0%) |
| 4.0x or more | 26 (31.3%) | 8 (13.3%) |
| Total | 83 (100.0%) | 60 (100.0%) |
Real Estate Taxes by Mortgage Status in Lynnville
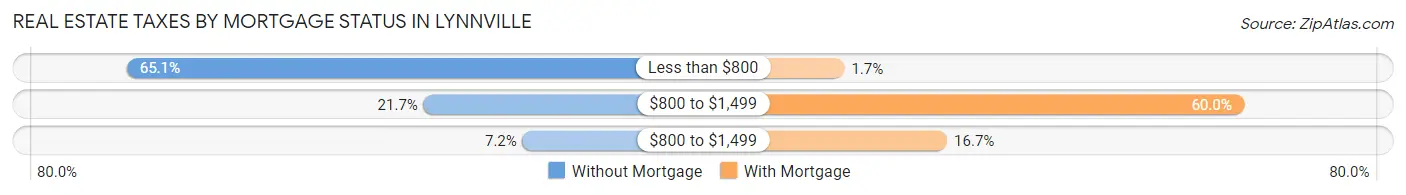
| Property Taxes | Without Mortgage | With Mortgage |
| Less than $800 | 54 (65.1%) | 1 (1.7%) |
| $800 to $1,499 | 18 (21.7%) | 36 (60.0%) |
| $800 to $1,499 | 6 (7.2%) | 10 (16.7%) |
| Total | 83 (100.0%) | 60 (100.0%) |
Health & Disability in Lynnville
Health Insurance Coverage by Age in Lynnville
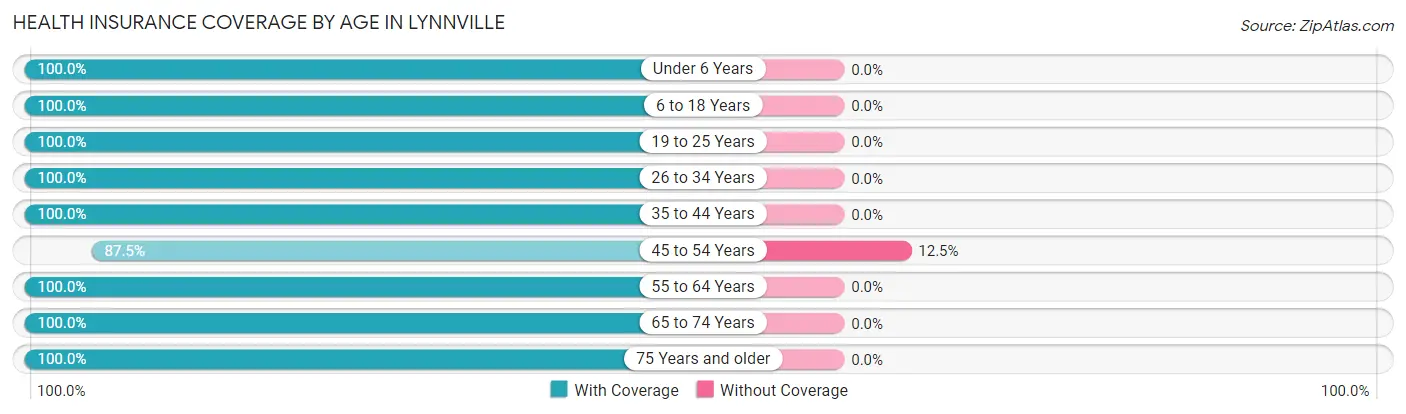
| Age Bracket | With Coverage | Without Coverage |
| Under 6 Years | 65 (100.0%) | 0 (0.0%) |
| 6 to 18 Years | 33 (100.0%) | 0 (0.0%) |
| 19 to 25 Years | 8 (100.0%) | 0 (0.0%) |
| 26 to 34 Years | 50 (100.0%) | 0 (0.0%) |
| 35 to 44 Years | 34 (100.0%) | 0 (0.0%) |
| 45 to 54 Years | 49 (87.5%) | 7 (12.5%) |
| 55 to 64 Years | 54 (100.0%) | 0 (0.0%) |
| 65 to 74 Years | 53 (100.0%) | 0 (0.0%) |
| 75 Years and older | 29 (100.0%) | 0 (0.0%) |
| Total | 375 (98.2%) | 7 (1.8%) |
Health Insurance Coverage by Citizenship Status in Lynnville
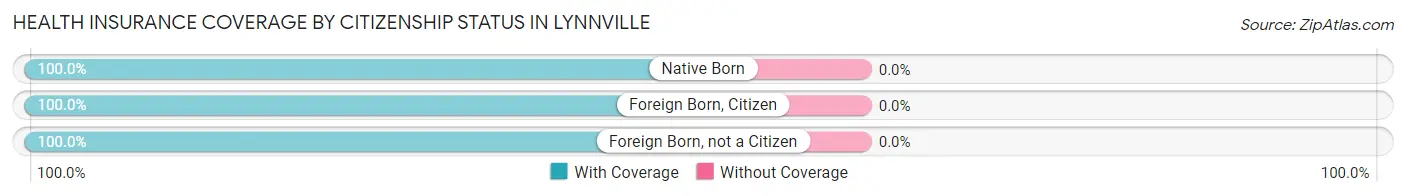
| Citizenship Status | With Coverage | Without Coverage |
| Native Born | 65 (100.0%) | 0 (0.0%) |
| Foreign Born, Citizen | 33 (100.0%) | 0 (0.0%) |
| Foreign Born, not a Citizen | 8 (100.0%) | 0 (0.0%) |
Health Insurance Coverage by Household Income in Lynnville
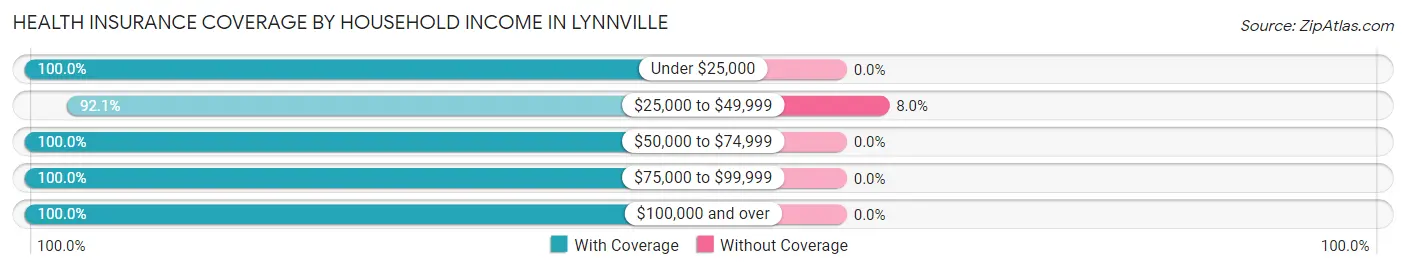
| Household Income | With Coverage | Without Coverage |
| Under $25,000 | 31 (100.0%) | 0 (0.0%) |
| $25,000 to $49,999 | 81 (92.0%) | 7 (8.0%) |
| $50,000 to $74,999 | 152 (100.0%) | 0 (0.0%) |
| $75,000 to $99,999 | 31 (100.0%) | 0 (0.0%) |
| $100,000 and over | 80 (100.0%) | 0 (0.0%) |
Public vs Private Health Insurance Coverage by Age in Lynnville
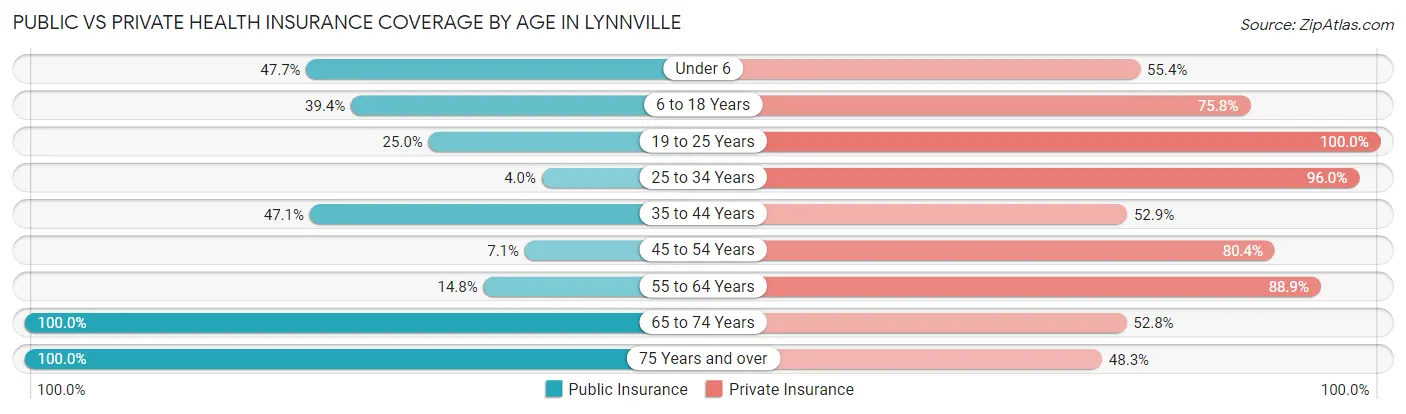
| Age Bracket | Public Insurance | Private Insurance |
| Under 6 | 31 (47.7%) | 36 (55.4%) |
| 6 to 18 Years | 13 (39.4%) | 25 (75.8%) |
| 19 to 25 Years | 2 (25.0%) | 8 (100.0%) |
| 25 to 34 Years | 2 (4.0%) | 48 (96.0%) |
| 35 to 44 Years | 16 (47.1%) | 18 (52.9%) |
| 45 to 54 Years | 4 (7.1%) | 45 (80.4%) |
| 55 to 64 Years | 8 (14.8%) | 48 (88.9%) |
| 65 to 74 Years | 53 (100.0%) | 28 (52.8%) |
| 75 Years and over | 29 (100.0%) | 14 (48.3%) |
| Total | 158 (41.4%) | 270 (70.7%) |
Disability Status by Sex by Age in Lynnville
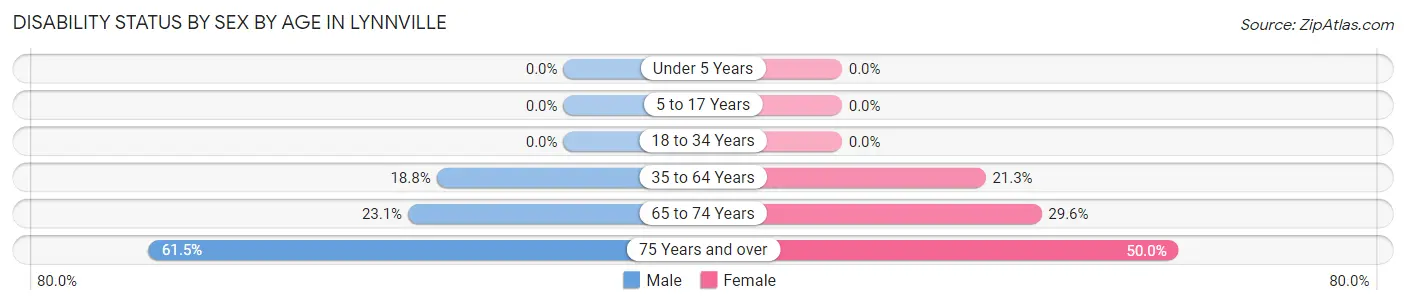
| Age Bracket | Male | Female |
| Under 5 Years | 0 (0.0%) | 0 (0.0%) |
| 5 to 17 Years | 0 (0.0%) | 0 (0.0%) |
| 18 to 34 Years | 0 (0.0%) | 0 (0.0%) |
| 35 to 64 Years | 13 (18.8%) | 16 (21.3%) |
| 65 to 74 Years | 6 (23.1%) | 8 (29.6%) |
| 75 Years and over | 8 (61.5%) | 8 (50.0%) |
Disability Class by Sex by Age in Lynnville
Disability Class: Hearing Difficulty
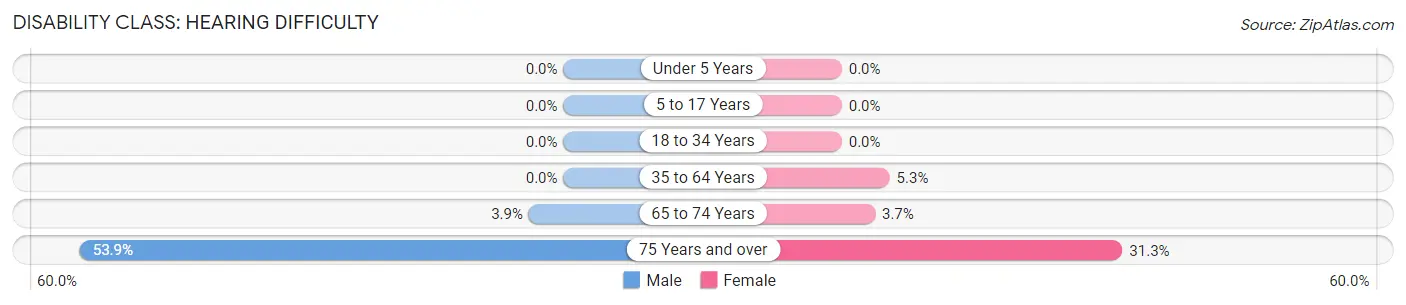
| Age Bracket | Male | Female |
| Under 5 Years | 0 (0.0%) | 0 (0.0%) |
| 5 to 17 Years | 0 (0.0%) | 0 (0.0%) |
| 18 to 34 Years | 0 (0.0%) | 0 (0.0%) |
| 35 to 64 Years | 0 (0.0%) | 4 (5.3%) |
| 65 to 74 Years | 1 (3.8%) | 1 (3.7%) |
| 75 Years and over | 7 (53.8%) | 5 (31.2%) |
Disability Class: Vision Difficulty
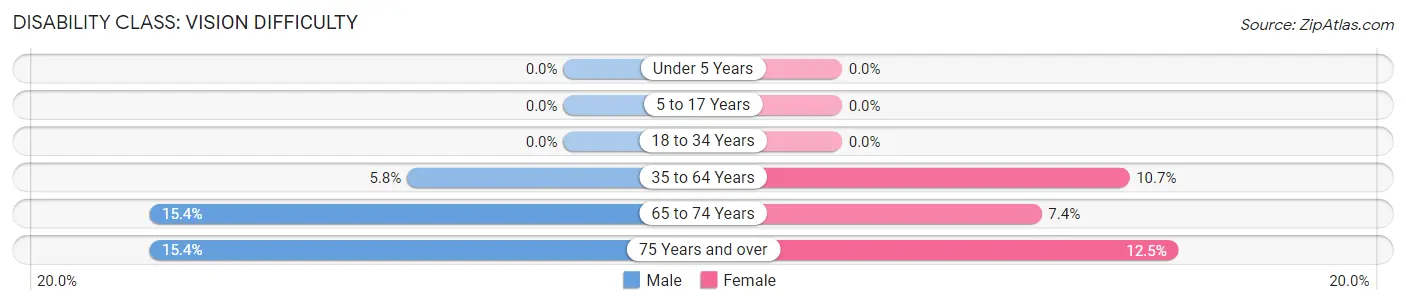
| Age Bracket | Male | Female |
| Under 5 Years | 0 (0.0%) | 0 (0.0%) |
| 5 to 17 Years | 0 (0.0%) | 0 (0.0%) |
| 18 to 34 Years | 0 (0.0%) | 0 (0.0%) |
| 35 to 64 Years | 4 (5.8%) | 8 (10.7%) |
| 65 to 74 Years | 4 (15.4%) | 2 (7.4%) |
| 75 Years and over | 2 (15.4%) | 2 (12.5%) |
Disability Class: Cognitive Difficulty
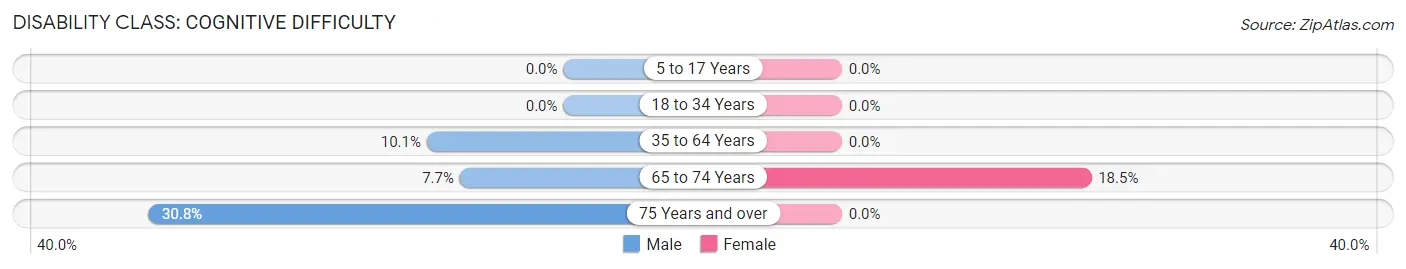
| Age Bracket | Male | Female |
| 5 to 17 Years | 0 (0.0%) | 0 (0.0%) |
| 18 to 34 Years | 0 (0.0%) | 0 (0.0%) |
| 35 to 64 Years | 7 (10.1%) | 0 (0.0%) |
| 65 to 74 Years | 2 (7.7%) | 5 (18.5%) |
| 75 Years and over | 4 (30.8%) | 0 (0.0%) |
Disability Class: Ambulatory Difficulty
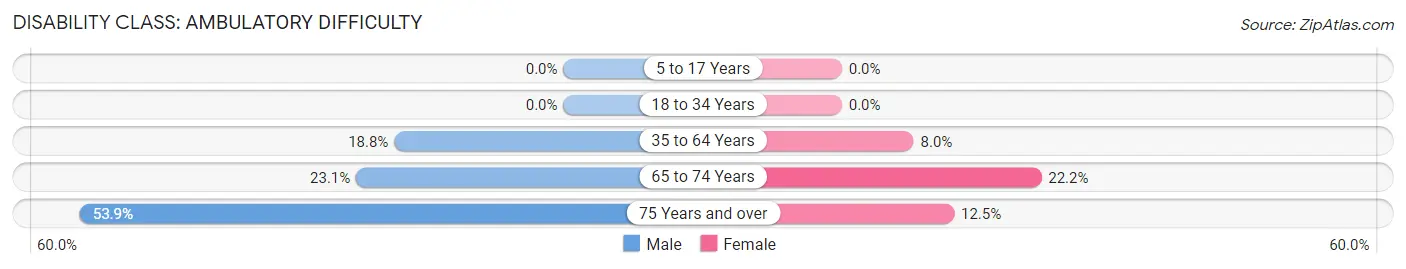
| Age Bracket | Male | Female |
| 5 to 17 Years | 0 (0.0%) | 0 (0.0%) |
| 18 to 34 Years | 0 (0.0%) | 0 (0.0%) |
| 35 to 64 Years | 13 (18.8%) | 6 (8.0%) |
| 65 to 74 Years | 6 (23.1%) | 6 (22.2%) |
| 75 Years and over | 7 (53.8%) | 2 (12.5%) |
Disability Class: Self-Care Difficulty
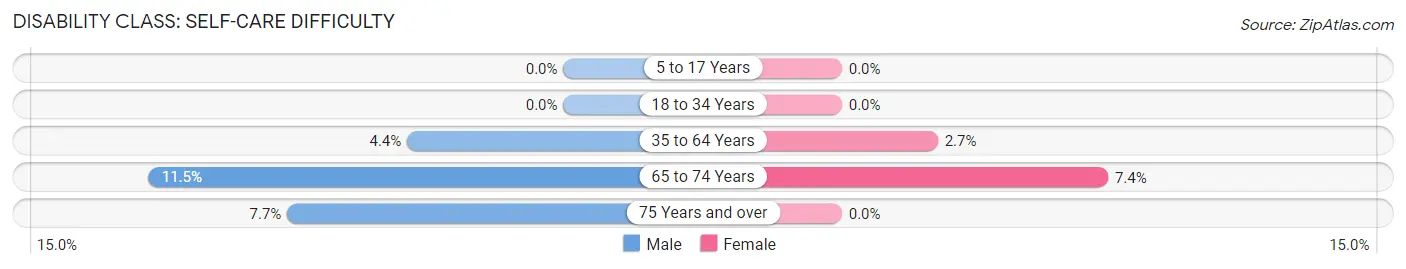
| Age Bracket | Male | Female |
| 5 to 17 Years | 0 (0.0%) | 0 (0.0%) |
| 18 to 34 Years | 0 (0.0%) | 0 (0.0%) |
| 35 to 64 Years | 3 (4.3%) | 2 (2.7%) |
| 65 to 74 Years | 3 (11.5%) | 2 (7.4%) |
| 75 Years and over | 1 (7.7%) | 0 (0.0%) |
Technology Access in Lynnville
Computing Device Access in Lynnville
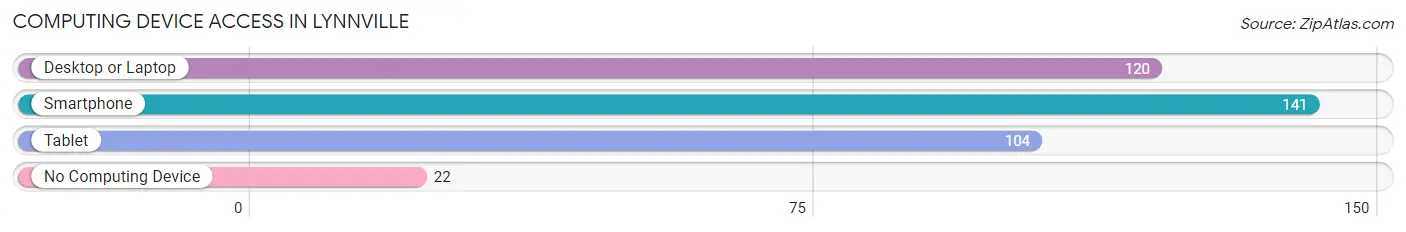
| Device Type | # Households | % Households |
| Desktop or Laptop | 120 | 69.8% |
| Smartphone | 141 | 82.0% |
| Tablet | 104 | 60.5% |
| No Computing Device | 22 | 12.8% |
| Total | 172 | 100.0% |
Internet Access in Lynnville
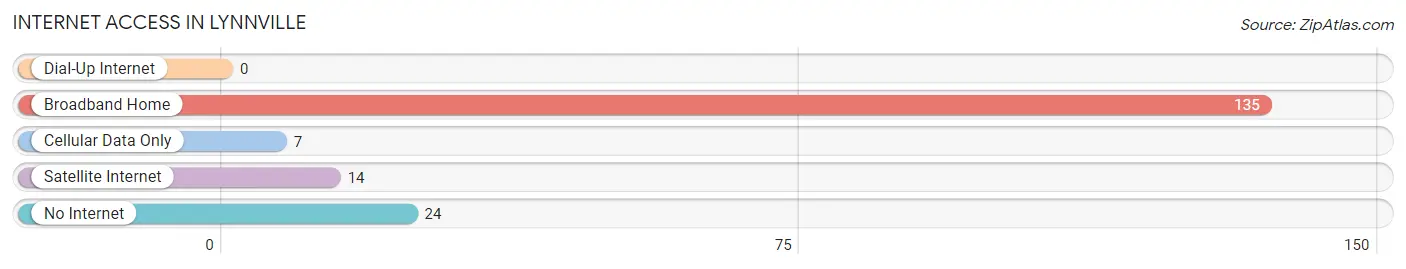
| Internet Type | # Households | % Households |
| Dial-Up Internet | 0 | 0.0% |
| Broadband Home | 135 | 78.5% |
| Cellular Data Only | 7 | 4.1% |
| Satellite Internet | 14 | 8.1% |
| No Internet | 24 | 14.0% |
| Total | 172 | 100.0% |
Lynnville Summary
Lynnville is a small town located in Giles County, Tennessee. It is situated in the southern part of the state, about halfway between Nashville and Chattanooga. The town has a population of just over 1,000 people and is known for its rural charm and friendly atmosphere.
History
The area that is now Lynnville was first settled in the early 1800s by a group of settlers from North Carolina. The town was originally known as “Lynn’s Crossroads” after the family that owned the land. In 1836, the town was officially incorporated and renamed Lynnville.
The town grew slowly over the years, but it was not until the late 19th century that it began to experience significant growth. This was due to the arrival of the railroad, which connected Lynnville to the larger cities of Nashville and Chattanooga. The railroad also brought new businesses and industries to the area, which helped to further spur the town’s growth.
Geography
Lynnville is located in the southern part of Giles County, Tennessee. It is situated in the foothills of the Appalachian Mountains, about halfway between Nashville and Chattanooga. The town is surrounded by rolling hills and lush forests, making it a popular destination for outdoor activities such as hiking, camping, and fishing.
The town is located along the banks of the Elk River, which flows through the area. The river is a popular spot for kayaking and canoeing, and it is also home to a variety of wildlife, including deer, turkey, and beavers.
Economy
The economy of Lynnville is largely based on agriculture and tourism. The town is home to several farms, which produce a variety of crops, including corn, soybeans, and hay. The town is also home to several small businesses, including restaurants, shops, and a local winery.
Tourism is also an important part of the local economy. The town is home to several historic sites, including the Lynnville Historic District, which is listed on the National Register of Historic Places. The town also hosts several annual festivals and events, such as the Lynnville Music Festival and the Lynnville Arts and Crafts Fair.
Demographics
As of the 2010 census, the population of Lynnville was 1,072. The town is predominantly white, with 92.3% of the population identifying as such. The remaining population is made up of African Americans (4.3%), Hispanics (2.2%), and other races (1.2%).
The median household income in Lynnville is $37,917, and the median home value is $117,400. The town has a poverty rate of 17.3%, which is slightly higher than the national average.
Lynnville is a small town with a rich history and a friendly atmosphere. It is a great place to live, work, and raise a family. The town is home to a variety of businesses and attractions, making it a great destination for visitors and residents alike.
Common Questions
What is Per Capita Income in Lynnville?
Per Capita income in Lynnville is $34,880.
What is the Median Family Income in Lynnville?
Median Family Income in Lynnville is $62,083.
What is the Median Household income in Lynnville?
Median Household Income in Lynnville is $57,500.
What is Family Income Deficit in Lynnville?
Family Income Deficit in Lynnville is $8,883.
Families that are below poverty line in Lynnville earn $8,883 less on average than the poverty threshold level.
What is Inequality or Gini Index in Lynnville?
Inequality or Gini Index in Lynnville is 0.37.
What is the Total Population of Lynnville?
Total Population of Lynnville is 382.
What is the Total Male Population of Lynnville?
Total Male Population of Lynnville is 179.
What is the Total Female Population of Lynnville?
Total Female Population of Lynnville is 203.
What is the Ratio of Males per 100 Females in Lynnville?
There are 88.18 Males per 100 Females in Lynnville.
What is the Ratio of Females per 100 Males in Lynnville?
There are 113.41 Females per 100 Males in Lynnville.
What is the Median Population Age in Lynnville?
Median Population Age in Lynnville is 45.1 Years.
What is the Average Family Size in Lynnville
Average Family Size in Lynnville is 3.4 People.
What is the Average Household Size in Lynnville
Average Household Size in Lynnville is 2.2 People.
How Large is the Labor Force in Lynnville?
There are 177 People in the Labor Forcein in Lynnville.
What is the Percentage of People in the Labor Force in Lynnville?
61.2% of People are in the Labor Force in Lynnville.
What is the Unemployment Rate in Lynnville?
Unemployment Rate in Lynnville is 15.3%.