Vonore, TN Map & Demographics
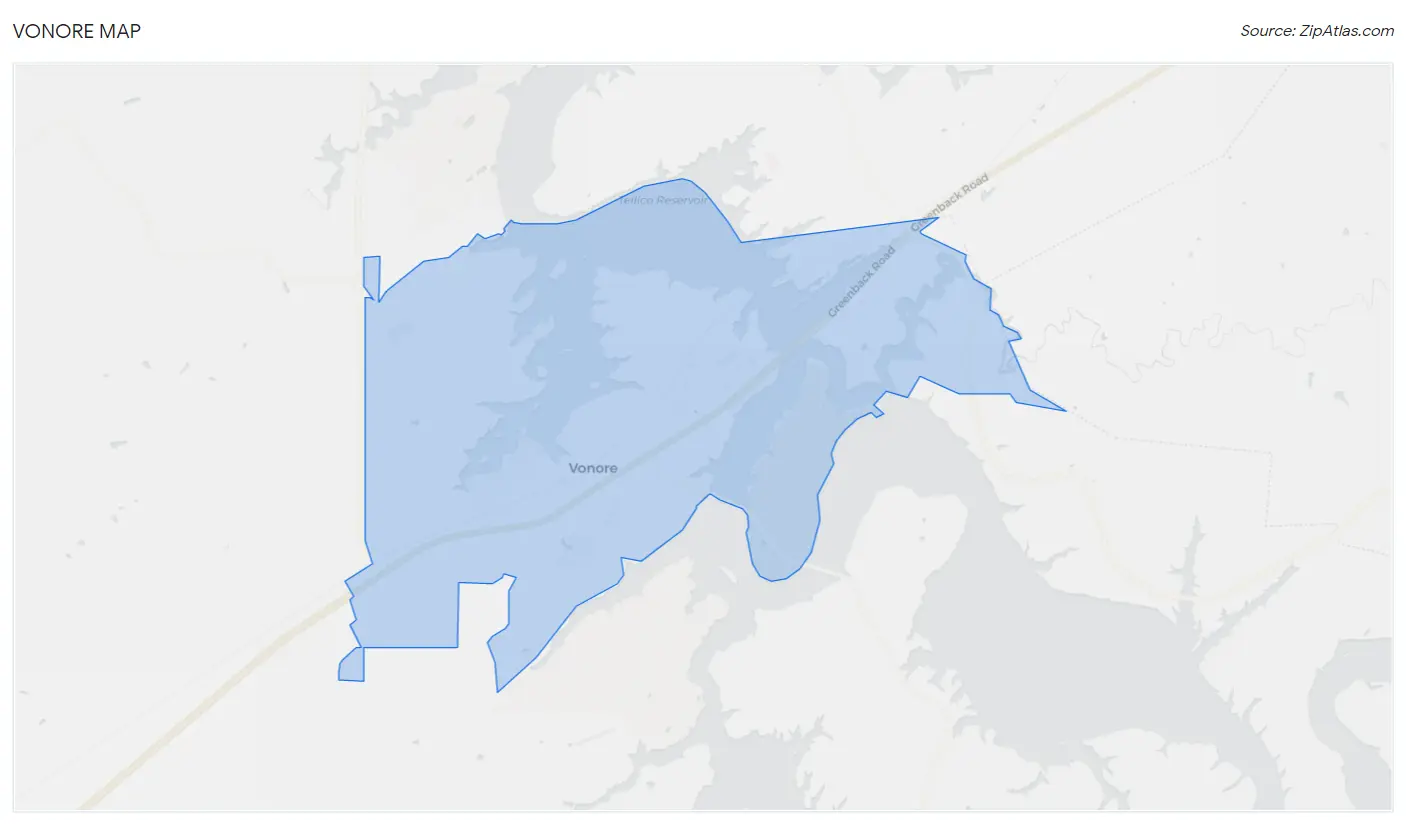
Vonore Map
Vonore Overview
$32,310
PER CAPITA INCOME
$56,628
AVG FAMILY INCOME
$53,594
AVG HOUSEHOLD INCOME
39.1%
WAGE / INCOME GAP [ % ]
60.9¢/ $1
WAGE / INCOME GAP [ $ ]
0.40
INEQUALITY / GINI INDEX
1,730
TOTAL POPULATION
871
MALE POPULATION
859
FEMALE POPULATION
101.40
MALES / 100 FEMALES
98.62
FEMALES / 100 MALES
42.0
MEDIAN AGE
2.5
AVG FAMILY SIZE
2.2
AVG HOUSEHOLD SIZE
784
LABOR FORCE [ PEOPLE ]
55.2%
PERCENT IN LABOR FORCE
3.5%
UNEMPLOYMENT RATE
Vonore Zip Codes
Vonore Area Codes
Income in Vonore
Income Overview in Vonore
Per Capita Income in Vonore is $32,310, while median incomes of families and households are $56,628 and $53,594 respectively.
| Characteristic | Number | Measure |
| Per Capita Income | 1,730 | $32,310 |
| Median Family Income | 578 | $56,628 |
| Mean Family Income | 578 | $78,681 |
| Median Household Income | 767 | $53,594 |
| Mean Household Income | 767 | $70,660 |
| Income Deficit | 578 | $0 |
| Wage / Income Gap (%) | 1,730 | 39.10% |
| Wage / Income Gap ($) | 1,730 | 60.90¢ per $1 |
| Gini / Inequality Index | 1,730 | 0.40 |
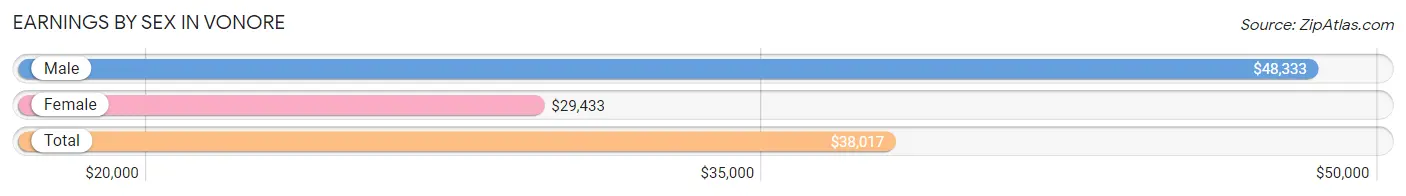
Earnings by Sex in Vonore
Average Earnings in Vonore are $38,017, $48,333 for men and $29,433 for women, a difference of 39.1%.
| Sex | Number | Average Earnings |
| Male | 410 (48.6%) | $48,333 |
| Female | 434 (51.4%) | $29,433 |
| Total | 844 (100.0%) | $38,017 |
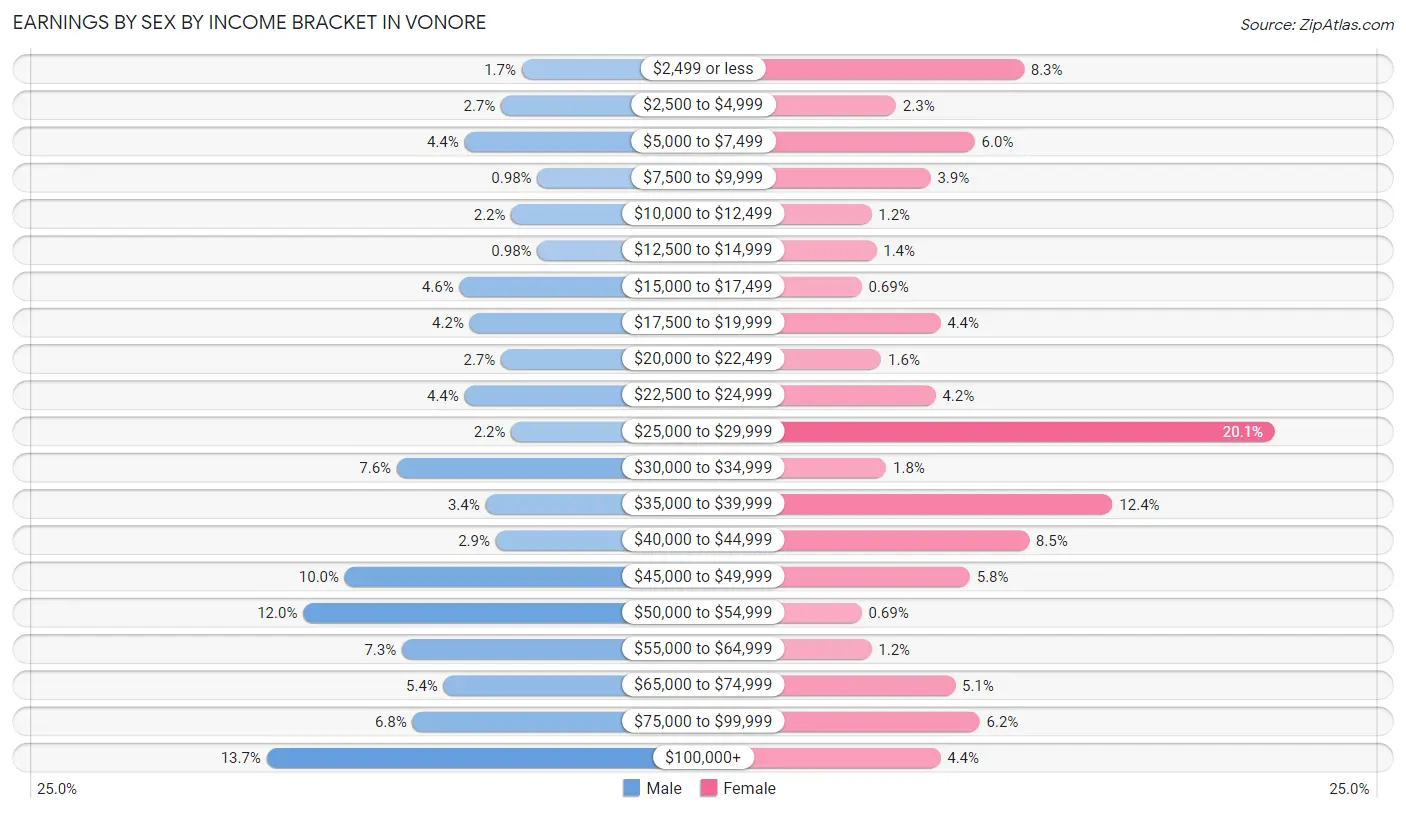
Earnings by Sex by Income Bracket in Vonore
The most common earnings brackets in Vonore are $100,000+ for men (56 | 13.7%) and $25,000 to $29,999 for women (87 | 20.1%).
| Income | Male | Female |
| $2,499 or less | 7 (1.7%) | 36 (8.3%) |
| $2,500 to $4,999 | 11 (2.7%) | 10 (2.3%) |
| $5,000 to $7,499 | 18 (4.4%) | 26 (6.0%) |
| $7,500 to $9,999 | 4 (1.0%) | 17 (3.9%) |
| $10,000 to $12,499 | 9 (2.2%) | 5 (1.1%) |
| $12,500 to $14,999 | 4 (1.0%) | 6 (1.4%) |
| $15,000 to $17,499 | 19 (4.6%) | 3 (0.7%) |
| $17,500 to $19,999 | 17 (4.2%) | 19 (4.4%) |
| $20,000 to $22,499 | 11 (2.7%) | 7 (1.6%) |
| $22,500 to $24,999 | 18 (4.4%) | 18 (4.2%) |
| $25,000 to $29,999 | 9 (2.2%) | 87 (20.1%) |
| $30,000 to $34,999 | 31 (7.6%) | 8 (1.8%) |
| $35,000 to $39,999 | 14 (3.4%) | 54 (12.4%) |
| $40,000 to $44,999 | 12 (2.9%) | 37 (8.5%) |
| $45,000 to $49,999 | 41 (10.0%) | 25 (5.8%) |
| $50,000 to $54,999 | 49 (11.9%) | 3 (0.7%) |
| $55,000 to $64,999 | 30 (7.3%) | 5 (1.1%) |
| $65,000 to $74,999 | 22 (5.4%) | 22 (5.1%) |
| $75,000 to $99,999 | 28 (6.8%) | 27 (6.2%) |
| $100,000+ | 56 (13.7%) | 19 (4.4%) |
| Total | 410 (100.0%) | 434 (100.0%) |
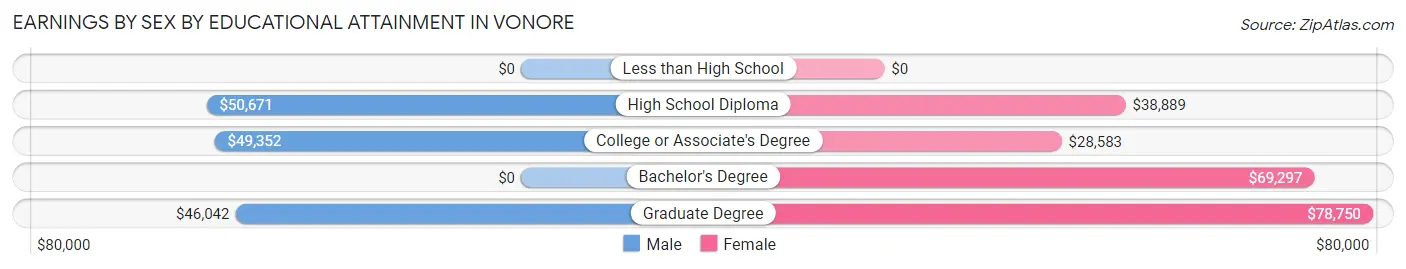
Earnings by Sex by Educational Attainment in Vonore
Average earnings in Vonore are $49,833 for men and $37,546 for women, a difference of 24.7%. Men with an educational attainment of high school diploma enjoy the highest average annual earnings of $50,671, while those with graduate degree education earn the least with $46,042. Women with an educational attainment of graduate degree earn the most with the average annual earnings of $78,750, while those with college or associate's degree education have the smallest earnings of $28,583.
| Educational Attainment | Male Income | Female Income |
| Less than High School | - | - |
| High School Diploma | $50,671 | $38,889 |
| College or Associate's Degree | $49,352 | $28,583 |
| Bachelor's Degree | - | - |
| Graduate Degree | $46,042 | $78,750 |
| Total | $49,833 | $37,546 |
Family Income in Vonore
Family Income Brackets in Vonore
According to the Vonore family income data, there are 121 families falling into the $50,000 to $74,999 income range, which is the most common income bracket and makes up 20.9% of all families.
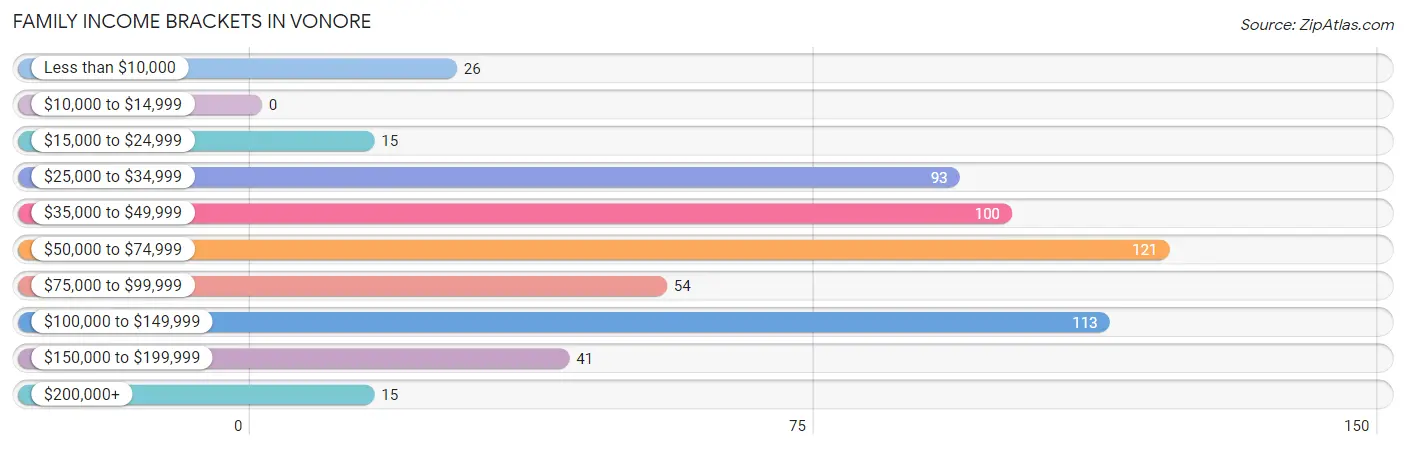
| Income Bracket | # Families | % Families |
| Less than $10,000 | 26 | 4.5% |
| $10,000 to $14,999 | 0 | 0.0% |
| $15,000 to $24,999 | 15 | 2.6% |
| $25,000 to $34,999 | 93 | 16.1% |
| $35,000 to $49,999 | 100 | 17.3% |
| $50,000 to $74,999 | 121 | 20.9% |
| $75,000 to $99,999 | 54 | 9.3% |
| $100,000 to $149,999 | 113 | 19.6% |
| $150,000 to $199,999 | 41 | 7.1% |
| $200,000+ | 15 | 2.6% |
Family Income by Famaliy Size in Vonore
5-person families (11 | 1.9%) account for the highest median family income in Vonore with $122,917 per family, while 2-person families (350 | 60.6%) have the highest median income of $35,416 per family member.
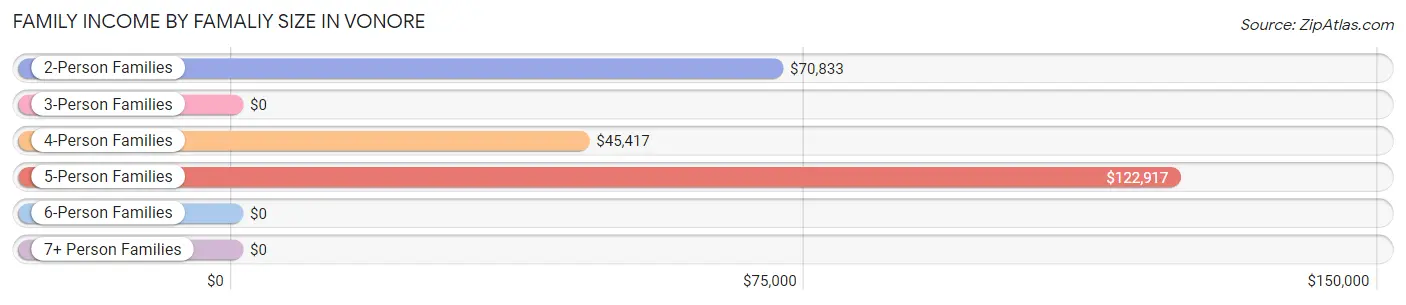
| Income Bracket | # Families | Median Income |
| 2-Person Families | 350 (60.6%) | $70,833 |
| 3-Person Families | 159 (27.5%) | $0 |
| 4-Person Families | 39 (6.8%) | $45,417 |
| 5-Person Families | 11 (1.9%) | $122,917 |
| 6-Person Families | 7 (1.2%) | $0 |
| 7+ Person Families | 12 (2.1%) | $0 |
| Total | 578 (100.0%) | $56,628 |
Family Income by Number of Earners in Vonore
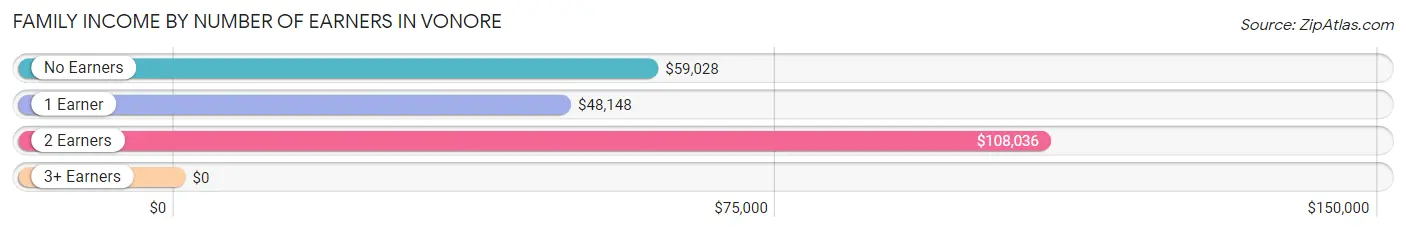
| Number of Earners | # Families | Median Income |
| No Earners | 125 (21.6%) | $59,028 |
| 1 Earner | 272 (47.1%) | $48,148 |
| 2 Earners | 157 (27.2%) | $108,036 |
| 3+ Earners | 24 (4.2%) | $0 |
| Total | 578 (100.0%) | $56,628 |
Household Income in Vonore
Household Income Brackets in Vonore
With 149 households falling in the category, the $50,000 to $74,999 income range is the most frequent in Vonore, accounting for 19.4% of all households. In contrast, only 15 households (2.0%) fall into the $200,000+ income bracket, making it the least populous group.
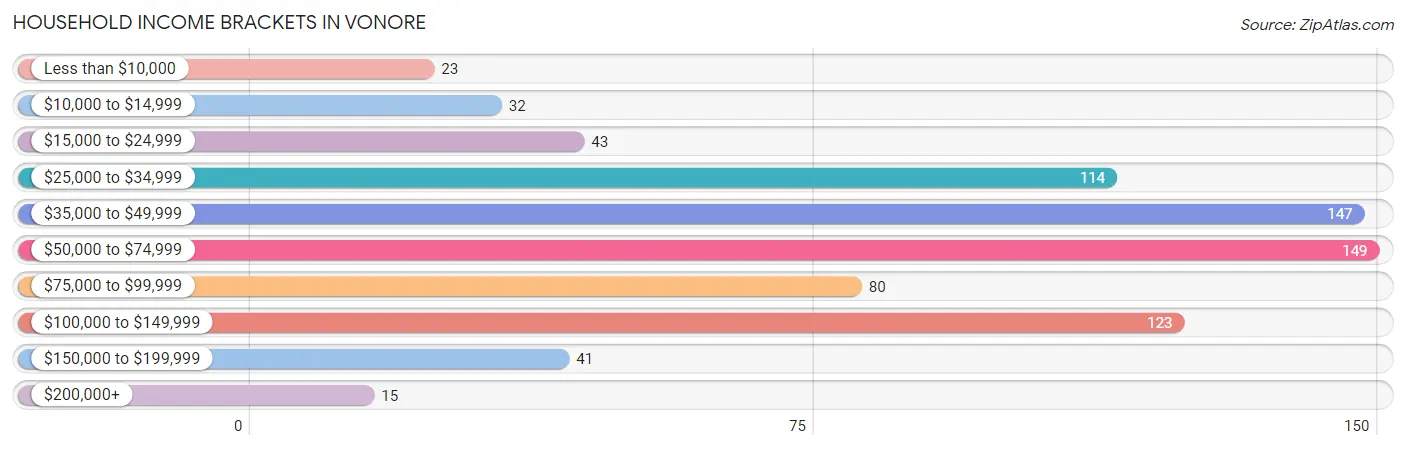
| Income Bracket | # Households | % Households |
| Less than $10,000 | 23 | 3.0% |
| $10,000 to $14,999 | 32 | 4.2% |
| $15,000 to $24,999 | 43 | 5.6% |
| $25,000 to $34,999 | 114 | 14.9% |
| $35,000 to $49,999 | 147 | 19.2% |
| $50,000 to $74,999 | 149 | 19.4% |
| $75,000 to $99,999 | 80 | 10.4% |
| $100,000 to $149,999 | 123 | 16.0% |
| $150,000 to $199,999 | 41 | 5.3% |
| $200,000+ | 15 | 2.0% |
Household Income by Householder Age in Vonore
The median household income in Vonore is $53,594, with the highest median household income of $60,938 found in the 65+ years age bracket for the primary householder. A total of 229 households (29.9%) fall into this category. Meanwhile, the 15 to 24 years age bracket for the primary householder has the lowest median household income of $0, with 21 households (2.7%) in this group.
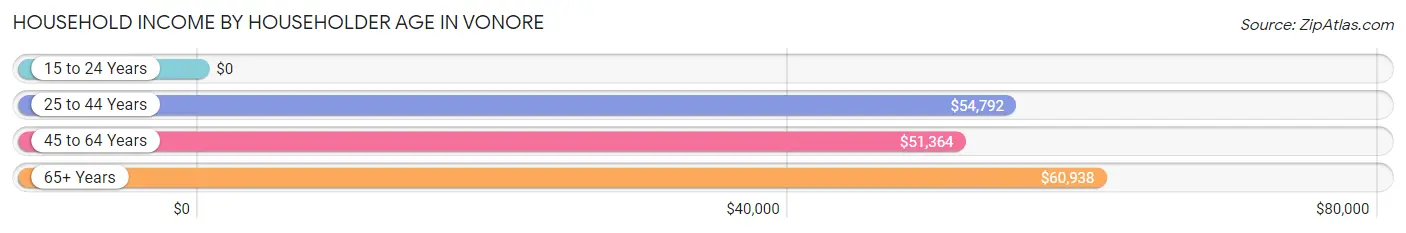
| Income Bracket | # Households | Median Income |
| 15 to 24 Years | 21 (2.7%) | $0 |
| 25 to 44 Years | 235 (30.6%) | $54,792 |
| 45 to 64 Years | 282 (36.8%) | $51,364 |
| 65+ Years | 229 (29.9%) | $60,938 |
| Total | 767 (100.0%) | $53,594 |
Poverty in Vonore
Income Below Poverty by Sex and Age in Vonore
With 8.4% poverty level for males and 14.3% for females among the residents of Vonore, 18 to 24 year old males and 16 and 17 year old females are the most vulnerable to poverty, with 16 males (44.4%) and 22 females (66.7%) in their respective age groups living below the poverty level.
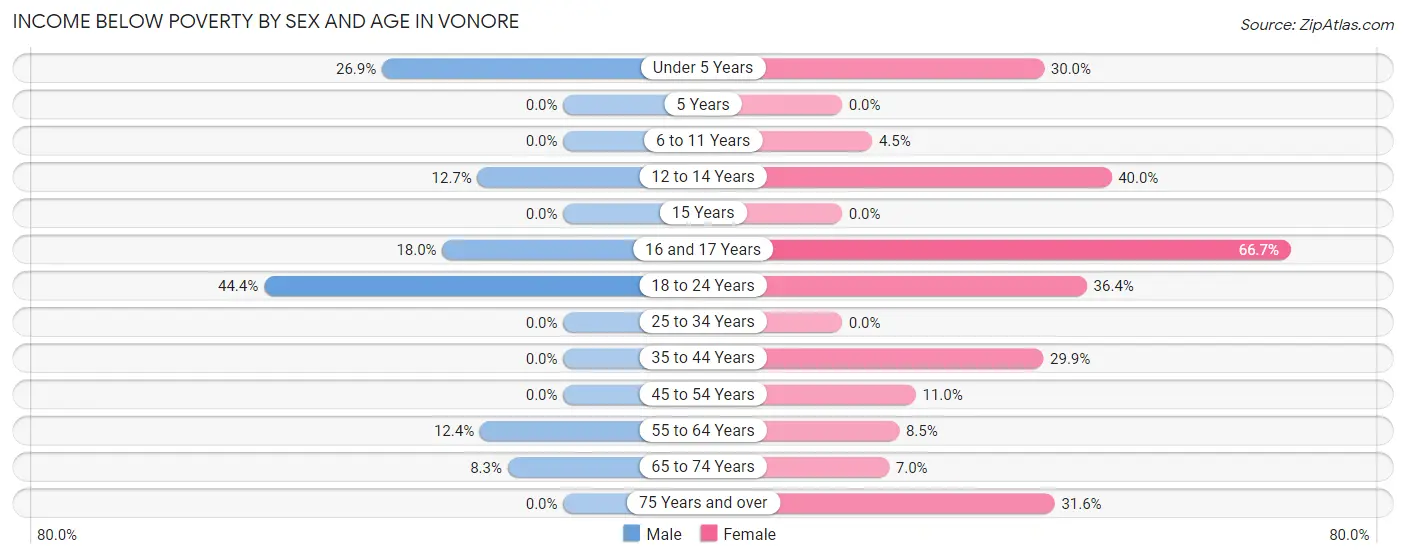
| Age Bracket | Male | Female |
| Under 5 Years | 7 (26.9%) | 12 (30.0%) |
| 5 Years | 0 (0.0%) | 0 (0.0%) |
| 6 to 11 Years | 0 (0.0%) | 3 (4.5%) |
| 12 to 14 Years | 7 (12.7%) | 6 (40.0%) |
| 15 Years | 0 (0.0%) | 0 (0.0%) |
| 16 and 17 Years | 14 (17.9%) | 22 (66.7%) |
| 18 to 24 Years | 16 (44.4%) | 8 (36.4%) |
| 25 to 34 Years | 0 (0.0%) | 0 (0.0%) |
| 35 to 44 Years | 0 (0.0%) | 26 (29.9%) |
| 45 to 54 Years | 0 (0.0%) | 15 (11.0%) |
| 55 to 64 Years | 13 (12.4%) | 9 (8.5%) |
| 65 to 74 Years | 16 (8.3%) | 10 (7.0%) |
| 75 Years and over | 0 (0.0%) | 12 (31.6%) |
| Total | 73 (8.4%) | 123 (14.3%) |
Income Above Poverty by Sex and Age in Vonore
According to the poverty statistics in Vonore, males aged 5 years and females aged 5 years are the age groups that are most secure financially, with 100.0% of males and 100.0% of females in these age groups living above the poverty line.
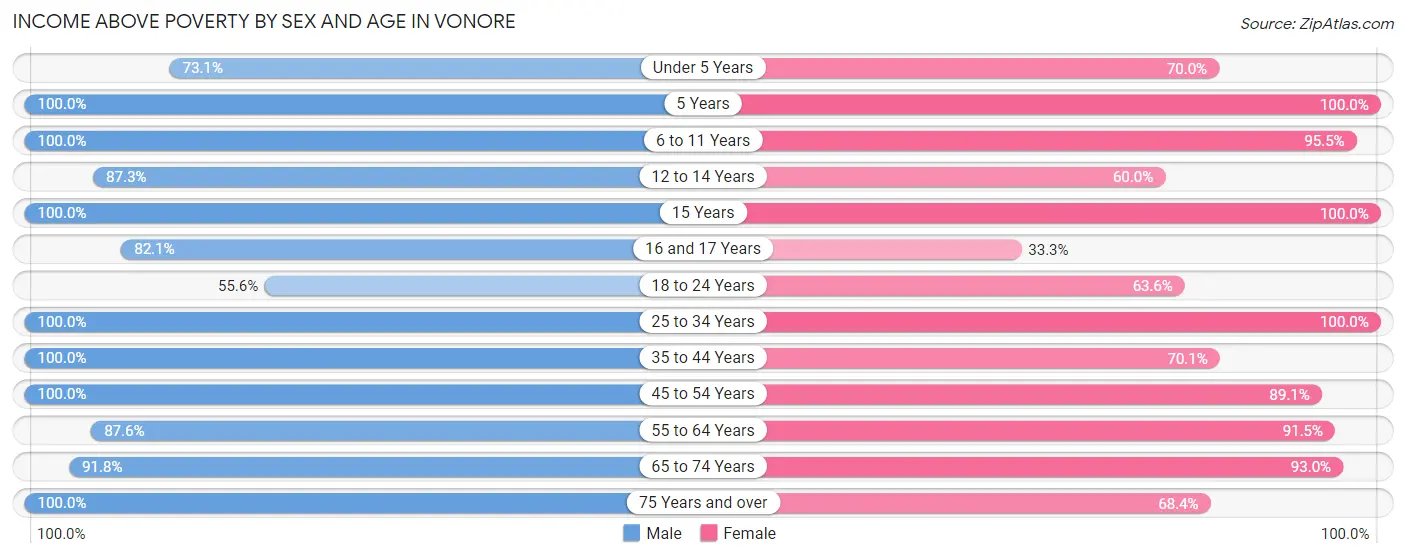
| Age Bracket | Male | Female |
| Under 5 Years | 19 (73.1%) | 28 (70.0%) |
| 5 Years | 3 (100.0%) | 10 (100.0%) |
| 6 to 11 Years | 79 (100.0%) | 64 (95.5%) |
| 12 to 14 Years | 48 (87.3%) | 9 (60.0%) |
| 15 Years | 4 (100.0%) | 7 (100.0%) |
| 16 and 17 Years | 64 (82.1%) | 11 (33.3%) |
| 18 to 24 Years | 20 (55.6%) | 14 (63.6%) |
| 25 to 34 Years | 112 (100.0%) | 154 (100.0%) |
| 35 to 44 Years | 66 (100.0%) | 61 (70.1%) |
| 45 to 54 Years | 85 (100.0%) | 122 (89.0%) |
| 55 to 64 Years | 92 (87.6%) | 97 (91.5%) |
| 65 to 74 Years | 178 (91.7%) | 133 (93.0%) |
| 75 Years and over | 24 (100.0%) | 26 (68.4%) |
| Total | 794 (91.6%) | 736 (85.7%) |
Income Below Poverty Among Married-Couple Families in Vonore
The poverty statistics for married-couple families in Vonore show that 1.9% or 7 of the total 363 families live below the poverty line. Families with no children have the highest poverty rate of 2.4%, comprising of 7 families. On the other hand, families with 1 or 2 children have the lowest poverty rate of 0.0%, which includes 0 families.
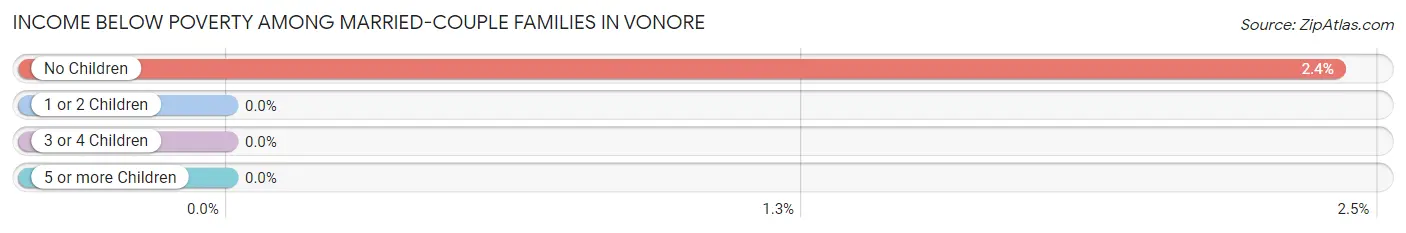
| Children | Above Poverty | Below Poverty |
| No Children | 284 (97.6%) | 7 (2.4%) |
| 1 or 2 Children | 48 (100.0%) | 0 (0.0%) |
| 3 or 4 Children | 24 (100.0%) | 0 (0.0%) |
| 5 or more Children | 0 (0.0%) | 0 (0.0%) |
| Total | 356 (98.1%) | 7 (1.9%) |
Income Below Poverty Among Single-Parent Households in Vonore
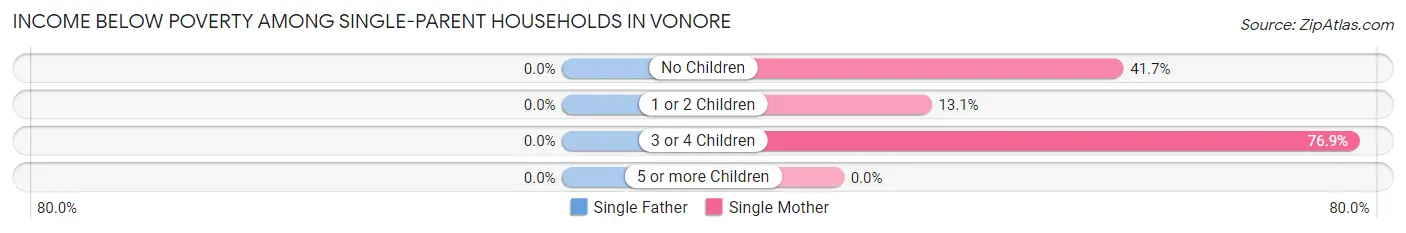
| Children | Single Father | Single Mother |
| No Children | 0 (0.0%) | 10 (41.7%) |
| 1 or 2 Children | 0 (0.0%) | 17 (13.1%) |
| 3 or 4 Children | 0 (0.0%) | 10 (76.9%) |
| 5 or more Children | 0 (0.0%) | 0 (0.0%) |
| Total | 0 (0.0%) | 37 (22.2%) |
Income Below Poverty Among Married-Couple vs Single-Parent Households in Vonore
The poverty data for Vonore shows that 7 of the married-couple family households (1.9%) and 37 of the single-parent households (17.2%) are living below the poverty level. Within the married-couple family households, those with no children have the highest poverty rate, with 7 households (2.4%) falling below the poverty line. Among the single-parent households, those with 3 or 4 children have the highest poverty rate, with 10 household (76.9%) living below poverty.
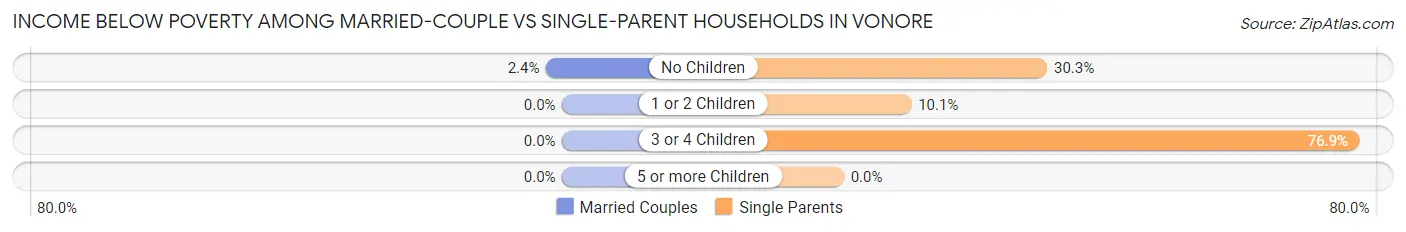
| Children | Married-Couple Families | Single-Parent Households |
| No Children | 7 (2.4%) | 10 (30.3%) |
| 1 or 2 Children | 0 (0.0%) | 17 (10.1%) |
| 3 or 4 Children | 0 (0.0%) | 10 (76.9%) |
| 5 or more Children | 0 (0.0%) | 0 (0.0%) |
| Total | 7 (1.9%) | 37 (17.2%) |
Race in Vonore
The most populous races in Vonore are White / Caucasian (1,498 | 86.6%), Black / African American (144 | 8.3%), and Asian (49 | 2.8%).
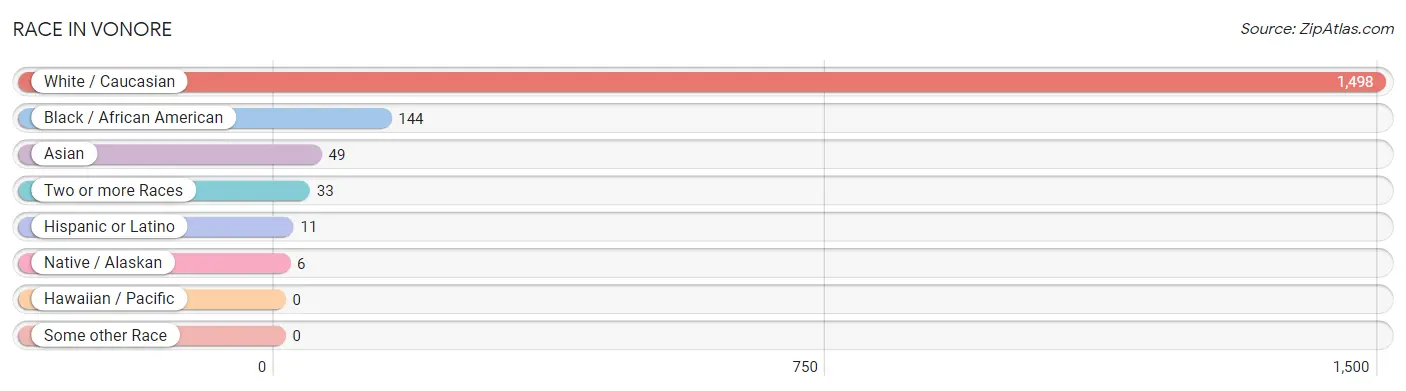
| Race | # Population | % Population |
| Asian | 49 | 2.8% |
| Black / African American | 144 | 8.3% |
| Hawaiian / Pacific | 0 | 0.0% |
| Hispanic or Latino | 11 | 0.6% |
| Native / Alaskan | 6 | 0.4% |
| White / Caucasian | 1,498 | 86.6% |
| Two or more Races | 33 | 1.9% |
| Some other Race | 0 | 0.0% |
| Total | 1,730 | 100.0% |
Ancestry in Vonore
The most populous ancestries reported in Vonore are Irish (282 | 16.3%), English (192 | 11.1%), German (189 | 10.9%), American (161 | 9.3%), and French (80 | 4.6%), together accounting for 52.3% of all Vonore residents.
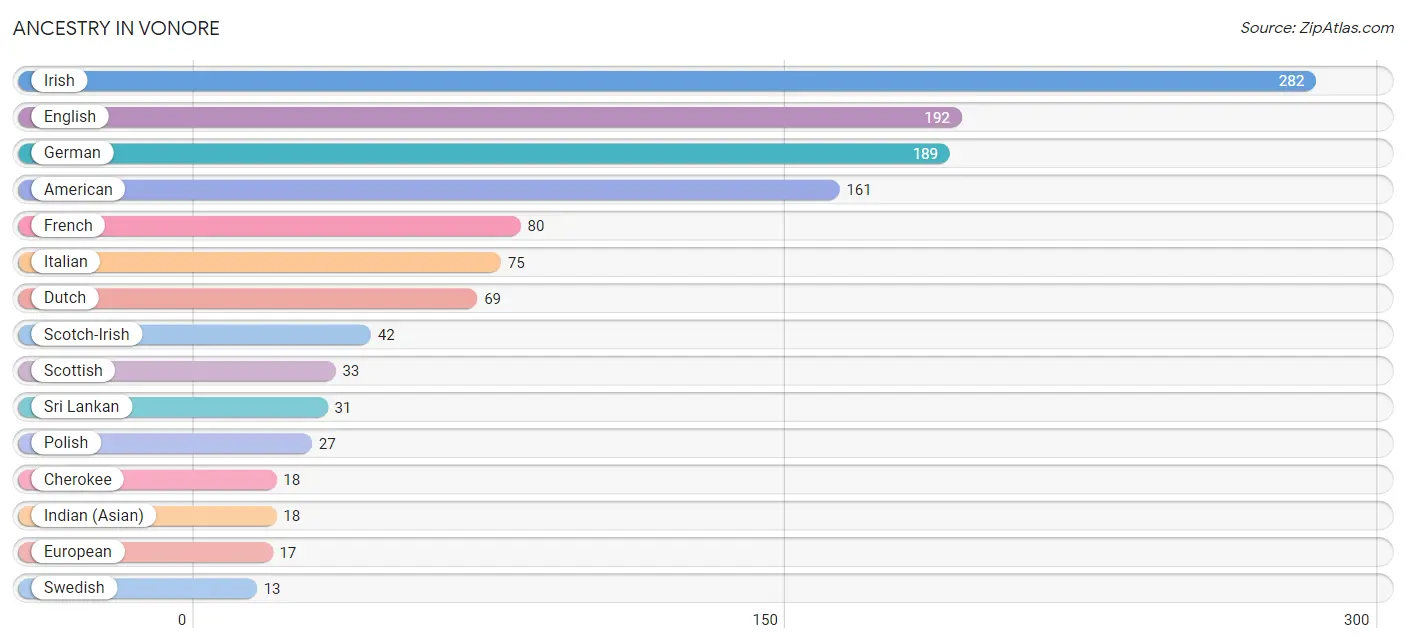
| Ancestry | # Population | % Population |
| American | 161 | 9.3% |
| Canadian | 5 | 0.3% |
| Cherokee | 18 | 1.0% |
| Czech | 3 | 0.2% |
| Dutch | 69 | 4.0% |
| English | 192 | 11.1% |
| European | 17 | 1.0% |
| French | 80 | 4.6% |
| French Canadian | 7 | 0.4% |
| German | 189 | 10.9% |
| Indian (Asian) | 18 | 1.0% |
| Irish | 282 | 16.3% |
| Italian | 75 | 4.3% |
| Mexican | 11 | 0.6% |
| Norwegian | 8 | 0.5% |
| Polish | 27 | 1.6% |
| Portuguese | 2 | 0.1% |
| Russian | 4 | 0.2% |
| Scandinavian | 4 | 0.2% |
| Scotch-Irish | 42 | 2.4% |
| Scottish | 33 | 1.9% |
| Slovak | 5 | 0.3% |
| Sri Lankan | 31 | 1.8% |
| Swedish | 13 | 0.7% |
| Swiss | 3 | 0.2% |
| Welsh | 7 | 0.4% | View All 26 Rows |
Immigrants in Vonore
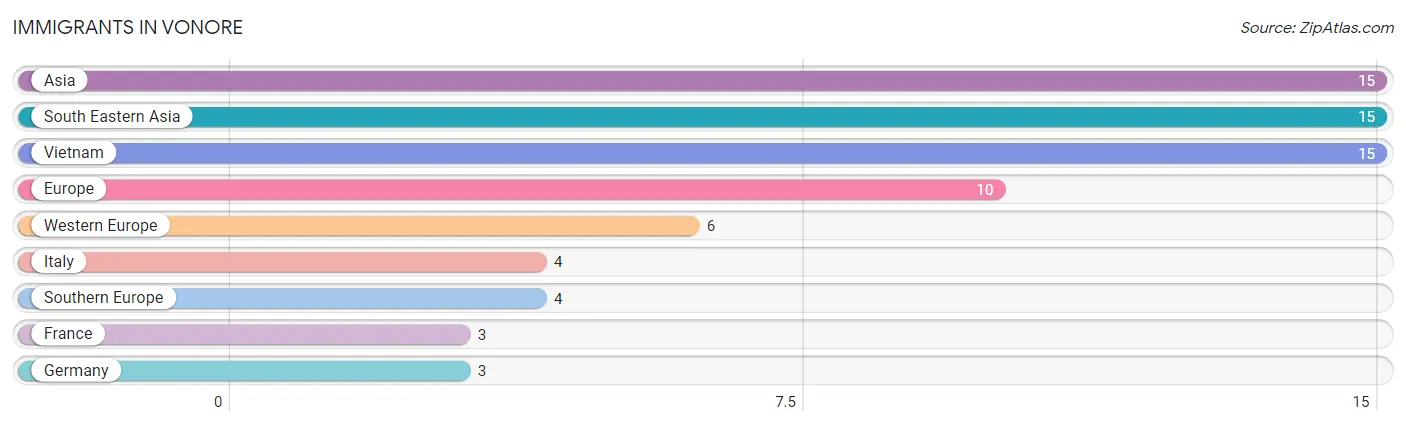
The most numerous immigrant groups reported in Vonore came from Asia (15 | 0.9%), South Eastern Asia (15 | 0.9%), Vietnam (15 | 0.9%), Europe (10 | 0.6%), and Western Europe (6 | 0.4%), together accounting for 3.5% of all Vonore residents.
| Immigration Origin | # Population | % Population |
| Asia | 15 | 0.9% |
| Europe | 10 | 0.6% |
| France | 3 | 0.2% |
| Germany | 3 | 0.2% |
| Italy | 4 | 0.2% |
| South Eastern Asia | 15 | 0.9% |
| Southern Europe | 4 | 0.2% |
| Vietnam | 15 | 0.9% |
| Western Europe | 6 | 0.4% | View All 9 Rows |
Sex and Age in Vonore
Sex and Age in Vonore
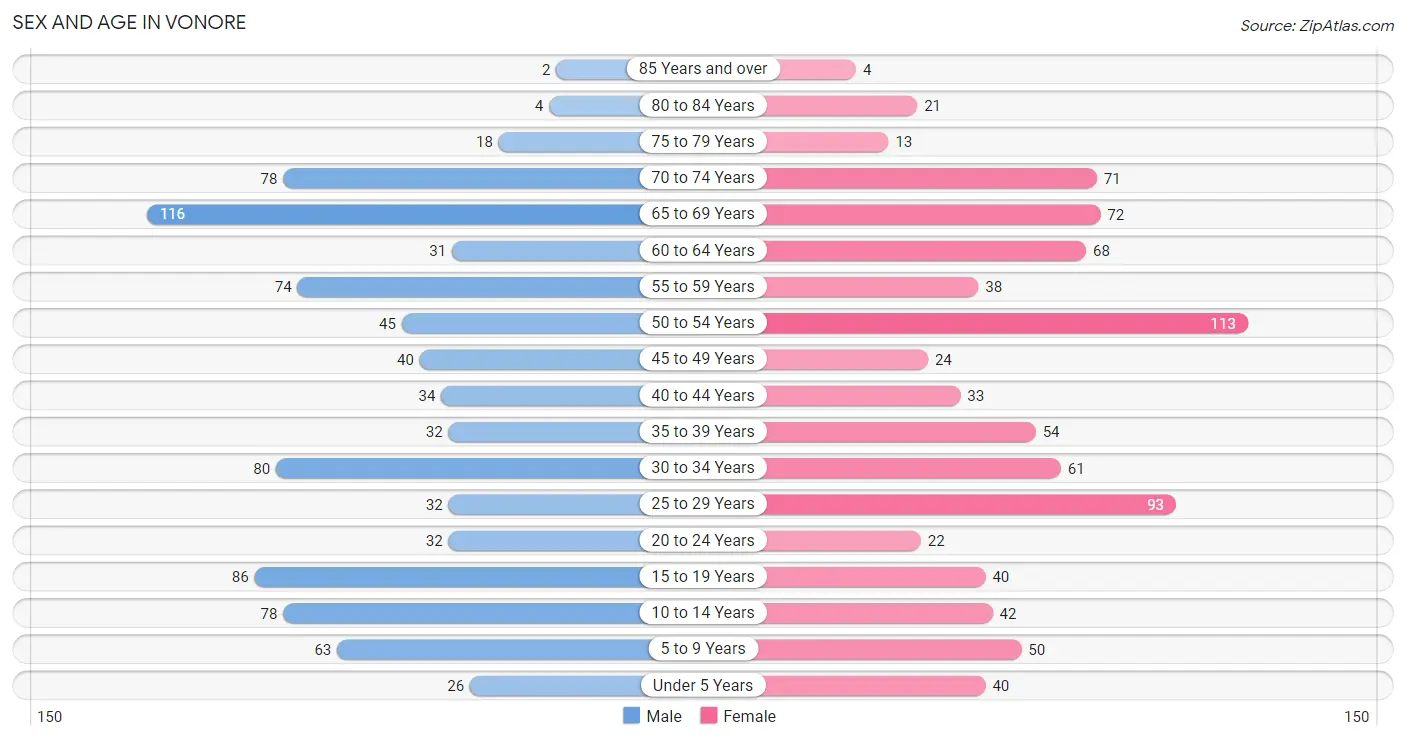
The most populous age groups in Vonore are 65 to 69 Years (116 | 13.3%) for men and 50 to 54 Years (113 | 13.2%) for women.
| Age Bracket | Male | Female |
| Under 5 Years | 26 (3.0%) | 40 (4.7%) |
| 5 to 9 Years | 63 (7.2%) | 50 (5.8%) |
| 10 to 14 Years | 78 (9.0%) | 42 (4.9%) |
| 15 to 19 Years | 86 (9.9%) | 40 (4.7%) |
| 20 to 24 Years | 32 (3.7%) | 22 (2.6%) |
| 25 to 29 Years | 32 (3.7%) | 93 (10.8%) |
| 30 to 34 Years | 80 (9.2%) | 61 (7.1%) |
| 35 to 39 Years | 32 (3.7%) | 54 (6.3%) |
| 40 to 44 Years | 34 (3.9%) | 33 (3.8%) |
| 45 to 49 Years | 40 (4.6%) | 24 (2.8%) |
| 50 to 54 Years | 45 (5.2%) | 113 (13.2%) |
| 55 to 59 Years | 74 (8.5%) | 38 (4.4%) |
| 60 to 64 Years | 31 (3.6%) | 68 (7.9%) |
| 65 to 69 Years | 116 (13.3%) | 72 (8.4%) |
| 70 to 74 Years | 78 (9.0%) | 71 (8.3%) |
| 75 to 79 Years | 18 (2.1%) | 13 (1.5%) |
| 80 to 84 Years | 4 (0.5%) | 21 (2.4%) |
| 85 Years and over | 2 (0.2%) | 4 (0.5%) |
| Total | 871 (100.0%) | 859 (100.0%) |
Families and Households in Vonore
Median Family Size in Vonore
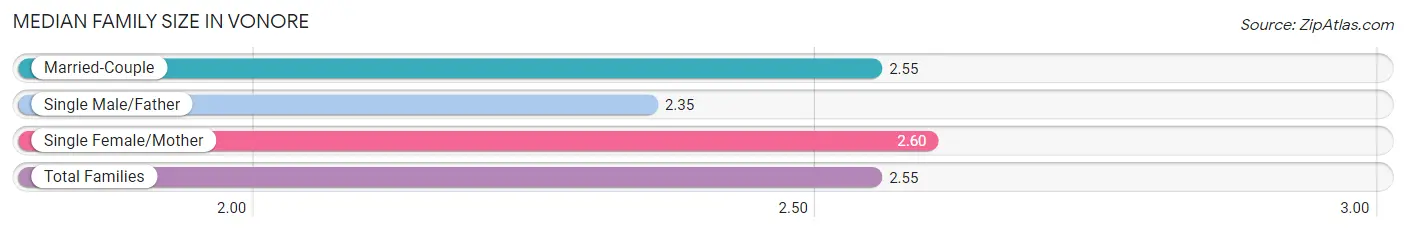
The median family size in Vonore is 2.55 persons per family, with single female/mother families (167 | 28.9%) accounting for the largest median family size of 2.6 persons per family. On the other hand, single male/father families (48 | 8.3%) represent the smallest median family size with 2.35 persons per family.
| Family Type | # Families | Family Size |
| Married-Couple | 363 (62.8%) | 2.55 |
| Single Male/Father | 48 (8.3%) | 2.35 |
| Single Female/Mother | 167 (28.9%) | 2.60 |
| Total Families | 578 (100.0%) | 2.55 |
Median Household Size in Vonore
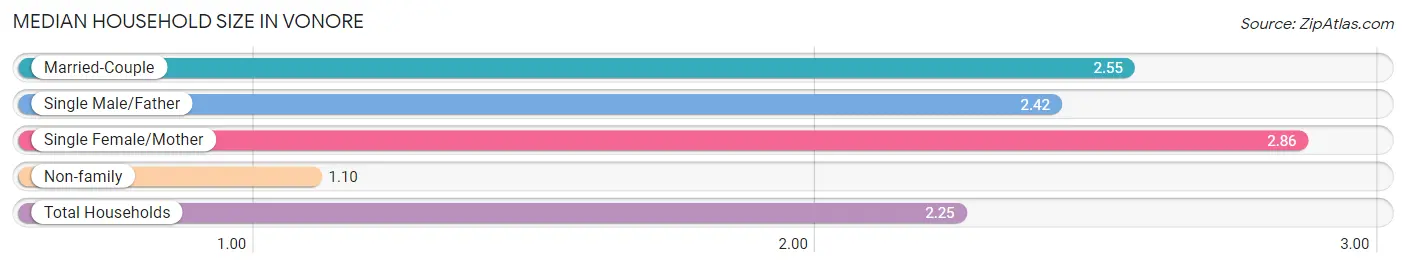
The median household size in Vonore is 2.25 persons per household, with single female/mother households (167 | 21.8%) accounting for the largest median household size of 2.86 persons per household. non-family households (189 | 24.6%) represent the smallest median household size with 1.10 persons per household.
| Household Type | # Households | Household Size |
| Married-Couple | 363 (47.3%) | 2.55 |
| Single Male/Father | 48 (6.3%) | 2.42 |
| Single Female/Mother | 167 (21.8%) | 2.86 |
| Non-family | 189 (24.6%) | 1.10 |
| Total Households | 767 (100.0%) | 2.25 |
Household Size by Marriage Status in Vonore
Out of a total of 767 households in Vonore, 578 (75.4%) are family households, while 189 (24.6%) are nonfamily households. The most numerous type of family households are 2-person households, comprising 324, and the most common type of nonfamily households are 1-person households, comprising 179.
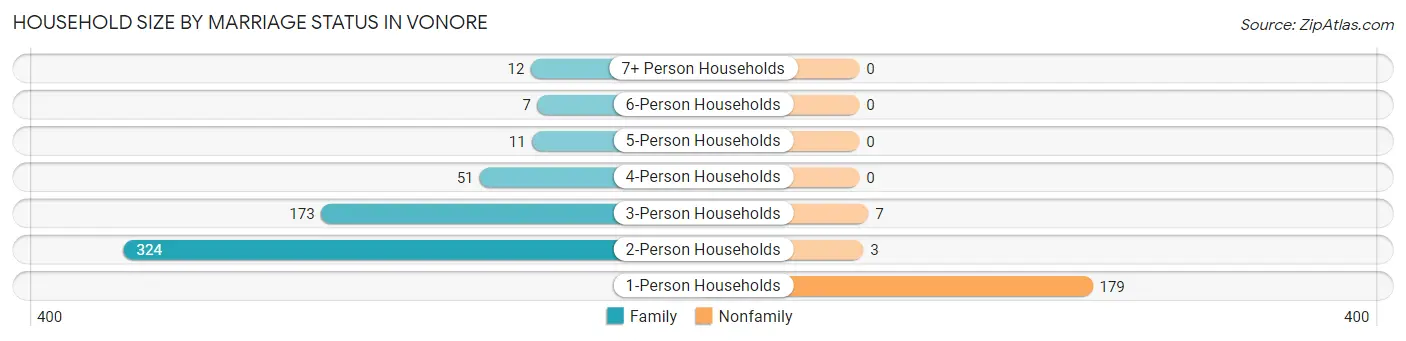
| Household Size | Family Households | Nonfamily Households |
| 1-Person Households | - | 179 (23.3%) |
| 2-Person Households | 324 (42.2%) | 3 (0.4%) |
| 3-Person Households | 173 (22.6%) | 7 (0.9%) |
| 4-Person Households | 51 (6.7%) | 0 (0.0%) |
| 5-Person Households | 11 (1.4%) | 0 (0.0%) |
| 6-Person Households | 7 (0.9%) | 0 (0.0%) |
| 7+ Person Households | 12 (1.6%) | 0 (0.0%) |
| Total | 578 (75.4%) | 189 (24.6%) |
Female Fertility in Vonore
Fertility by Age in Vonore
Average fertility rate in Vonore is 9.0 births per 1,000 women. Women in the age bracket of 35 to 50 years have the highest fertility rate with 23.0 births per 1,000 women. Women in the age bracket of 35 to 50 years acount for 100.0% of all women with births.
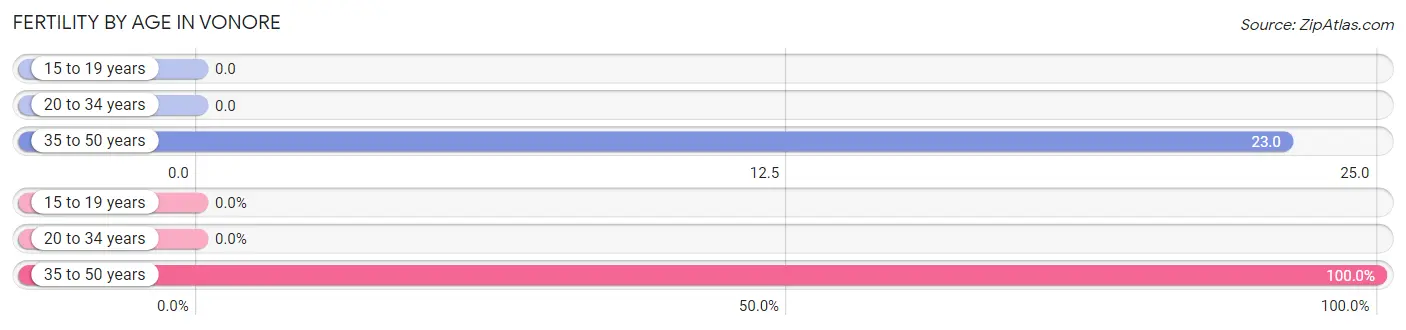
| Age Bracket | Women with Births | Births / 1,000 Women |
| 15 to 19 years | 0 (0.0%) | 0.0 |
| 20 to 34 years | 0 (0.0%) | 0.0 |
| 35 to 50 years | 3 (100.0%) | 23.0 |
| Total | 3 (100.0%) | 9.0 |
Fertility by Age by Marriage Status in Vonore
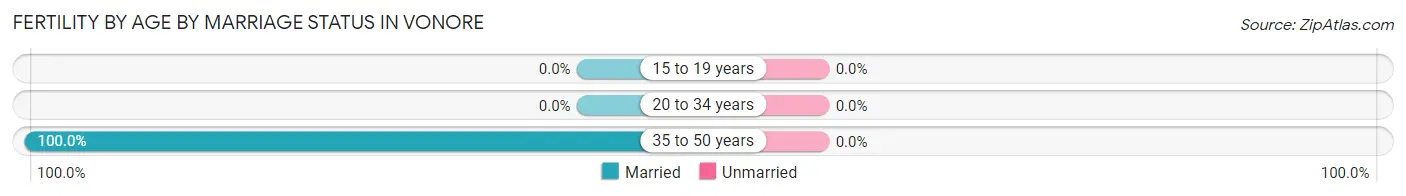
| Age Bracket | Married | Unmarried |
| 15 to 19 years | 0 (0.0%) | 0 (0.0%) |
| 20 to 34 years | 0 (0.0%) | 0 (0.0%) |
| 35 to 50 years | 3 (100.0%) | 0 (0.0%) |
| Total | 3 (100.0%) | 0 (0.0%) |
Fertility by Education in Vonore
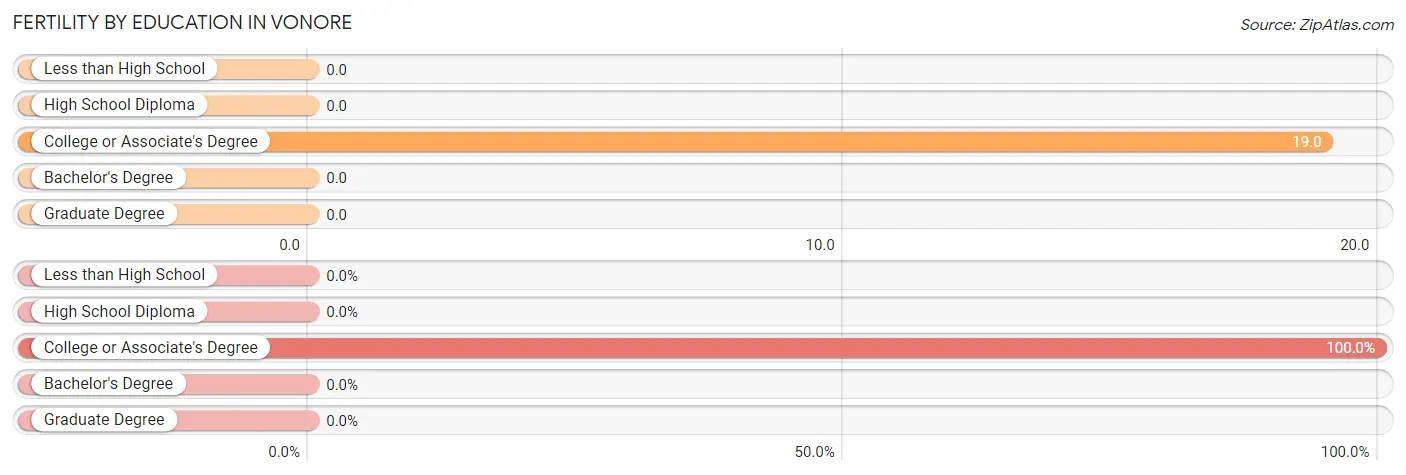
| Educational Attainment | Women with Births | Births / 1,000 Women |
| Less than High School | 0 (0.0%) | 0.0 |
| High School Diploma | 0 (0.0%) | 0.0 |
| College or Associate's Degree | 3 (100.0%) | 19.0 |
| Bachelor's Degree | 0 (0.0%) | 0.0 |
| Graduate Degree | 0 (0.0%) | 0.0 |
| Total | 3 (100.0%) | 9.0 |
Fertility by Education by Marriage Status in Vonore
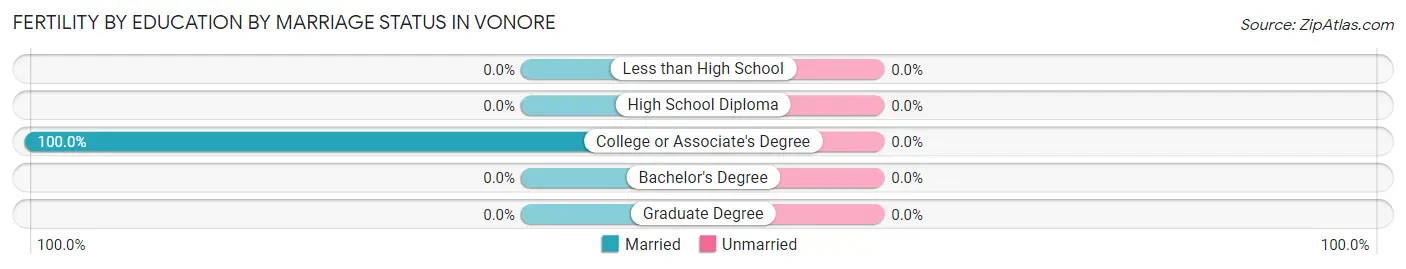
| Educational Attainment | Married | Unmarried |
| Less than High School | 0 (0.0%) | 0 (0.0%) |
| High School Diploma | 0 (0.0%) | 0 (0.0%) |
| College or Associate's Degree | 3 (100.0%) | 0 (0.0%) |
| Bachelor's Degree | 0 (0.0%) | 0 (0.0%) |
| Graduate Degree | 0 (0.0%) | 0 (0.0%) |
| Total | 3 (100.0%) | 0 (0.0%) |
Employment Characteristics in Vonore
Employment by Class of Employer in Vonore
Among the 689 employed individuals in Vonore, private company employees (537 | 77.9%), self-employed (not incorporated) (75 | 10.9%), and not-for-profit organizations (22 | 3.2%) make up the most common classes of employment.
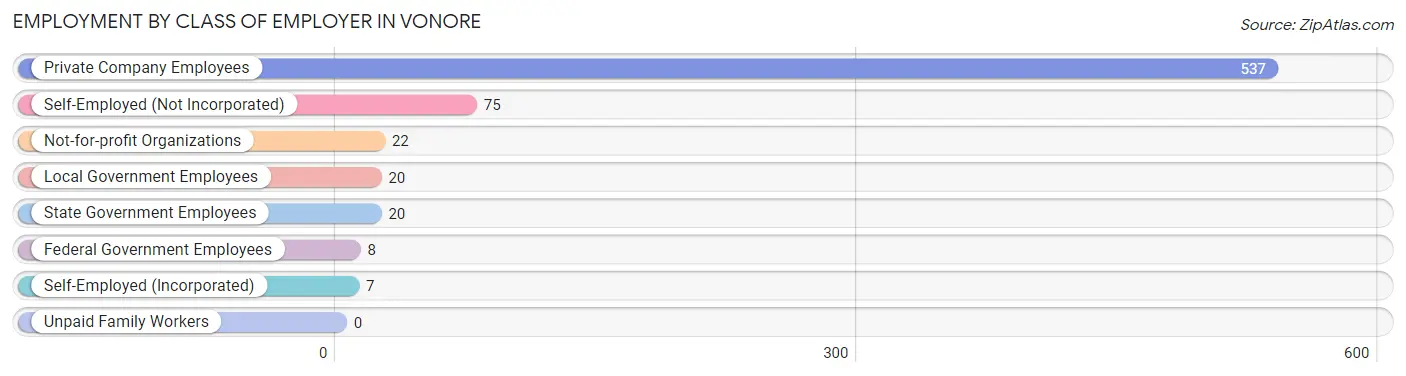
| Employer Class | # Employees | % Employees |
| Private Company Employees | 537 | 77.9% |
| Self-Employed (Incorporated) | 7 | 1.0% |
| Self-Employed (Not Incorporated) | 75 | 10.9% |
| Not-for-profit Organizations | 22 | 3.2% |
| Local Government Employees | 20 | 2.9% |
| State Government Employees | 20 | 2.9% |
| Federal Government Employees | 8 | 1.2% |
| Unpaid Family Workers | 0 | 0.0% |
| Total | 689 | 100.0% |
Employment Status by Age in Vonore
According to the labor force statistics for Vonore, out of the total population over 16 years of age (1,420), 55.2% or 784 individuals are in the labor force, with 3.5% or 27 of them unemployed. The age group with the highest labor force participation rate is 30 to 34 years, with 97.2% or 137 individuals in the labor force. Within the labor force, the 35 to 44 years age range has the highest percentage of unemployed individuals, with 13.2% or 15 of them being unemployed.
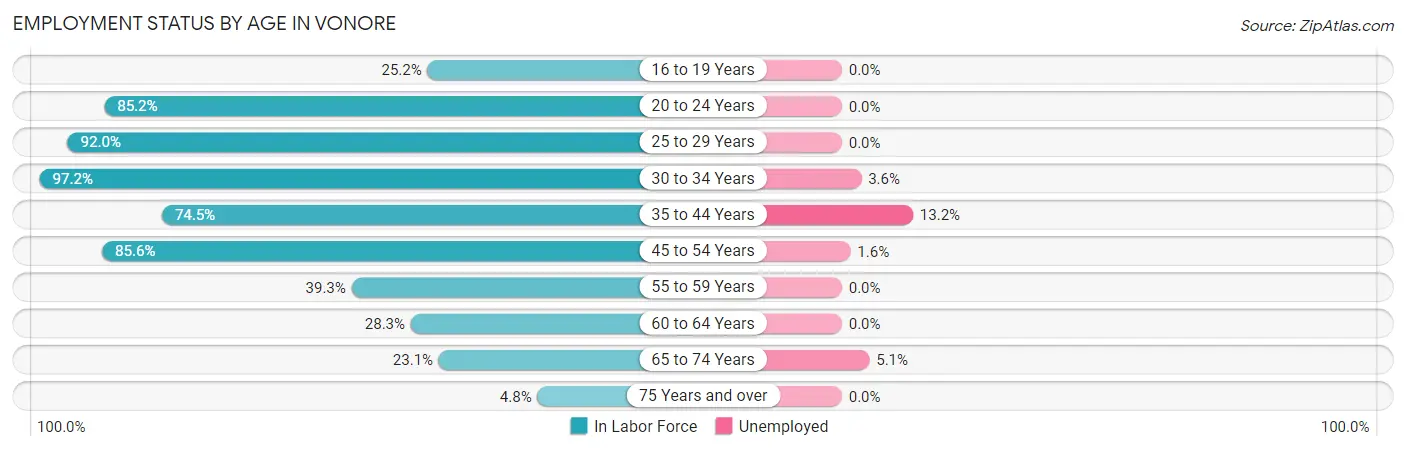
| Age Bracket | In Labor Force | Unemployed |
| 16 to 19 Years | 29 (25.2%) | 0 (0.0%) |
| 20 to 24 Years | 46 (85.2%) | 0 (0.0%) |
| 25 to 29 Years | 115 (92.0%) | 0 (0.0%) |
| 30 to 34 Years | 137 (97.2%) | 5 (3.6%) |
| 35 to 44 Years | 114 (74.5%) | 15 (13.2%) |
| 45 to 54 Years | 190 (85.6%) | 3 (1.6%) |
| 55 to 59 Years | 44 (39.3%) | 0 (0.0%) |
| 60 to 64 Years | 28 (28.3%) | 0 (0.0%) |
| 65 to 74 Years | 78 (23.1%) | 4 (5.1%) |
| 75 Years and over | 3 (4.8%) | 0 (0.0%) |
| Total | 784 (55.2%) | 27 (3.5%) |
Employment Status by Educational Attainment in Vonore
According to labor force statistics for Vonore, 73.7% of individuals (628) out of the total population between 25 and 64 years of age (852) are in the labor force, with 3.7% or 23 of them being unemployed. The group with the highest labor force participation rate are those with the educational attainment of bachelor's degree or higher, with 79.3% or 153 individuals in the labor force. Within the labor force, individuals with bachelor's degree or higher education have the highest percentage of unemployment, with 5.9% or 9 of them being unemployed.
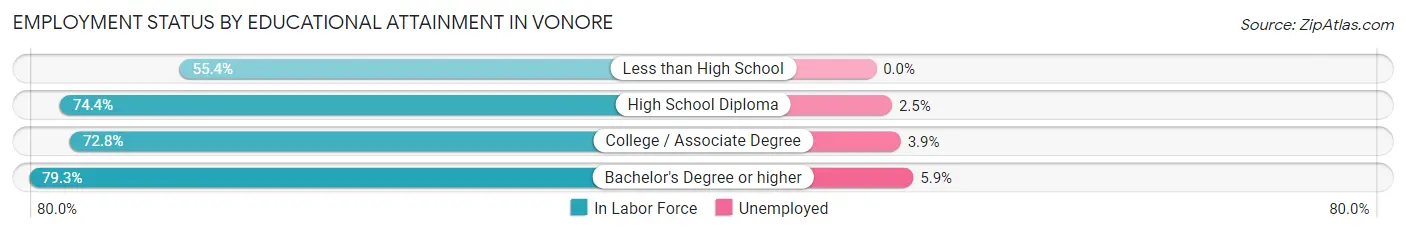
| Educational Attainment | In Labor Force | Unemployed |
| Less than High School | 31 (55.4%) | 0 (0.0%) |
| High School Diploma | 238 (74.4%) | 8 (2.5%) |
| College / Associate Degree | 206 (72.8%) | 11 (3.9%) |
| Bachelor's Degree or higher | 153 (79.3%) | 11 (5.9%) |
| Total | 628 (73.7%) | 32 (3.7%) |
Employment Occupations by Sex in Vonore
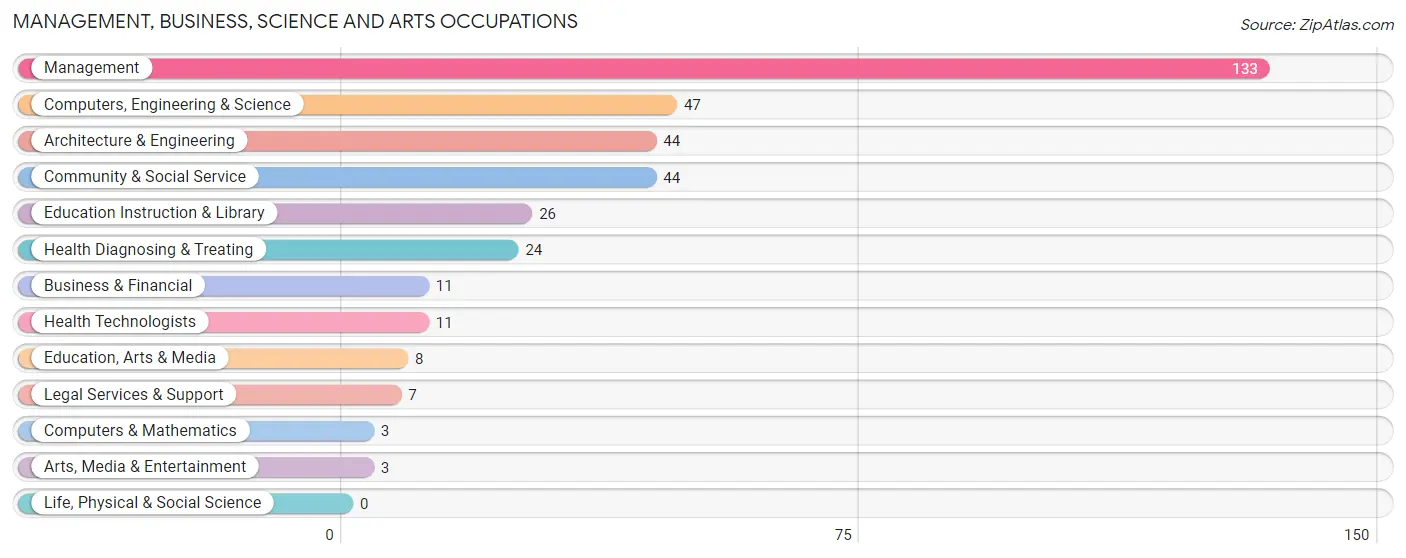
Management, Business, Science and Arts Occupations
The most common Management, Business, Science and Arts occupations in Vonore are Management (133 | 17.6%), Computers, Engineering & Science (47 | 6.2%), Architecture & Engineering (44 | 5.8%), Community & Social Service (44 | 5.8%), and Education Instruction & Library (26 | 3.4%).
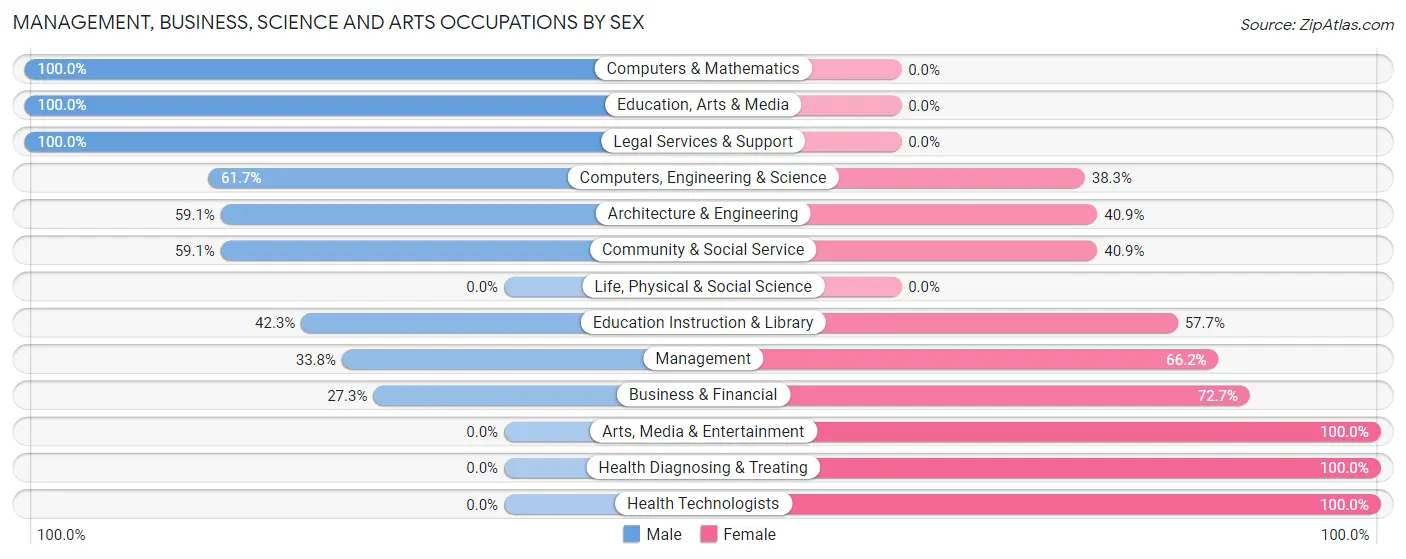
Management, Business, Science and Arts Occupations by Sex
Within the Management, Business, Science and Arts occupations in Vonore, the most male-oriented occupations are Computers & Mathematics (100.0%), Education, Arts & Media (100.0%), and Legal Services & Support (100.0%), while the most female-oriented occupations are Arts, Media & Entertainment (100.0%), Health Diagnosing & Treating (100.0%), and Health Technologists (100.0%).
| Occupation | Male | Female |
| Management | 45 (33.8%) | 88 (66.2%) |
| Business & Financial | 3 (27.3%) | 8 (72.7%) |
| Computers, Engineering & Science | 29 (61.7%) | 18 (38.3%) |
| Computers & Mathematics | 3 (100.0%) | 0 (0.0%) |
| Architecture & Engineering | 26 (59.1%) | 18 (40.9%) |
| Life, Physical & Social Science | 0 (0.0%) | 0 (0.0%) |
| Community & Social Service | 26 (59.1%) | 18 (40.9%) |
| Education, Arts & Media | 8 (100.0%) | 0 (0.0%) |
| Legal Services & Support | 7 (100.0%) | 0 (0.0%) |
| Education Instruction & Library | 11 (42.3%) | 15 (57.7%) |
| Arts, Media & Entertainment | 0 (0.0%) | 3 (100.0%) |
| Health Diagnosing & Treating | 0 (0.0%) | 24 (100.0%) |
| Health Technologists | 0 (0.0%) | 11 (100.0%) |
| Total (Category) | 103 (39.8%) | 156 (60.2%) |
| Total (Overall) | 370 (49.0%) | 385 (51.0%) |
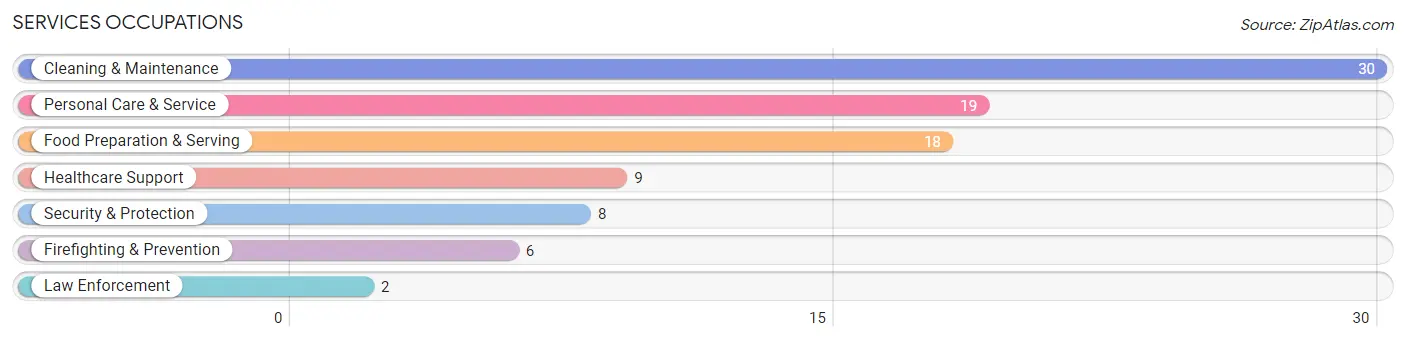
Services Occupations
The most common Services occupations in Vonore are Cleaning & Maintenance (30 | 4.0%), Personal Care & Service (19 | 2.5%), Food Preparation & Serving (18 | 2.4%), Healthcare Support (9 | 1.2%), and Security & Protection (8 | 1.1%).
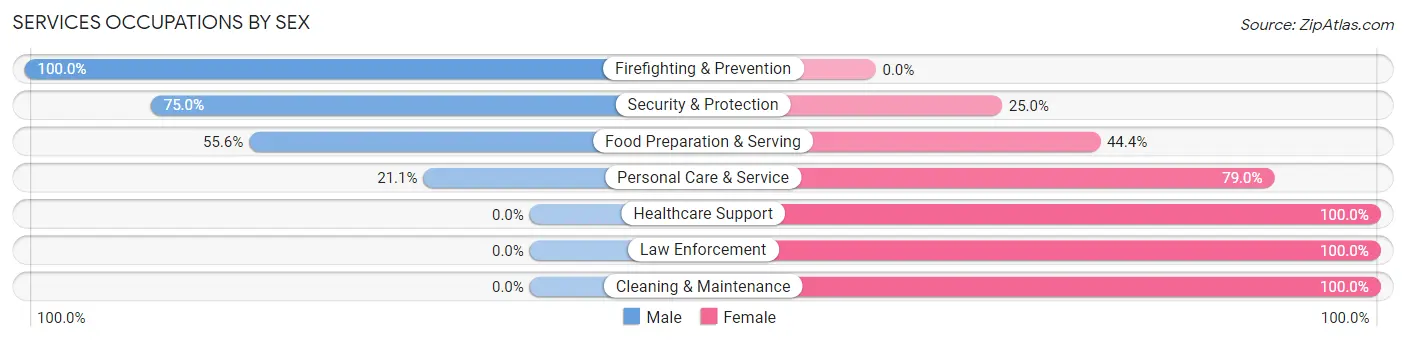
Services Occupations by Sex
Within the Services occupations in Vonore, the most male-oriented occupations are Firefighting & Prevention (100.0%), Security & Protection (75.0%), and Food Preparation & Serving (55.6%), while the most female-oriented occupations are Healthcare Support (100.0%), Law Enforcement (100.0%), and Cleaning & Maintenance (100.0%).
| Occupation | Male | Female |
| Healthcare Support | 0 (0.0%) | 9 (100.0%) |
| Security & Protection | 6 (75.0%) | 2 (25.0%) |
| Firefighting & Prevention | 6 (100.0%) | 0 (0.0%) |
| Law Enforcement | 0 (0.0%) | 2 (100.0%) |
| Food Preparation & Serving | 10 (55.6%) | 8 (44.4%) |
| Cleaning & Maintenance | 0 (0.0%) | 30 (100.0%) |
| Personal Care & Service | 4 (21.0%) | 15 (78.9%) |
| Total (Category) | 20 (23.8%) | 64 (76.2%) |
| Total (Overall) | 370 (49.0%) | 385 (51.0%) |
Sales and Office Occupations
The most common Sales and Office occupations in Vonore are Sales & Related (96 | 12.7%), and Office & Administration (34 | 4.5%).
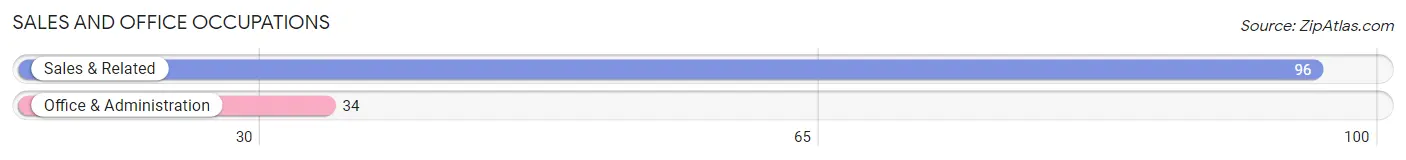
Sales and Office Occupations by Sex
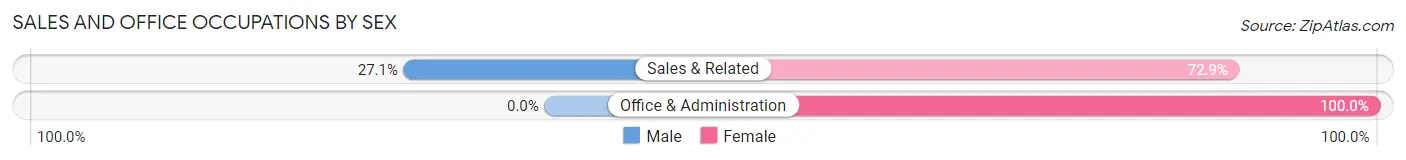
| Occupation | Male | Female |
| Sales & Related | 26 (27.1%) | 70 (72.9%) |
| Office & Administration | 0 (0.0%) | 34 (100.0%) |
| Total (Category) | 26 (20.0%) | 104 (80.0%) |
| Total (Overall) | 370 (49.0%) | 385 (51.0%) |
Natural Resources, Construction and Maintenance Occupations
The most common Natural Resources, Construction and Maintenance occupations in Vonore are Installation, Maintenance & Repair (107 | 14.2%), and Construction & Extraction (7 | 0.9%).
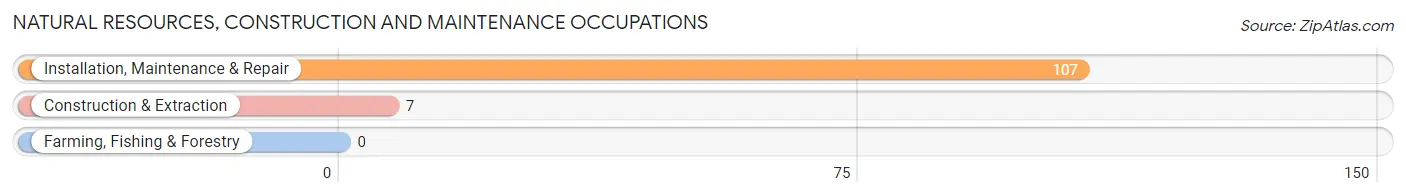
Natural Resources, Construction and Maintenance Occupations by Sex
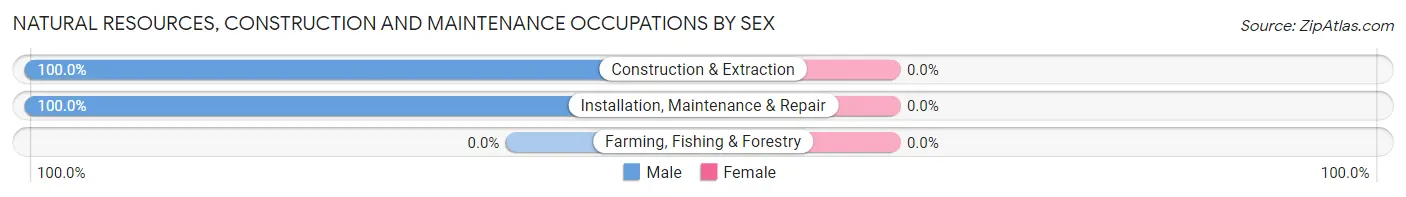
| Occupation | Male | Female |
| Farming, Fishing & Forestry | 0 (0.0%) | 0 (0.0%) |
| Construction & Extraction | 7 (100.0%) | 0 (0.0%) |
| Installation, Maintenance & Repair | 107 (100.0%) | 0 (0.0%) |
| Total (Category) | 114 (100.0%) | 0 (0.0%) |
| Total (Overall) | 370 (49.0%) | 385 (51.0%) |
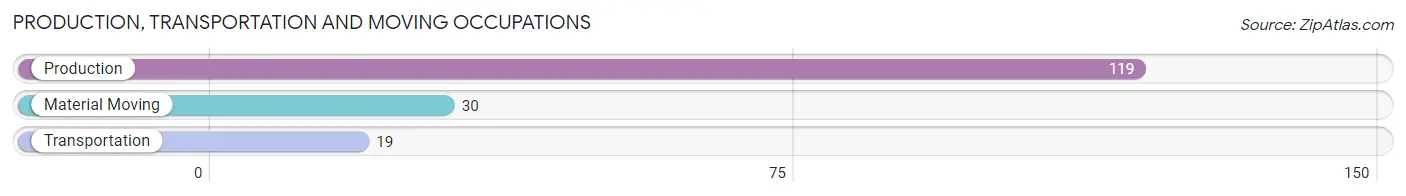
Production, Transportation and Moving Occupations
The most common Production, Transportation and Moving occupations in Vonore are Production (119 | 15.8%), Material Moving (30 | 4.0%), and Transportation (19 | 2.5%).
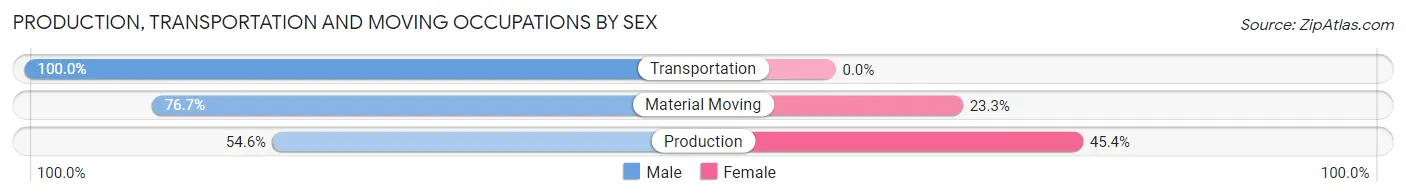
Production, Transportation and Moving Occupations by Sex
| Occupation | Male | Female |
| Production | 65 (54.6%) | 54 (45.4%) |
| Transportation | 19 (100.0%) | 0 (0.0%) |
| Material Moving | 23 (76.7%) | 7 (23.3%) |
| Total (Category) | 107 (63.7%) | 61 (36.3%) |
| Total (Overall) | 370 (49.0%) | 385 (51.0%) |
Employment Industries by Sex in Vonore
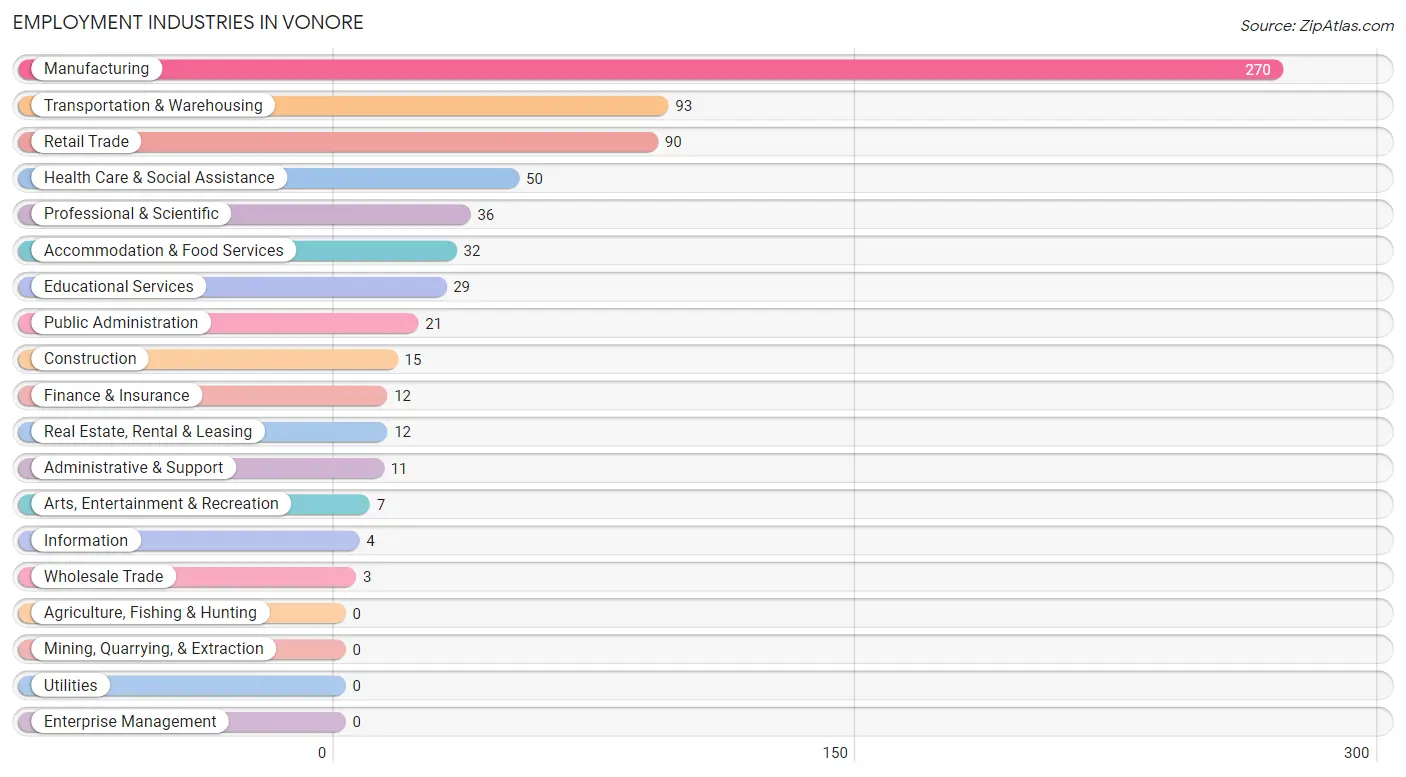
Employment Industries in Vonore
The major employment industries in Vonore include Manufacturing (270 | 35.8%), Transportation & Warehousing (93 | 12.3%), Retail Trade (90 | 11.9%), Health Care & Social Assistance (50 | 6.6%), and Professional & Scientific (36 | 4.8%).
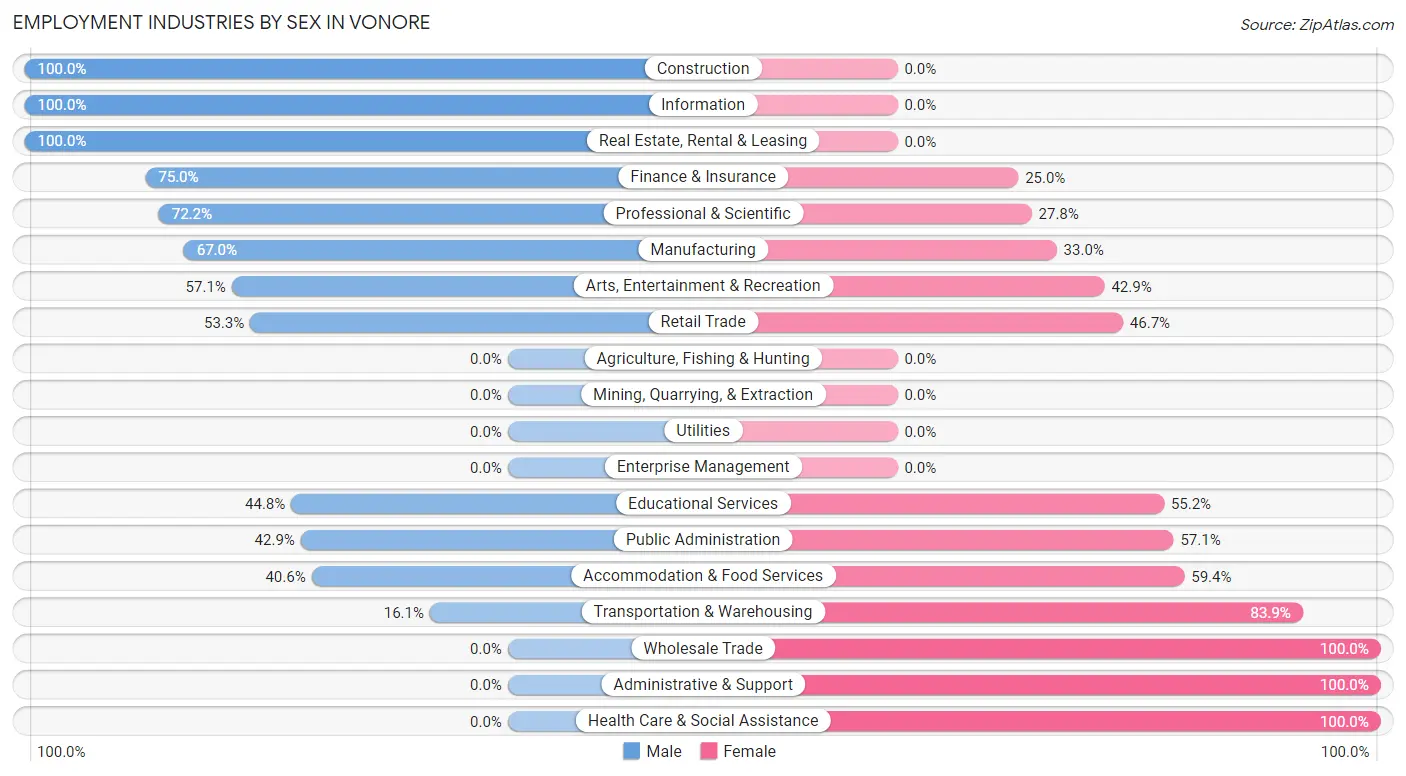
Employment Industries by Sex in Vonore
The Vonore industries that see more men than women are Construction (100.0%), Information (100.0%), and Real Estate, Rental & Leasing (100.0%), whereas the industries that tend to have a higher number of women are Wholesale Trade (100.0%), Administrative & Support (100.0%), and Health Care & Social Assistance (100.0%).
| Industry | Male | Female |
| Agriculture, Fishing & Hunting | 0 (0.0%) | 0 (0.0%) |
| Mining, Quarrying, & Extraction | 0 (0.0%) | 0 (0.0%) |
| Construction | 15 (100.0%) | 0 (0.0%) |
| Manufacturing | 181 (67.0%) | 89 (33.0%) |
| Wholesale Trade | 0 (0.0%) | 3 (100.0%) |
| Retail Trade | 48 (53.3%) | 42 (46.7%) |
| Transportation & Warehousing | 15 (16.1%) | 78 (83.9%) |
| Utilities | 0 (0.0%) | 0 (0.0%) |
| Information | 4 (100.0%) | 0 (0.0%) |
| Finance & Insurance | 9 (75.0%) | 3 (25.0%) |
| Real Estate, Rental & Leasing | 12 (100.0%) | 0 (0.0%) |
| Professional & Scientific | 26 (72.2%) | 10 (27.8%) |
| Enterprise Management | 0 (0.0%) | 0 (0.0%) |
| Administrative & Support | 0 (0.0%) | 11 (100.0%) |
| Educational Services | 13 (44.8%) | 16 (55.2%) |
| Health Care & Social Assistance | 0 (0.0%) | 50 (100.0%) |
| Arts, Entertainment & Recreation | 4 (57.1%) | 3 (42.9%) |
| Accommodation & Food Services | 13 (40.6%) | 19 (59.4%) |
| Public Administration | 9 (42.9%) | 12 (57.1%) |
| Total | 370 (49.0%) | 385 (51.0%) |
Education in Vonore
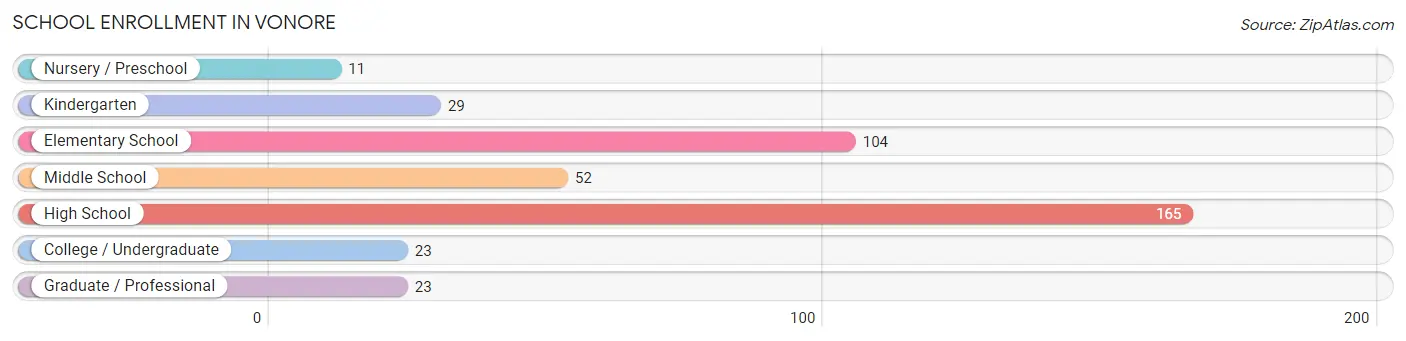
School Enrollment in Vonore
The most common levels of schooling among the 407 students in Vonore are high school (165 | 40.5%), elementary school (104 | 25.6%), and middle school (52 | 12.8%).
| School Level | # Students | % Students |
| Nursery / Preschool | 11 | 2.7% |
| Kindergarten | 29 | 7.1% |
| Elementary School | 104 | 25.6% |
| Middle School | 52 | 12.8% |
| High School | 165 | 40.5% |
| College / Undergraduate | 23 | 5.7% |
| Graduate / Professional | 23 | 5.7% |
| Total | 407 | 100.0% |
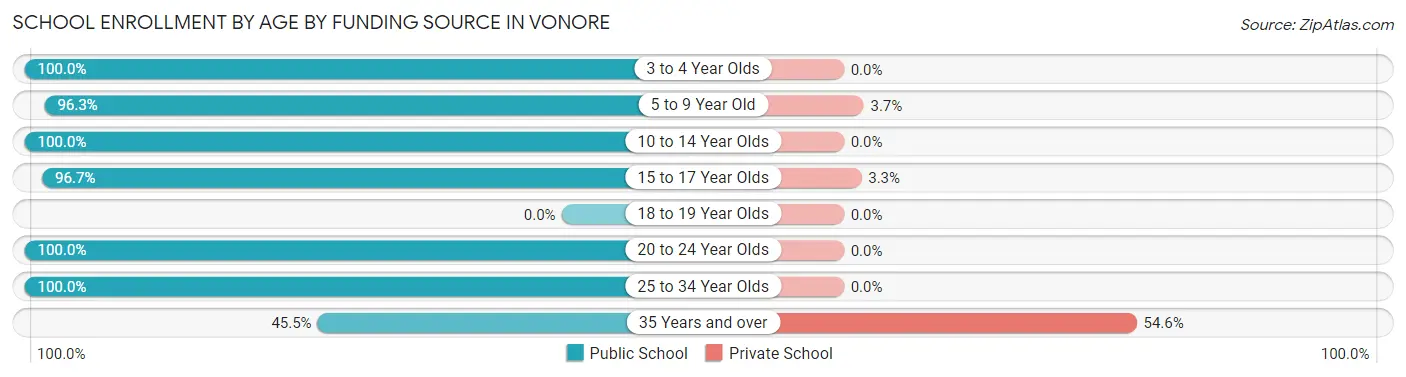
School Enrollment by Age by Funding Source in Vonore
Out of a total of 407 students who are enrolled in schools in Vonore, 14 (3.4%) attend a private institution, while the remaining 393 (96.6%) are enrolled in public schools. The age group of 35 years and over has the highest likelihood of being enrolled in private schools, with 6 (54.5% in the age bracket) enrolled. Conversely, the age group of 3 to 4 year olds has the lowest likelihood of being enrolled in a private school, with 11 (100.0% in the age bracket) attending a public institution.
| Age Bracket | Public School | Private School |
| 3 to 4 Year Olds | 11 (100.0%) | 0 (0.0%) |
| 5 to 9 Year Old | 104 (96.3%) | 4 (3.7%) |
| 10 to 14 Year Olds | 120 (100.0%) | 0 (0.0%) |
| 15 to 17 Year Olds | 118 (96.7%) | 4 (3.3%) |
| 18 to 19 Year Olds | 0 (0.0%) | 0 (0.0%) |
| 20 to 24 Year Olds | 11 (100.0%) | 0 (0.0%) |
| 25 to 34 Year Olds | 24 (100.0%) | 0 (0.0%) |
| 35 Years and over | 5 (45.5%) | 6 (54.5%) |
| Total | 393 (96.6%) | 14 (3.4%) |
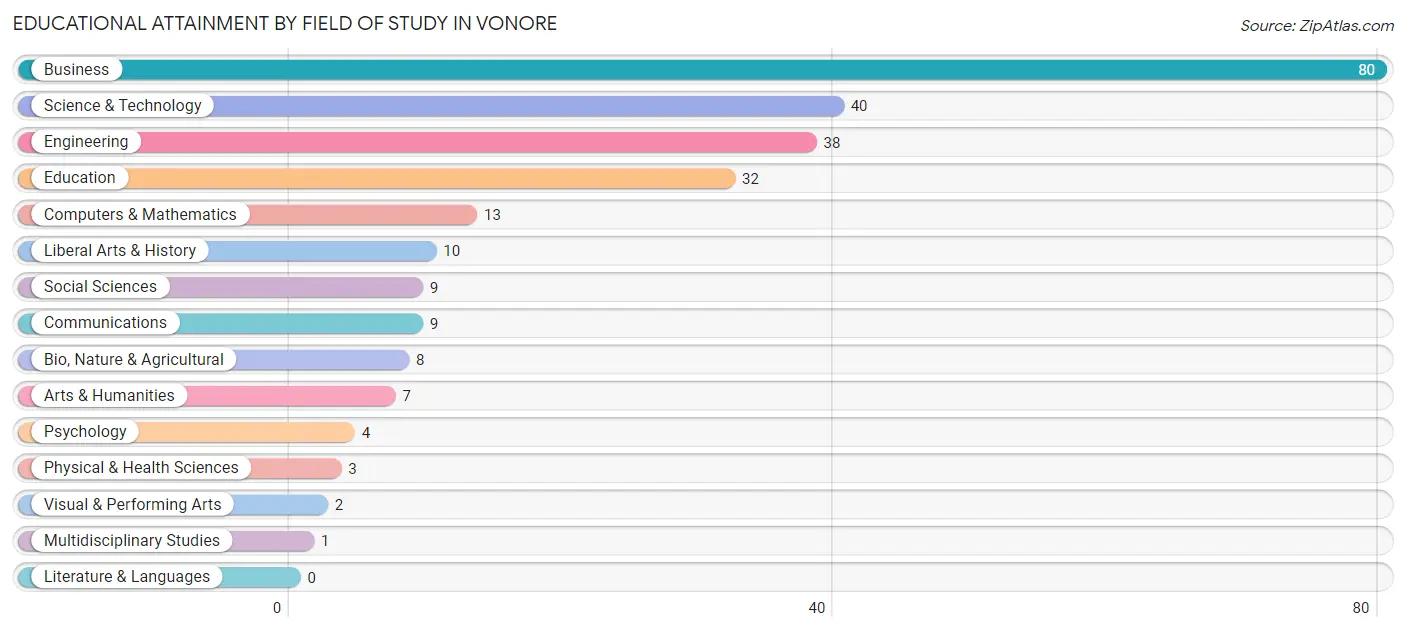
Educational Attainment by Field of Study in Vonore
Business (80 | 31.2%), science & technology (40 | 15.6%), engineering (38 | 14.8%), education (32 | 12.5%), and computers & mathematics (13 | 5.1%) are the most common fields of study among 256 individuals in Vonore who have obtained a bachelor's degree or higher.
| Field of Study | # Graduates | % Graduates |
| Computers & Mathematics | 13 | 5.1% |
| Bio, Nature & Agricultural | 8 | 3.1% |
| Physical & Health Sciences | 3 | 1.2% |
| Psychology | 4 | 1.6% |
| Social Sciences | 9 | 3.5% |
| Engineering | 38 | 14.8% |
| Multidisciplinary Studies | 1 | 0.4% |
| Science & Technology | 40 | 15.6% |
| Business | 80 | 31.2% |
| Education | 32 | 12.5% |
| Literature & Languages | 0 | 0.0% |
| Liberal Arts & History | 10 | 3.9% |
| Visual & Performing Arts | 2 | 0.8% |
| Communications | 9 | 3.5% |
| Arts & Humanities | 7 | 2.7% |
| Total | 256 | 100.0% |
Transportation & Commute in Vonore
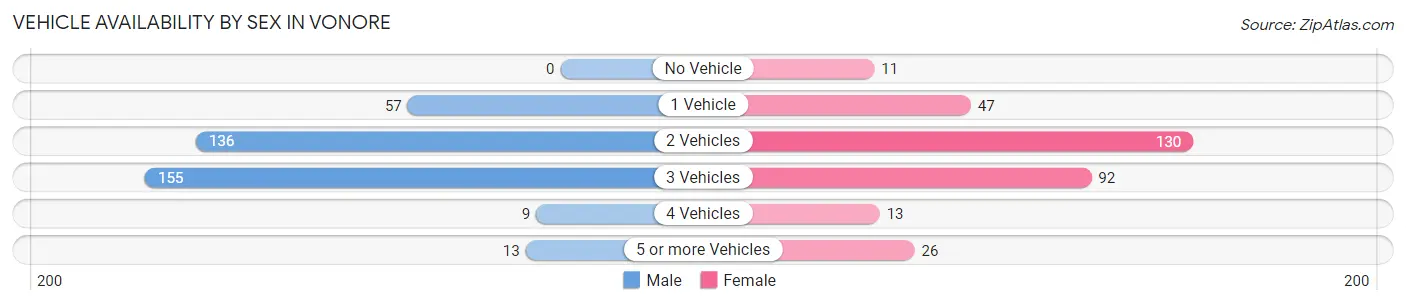
Vehicle Availability by Sex in Vonore
The most prevalent vehicle ownership categories in Vonore are males with 3 vehicles (155, accounting for 41.9%) and females with 3 vehicles (92, making up 48.6%).
| Vehicles Available | Male | Female |
| No Vehicle | 0 (0.0%) | 11 (3.5%) |
| 1 Vehicle | 57 (15.4%) | 47 (14.7%) |
| 2 Vehicles | 136 (36.8%) | 130 (40.7%) |
| 3 Vehicles | 155 (41.9%) | 92 (28.8%) |
| 4 Vehicles | 9 (2.4%) | 13 (4.1%) |
| 5 or more Vehicles | 13 (3.5%) | 26 (8.2%) |
| Total | 370 (100.0%) | 319 (100.0%) |
Commute Time in Vonore
The most frequently occuring commute durations in Vonore are 5 to 9 minutes (151 commuters, 24.5%), 10 to 14 minutes (109 commuters, 17.7%), and 15 to 19 minutes (76 commuters, 12.3%).
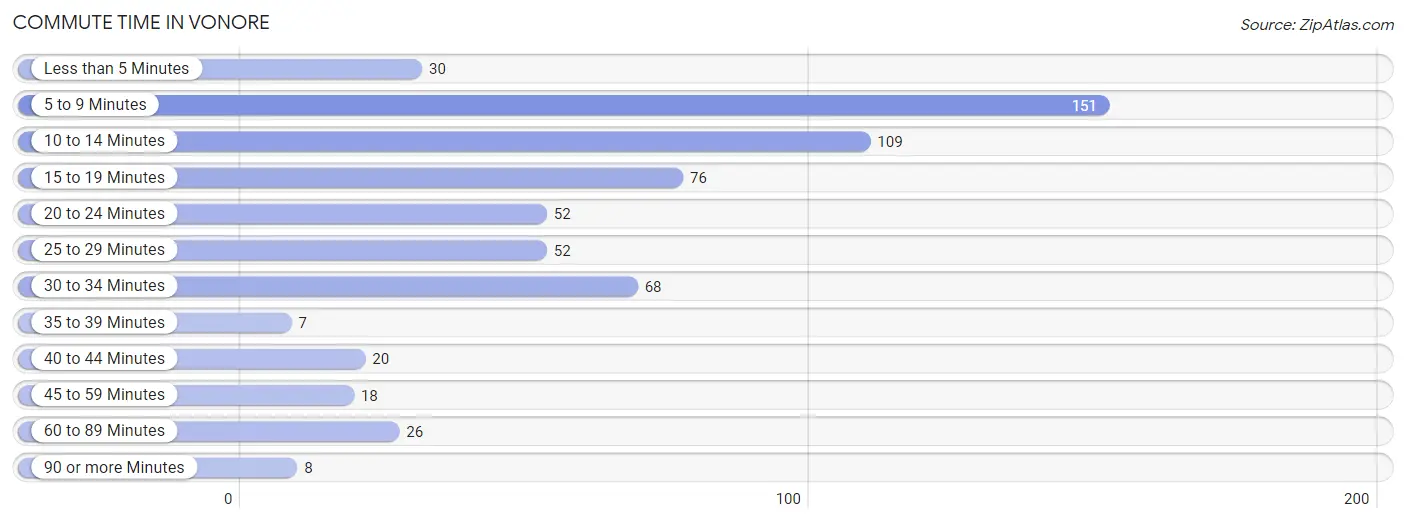
| Commute Time | # Commuters | % Commuters |
| Less than 5 Minutes | 30 | 4.9% |
| 5 to 9 Minutes | 151 | 24.5% |
| 10 to 14 Minutes | 109 | 17.7% |
| 15 to 19 Minutes | 76 | 12.3% |
| 20 to 24 Minutes | 52 | 8.4% |
| 25 to 29 Minutes | 52 | 8.4% |
| 30 to 34 Minutes | 68 | 11.0% |
| 35 to 39 Minutes | 7 | 1.1% |
| 40 to 44 Minutes | 20 | 3.2% |
| 45 to 59 Minutes | 18 | 2.9% |
| 60 to 89 Minutes | 26 | 4.2% |
| 90 or more Minutes | 8 | 1.3% |
Commute Time by Sex in Vonore
The most common commute times in Vonore are 5 to 9 minutes (96 commuters, 30.2%) for males and 10 to 14 minutes (60 commuters, 20.1%) for females.
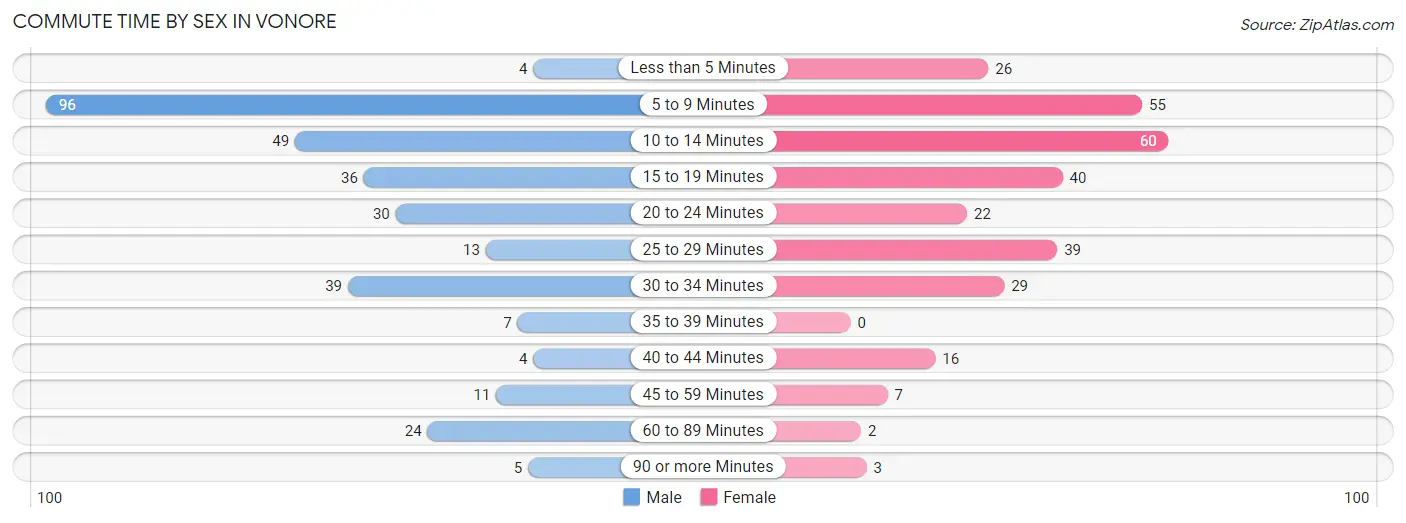
| Commute Time | Male | Female |
| Less than 5 Minutes | 4 (1.3%) | 26 (8.7%) |
| 5 to 9 Minutes | 96 (30.2%) | 55 (18.4%) |
| 10 to 14 Minutes | 49 (15.4%) | 60 (20.1%) |
| 15 to 19 Minutes | 36 (11.3%) | 40 (13.4%) |
| 20 to 24 Minutes | 30 (9.4%) | 22 (7.4%) |
| 25 to 29 Minutes | 13 (4.1%) | 39 (13.0%) |
| 30 to 34 Minutes | 39 (12.3%) | 29 (9.7%) |
| 35 to 39 Minutes | 7 (2.2%) | 0 (0.0%) |
| 40 to 44 Minutes | 4 (1.3%) | 16 (5.3%) |
| 45 to 59 Minutes | 11 (3.5%) | 7 (2.3%) |
| 60 to 89 Minutes | 24 (7.5%) | 2 (0.7%) |
| 90 or more Minutes | 5 (1.6%) | 3 (1.0%) |
Time of Departure to Work by Sex in Vonore
The most frequent times of departure to work in Vonore are 7:30 AM to 7:59 AM (53, 16.7%) for males and 8:00 AM to 8:29 AM (45, 15.0%) for females.
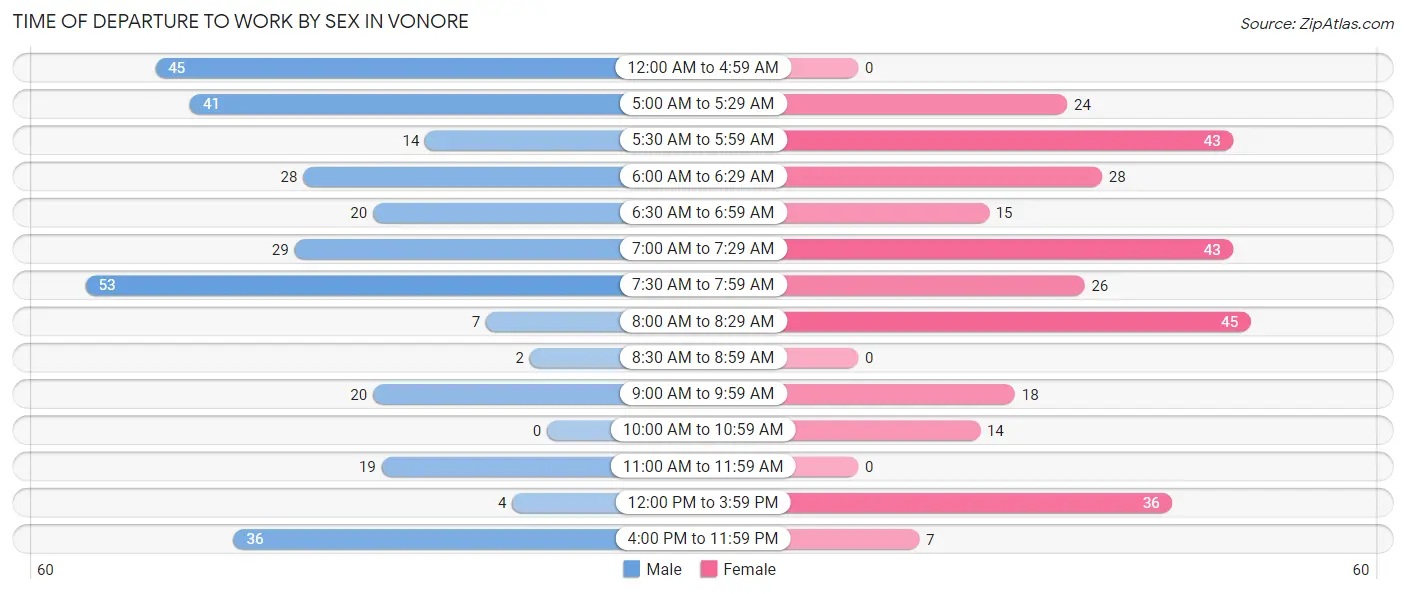
| Time of Departure | Male | Female |
| 12:00 AM to 4:59 AM | 45 (14.1%) | 0 (0.0%) |
| 5:00 AM to 5:29 AM | 41 (12.9%) | 24 (8.0%) |
| 5:30 AM to 5:59 AM | 14 (4.4%) | 43 (14.4%) |
| 6:00 AM to 6:29 AM | 28 (8.8%) | 28 (9.4%) |
| 6:30 AM to 6:59 AM | 20 (6.3%) | 15 (5.0%) |
| 7:00 AM to 7:29 AM | 29 (9.1%) | 43 (14.4%) |
| 7:30 AM to 7:59 AM | 53 (16.7%) | 26 (8.7%) |
| 8:00 AM to 8:29 AM | 7 (2.2%) | 45 (15.0%) |
| 8:30 AM to 8:59 AM | 2 (0.6%) | 0 (0.0%) |
| 9:00 AM to 9:59 AM | 20 (6.3%) | 18 (6.0%) |
| 10:00 AM to 10:59 AM | 0 (0.0%) | 14 (4.7%) |
| 11:00 AM to 11:59 AM | 19 (6.0%) | 0 (0.0%) |
| 12:00 PM to 3:59 PM | 4 (1.3%) | 36 (12.0%) |
| 4:00 PM to 11:59 PM | 36 (11.3%) | 7 (2.3%) |
| Total | 318 (100.0%) | 299 (100.0%) |
Housing Occupancy in Vonore
Occupancy by Ownership in Vonore
Of the total 767 dwellings in Vonore, owner-occupied units account for 399 (52.0%), while renter-occupied units make up 368 (48.0%).
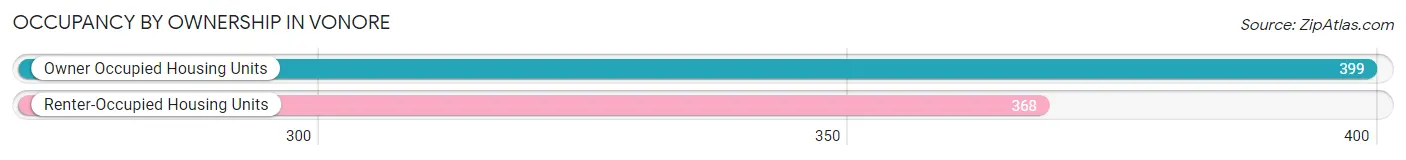
| Occupancy | # Housing Units | % Housing Units |
| Owner Occupied Housing Units | 399 | 52.0% |
| Renter-Occupied Housing Units | 368 | 48.0% |
| Total Occupied Housing Units | 767 | 100.0% |
Occupancy by Household Size in Vonore
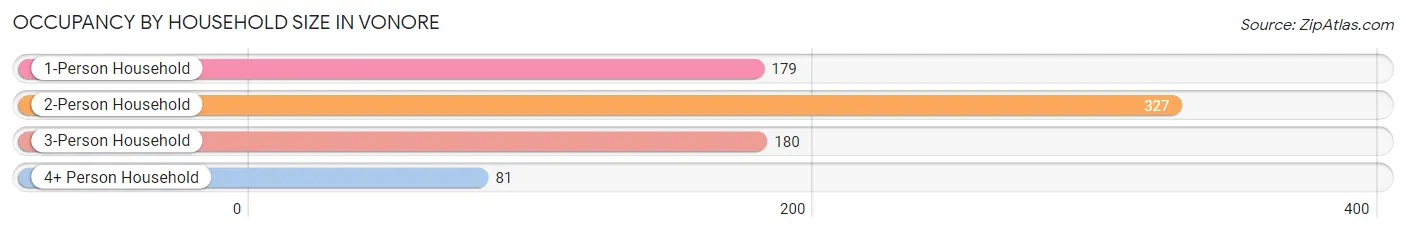
| Household Size | # Housing Units | % Housing Units |
| 1-Person Household | 179 | 23.3% |
| 2-Person Household | 327 | 42.6% |
| 3-Person Household | 180 | 23.5% |
| 4+ Person Household | 81 | 10.6% |
| Total Housing Units | 767 | 100.0% |
Occupancy by Ownership by Household Size in Vonore
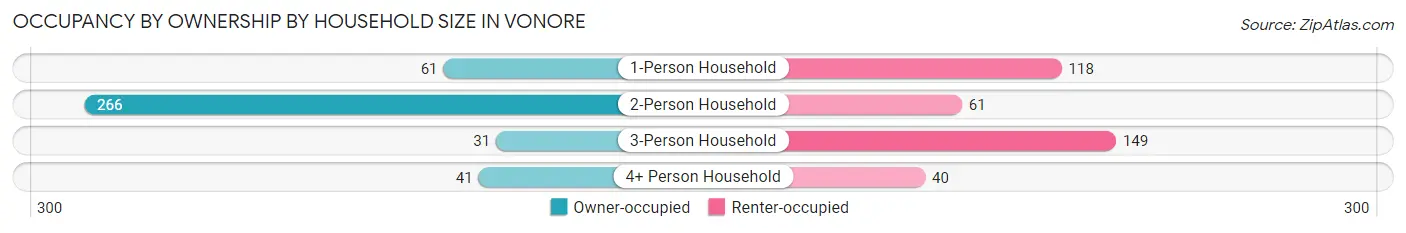
| Household Size | Owner-occupied | Renter-occupied |
| 1-Person Household | 61 (34.1%) | 118 (65.9%) |
| 2-Person Household | 266 (81.4%) | 61 (18.6%) |
| 3-Person Household | 31 (17.2%) | 149 (82.8%) |
| 4+ Person Household | 41 (50.6%) | 40 (49.4%) |
| Total Housing Units | 399 (52.0%) | 368 (48.0%) |
Occupancy by Educational Attainment in Vonore
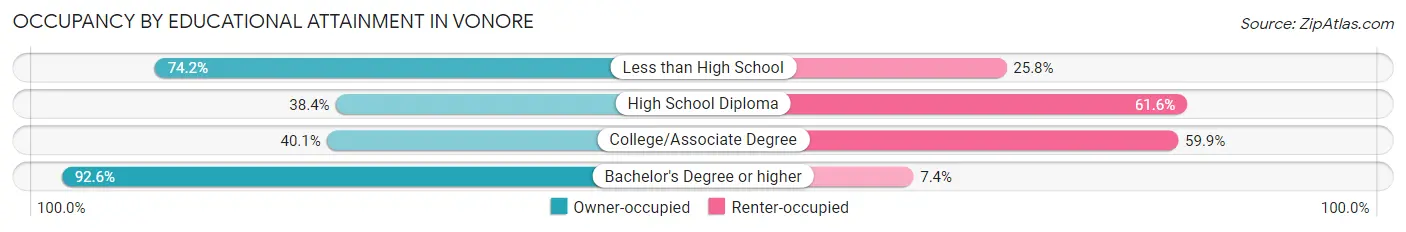
| Household Size | Owner-occupied | Renter-occupied |
| Less than High School | 23 (74.2%) | 8 (25.8%) |
| High School Diploma | 109 (38.4%) | 175 (61.6%) |
| College/Associate Degree | 116 (40.1%) | 173 (59.9%) |
| Bachelor's Degree or higher | 151 (92.6%) | 12 (7.4%) |
Occupancy by Age of Householder in Vonore
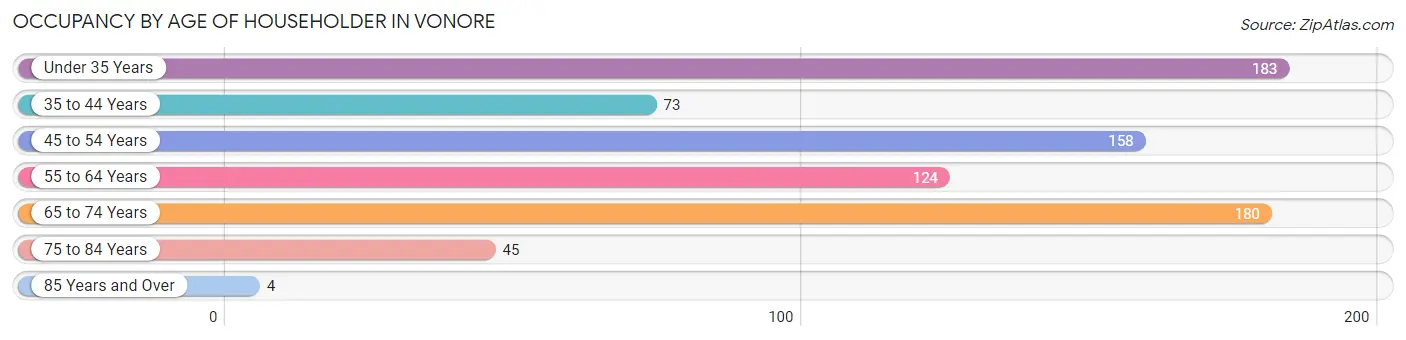
| Age Bracket | # Households | % Households |
| Under 35 Years | 183 | 23.9% |
| 35 to 44 Years | 73 | 9.5% |
| 45 to 54 Years | 158 | 20.6% |
| 55 to 64 Years | 124 | 16.2% |
| 65 to 74 Years | 180 | 23.5% |
| 75 to 84 Years | 45 | 5.9% |
| 85 Years and Over | 4 | 0.5% |
| Total | 767 | 100.0% |
Housing Finances in Vonore
Median Income by Occupancy in Vonore
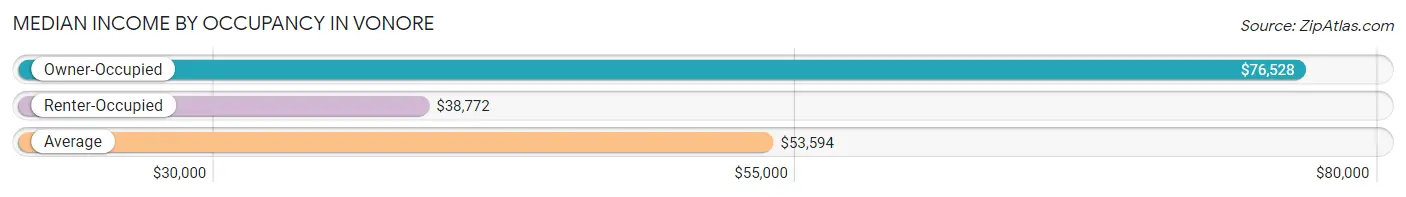
| Occupancy Type | # Households | Median Income |
| Owner-Occupied | 399 (52.0%) | $76,528 |
| Renter-Occupied | 368 (48.0%) | $38,772 |
| Average | 767 (100.0%) | $53,594 |
Occupancy by Householder Income Bracket in Vonore
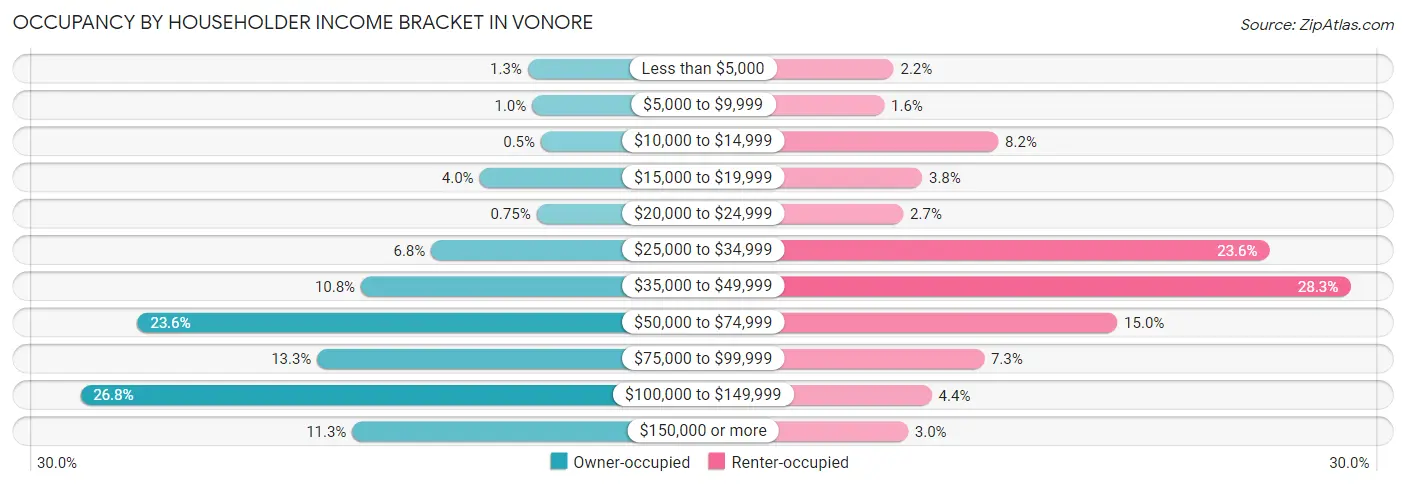
| Income Bracket | Owner-occupied | Renter-occupied |
| Less than $5,000 | 5 (1.3%) | 8 (2.2%) |
| $5,000 to $9,999 | 4 (1.0%) | 6 (1.6%) |
| $10,000 to $14,999 | 2 (0.5%) | 30 (8.2%) |
| $15,000 to $19,999 | 16 (4.0%) | 14 (3.8%) |
| $20,000 to $24,999 | 3 (0.7%) | 10 (2.7%) |
| $25,000 to $34,999 | 27 (6.8%) | 87 (23.6%) |
| $35,000 to $49,999 | 43 (10.8%) | 104 (28.3%) |
| $50,000 to $74,999 | 94 (23.6%) | 55 (14.9%) |
| $75,000 to $99,999 | 53 (13.3%) | 27 (7.3%) |
| $100,000 to $149,999 | 107 (26.8%) | 16 (4.3%) |
| $150,000 or more | 45 (11.3%) | 11 (3.0%) |
| Total | 399 (100.0%) | 368 (100.0%) |
Monthly Housing Cost Tiers in Vonore
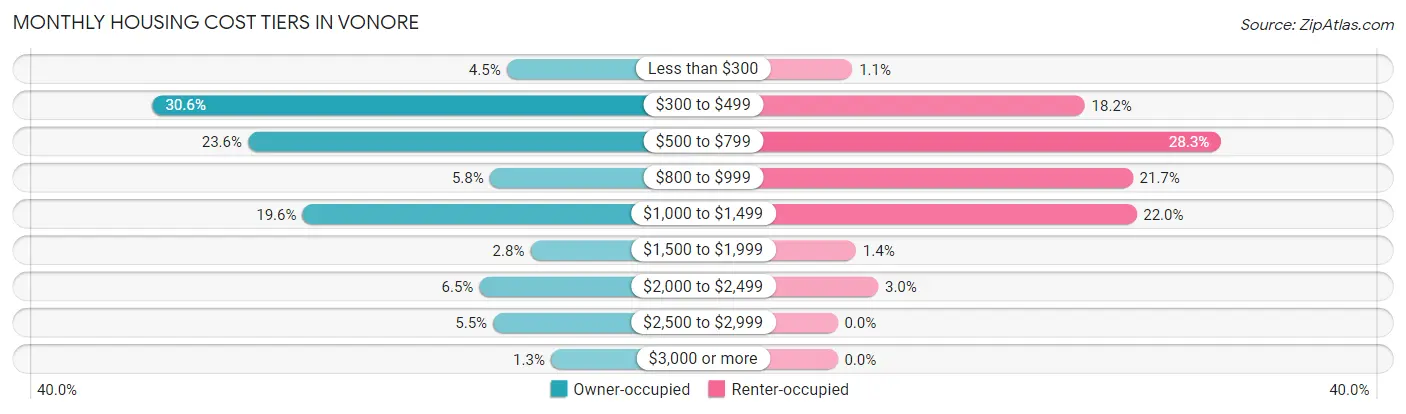
| Monthly Cost | Owner-occupied | Renter-occupied |
| Less than $300 | 18 (4.5%) | 4 (1.1%) |
| $300 to $499 | 122 (30.6%) | 67 (18.2%) |
| $500 to $799 | 94 (23.6%) | 104 (28.3%) |
| $800 to $999 | 23 (5.8%) | 80 (21.7%) |
| $1,000 to $1,499 | 78 (19.6%) | 81 (22.0%) |
| $1,500 to $1,999 | 11 (2.8%) | 5 (1.4%) |
| $2,000 to $2,499 | 26 (6.5%) | 11 (3.0%) |
| $2,500 to $2,999 | 22 (5.5%) | 0 (0.0%) |
| $3,000 or more | 5 (1.3%) | 0 (0.0%) |
| Total | 399 (100.0%) | 368 (100.0%) |
Physical Housing Characteristics in Vonore
Housing Structures in Vonore
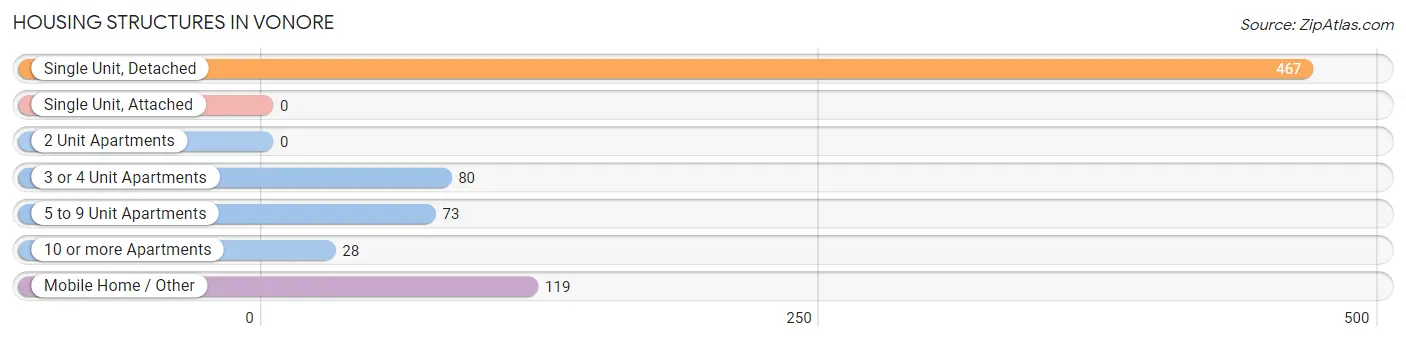
| Structure Type | # Housing Units | % Housing Units |
| Single Unit, Detached | 467 | 60.9% |
| Single Unit, Attached | 0 | 0.0% |
| 2 Unit Apartments | 0 | 0.0% |
| 3 or 4 Unit Apartments | 80 | 10.4% |
| 5 to 9 Unit Apartments | 73 | 9.5% |
| 10 or more Apartments | 28 | 3.6% |
| Mobile Home / Other | 119 | 15.5% |
| Total | 767 | 100.0% |
Housing Structures by Occupancy in Vonore
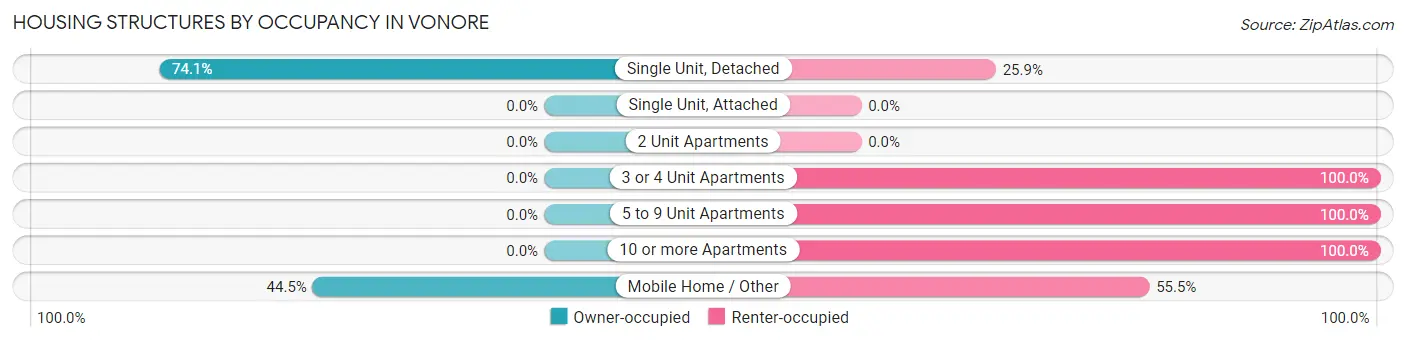
| Structure Type | Owner-occupied | Renter-occupied |
| Single Unit, Detached | 346 (74.1%) | 121 (25.9%) |
| Single Unit, Attached | 0 (0.0%) | 0 (0.0%) |
| 2 Unit Apartments | 0 (0.0%) | 0 (0.0%) |
| 3 or 4 Unit Apartments | 0 (0.0%) | 80 (100.0%) |
| 5 to 9 Unit Apartments | 0 (0.0%) | 73 (100.0%) |
| 10 or more Apartments | 0 (0.0%) | 28 (100.0%) |
| Mobile Home / Other | 53 (44.5%) | 66 (55.5%) |
| Total | 399 (52.0%) | 368 (48.0%) |
Housing Structures by Number of Rooms in Vonore
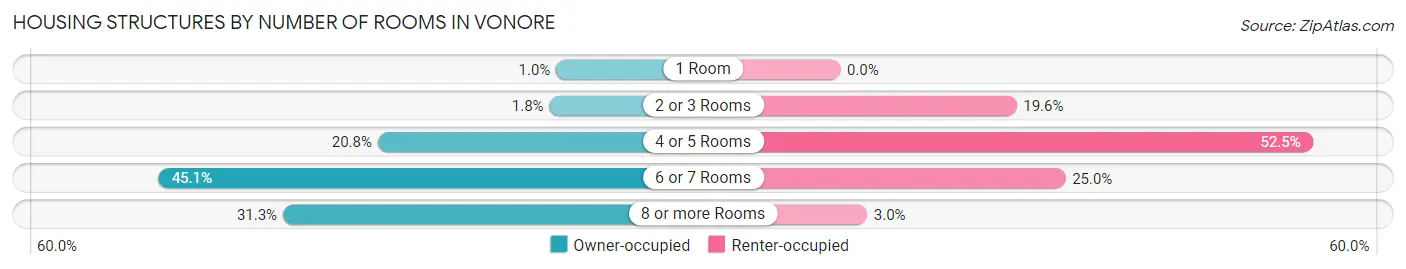
| Number of Rooms | Owner-occupied | Renter-occupied |
| 1 Room | 4 (1.0%) | 0 (0.0%) |
| 2 or 3 Rooms | 7 (1.8%) | 72 (19.6%) |
| 4 or 5 Rooms | 83 (20.8%) | 193 (52.4%) |
| 6 or 7 Rooms | 180 (45.1%) | 92 (25.0%) |
| 8 or more Rooms | 125 (31.3%) | 11 (3.0%) |
| Total | 399 (100.0%) | 368 (100.0%) |
Housing Structure by Heating Type in Vonore
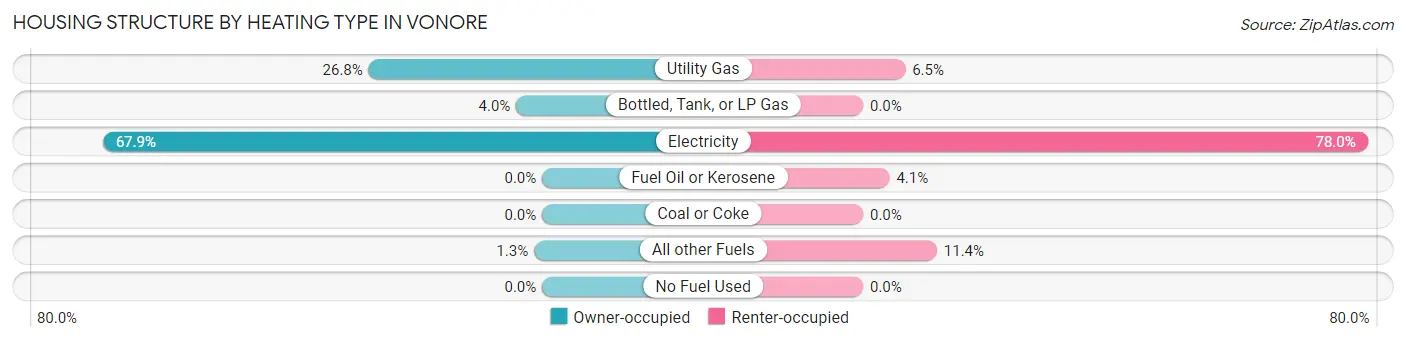
| Heating Type | Owner-occupied | Renter-occupied |
| Utility Gas | 107 (26.8%) | 24 (6.5%) |
| Bottled, Tank, or LP Gas | 16 (4.0%) | 0 (0.0%) |
| Electricity | 271 (67.9%) | 287 (78.0%) |
| Fuel Oil or Kerosene | 0 (0.0%) | 15 (4.1%) |
| Coal or Coke | 0 (0.0%) | 0 (0.0%) |
| All other Fuels | 5 (1.3%) | 42 (11.4%) |
| No Fuel Used | 0 (0.0%) | 0 (0.0%) |
| Total | 399 (100.0%) | 368 (100.0%) |
Household Vehicle Usage in Vonore
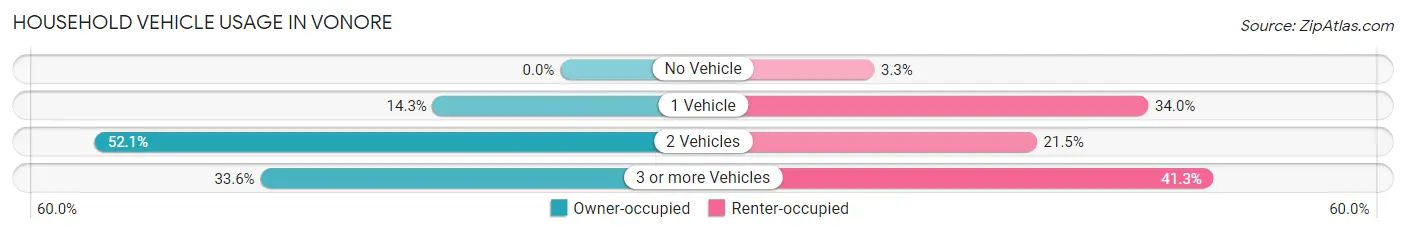
| Vehicles per Household | Owner-occupied | Renter-occupied |
| No Vehicle | 0 (0.0%) | 12 (3.3%) |
| 1 Vehicle | 57 (14.3%) | 125 (34.0%) |
| 2 Vehicles | 208 (52.1%) | 79 (21.5%) |
| 3 or more Vehicles | 134 (33.6%) | 152 (41.3%) |
| Total | 399 (100.0%) | 368 (100.0%) |
Real Estate & Mortgages in Vonore
Real Estate and Mortgage Overview in Vonore
| Characteristic | Without Mortgage | With Mortgage |
| Housing Units | 238 | 161 |
| Median Property Value | $195,300 | $358,900 |
| Median Household Income | $65,278 | $24 |
| Monthly Housing Costs | $466 | $5 |
| Real Estate Taxes | $1,135 | $9 |
Property Value by Mortgage Status in Vonore
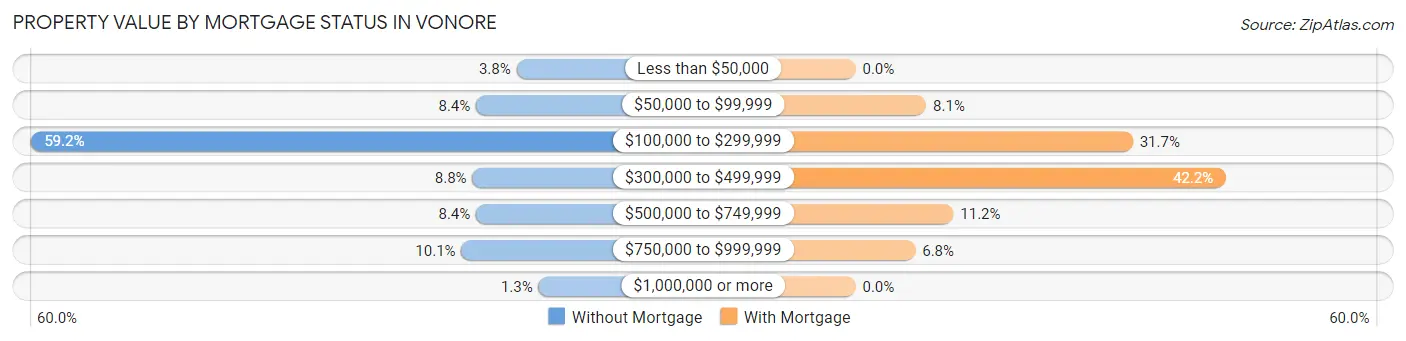
| Property Value | Without Mortgage | With Mortgage |
| Less than $50,000 | 9 (3.8%) | 0 (0.0%) |
| $50,000 to $99,999 | 20 (8.4%) | 13 (8.1%) |
| $100,000 to $299,999 | 141 (59.2%) | 51 (31.7%) |
| $300,000 to $499,999 | 21 (8.8%) | 68 (42.2%) |
| $500,000 to $749,999 | 20 (8.4%) | 18 (11.2%) |
| $750,000 to $999,999 | 24 (10.1%) | 11 (6.8%) |
| $1,000,000 or more | 3 (1.3%) | 0 (0.0%) |
| Total | 238 (100.0%) | 161 (100.0%) |
Household Income by Mortgage Status in Vonore
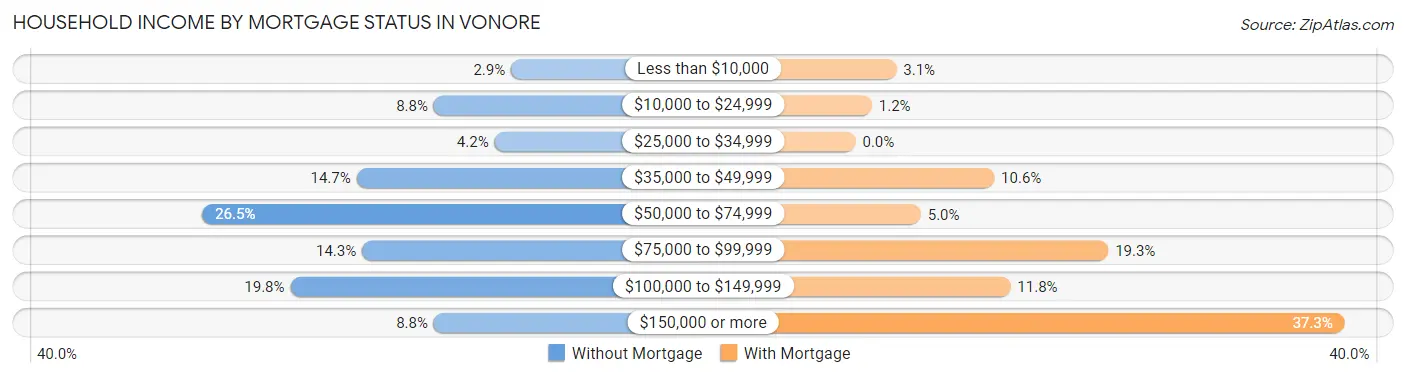
| Household Income | Without Mortgage | With Mortgage |
| Less than $10,000 | 7 (2.9%) | 5 (3.1%) |
| $10,000 to $24,999 | 21 (8.8%) | 2 (1.2%) |
| $25,000 to $34,999 | 10 (4.2%) | 0 (0.0%) |
| $35,000 to $49,999 | 35 (14.7%) | 17 (10.6%) |
| $50,000 to $74,999 | 63 (26.5%) | 8 (5.0%) |
| $75,000 to $99,999 | 34 (14.3%) | 31 (19.3%) |
| $100,000 to $149,999 | 47 (19.8%) | 19 (11.8%) |
| $150,000 or more | 21 (8.8%) | 60 (37.3%) |
| Total | 238 (100.0%) | 161 (100.0%) |
Property Value to Household Income Ratio in Vonore
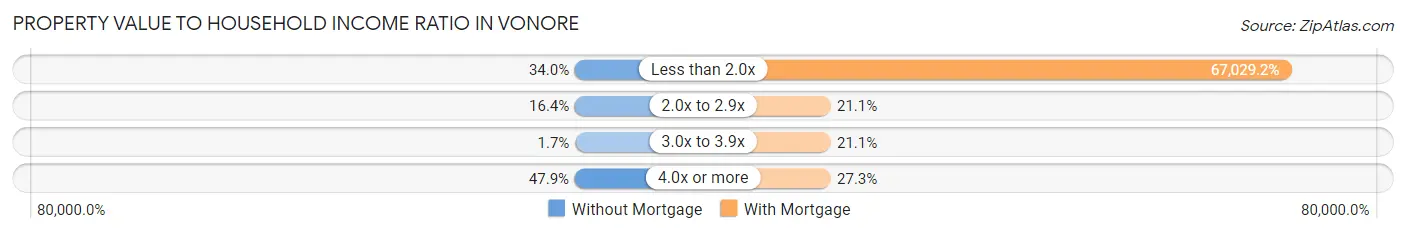
| Value-to-Income Ratio | Without Mortgage | With Mortgage |
| Less than 2.0x | 81 (34.0%) | 107,917 (67,029.2%) |
| 2.0x to 2.9x | 39 (16.4%) | 34 (21.1%) |
| 3.0x to 3.9x | 4 (1.7%) | 34 (21.1%) |
| 4.0x or more | 114 (47.9%) | 44 (27.3%) |
| Total | 238 (100.0%) | 161 (100.0%) |
Real Estate Taxes by Mortgage Status in Vonore
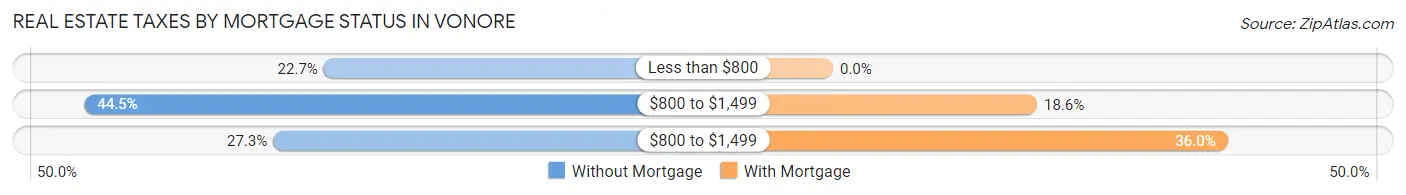
| Property Taxes | Without Mortgage | With Mortgage |
| Less than $800 | 54 (22.7%) | 0 (0.0%) |
| $800 to $1,499 | 106 (44.5%) | 30 (18.6%) |
| $800 to $1,499 | 65 (27.3%) | 58 (36.0%) |
| Total | 238 (100.0%) | 161 (100.0%) |
Health & Disability in Vonore
Health Insurance Coverage by Age in Vonore
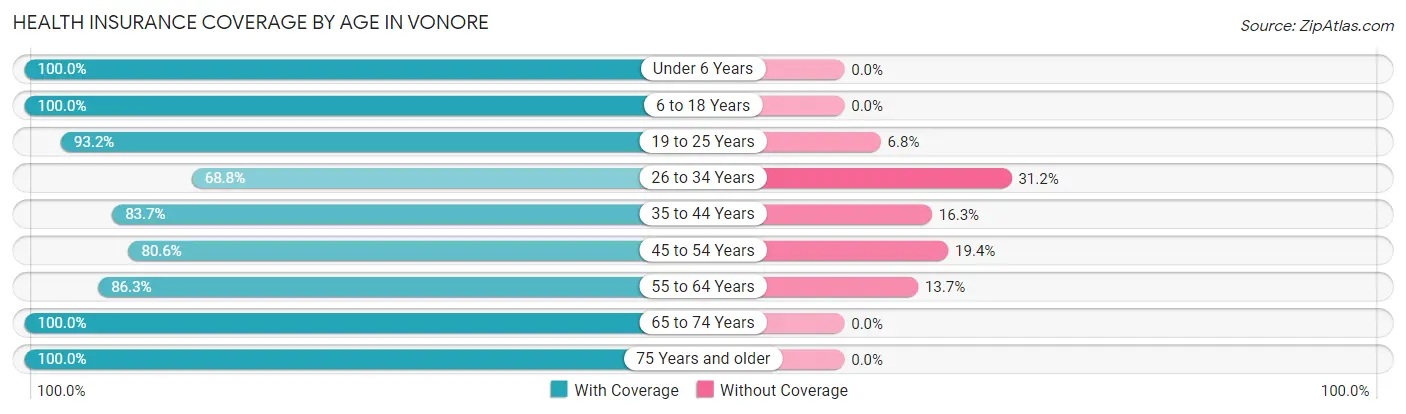
| Age Bracket | With Coverage | Without Coverage |
| Under 6 Years | 79 (100.0%) | 0 (0.0%) |
| 6 to 18 Years | 342 (100.0%) | 0 (0.0%) |
| 19 to 25 Years | 55 (93.2%) | 4 (6.8%) |
| 26 to 34 Years | 181 (68.8%) | 82 (31.2%) |
| 35 to 44 Years | 128 (83.7%) | 25 (16.3%) |
| 45 to 54 Years | 179 (80.6%) | 43 (19.4%) |
| 55 to 64 Years | 182 (86.3%) | 29 (13.7%) |
| 65 to 74 Years | 337 (100.0%) | 0 (0.0%) |
| 75 Years and older | 62 (100.0%) | 0 (0.0%) |
| Total | 1,545 (89.4%) | 183 (10.6%) |
Health Insurance Coverage by Citizenship Status in Vonore
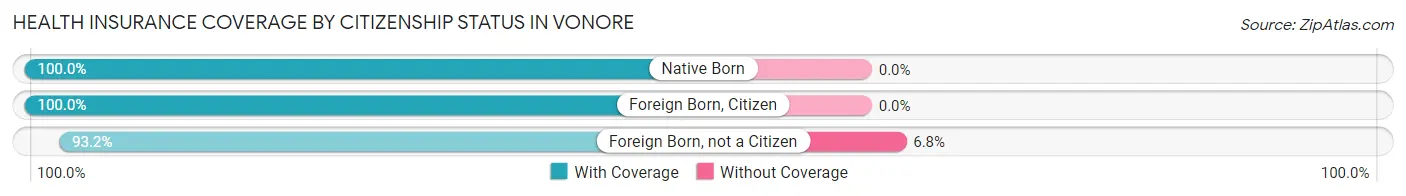
| Citizenship Status | With Coverage | Without Coverage |
| Native Born | 79 (100.0%) | 0 (0.0%) |
| Foreign Born, Citizen | 342 (100.0%) | 0 (0.0%) |
| Foreign Born, not a Citizen | 55 (93.2%) | 4 (6.8%) |
Health Insurance Coverage by Household Income in Vonore
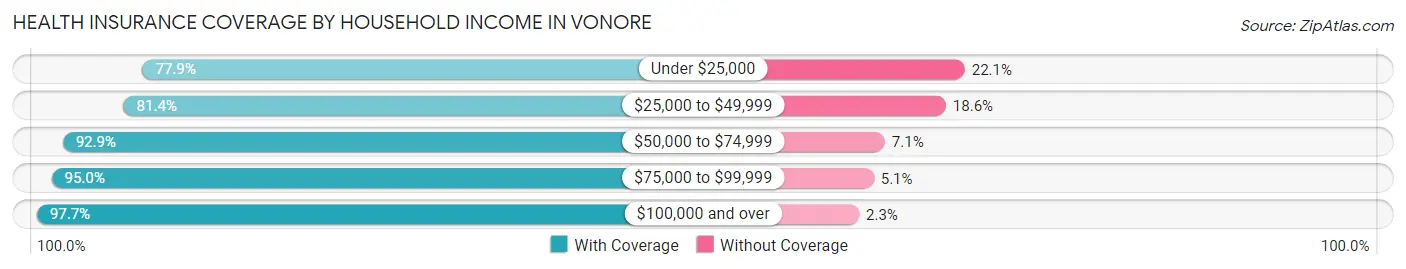
| Household Income | With Coverage | Without Coverage |
| Under $25,000 | 148 (77.9%) | 42 (22.1%) |
| $25,000 to $49,999 | 421 (81.4%) | 96 (18.6%) |
| $50,000 to $74,999 | 299 (92.9%) | 23 (7.1%) |
| $75,000 to $99,999 | 207 (95.0%) | 11 (5.1%) |
| $100,000 and over | 466 (97.7%) | 11 (2.3%) |
Public vs Private Health Insurance Coverage by Age in Vonore
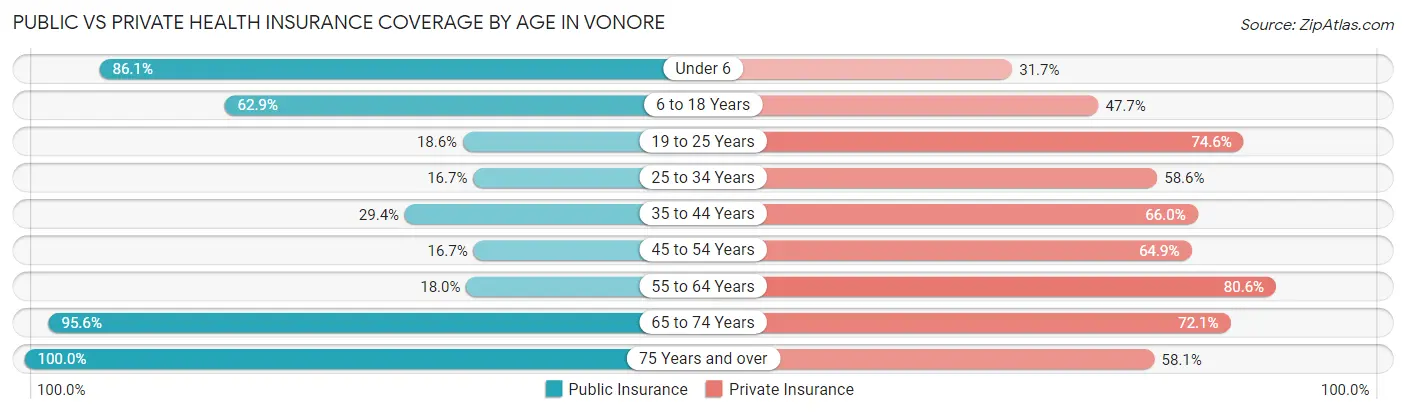
| Age Bracket | Public Insurance | Private Insurance |
| Under 6 | 68 (86.1%) | 25 (31.7%) |
| 6 to 18 Years | 215 (62.9%) | 163 (47.7%) |
| 19 to 25 Years | 11 (18.6%) | 44 (74.6%) |
| 25 to 34 Years | 44 (16.7%) | 154 (58.6%) |
| 35 to 44 Years | 45 (29.4%) | 101 (66.0%) |
| 45 to 54 Years | 37 (16.7%) | 144 (64.9%) |
| 55 to 64 Years | 38 (18.0%) | 170 (80.6%) |
| 65 to 74 Years | 322 (95.6%) | 243 (72.1%) |
| 75 Years and over | 62 (100.0%) | 36 (58.1%) |
| Total | 842 (48.7%) | 1,080 (62.5%) |
Disability Status by Sex by Age in Vonore
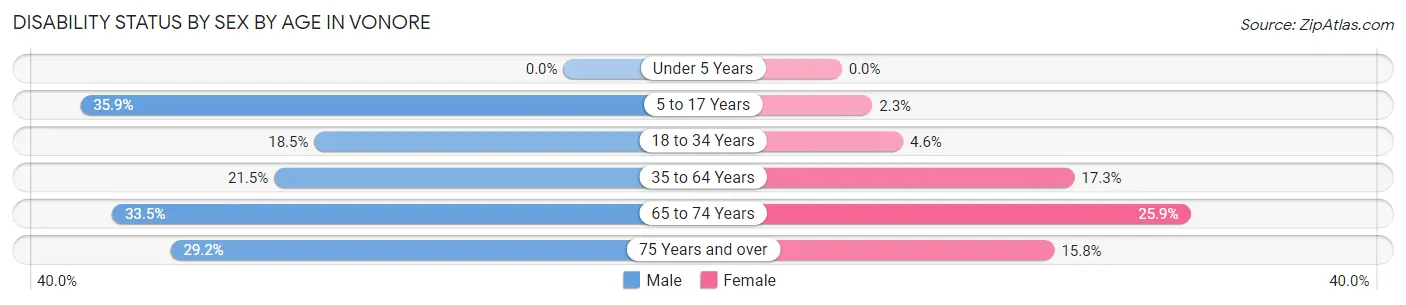
| Age Bracket | Male | Female |
| Under 5 Years | 0 (0.0%) | 0 (0.0%) |
| 5 to 17 Years | 80 (35.9%) | 3 (2.3%) |
| 18 to 34 Years | 27 (18.5%) | 8 (4.5%) |
| 35 to 64 Years | 55 (21.5%) | 57 (17.3%) |
| 65 to 74 Years | 65 (33.5%) | 37 (25.9%) |
| 75 Years and over | 7 (29.2%) | 6 (15.8%) |
Disability Class by Sex by Age in Vonore
Disability Class: Hearing Difficulty
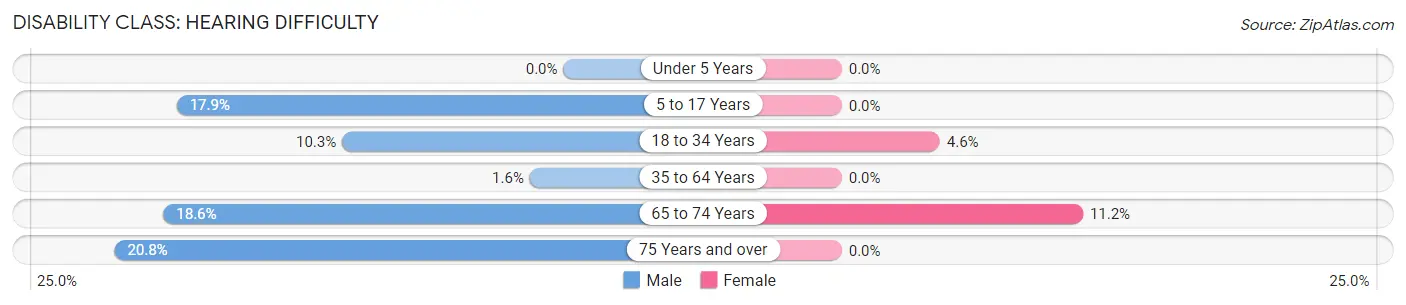
| Age Bracket | Male | Female |
| Under 5 Years | 0 (0.0%) | 0 (0.0%) |
| 5 to 17 Years | 40 (17.9%) | 0 (0.0%) |
| 18 to 34 Years | 15 (10.3%) | 8 (4.5%) |
| 35 to 64 Years | 4 (1.6%) | 0 (0.0%) |
| 65 to 74 Years | 36 (18.6%) | 16 (11.2%) |
| 75 Years and over | 5 (20.8%) | 0 (0.0%) |
Disability Class: Vision Difficulty
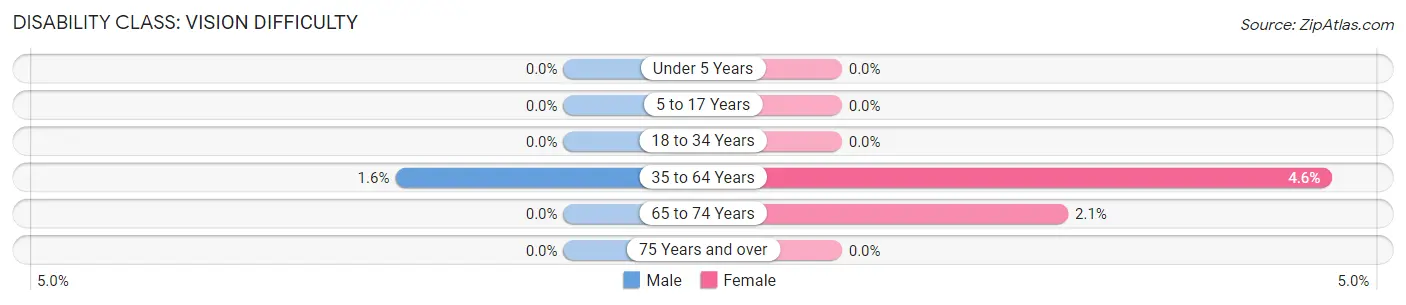
| Age Bracket | Male | Female |
| Under 5 Years | 0 (0.0%) | 0 (0.0%) |
| 5 to 17 Years | 0 (0.0%) | 0 (0.0%) |
| 18 to 34 Years | 0 (0.0%) | 0 (0.0%) |
| 35 to 64 Years | 4 (1.6%) | 15 (4.5%) |
| 65 to 74 Years | 0 (0.0%) | 3 (2.1%) |
| 75 Years and over | 0 (0.0%) | 0 (0.0%) |
Disability Class: Cognitive Difficulty
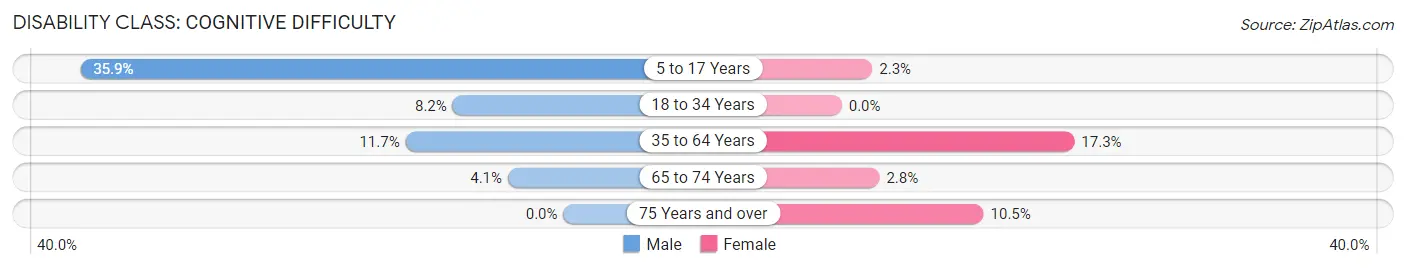
| Age Bracket | Male | Female |
| 5 to 17 Years | 80 (35.9%) | 3 (2.3%) |
| 18 to 34 Years | 12 (8.2%) | 0 (0.0%) |
| 35 to 64 Years | 30 (11.7%) | 57 (17.3%) |
| 65 to 74 Years | 8 (4.1%) | 4 (2.8%) |
| 75 Years and over | 0 (0.0%) | 4 (10.5%) |
Disability Class: Ambulatory Difficulty
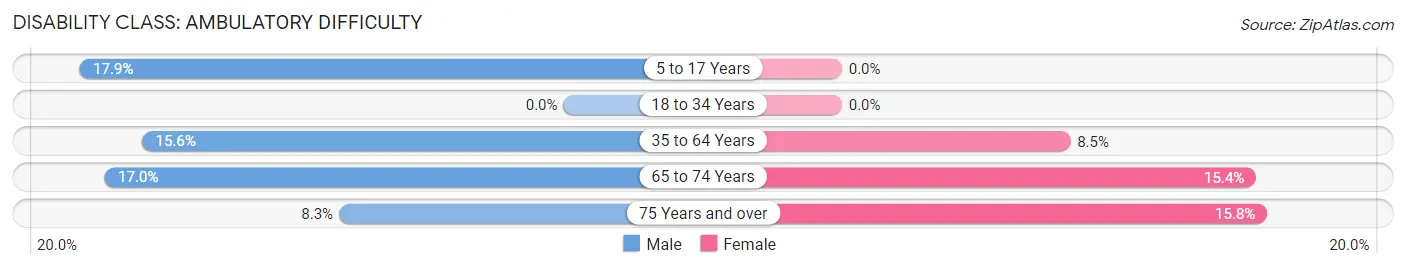
| Age Bracket | Male | Female |
| 5 to 17 Years | 40 (17.9%) | 0 (0.0%) |
| 18 to 34 Years | 0 (0.0%) | 0 (0.0%) |
| 35 to 64 Years | 40 (15.6%) | 28 (8.5%) |
| 65 to 74 Years | 33 (17.0%) | 22 (15.4%) |
| 75 Years and over | 2 (8.3%) | 6 (15.8%) |
Disability Class: Self-Care Difficulty
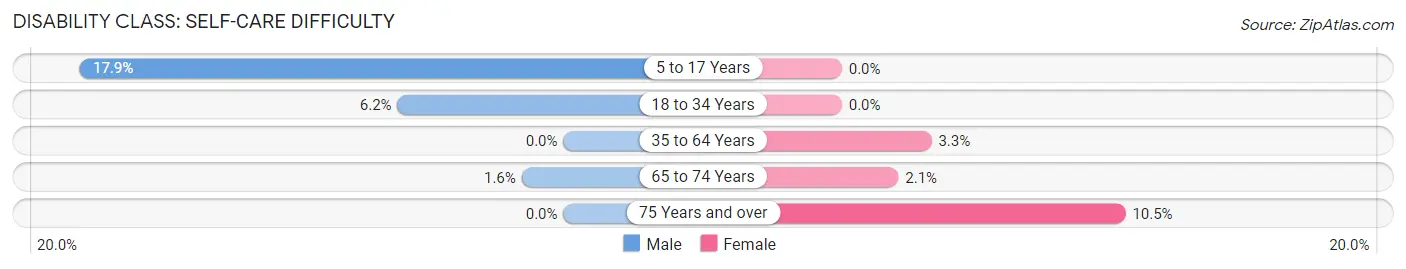
| Age Bracket | Male | Female |
| 5 to 17 Years | 40 (17.9%) | 0 (0.0%) |
| 18 to 34 Years | 9 (6.2%) | 0 (0.0%) |
| 35 to 64 Years | 0 (0.0%) | 11 (3.3%) |
| 65 to 74 Years | 3 (1.5%) | 3 (2.1%) |
| 75 Years and over | 0 (0.0%) | 4 (10.5%) |
Technology Access in Vonore
Computing Device Access in Vonore
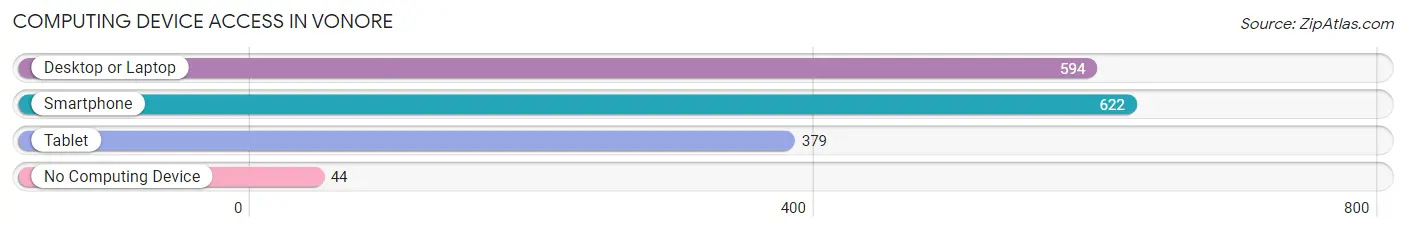
| Device Type | # Households | % Households |
| Desktop or Laptop | 594 | 77.4% |
| Smartphone | 622 | 81.1% |
| Tablet | 379 | 49.4% |
| No Computing Device | 44 | 5.7% |
| Total | 767 | 100.0% |
Internet Access in Vonore
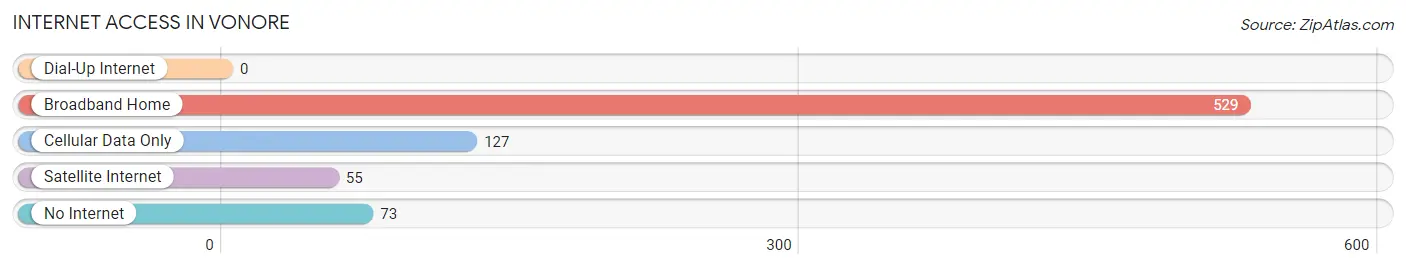
| Internet Type | # Households | % Households |
| Dial-Up Internet | 0 | 0.0% |
| Broadband Home | 529 | 69.0% |
| Cellular Data Only | 127 | 16.6% |
| Satellite Internet | 55 | 7.2% |
| No Internet | 73 | 9.5% |
| Total | 767 | 100.0% |
Vonore Summary
Vonore is a small town located in Monroe County, Tennessee. It is situated on the banks of Tellico Lake, a reservoir created by the Tennessee Valley Authority (TVA). The town was founded in 1820 and has a population of approximately 1,500 people.
Geography
Vonore is located in the foothills of the Great Smoky Mountains, approximately 25 miles south of Knoxville. The town is situated on the banks of Tellico Lake, a reservoir created by the Tennessee Valley Authority (TVA). The lake is a popular destination for fishing, boating, and other recreational activities. The town is also located near the Cherokee National Forest, which provides a variety of outdoor activities such as hiking, camping, and hunting.
Economy
Vonore’s economy is largely based on tourism and manufacturing. The town is home to several manufacturing companies, including a paper mill, a plastics plant, and a furniture factory. The town also has a number of tourist attractions, such as the Sequoyah Birthplace Museum, the Sequoyah State Park, and the Tellico Lake Marina.
Demographics
As of the 2010 census, Vonore had a population of 1,521 people. The racial makeup of the town was 95.2% White, 0.7% African American, 0.3% Native American, 0.2% Asian, 0.1% Pacific Islander, and 3.5% from other races. The median household income was $35,938, and the median family income was $41,250.
History
Vonore was founded in 1820 by settlers from North Carolina. The town was named after a Cherokee chief, Chief Vonore. The town was originally a trading post for the Cherokee people, and it was also a stop on the stagecoach route between Knoxville and Chattanooga. In the late 19th century, the town became a popular resort destination, and it was home to several large hotels.
In the early 20th century, the Tennessee Valley Authority (TVA) began construction of Tellico Dam, which created Tellico Lake. The lake provided a source of hydroelectric power and recreational opportunities for the town. In the late 20th century, the town began to experience a decline in population as people moved away to larger cities. However, in recent years, the town has seen a resurgence in population as people have moved back to the area to take advantage of the recreational opportunities provided by Tellico Lake.
Common Questions
What is Per Capita Income in Vonore?
Per Capita income in Vonore is $32,310.
What is the Median Family Income in Vonore?
Median Family Income in Vonore is $56,628.
What is the Median Household income in Vonore?
Median Household Income in Vonore is $53,594.
What is Income or Wage Gap in Vonore?
Income or Wage Gap in Vonore is 39.1%.
Women in Vonore earn 60.9 cents for every dollar earned by a man.
What is Inequality or Gini Index in Vonore?
Inequality or Gini Index in Vonore is 0.40.
What is the Total Population of Vonore?
Total Population of Vonore is 1,730.
What is the Total Male Population of Vonore?
Total Male Population of Vonore is 871.
What is the Total Female Population of Vonore?
Total Female Population of Vonore is 859.
What is the Ratio of Males per 100 Females in Vonore?
There are 101.40 Males per 100 Females in Vonore.
What is the Ratio of Females per 100 Males in Vonore?
There are 98.62 Females per 100 Males in Vonore.
What is the Median Population Age in Vonore?
Median Population Age in Vonore is 42.0 Years.
What is the Average Family Size in Vonore
Average Family Size in Vonore is 2.5 People.
What is the Average Household Size in Vonore
Average Household Size in Vonore is 2.2 People.
How Large is the Labor Force in Vonore?
There are 784 People in the Labor Forcein in Vonore.
What is the Percentage of People in the Labor Force in Vonore?
55.2% of People are in the Labor Force in Vonore.
What is the Unemployment Rate in Vonore?
Unemployment Rate in Vonore is 3.5%.