Rogersville, TN Map & Demographics
Rogersville Map
Rogersville Overview
$25,799
PER CAPITA INCOME
$55,349
AVG FAMILY INCOME
$45,797
AVG HOUSEHOLD INCOME
46.9%
WAGE / INCOME GAP [ % ]
53.1¢/ $1
WAGE / INCOME GAP [ $ ]
0.43
INEQUALITY / GINI INDEX
4,630
TOTAL POPULATION
2,275
MALE POPULATION
2,355
FEMALE POPULATION
96.60
MALES / 100 FEMALES
103.52
FEMALES / 100 MALES
41.8
MEDIAN AGE
3.0
AVG FAMILY SIZE
2.4
AVG HOUSEHOLD SIZE
1,841
LABOR FORCE [ PEOPLE ]
47.6%
PERCENT IN LABOR FORCE
10.6%
UNEMPLOYMENT RATE
Rogersville Zip Codes
Rogersville Area Codes
Income in Rogersville
Income Overview in Rogersville
Per Capita Income in Rogersville is $25,799, while median incomes of families and households are $55,349 and $45,797 respectively.
| Characteristic | Number | Measure |
| Per Capita Income | 4,630 | $25,799 |
| Median Family Income | 1,030 | $55,349 |
| Mean Family Income | 1,030 | $74,174 |
| Median Household Income | 1,784 | $45,797 |
| Mean Household Income | 1,784 | $61,210 |
| Income Deficit | 1,030 | $0 |
| Wage / Income Gap (%) | 4,630 | 46.89% |
| Wage / Income Gap ($) | 4,630 | 53.11¢ per $1 |
| Gini / Inequality Index | 4,630 | 0.43 |
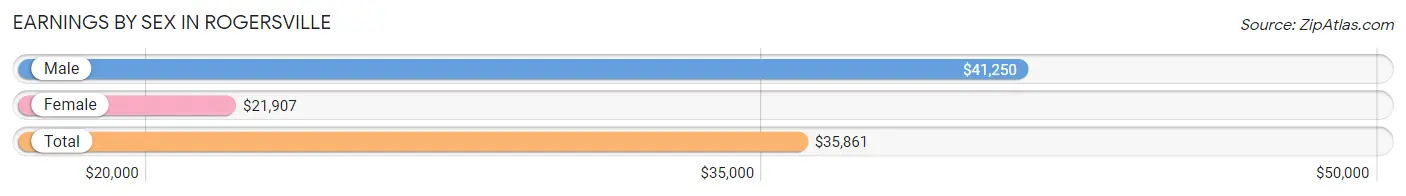
Earnings by Sex in Rogersville
Average Earnings in Rogersville are $35,861, $41,250 for men and $21,907 for women, a difference of 46.9%.
| Sex | Number | Average Earnings |
| Male | 1,200 (59.8%) | $41,250 |
| Female | 806 (40.2%) | $21,907 |
| Total | 2,006 (100.0%) | $35,861 |
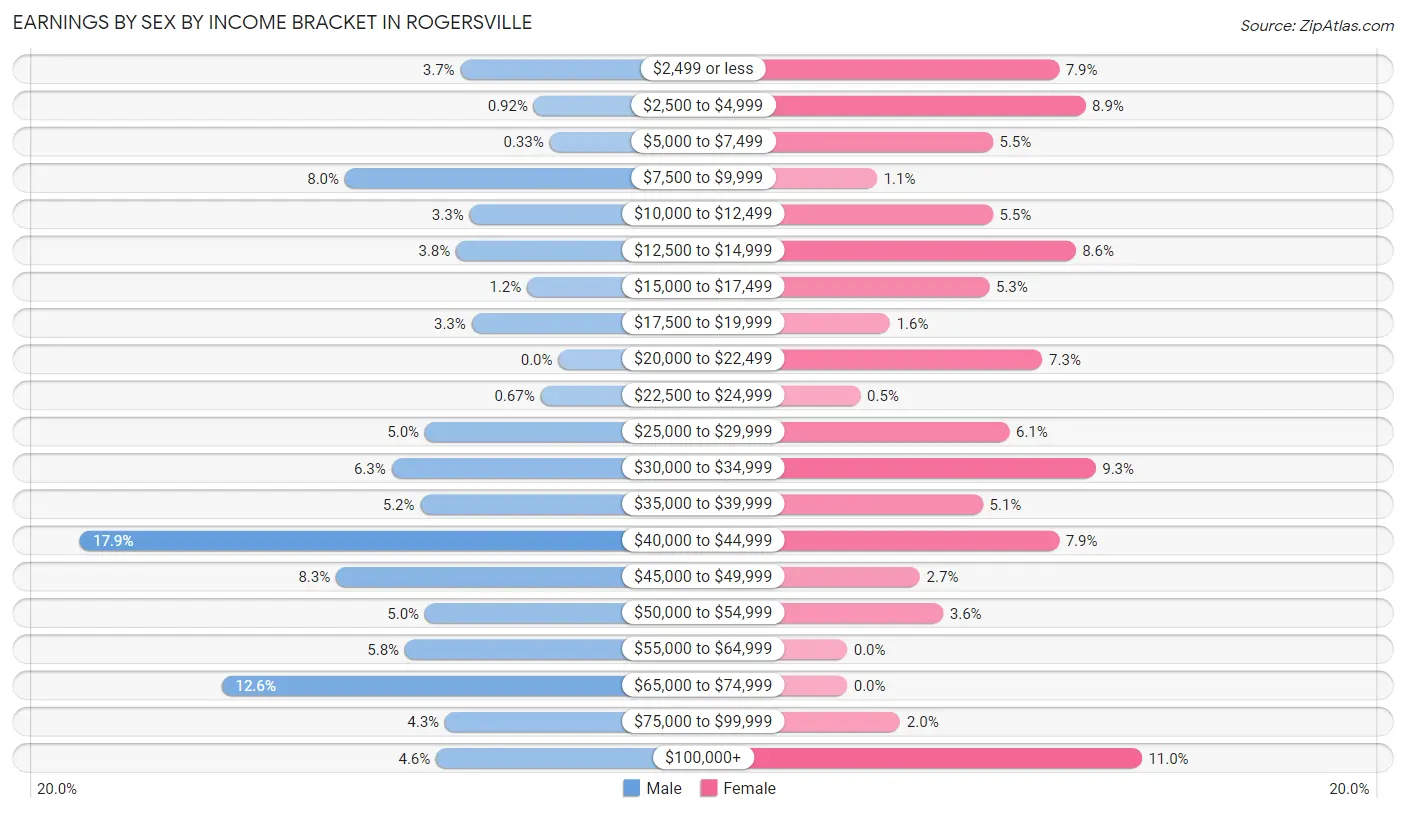
Earnings by Sex by Income Bracket in Rogersville
The most common earnings brackets in Rogersville are $40,000 to $44,999 for men (215 | 17.9%) and $100,000+ for women (89 | 11.0%).
| Income | Male | Female |
| $2,499 or less | 44 (3.7%) | 64 (7.9%) |
| $2,500 to $4,999 | 11 (0.9%) | 72 (8.9%) |
| $5,000 to $7,499 | 4 (0.3%) | 44 (5.5%) |
| $7,500 to $9,999 | 96 (8.0%) | 9 (1.1%) |
| $10,000 to $12,499 | 40 (3.3%) | 44 (5.5%) |
| $12,500 to $14,999 | 46 (3.8%) | 69 (8.6%) |
| $15,000 to $17,499 | 14 (1.2%) | 43 (5.3%) |
| $17,500 to $19,999 | 39 (3.3%) | 13 (1.6%) |
| $20,000 to $22,499 | 0 (0.0%) | 59 (7.3%) |
| $22,500 to $24,999 | 8 (0.7%) | 4 (0.5%) |
| $25,000 to $29,999 | 60 (5.0%) | 49 (6.1%) |
| $30,000 to $34,999 | 75 (6.2%) | 75 (9.3%) |
| $35,000 to $39,999 | 62 (5.2%) | 41 (5.1%) |
| $40,000 to $44,999 | 215 (17.9%) | 64 (7.9%) |
| $45,000 to $49,999 | 100 (8.3%) | 22 (2.7%) |
| $50,000 to $54,999 | 60 (5.0%) | 29 (3.6%) |
| $55,000 to $64,999 | 69 (5.8%) | 0 (0.0%) |
| $65,000 to $74,999 | 151 (12.6%) | 0 (0.0%) |
| $75,000 to $99,999 | 51 (4.3%) | 16 (2.0%) |
| $100,000+ | 55 (4.6%) | 89 (11.0%) |
| Total | 1,200 (100.0%) | 806 (100.0%) |
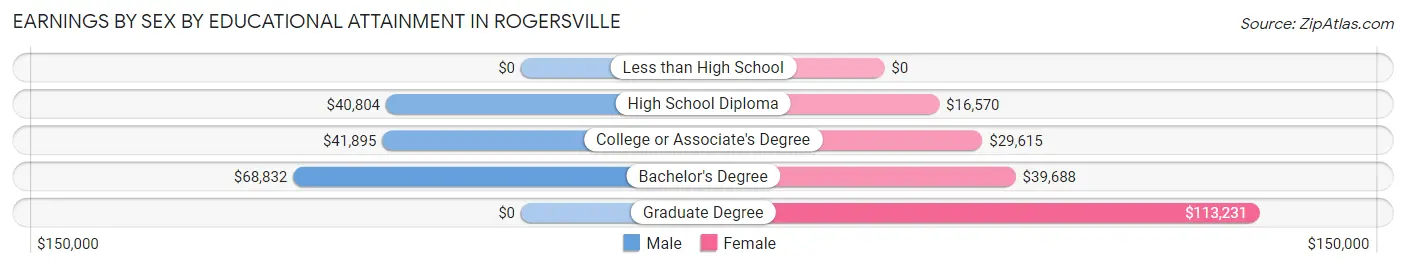
Earnings by Sex by Educational Attainment in Rogersville
Average earnings in Rogersville are $41,937 for men and $31,987 for women, a difference of 23.7%. Men with an educational attainment of bachelor's degree enjoy the highest average annual earnings of $68,832, while those with high school diploma education earn the least with $40,804. Women with an educational attainment of graduate degree earn the most with the average annual earnings of $113,231, while those with high school diploma education have the smallest earnings of $16,570.
| Educational Attainment | Male Income | Female Income |
| Less than High School | - | - |
| High School Diploma | $40,804 | $16,570 |
| College or Associate's Degree | $41,895 | $29,615 |
| Bachelor's Degree | $68,832 | $39,688 |
| Graduate Degree | - | - |
| Total | $41,937 | $31,987 |
Family Income in Rogersville
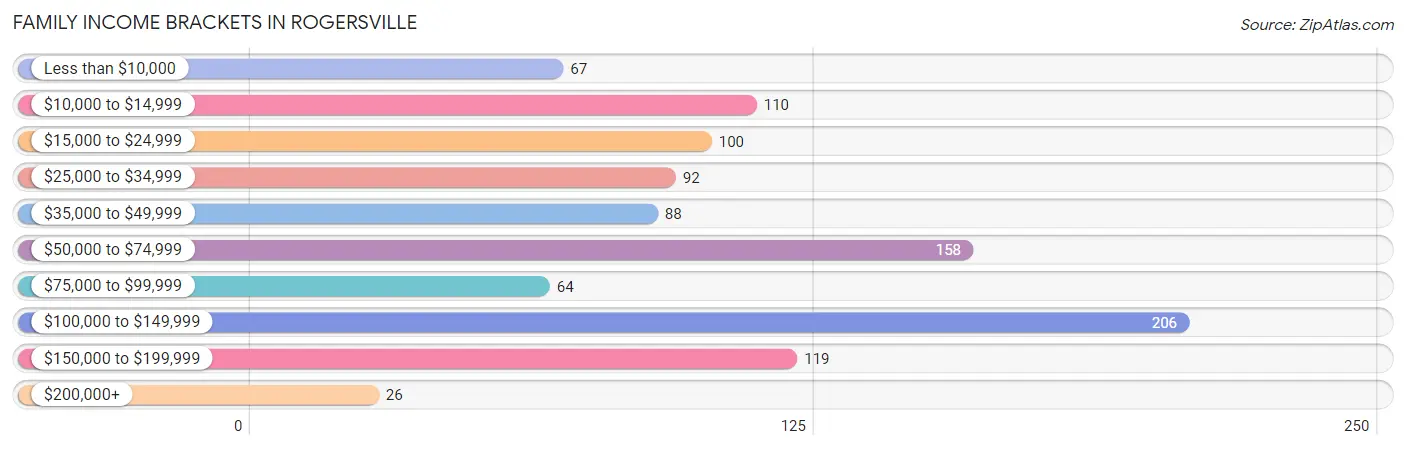
Family Income Brackets in Rogersville
According to the Rogersville family income data, there are 206 families falling into the $100,000 to $149,999 income range, which is the most common income bracket and makes up 20.0% of all families. Conversely, the $200,000+ income bracket is the least frequent group with only 26 families (2.5%) belonging to this category.
| Income Bracket | # Families | % Families |
| Less than $10,000 | 67 | 6.5% |
| $10,000 to $14,999 | 110 | 10.7% |
| $15,000 to $24,999 | 100 | 9.7% |
| $25,000 to $34,999 | 92 | 8.9% |
| $35,000 to $49,999 | 88 | 8.5% |
| $50,000 to $74,999 | 158 | 15.3% |
| $75,000 to $99,999 | 64 | 6.2% |
| $100,000 to $149,999 | 206 | 20.0% |
| $150,000 to $199,999 | 119 | 11.6% |
| $200,000+ | 26 | 2.5% |
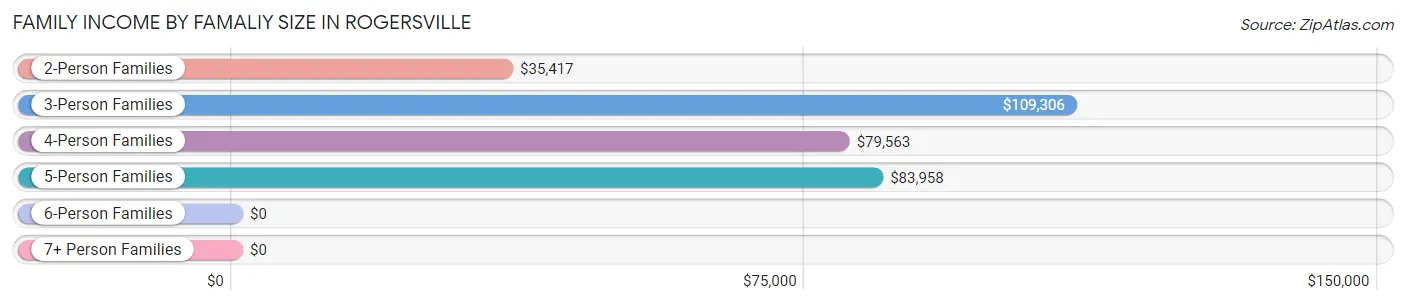
Family Income by Famaliy Size in Rogersville
3-person families (259 | 25.2%) account for the highest median family income in Rogersville with $109,306 per family, while 3-person families (259 | 25.2%) have the highest median income of $36,435 per family member.
| Income Bracket | # Families | Median Income |
| 2-Person Families | 542 (52.6%) | $35,417 |
| 3-Person Families | 259 (25.2%) | $109,306 |
| 4-Person Families | 189 (18.3%) | $79,563 |
| 5-Person Families | 28 (2.7%) | $83,958 |
| 6-Person Families | 12 (1.2%) | $0 |
| 7+ Person Families | 0 (0.0%) | $0 |
| Total | 1,030 (100.0%) | $55,349 |
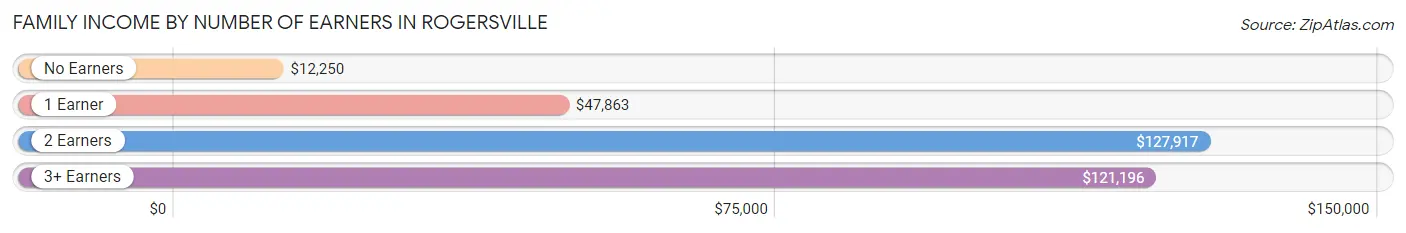
Family Income by Number of Earners in Rogersville
The median family income in Rogersville is $55,349, with families comprising 2 earners (256) having the highest median family income of $127,917, while families with no earners (305) have the lowest median family income of $12,250, accounting for 24.8% and 29.6% of families, respectively.
| Number of Earners | # Families | Median Income |
| No Earners | 305 (29.6%) | $12,250 |
| 1 Earner | 361 (35.0%) | $47,863 |
| 2 Earners | 256 (24.8%) | $127,917 |
| 3+ Earners | 108 (10.5%) | $121,196 |
| Total | 1,030 (100.0%) | $55,349 |
Household Income in Rogersville
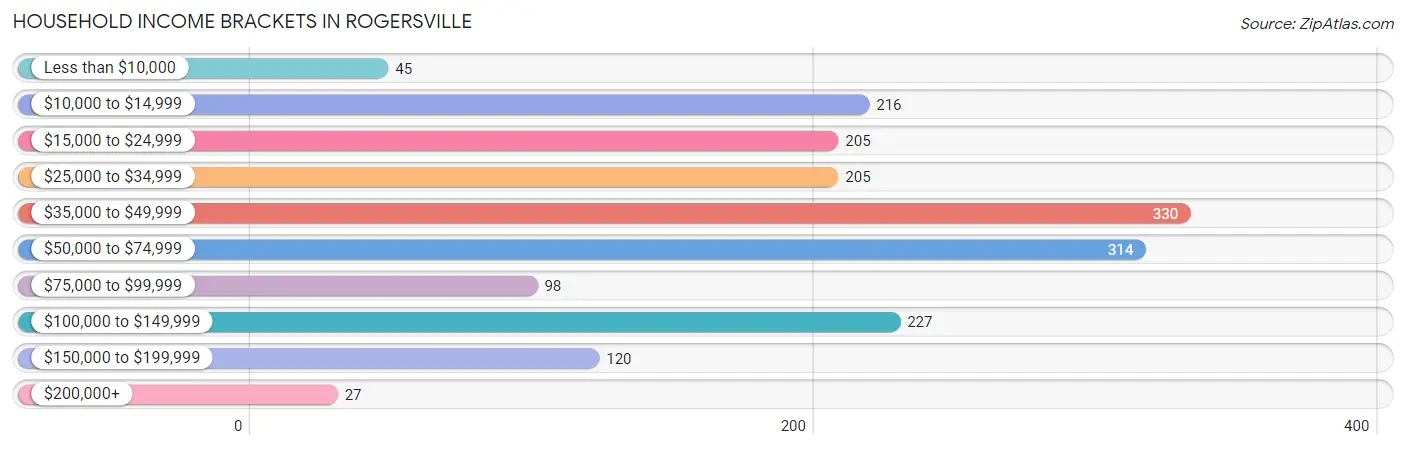
Household Income Brackets in Rogersville
With 330 households falling in the category, the $35,000 to $49,999 income range is the most frequent in Rogersville, accounting for 18.5% of all households. In contrast, only 27 households (1.5%) fall into the $200,000+ income bracket, making it the least populous group.
| Income Bracket | # Households | % Households |
| Less than $10,000 | 45 | 2.5% |
| $10,000 to $14,999 | 216 | 12.1% |
| $15,000 to $24,999 | 205 | 11.5% |
| $25,000 to $34,999 | 205 | 11.5% |
| $35,000 to $49,999 | 330 | 18.5% |
| $50,000 to $74,999 | 314 | 17.6% |
| $75,000 to $99,999 | 98 | 5.5% |
| $100,000 to $149,999 | 227 | 12.7% |
| $150,000 to $199,999 | 120 | 6.7% |
| $200,000+ | 27 | 1.5% |
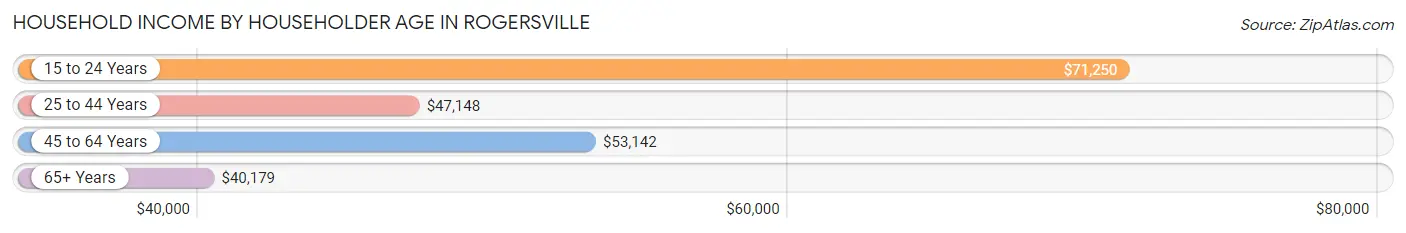
Household Income by Householder Age in Rogersville
The median household income in Rogersville is $45,797, with the highest median household income of $71,250 found in the 15 to 24 years age bracket for the primary householder. A total of 126 households (7.1%) fall into this category. Meanwhile, the 65+ years age bracket for the primary householder has the lowest median household income of $40,179, with 629 households (35.3%) in this group.
| Income Bracket | # Households | Median Income |
| 15 to 24 Years | 126 (7.1%) | $71,250 |
| 25 to 44 Years | 550 (30.8%) | $47,148 |
| 45 to 64 Years | 479 (26.9%) | $53,142 |
| 65+ Years | 629 (35.3%) | $40,179 |
| Total | 1,784 (100.0%) | $45,797 |
Poverty in Rogersville
Income Below Poverty by Sex and Age in Rogersville
With 15.1% poverty level for males and 24.8% for females among the residents of Rogersville, 16 and 17 year old males and 55 to 64 year old females are the most vulnerable to poverty, with 32 males (72.7%) and 149 females (57.1%) in their respective age groups living below the poverty level.
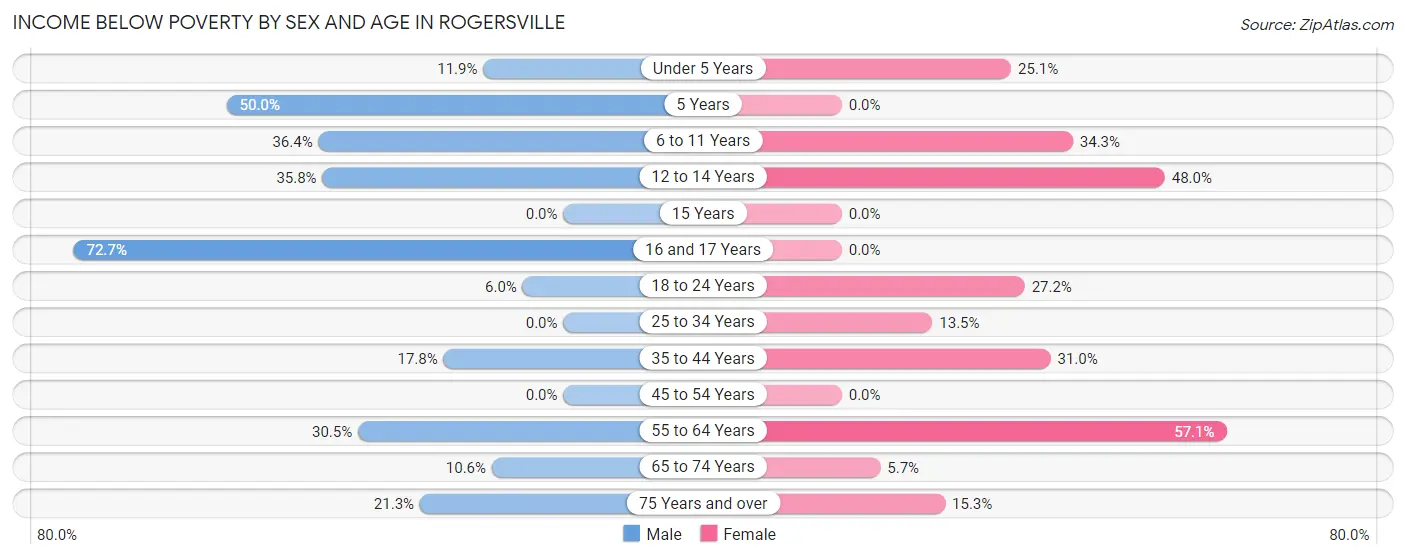
| Age Bracket | Male | Female |
| Under 5 Years | 17 (11.9%) | 45 (25.1%) |
| 5 Years | 6 (50.0%) | 0 (0.0%) |
| 6 to 11 Years | 16 (36.4%) | 35 (34.3%) |
| 12 to 14 Years | 44 (35.8%) | 47 (48.0%) |
| 15 Years | 0 (0.0%) | 0 (0.0%) |
| 16 and 17 Years | 32 (72.7%) | 0 (0.0%) |
| 18 to 24 Years | 18 (6.0%) | 66 (27.2%) |
| 25 to 34 Years | 0 (0.0%) | 16 (13.5%) |
| 35 to 44 Years | 58 (17.8%) | 115 (31.0%) |
| 45 to 54 Years | 0 (0.0%) | 0 (0.0%) |
| 55 to 64 Years | 50 (30.5%) | 149 (57.1%) |
| 65 to 74 Years | 17 (10.6%) | 15 (5.7%) |
| 75 Years and over | 46 (21.3%) | 56 (15.3%) |
| Total | 304 (15.1%) | 544 (24.8%) |
Income Above Poverty by Sex and Age in Rogersville
According to the poverty statistics in Rogersville, males aged 15 years and females aged 5 years are the age groups that are most secure financially, with 100.0% of males and 100.0% of females in these age groups living above the poverty line.
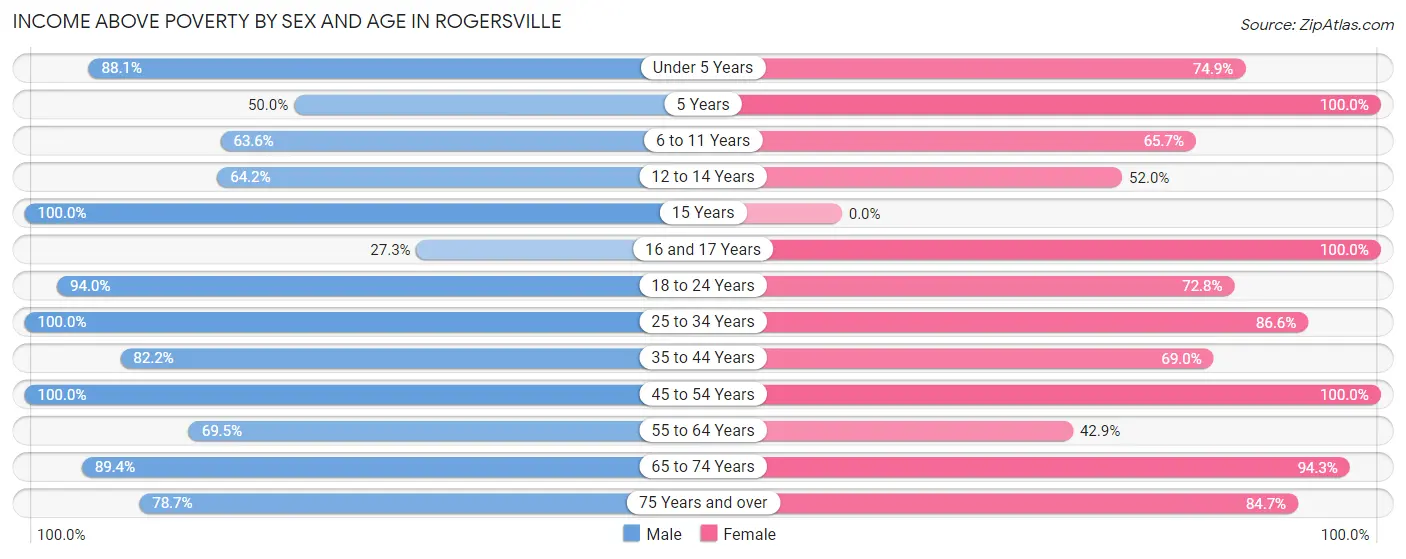
| Age Bracket | Male | Female |
| Under 5 Years | 126 (88.1%) | 134 (74.9%) |
| 5 Years | 6 (50.0%) | 8 (100.0%) |
| 6 to 11 Years | 28 (63.6%) | 67 (65.7%) |
| 12 to 14 Years | 79 (64.2%) | 51 (52.0%) |
| 15 Years | 22 (100.0%) | 0 (0.0%) |
| 16 and 17 Years | 12 (27.3%) | 23 (100.0%) |
| 18 to 24 Years | 280 (94.0%) | 177 (72.8%) |
| 25 to 34 Years | 264 (100.0%) | 103 (86.6%) |
| 35 to 44 Years | 268 (82.2%) | 256 (69.0%) |
| 45 to 54 Years | 203 (100.0%) | 164 (100.0%) |
| 55 to 64 Years | 114 (69.5%) | 112 (42.9%) |
| 65 to 74 Years | 143 (89.4%) | 247 (94.3%) |
| 75 Years and over | 170 (78.7%) | 309 (84.7%) |
| Total | 1,715 (84.9%) | 1,651 (75.2%) |
Income Below Poverty Among Married-Couple Families in Rogersville
The poverty statistics for married-couple families in Rogersville show that 6.4% or 37 of the total 581 families live below the poverty line. Families with no children have the highest poverty rate of 12.2%, comprising of 37 families. On the other hand, families with 1 or 2 children have the lowest poverty rate of 0.0%, which includes 0 families.
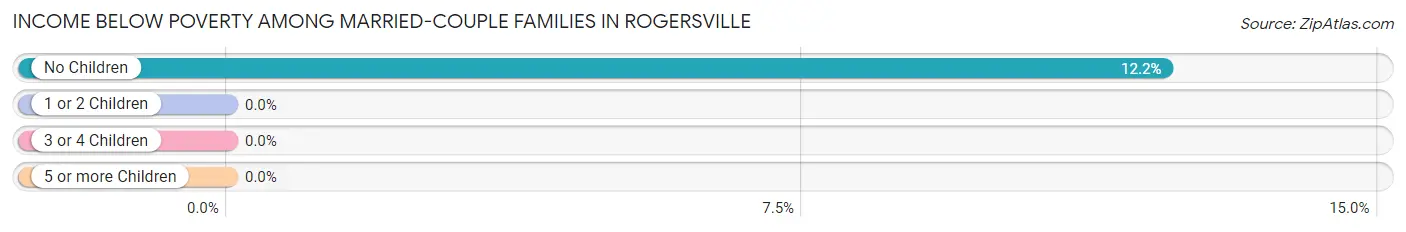
| Children | Above Poverty | Below Poverty |
| No Children | 266 (87.8%) | 37 (12.2%) |
| 1 or 2 Children | 266 (100.0%) | 0 (0.0%) |
| 3 or 4 Children | 12 (100.0%) | 0 (0.0%) |
| 5 or more Children | 0 (0.0%) | 0 (0.0%) |
| Total | 544 (93.6%) | 37 (6.4%) |
Income Below Poverty Among Single-Parent Households in Rogersville
According to the poverty data in Rogersville, 25.6% or 55 single-father households and 53.0% or 124 single-mother households are living below the poverty line. Among single-father households, those with 1 or 2 children have the highest poverty rate, with 38 households (52.0%) experiencing poverty. Likewise, among single-mother households, those with 1 or 2 children have the highest poverty rate, with 94 households (69.6%) falling below the poverty line.
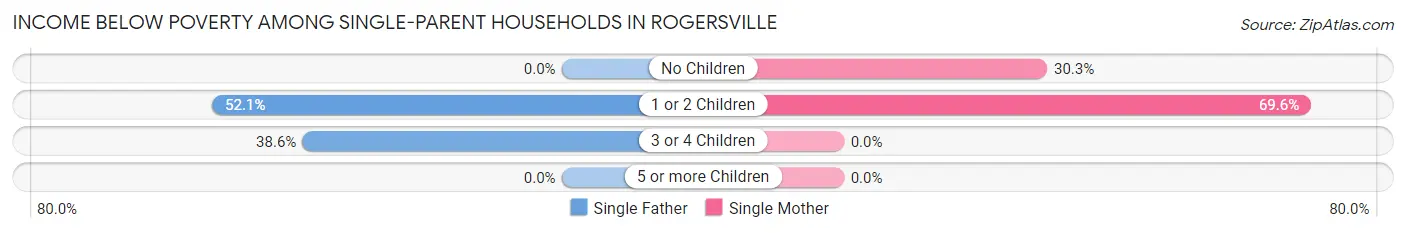
| Children | Single Father | Single Mother |
| No Children | 0 (0.0%) | 30 (30.3%) |
| 1 or 2 Children | 38 (52.0%) | 94 (69.6%) |
| 3 or 4 Children | 17 (38.6%) | 0 (0.0%) |
| 5 or more Children | 0 (0.0%) | 0 (0.0%) |
| Total | 55 (25.6%) | 124 (53.0%) |
Income Below Poverty Among Married-Couple vs Single-Parent Households in Rogersville
The poverty data for Rogersville shows that 37 of the married-couple family households (6.4%) and 179 of the single-parent households (39.9%) are living below the poverty level. Within the married-couple family households, those with no children have the highest poverty rate, with 37 households (12.2%) falling below the poverty line. Among the single-parent households, those with 1 or 2 children have the highest poverty rate, with 132 household (63.5%) living below poverty.
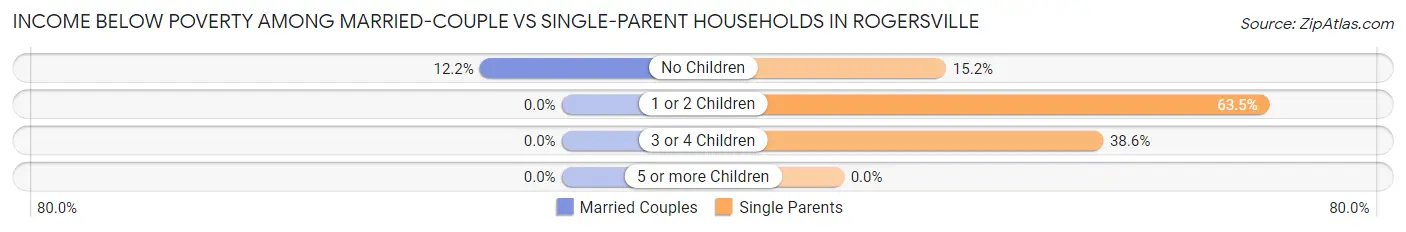
| Children | Married-Couple Families | Single-Parent Households |
| No Children | 37 (12.2%) | 30 (15.2%) |
| 1 or 2 Children | 0 (0.0%) | 132 (63.5%) |
| 3 or 4 Children | 0 (0.0%) | 17 (38.6%) |
| 5 or more Children | 0 (0.0%) | 0 (0.0%) |
| Total | 37 (6.4%) | 179 (39.9%) |
Race in Rogersville
The most populous races in Rogersville are White / Caucasian (4,336 | 93.6%), Black / African American (151 | 3.3%), and Two or more Races (108 | 2.3%).
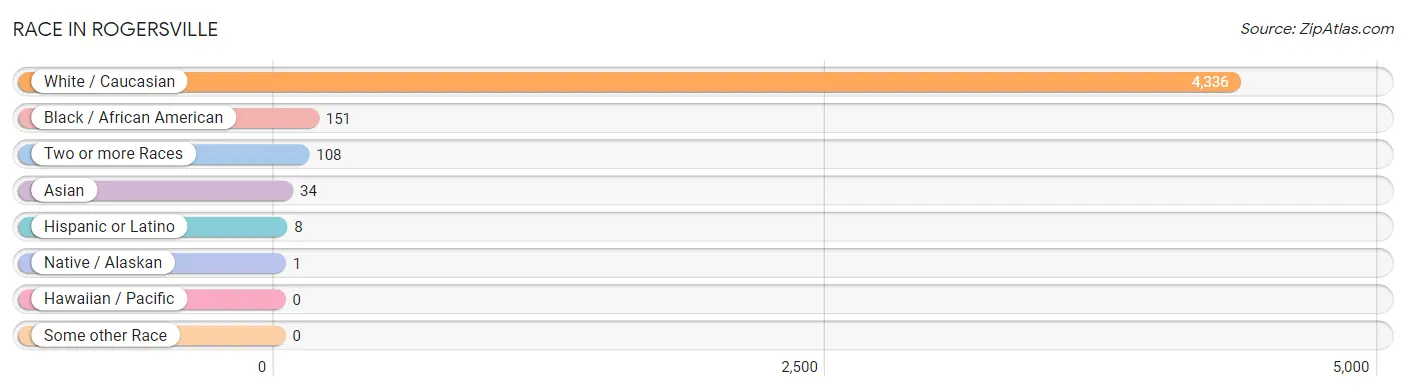
| Race | # Population | % Population |
| Asian | 34 | 0.7% |
| Black / African American | 151 | 3.3% |
| Hawaiian / Pacific | 0 | 0.0% |
| Hispanic or Latino | 8 | 0.2% |
| Native / Alaskan | 1 | 0.0% |
| White / Caucasian | 4,336 | 93.6% |
| Two or more Races | 108 | 2.3% |
| Some other Race | 0 | 0.0% |
| Total | 4,630 | 100.0% |
Ancestry in Rogersville
The most populous ancestries reported in Rogersville are American (844 | 18.2%), English (633 | 13.7%), Irish (531 | 11.5%), German (265 | 5.7%), and Italian (197 | 4.3%), together accounting for 53.3% of all Rogersville residents.
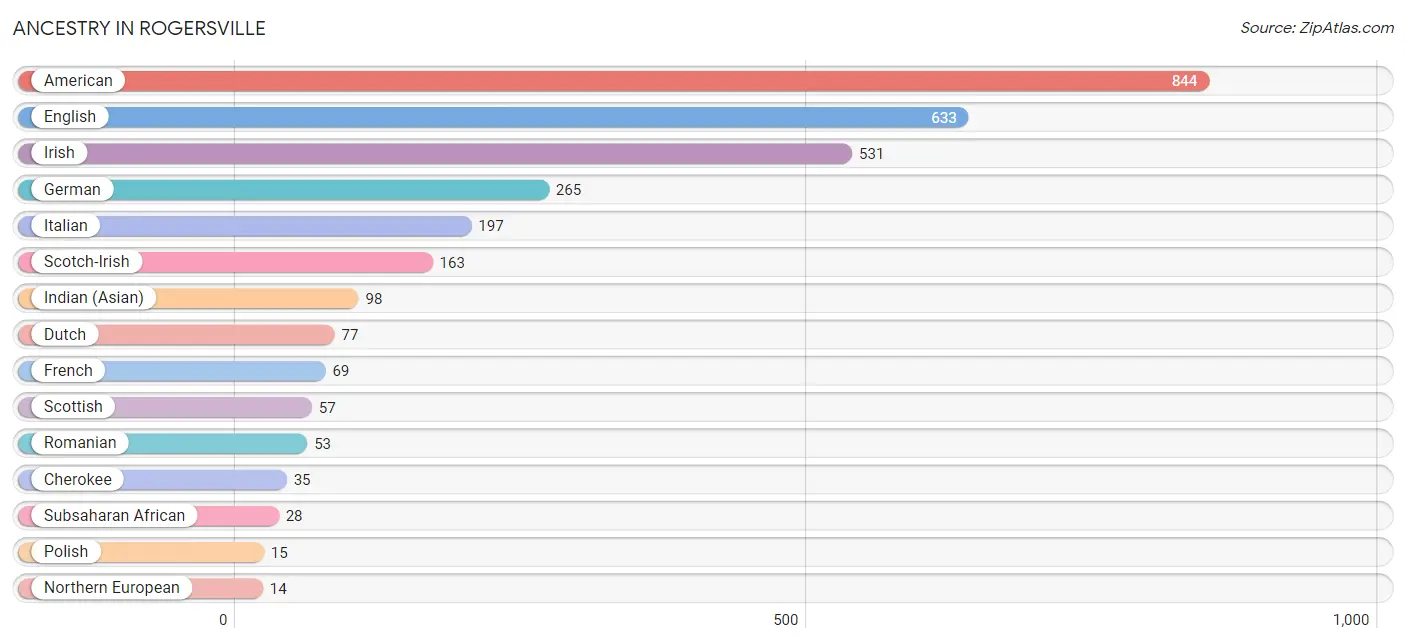
| Ancestry | # Population | % Population |
| African | 11 | 0.2% |
| American | 844 | 18.2% |
| Cherokee | 35 | 0.8% |
| Dutch | 77 | 1.7% |
| English | 633 | 13.7% |
| French | 69 | 1.5% |
| German | 265 | 5.7% |
| Indian (Asian) | 98 | 2.1% |
| Irish | 531 | 11.5% |
| Italian | 197 | 4.3% |
| Mexican | 8 | 0.2% |
| Northern European | 14 | 0.3% |
| Norwegian | 7 | 0.2% |
| Polish | 15 | 0.3% |
| Romanian | 53 | 1.1% |
| Scandinavian | 7 | 0.2% |
| Scotch-Irish | 163 | 3.5% |
| Scottish | 57 | 1.2% |
| Subsaharan African | 28 | 0.6% | View All 19 Rows |
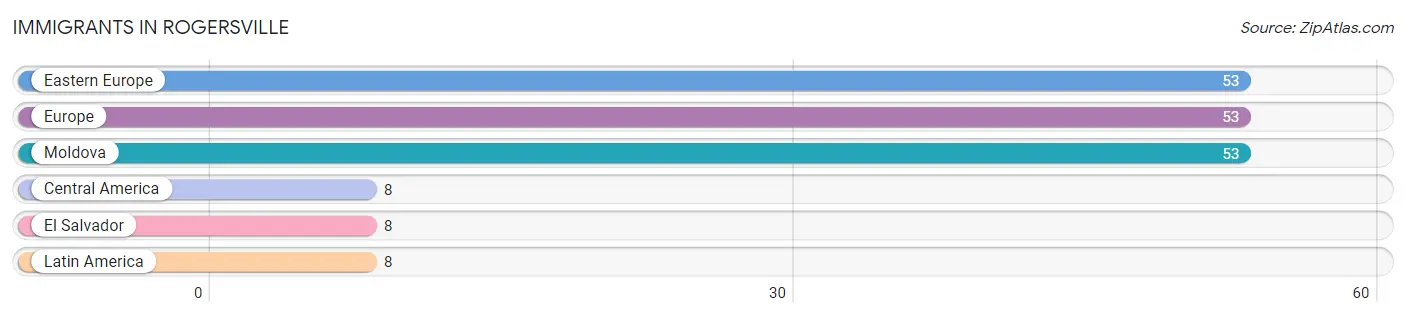
Immigrants in Rogersville
The most numerous immigrant groups reported in Rogersville came from Eastern Europe (53 | 1.1%), Europe (53 | 1.1%), Moldova (53 | 1.1%), Central America (8 | 0.2%), and El Salvador (8 | 0.2%), together accounting for 3.8% of all Rogersville residents.
| Immigration Origin | # Population | % Population |
| Central America | 8 | 0.2% |
| Eastern Europe | 53 | 1.1% |
| El Salvador | 8 | 0.2% |
| Europe | 53 | 1.1% |
| Latin America | 8 | 0.2% |
| Moldova | 53 | 1.1% | View All 6 Rows |
Sex and Age in Rogersville
Sex and Age in Rogersville
The most populous age groups in Rogersville are 20 to 24 Years (310 | 13.6%) for men and 40 to 44 Years (276 | 11.7%) for women.
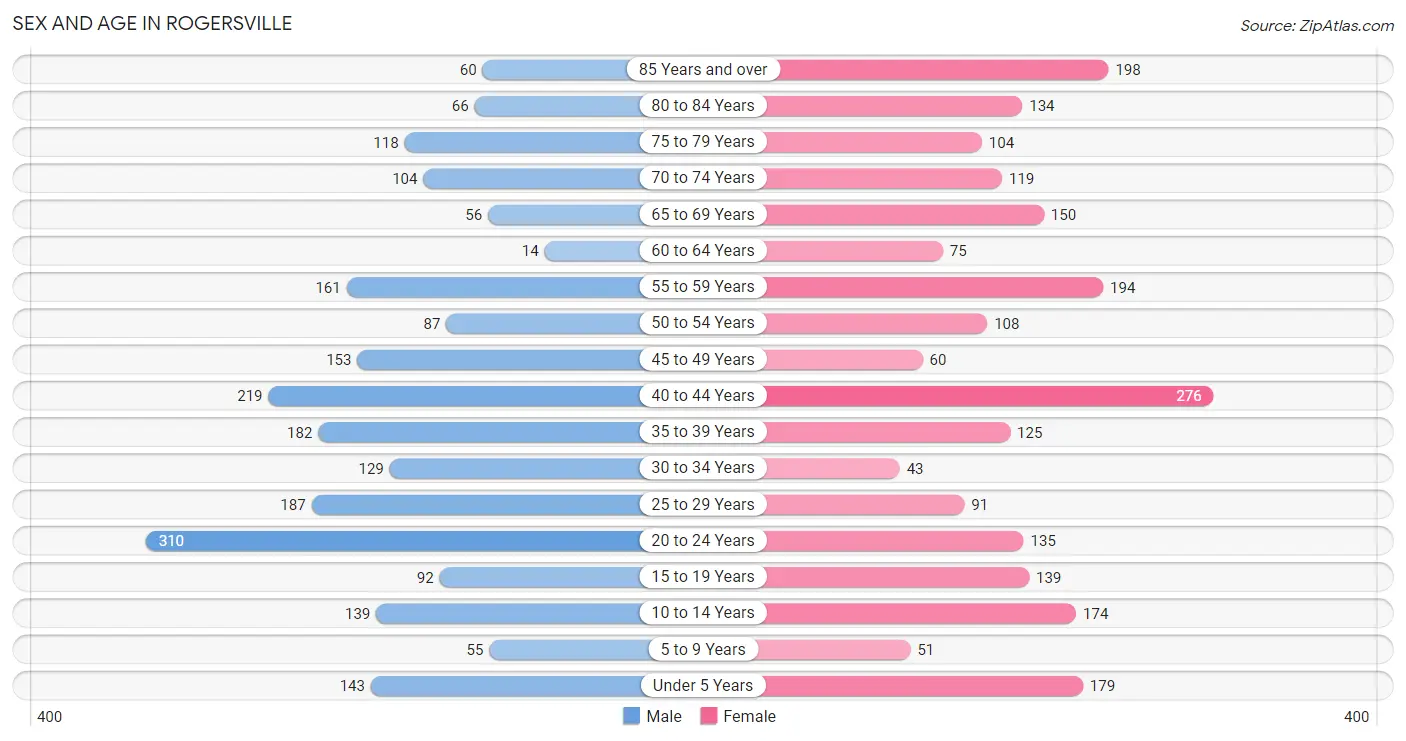
| Age Bracket | Male | Female |
| Under 5 Years | 143 (6.3%) | 179 (7.6%) |
| 5 to 9 Years | 55 (2.4%) | 51 (2.2%) |
| 10 to 14 Years | 139 (6.1%) | 174 (7.4%) |
| 15 to 19 Years | 92 (4.0%) | 139 (5.9%) |
| 20 to 24 Years | 310 (13.6%) | 135 (5.7%) |
| 25 to 29 Years | 187 (8.2%) | 91 (3.9%) |
| 30 to 34 Years | 129 (5.7%) | 43 (1.8%) |
| 35 to 39 Years | 182 (8.0%) | 125 (5.3%) |
| 40 to 44 Years | 219 (9.6%) | 276 (11.7%) |
| 45 to 49 Years | 153 (6.7%) | 60 (2.5%) |
| 50 to 54 Years | 87 (3.8%) | 108 (4.6%) |
| 55 to 59 Years | 161 (7.1%) | 194 (8.2%) |
| 60 to 64 Years | 14 (0.6%) | 75 (3.2%) |
| 65 to 69 Years | 56 (2.5%) | 150 (6.4%) |
| 70 to 74 Years | 104 (4.6%) | 119 (5.1%) |
| 75 to 79 Years | 118 (5.2%) | 104 (4.4%) |
| 80 to 84 Years | 66 (2.9%) | 134 (5.7%) |
| 85 Years and over | 60 (2.6%) | 198 (8.4%) |
| Total | 2,275 (100.0%) | 2,355 (100.0%) |
Families and Households in Rogersville
Median Family Size in Rogersville
The median family size in Rogersville is 3.03 persons per family, with married-couple families (581 | 56.4%) accounting for the largest median family size of 3.22 persons per family. On the other hand, single female/mother families (234 | 22.7%) represent the smallest median family size with 2.66 persons per family.
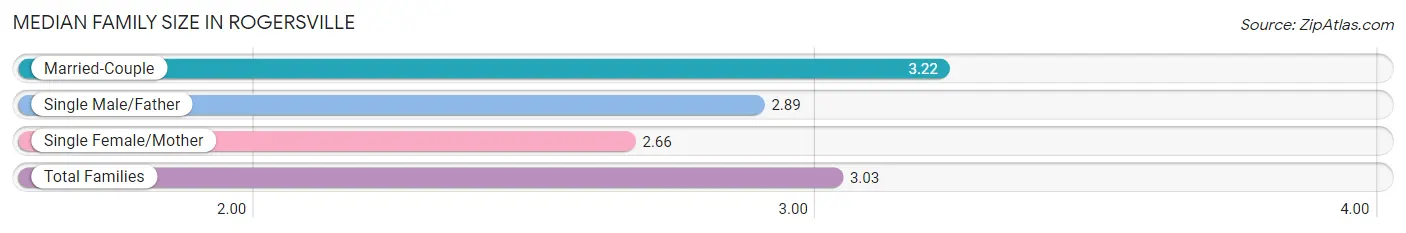
| Family Type | # Families | Family Size |
| Married-Couple | 581 (56.4%) | 3.22 |
| Single Male/Father | 215 (20.9%) | 2.89 |
| Single Female/Mother | 234 (22.7%) | 2.66 |
| Total Families | 1,030 (100.0%) | 3.03 |
Median Household Size in Rogersville
The median household size in Rogersville is 2.38 persons per household, with single male/father households (215 | 12.0%) accounting for the largest median household size of 3.57 persons per household. non-family households (754 | 42.3%) represent the smallest median household size with 1.12 persons per household.
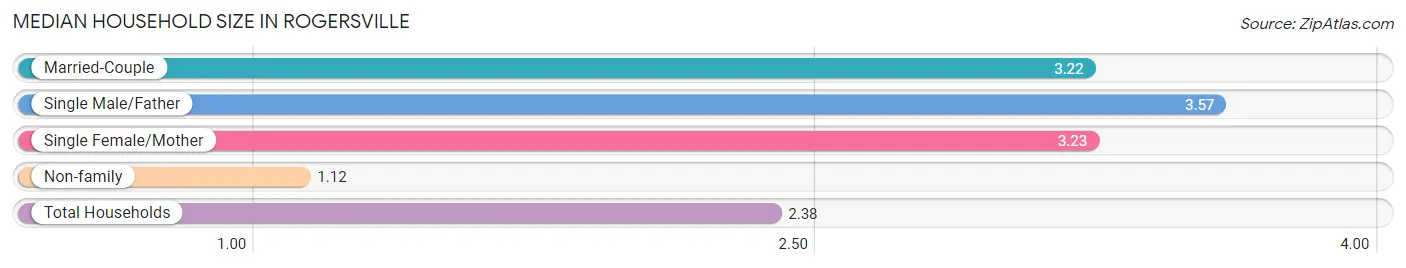
| Household Type | # Households | Household Size |
| Married-Couple | 581 (32.6%) | 3.22 |
| Single Male/Father | 215 (12.0%) | 3.57 |
| Single Female/Mother | 234 (13.1%) | 3.23 |
| Non-family | 754 (42.3%) | 1.12 |
| Total Households | 1,784 (100.0%) | 2.38 |
Household Size by Marriage Status in Rogersville
Out of a total of 1,784 households in Rogersville, 1,030 (57.7%) are family households, while 754 (42.3%) are nonfamily households. The most numerous type of family households are 2-person households, comprising 434, and the most common type of nonfamily households are 1-person households, comprising 690.
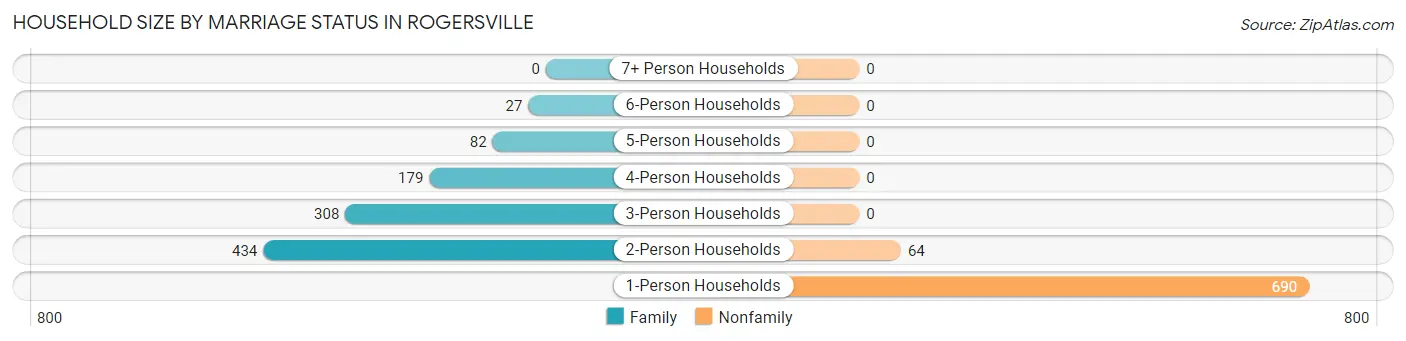
| Household Size | Family Households | Nonfamily Households |
| 1-Person Households | - | 690 (38.7%) |
| 2-Person Households | 434 (24.3%) | 64 (3.6%) |
| 3-Person Households | 308 (17.3%) | 0 (0.0%) |
| 4-Person Households | 179 (10.0%) | 0 (0.0%) |
| 5-Person Households | 82 (4.6%) | 0 (0.0%) |
| 6-Person Households | 27 (1.5%) | 0 (0.0%) |
| 7+ Person Households | 0 (0.0%) | 0 (0.0%) |
| Total | 1,030 (57.7%) | 754 (42.3%) |
Female Fertility in Rogersville
Fertility by Age in Rogersville
Average fertility rate in Rogersville is 64.0 births per 1,000 women. Women in the age bracket of 20 to 34 years have the highest fertility rate with 216.0 births per 1,000 women. Women in the age bracket of 20 to 34 years acount for 100.0% of all women with births.
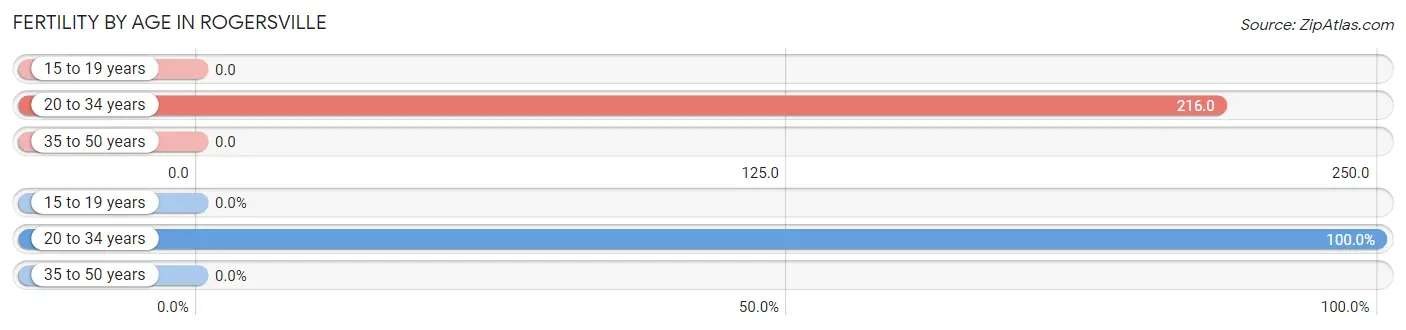
| Age Bracket | Women with Births | Births / 1,000 Women |
| 15 to 19 years | 0 (0.0%) | 0.0 |
| 20 to 34 years | 58 (100.0%) | 216.0 |
| 35 to 50 years | 0 (0.0%) | 0.0 |
| Total | 58 (100.0%) | 64.0 |
Fertility by Age by Marriage Status in Rogersville
46.6% of women with births (58) in Rogersville are married. The highest percentage of unmarried women with births falls into 20 to 34 years age bracket with 53.4% of them unmarried at the time of birth, while the lowest percentage of unmarried women with births belong to 20 to 34 years age bracket with 53.4% of them unmarried.
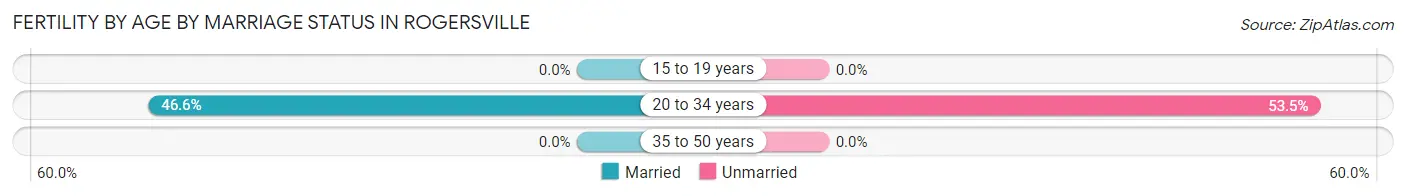
| Age Bracket | Married | Unmarried |
| 15 to 19 years | 0 (0.0%) | 0 (0.0%) |
| 20 to 34 years | 27 (46.6%) | 31 (53.4%) |
| 35 to 50 years | 0 (0.0%) | 0 (0.0%) |
| Total | 27 (46.6%) | 31 (53.4%) |
Fertility by Education in Rogersville
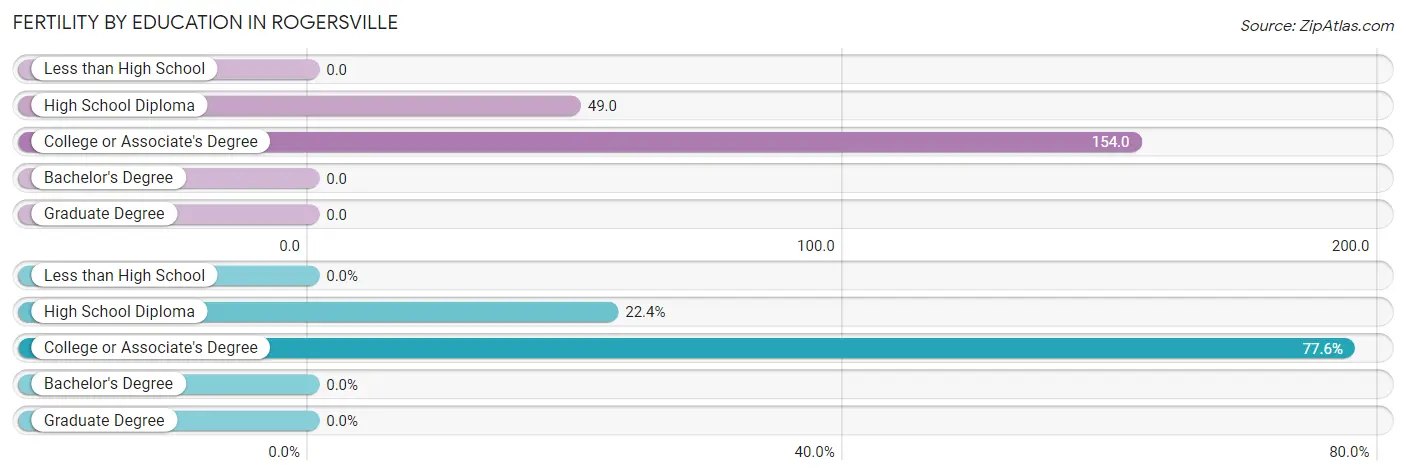
| Educational Attainment | Women with Births | Births / 1,000 Women |
| Less than High School | 0 (0.0%) | 0.0 |
| High School Diploma | 13 (22.4%) | 49.0 |
| College or Associate's Degree | 45 (77.6%) | 154.0 |
| Bachelor's Degree | 0 (0.0%) | 0.0 |
| Graduate Degree | 0 (0.0%) | 0.0 |
| Total | 58 (100.0%) | 64.0 |
Fertility by Education by Marriage Status in Rogersville
53.4% of women with births in Rogersville are unmarried. Women with the educational attainment of college or associate's degree are most likely to be married with 60.0% of them married at childbirth, while women with the educational attainment of high school diploma are least likely to be married with 100.0% of them unmarried at childbirth.
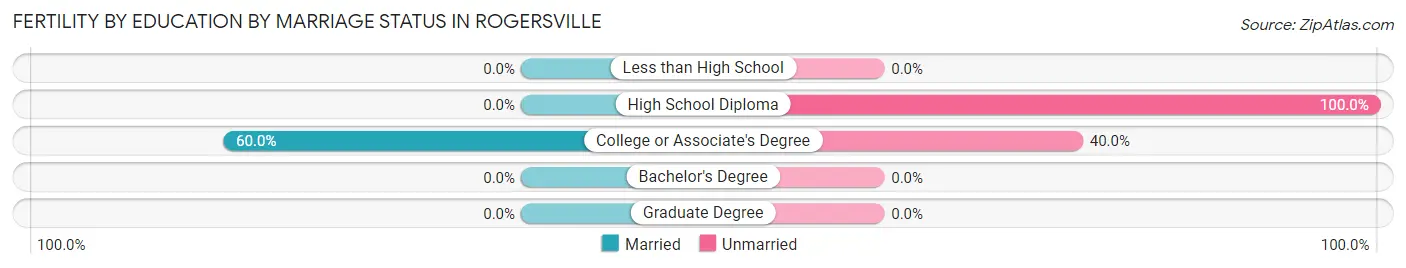
| Educational Attainment | Married | Unmarried |
| Less than High School | 0 (0.0%) | 0 (0.0%) |
| High School Diploma | 0 (0.0%) | 13 (100.0%) |
| College or Associate's Degree | 27 (60.0%) | 18 (40.0%) |
| Bachelor's Degree | 0 (0.0%) | 0 (0.0%) |
| Graduate Degree | 0 (0.0%) | 0 (0.0%) |
| Total | 27 (46.6%) | 31 (53.4%) |
Employment Characteristics in Rogersville
Employment by Class of Employer in Rogersville
Among the 1,631 employed individuals in Rogersville, private company employees (1,200 | 73.6%), not-for-profit organizations (156 | 9.6%), and local government employees (142 | 8.7%) make up the most common classes of employment.
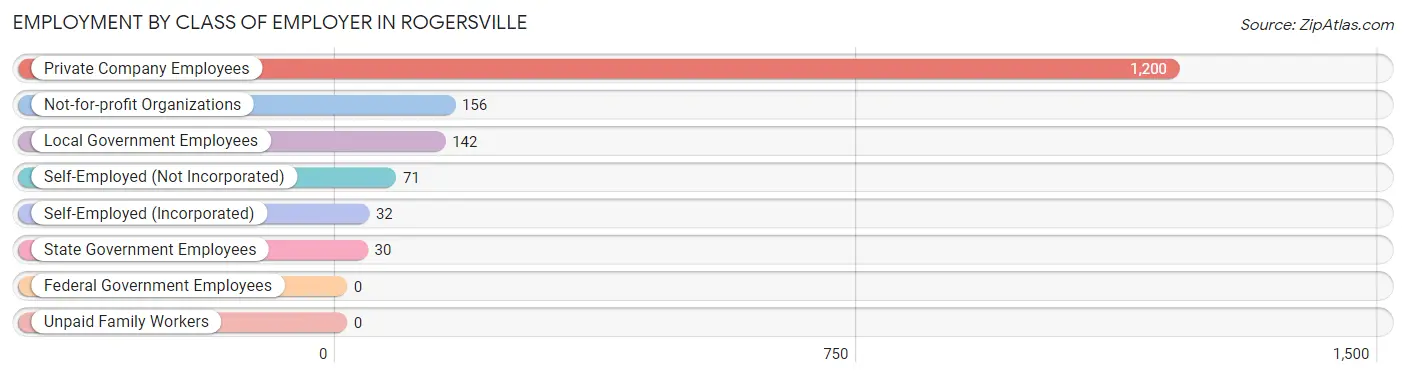
| Employer Class | # Employees | % Employees |
| Private Company Employees | 1,200 | 73.6% |
| Self-Employed (Incorporated) | 32 | 2.0% |
| Self-Employed (Not Incorporated) | 71 | 4.3% |
| Not-for-profit Organizations | 156 | 9.6% |
| Local Government Employees | 142 | 8.7% |
| State Government Employees | 30 | 1.8% |
| Federal Government Employees | 0 | 0.0% |
| Unpaid Family Workers | 0 | 0.0% |
| Total | 1,631 | 100.0% |
Employment Status by Age in Rogersville
According to the labor force statistics for Rogersville, out of the total population over 16 years of age (3,867), 47.6% or 1,841 individuals are in the labor force, with 10.6% or 195 of them unemployed. The age group with the highest labor force participation rate is 25 to 29 years, with 87.8% or 244 individuals in the labor force. Within the labor force, the 25 to 29 years age range has the highest percentage of unemployed individuals, with 52.5% or 128 of them being unemployed.
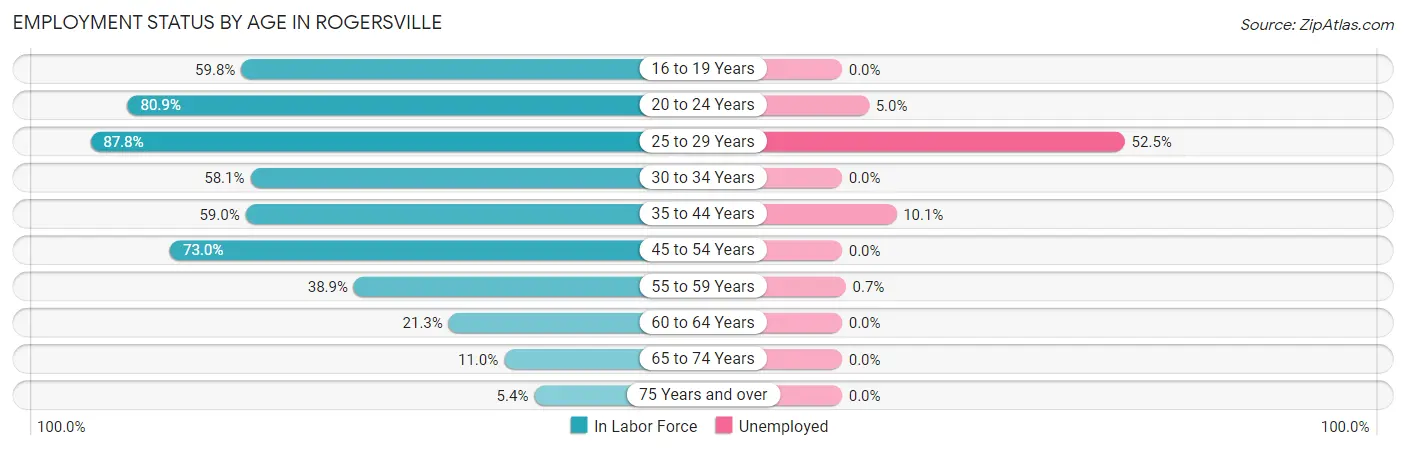
| Age Bracket | In Labor Force | Unemployed |
| 16 to 19 Years | 125 (59.8%) | 0 (0.0%) |
| 20 to 24 Years | 360 (80.9%) | 18 (5.0%) |
| 25 to 29 Years | 244 (87.8%) | 128 (52.5%) |
| 30 to 34 Years | 100 (58.1%) | 0 (0.0%) |
| 35 to 44 Years | 473 (59.0%) | 48 (10.1%) |
| 45 to 54 Years | 298 (73.0%) | 0 (0.0%) |
| 55 to 59 Years | 138 (38.9%) | 1 (0.7%) |
| 60 to 64 Years | 19 (21.3%) | 0 (0.0%) |
| 65 to 74 Years | 47 (11.0%) | 0 (0.0%) |
| 75 Years and over | 37 (5.4%) | 0 (0.0%) |
| Total | 1,841 (47.6%) | 195 (10.6%) |
Employment Status by Educational Attainment in Rogersville
According to labor force statistics for Rogersville, 60.5% of individuals (1,273) out of the total population between 25 and 64 years of age (2,104) are in the labor force, with 13.9% or 177 of them being unemployed. The group with the highest labor force participation rate are those with the educational attainment of bachelor's degree or higher, with 84.4% or 448 individuals in the labor force. Within the labor force, individuals with high school diploma education have the highest percentage of unemployment, with 26.0% or 129 of them being unemployed.
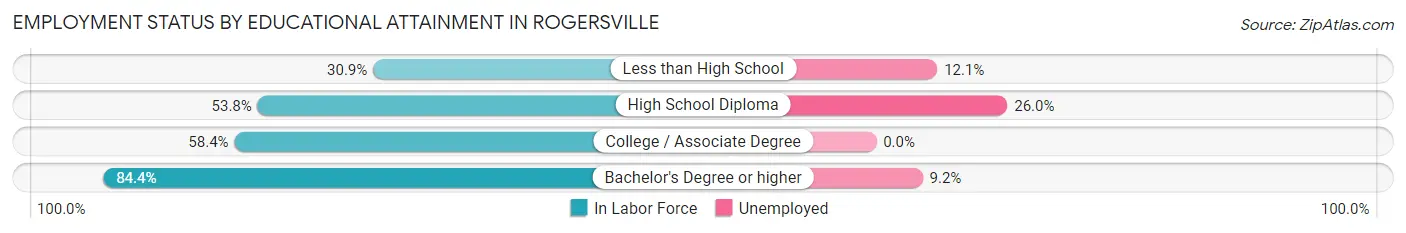
| Educational Attainment | In Labor Force | Unemployed |
| Less than High School | 58 (30.9%) | 23 (12.1%) |
| High School Diploma | 497 (53.8%) | 240 (26.0%) |
| College / Associate Degree | 269 (58.4%) | 0 (0.0%) |
| Bachelor's Degree or higher | 448 (84.4%) | 49 (9.2%) |
| Total | 1,273 (60.5%) | 292 (13.9%) |
Employment Occupations by Sex in Rogersville
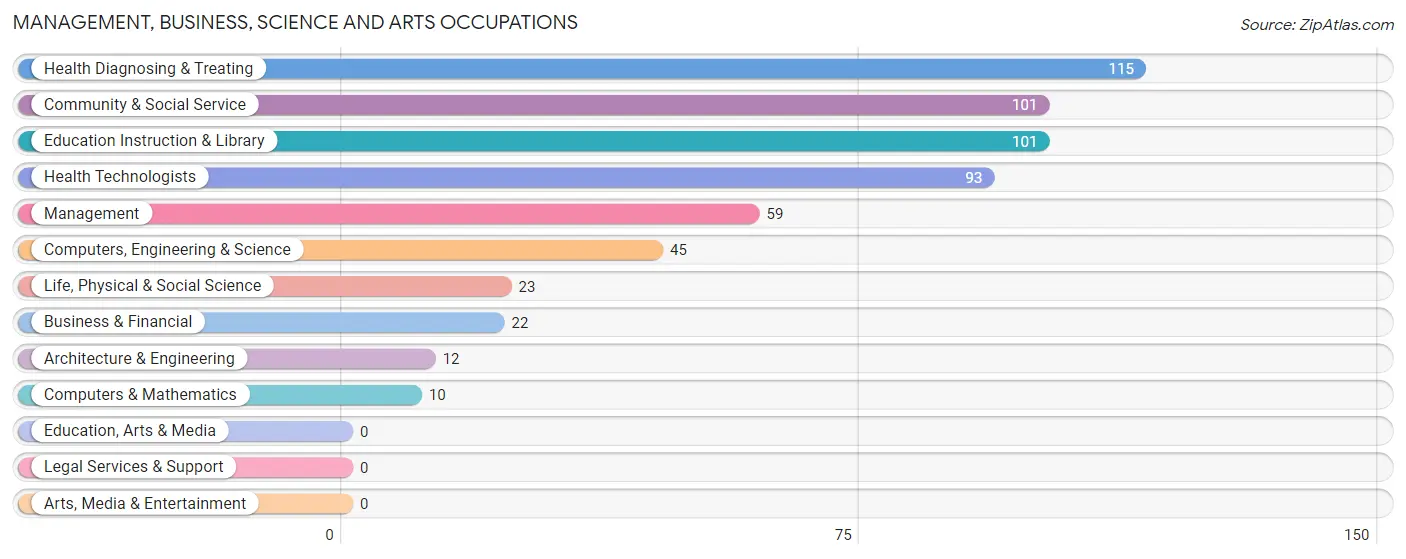
Management, Business, Science and Arts Occupations
The most common Management, Business, Science and Arts occupations in Rogersville are Health Diagnosing & Treating (115 | 7.0%), Community & Social Service (101 | 6.1%), Education Instruction & Library (101 | 6.1%), Health Technologists (93 | 5.7%), and Management (59 | 3.6%).
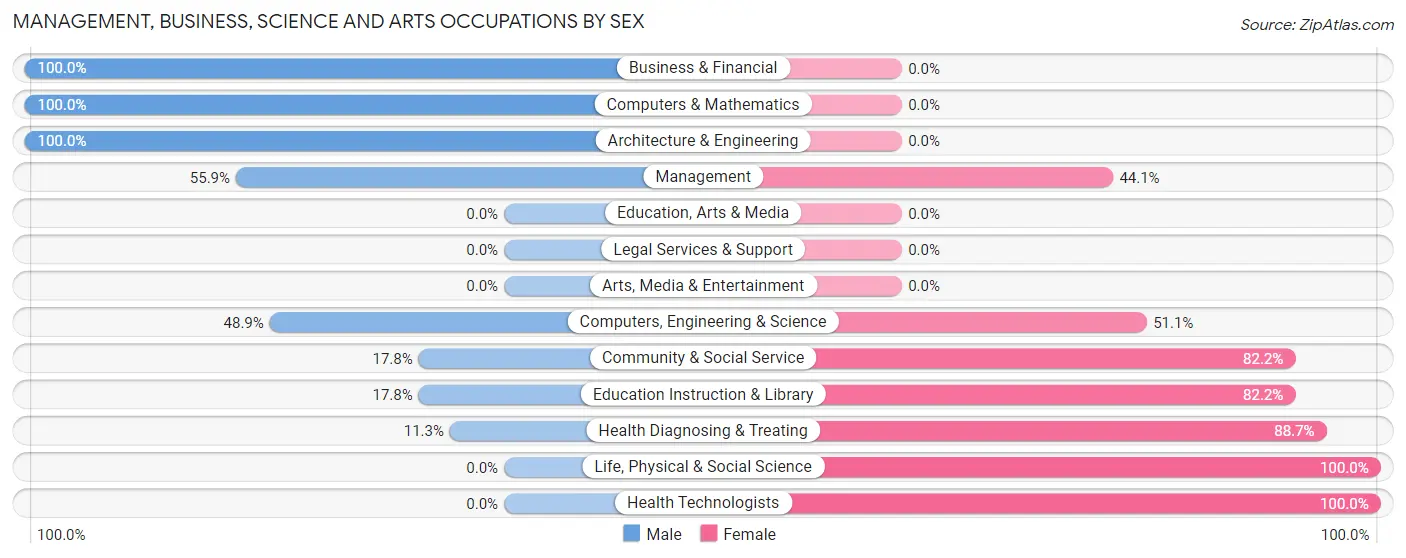
Management, Business, Science and Arts Occupations by Sex
Within the Management, Business, Science and Arts occupations in Rogersville, the most male-oriented occupations are Business & Financial (100.0%), Computers & Mathematics (100.0%), and Architecture & Engineering (100.0%), while the most female-oriented occupations are Life, Physical & Social Science (100.0%), Health Technologists (100.0%), and Health Diagnosing & Treating (88.7%).
| Occupation | Male | Female |
| Management | 33 (55.9%) | 26 (44.1%) |
| Business & Financial | 22 (100.0%) | 0 (0.0%) |
| Computers, Engineering & Science | 22 (48.9%) | 23 (51.1%) |
| Computers & Mathematics | 10 (100.0%) | 0 (0.0%) |
| Architecture & Engineering | 12 (100.0%) | 0 (0.0%) |
| Life, Physical & Social Science | 0 (0.0%) | 23 (100.0%) |
| Community & Social Service | 18 (17.8%) | 83 (82.2%) |
| Education, Arts & Media | 0 (0.0%) | 0 (0.0%) |
| Legal Services & Support | 0 (0.0%) | 0 (0.0%) |
| Education Instruction & Library | 18 (17.8%) | 83 (82.2%) |
| Arts, Media & Entertainment | 0 (0.0%) | 0 (0.0%) |
| Health Diagnosing & Treating | 13 (11.3%) | 102 (88.7%) |
| Health Technologists | 0 (0.0%) | 93 (100.0%) |
| Total (Category) | 108 (31.6%) | 234 (68.4%) |
| Total (Overall) | 974 (59.2%) | 672 (40.8%) |
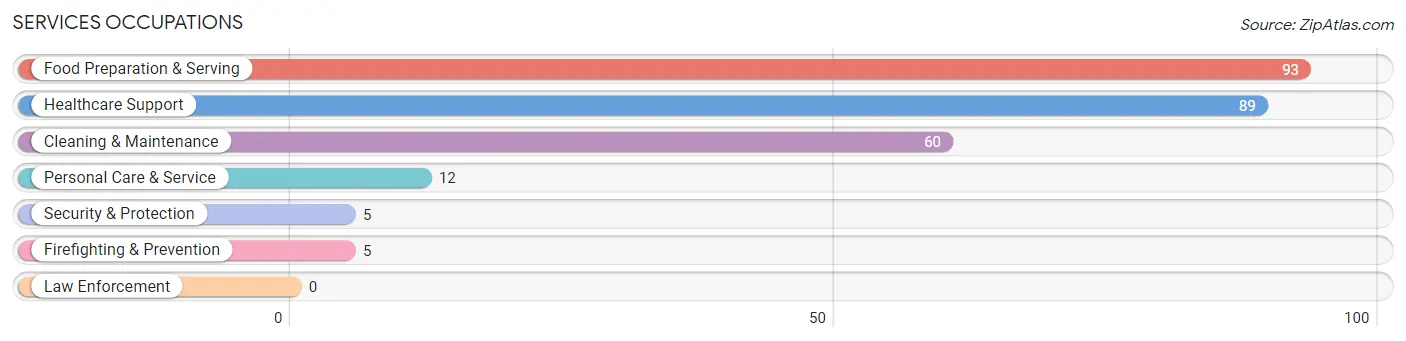
Services Occupations
The most common Services occupations in Rogersville are Food Preparation & Serving (93 | 5.7%), Healthcare Support (89 | 5.4%), Cleaning & Maintenance (60 | 3.6%), Personal Care & Service (12 | 0.7%), and Security & Protection (5 | 0.3%).
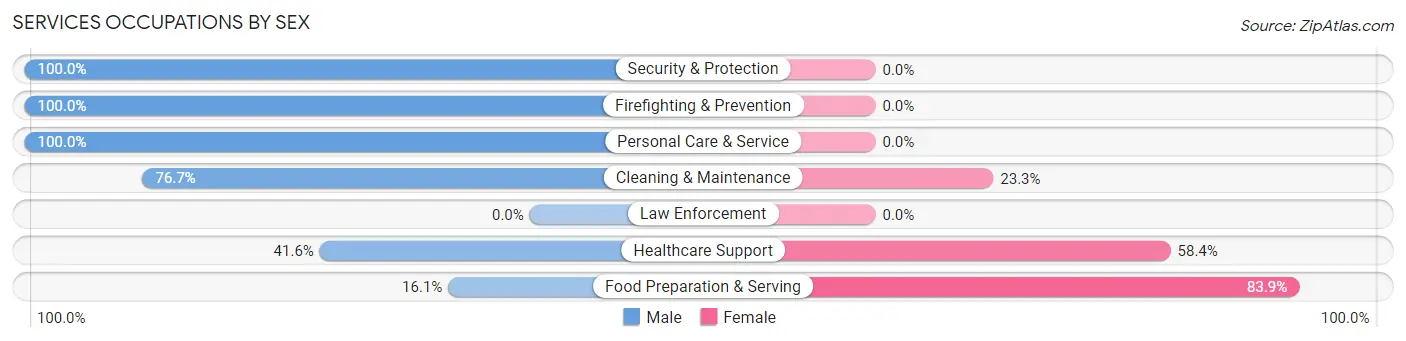
Services Occupations by Sex
Within the Services occupations in Rogersville, the most male-oriented occupations are Security & Protection (100.0%), Firefighting & Prevention (100.0%), and Personal Care & Service (100.0%), while the most female-oriented occupations are Food Preparation & Serving (83.9%), Healthcare Support (58.4%), and Cleaning & Maintenance (23.3%).
| Occupation | Male | Female |
| Healthcare Support | 37 (41.6%) | 52 (58.4%) |
| Security & Protection | 5 (100.0%) | 0 (0.0%) |
| Firefighting & Prevention | 5 (100.0%) | 0 (0.0%) |
| Law Enforcement | 0 (0.0%) | 0 (0.0%) |
| Food Preparation & Serving | 15 (16.1%) | 78 (83.9%) |
| Cleaning & Maintenance | 46 (76.7%) | 14 (23.3%) |
| Personal Care & Service | 12 (100.0%) | 0 (0.0%) |
| Total (Category) | 115 (44.4%) | 144 (55.6%) |
| Total (Overall) | 974 (59.2%) | 672 (40.8%) |
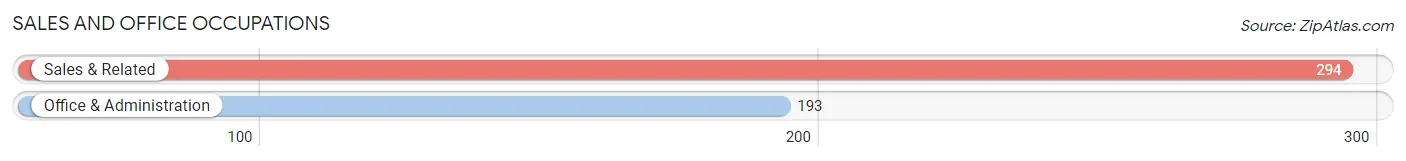
Sales and Office Occupations
The most common Sales and Office occupations in Rogersville are Sales & Related (294 | 17.9%), and Office & Administration (193 | 11.7%).
Sales and Office Occupations by Sex
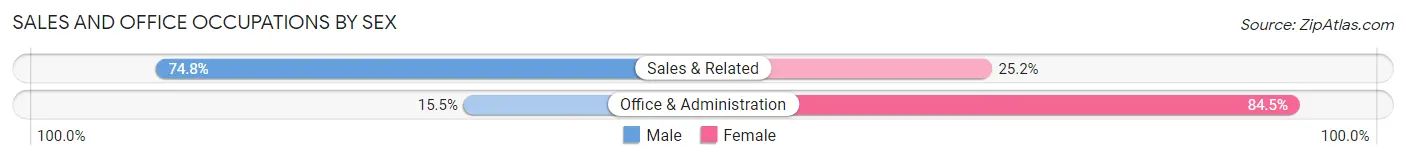
| Occupation | Male | Female |
| Sales & Related | 220 (74.8%) | 74 (25.2%) |
| Office & Administration | 30 (15.5%) | 163 (84.5%) |
| Total (Category) | 250 (51.3%) | 237 (48.7%) |
| Total (Overall) | 974 (59.2%) | 672 (40.8%) |
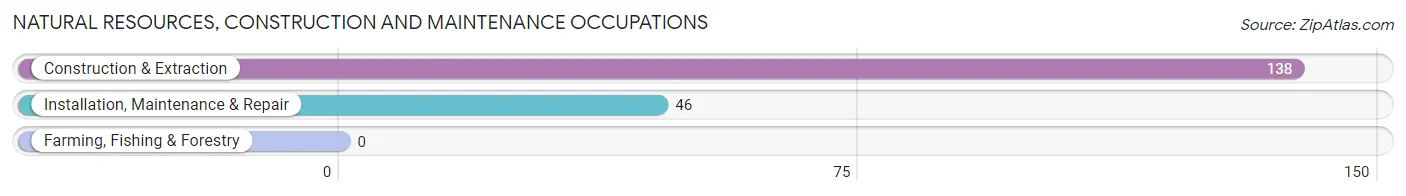
Natural Resources, Construction and Maintenance Occupations
The most common Natural Resources, Construction and Maintenance occupations in Rogersville are Construction & Extraction (138 | 8.4%), and Installation, Maintenance & Repair (46 | 2.8%).
Natural Resources, Construction and Maintenance Occupations by Sex
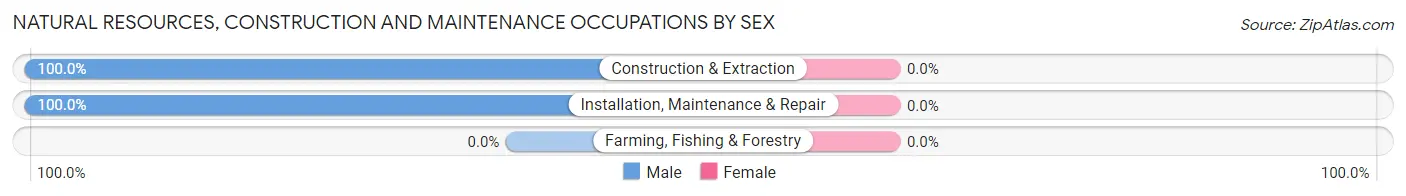
| Occupation | Male | Female |
| Farming, Fishing & Forestry | 0 (0.0%) | 0 (0.0%) |
| Construction & Extraction | 138 (100.0%) | 0 (0.0%) |
| Installation, Maintenance & Repair | 46 (100.0%) | 0 (0.0%) |
| Total (Category) | 184 (100.0%) | 0 (0.0%) |
| Total (Overall) | 974 (59.2%) | 672 (40.8%) |
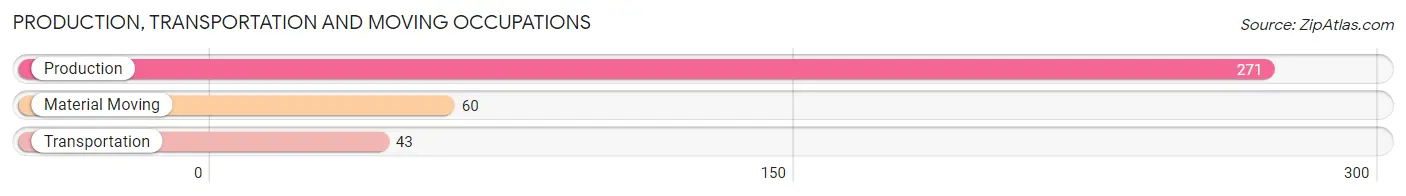
Production, Transportation and Moving Occupations
The most common Production, Transportation and Moving occupations in Rogersville are Production (271 | 16.5%), Material Moving (60 | 3.6%), and Transportation (43 | 2.6%).
Production, Transportation and Moving Occupations by Sex
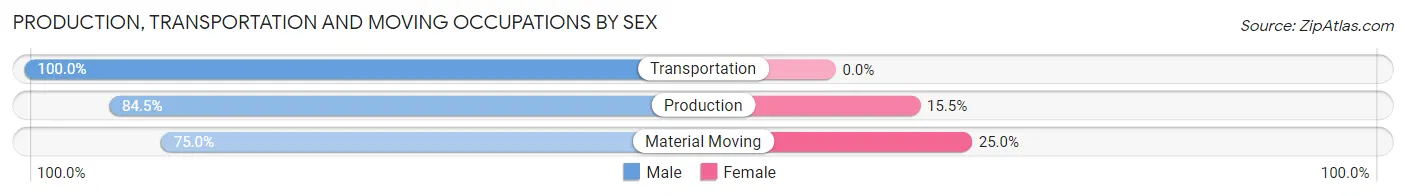
| Occupation | Male | Female |
| Production | 229 (84.5%) | 42 (15.5%) |
| Transportation | 43 (100.0%) | 0 (0.0%) |
| Material Moving | 45 (75.0%) | 15 (25.0%) |
| Total (Category) | 317 (84.8%) | 57 (15.2%) |
| Total (Overall) | 974 (59.2%) | 672 (40.8%) |
Employment Industries by Sex in Rogersville
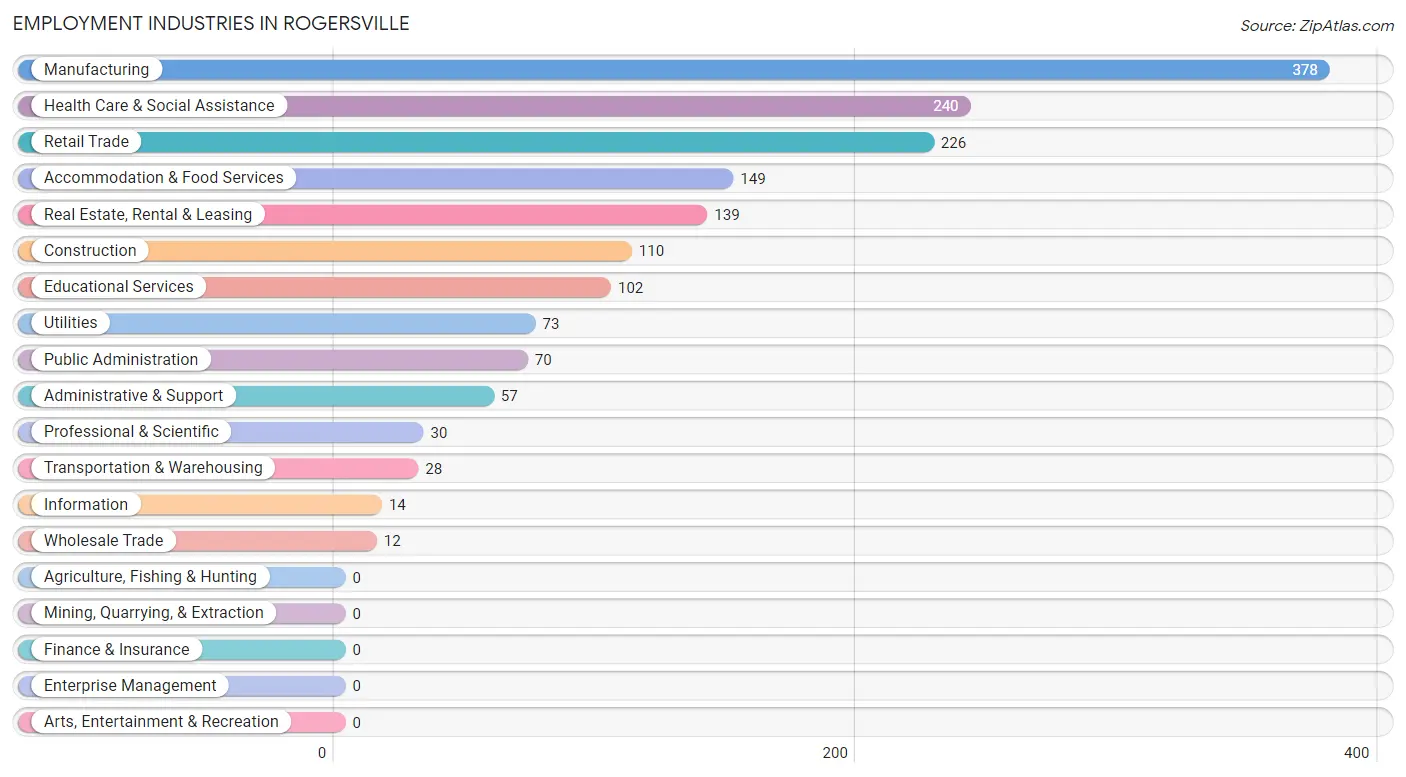
Employment Industries in Rogersville
The major employment industries in Rogersville include Manufacturing (378 | 23.0%), Health Care & Social Assistance (240 | 14.6%), Retail Trade (226 | 13.7%), Accommodation & Food Services (149 | 9.0%), and Real Estate, Rental & Leasing (139 | 8.4%).
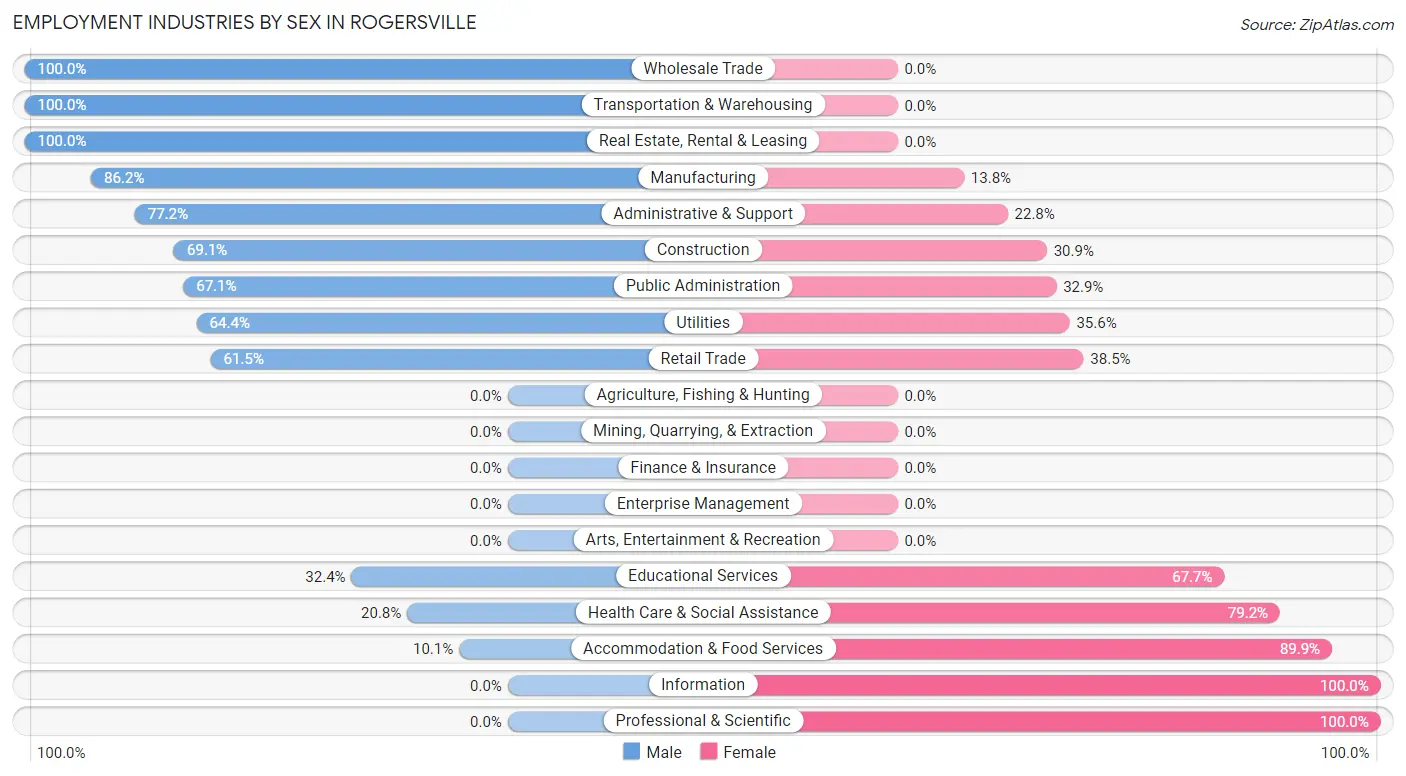
Employment Industries by Sex in Rogersville
The Rogersville industries that see more men than women are Wholesale Trade (100.0%), Transportation & Warehousing (100.0%), and Real Estate, Rental & Leasing (100.0%), whereas the industries that tend to have a higher number of women are Information (100.0%), Professional & Scientific (100.0%), and Accommodation & Food Services (89.9%).
| Industry | Male | Female |
| Agriculture, Fishing & Hunting | 0 (0.0%) | 0 (0.0%) |
| Mining, Quarrying, & Extraction | 0 (0.0%) | 0 (0.0%) |
| Construction | 76 (69.1%) | 34 (30.9%) |
| Manufacturing | 326 (86.2%) | 52 (13.8%) |
| Wholesale Trade | 12 (100.0%) | 0 (0.0%) |
| Retail Trade | 139 (61.5%) | 87 (38.5%) |
| Transportation & Warehousing | 28 (100.0%) | 0 (0.0%) |
| Utilities | 47 (64.4%) | 26 (35.6%) |
| Information | 0 (0.0%) | 14 (100.0%) |
| Finance & Insurance | 0 (0.0%) | 0 (0.0%) |
| Real Estate, Rental & Leasing | 139 (100.0%) | 0 (0.0%) |
| Professional & Scientific | 0 (0.0%) | 30 (100.0%) |
| Enterprise Management | 0 (0.0%) | 0 (0.0%) |
| Administrative & Support | 44 (77.2%) | 13 (22.8%) |
| Educational Services | 33 (32.4%) | 69 (67.6%) |
| Health Care & Social Assistance | 50 (20.8%) | 190 (79.2%) |
| Arts, Entertainment & Recreation | 0 (0.0%) | 0 (0.0%) |
| Accommodation & Food Services | 15 (10.1%) | 134 (89.9%) |
| Public Administration | 47 (67.1%) | 23 (32.9%) |
| Total | 974 (59.2%) | 672 (40.8%) |
Education in Rogersville
School Enrollment in Rogersville
The most common levels of schooling among the 777 students in Rogersville are middle school (264 | 34.0%), high school (157 | 20.2%), and elementary school (135 | 17.4%).
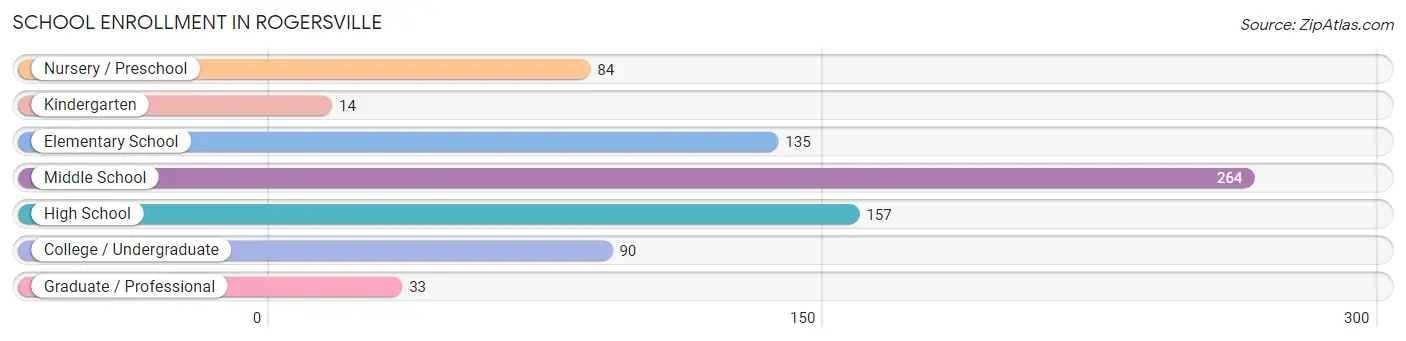
| School Level | # Students | % Students |
| Nursery / Preschool | 84 | 10.8% |
| Kindergarten | 14 | 1.8% |
| Elementary School | 135 | 17.4% |
| Middle School | 264 | 34.0% |
| High School | 157 | 20.2% |
| College / Undergraduate | 90 | 11.6% |
| Graduate / Professional | 33 | 4.3% |
| Total | 777 | 100.0% |
School Enrollment by Age by Funding Source in Rogersville
Out of a total of 777 students who are enrolled in schools in Rogersville, 116 (14.9%) attend a private institution, while the remaining 661 (85.1%) are enrolled in public schools. The age group of 25 to 34 year olds has the highest likelihood of being enrolled in private schools, with 18 (100.0% in the age bracket) enrolled. Conversely, the age group of 15 to 17 year olds has the lowest likelihood of being enrolled in a private school, with 89 (100.0% in the age bracket) attending a public institution.
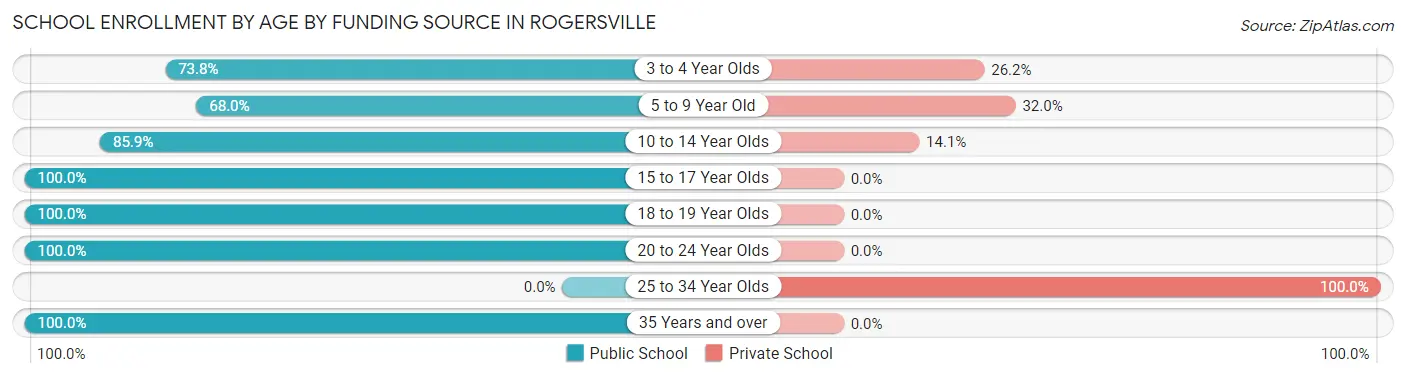
| Age Bracket | Public School | Private School |
| 3 to 4 Year Olds | 62 (73.8%) | 22 (26.2%) |
| 5 to 9 Year Old | 68 (68.0%) | 32 (32.0%) |
| 10 to 14 Year Olds | 269 (85.9%) | 44 (14.1%) |
| 15 to 17 Year Olds | 89 (100.0%) | 0 (0.0%) |
| 18 to 19 Year Olds | 94 (100.0%) | 0 (0.0%) |
| 20 to 24 Year Olds | 29 (100.0%) | 0 (0.0%) |
| 25 to 34 Year Olds | 0 (0.0%) | 18 (100.0%) |
| 35 Years and over | 50 (100.0%) | 0 (0.0%) |
| Total | 661 (85.1%) | 116 (14.9%) |
Educational Attainment by Field of Study in Rogersville
Business (239 | 37.8%), science & technology (164 | 26.0%), education (152 | 24.0%), arts & humanities (41 | 6.5%), and liberal arts & history (16 | 2.5%) are the most common fields of study among 632 individuals in Rogersville who have obtained a bachelor's degree or higher.
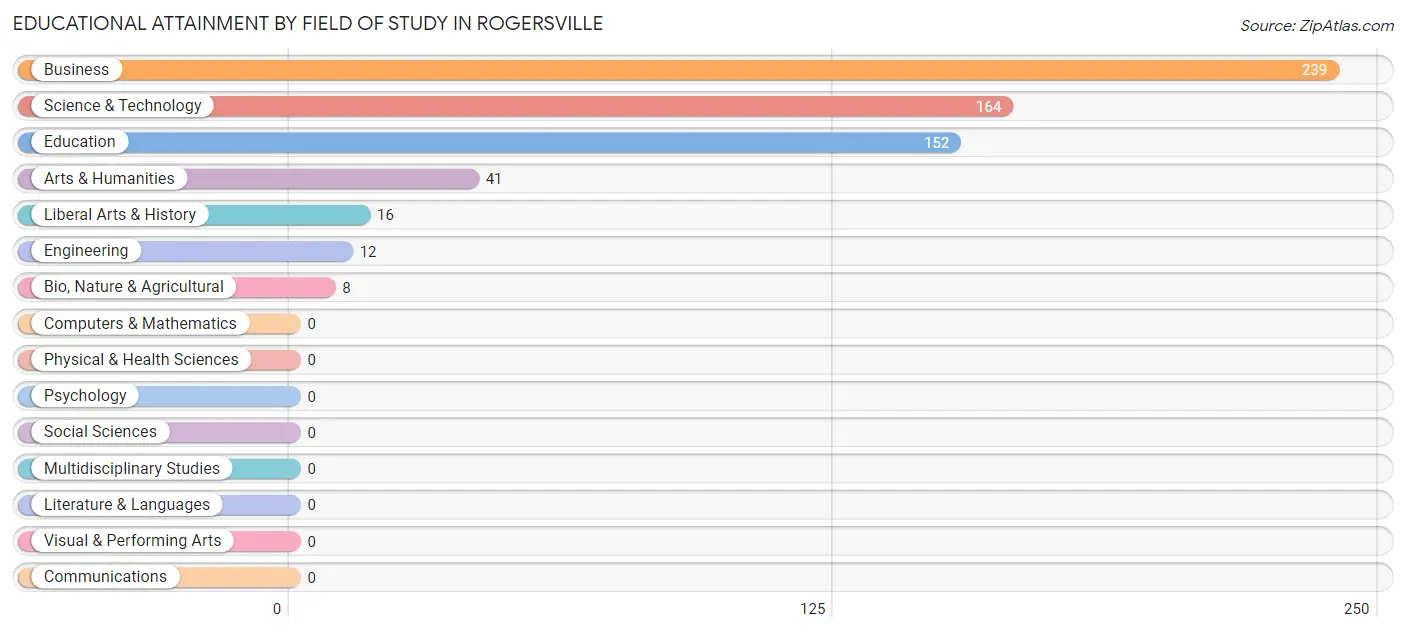
| Field of Study | # Graduates | % Graduates |
| Computers & Mathematics | 0 | 0.0% |
| Bio, Nature & Agricultural | 8 | 1.3% |
| Physical & Health Sciences | 0 | 0.0% |
| Psychology | 0 | 0.0% |
| Social Sciences | 0 | 0.0% |
| Engineering | 12 | 1.9% |
| Multidisciplinary Studies | 0 | 0.0% |
| Science & Technology | 164 | 26.0% |
| Business | 239 | 37.8% |
| Education | 152 | 24.0% |
| Literature & Languages | 0 | 0.0% |
| Liberal Arts & History | 16 | 2.5% |
| Visual & Performing Arts | 0 | 0.0% |
| Communications | 0 | 0.0% |
| Arts & Humanities | 41 | 6.5% |
| Total | 632 | 100.0% |
Transportation & Commute in Rogersville
Vehicle Availability by Sex in Rogersville
The most prevalent vehicle ownership categories in Rogersville are males with 2 vehicles (424, accounting for 43.5%) and females with 2 vehicles (337, making up 64.5%).
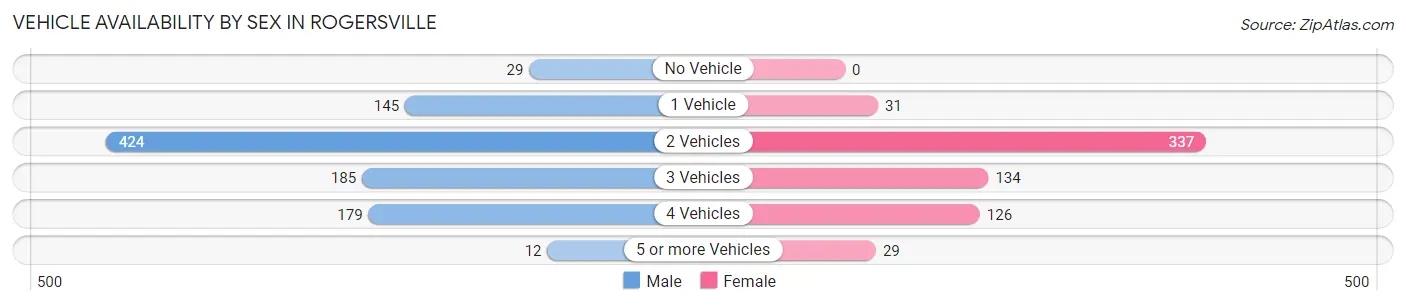
| Vehicles Available | Male | Female |
| No Vehicle | 29 (3.0%) | 0 (0.0%) |
| 1 Vehicle | 145 (14.9%) | 31 (4.7%) |
| 2 Vehicles | 424 (43.5%) | 337 (51.3%) |
| 3 Vehicles | 185 (19.0%) | 134 (20.4%) |
| 4 Vehicles | 179 (18.4%) | 126 (19.2%) |
| 5 or more Vehicles | 12 (1.2%) | 29 (4.4%) |
| Total | 974 (100.0%) | 657 (100.0%) |
Commute Time in Rogersville
The most frequently occuring commute durations in Rogersville are 5 to 9 minutes (450 commuters, 28.7%), 60 to 89 minutes (261 commuters, 16.7%), and 10 to 14 minutes (204 commuters, 13.0%).
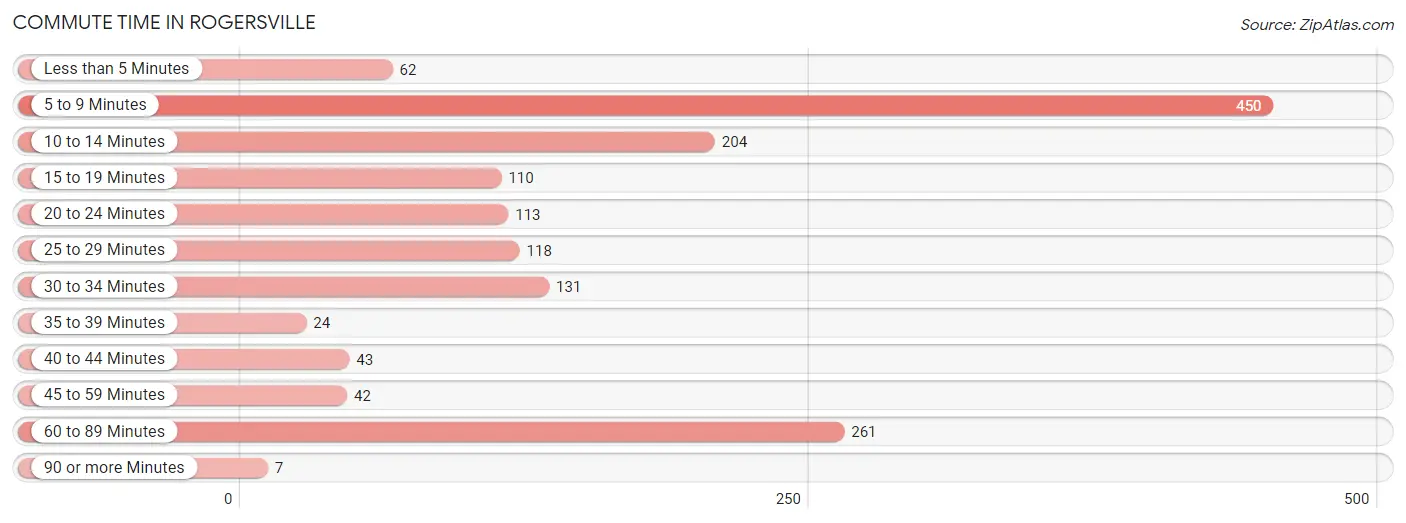
| Commute Time | # Commuters | % Commuters |
| Less than 5 Minutes | 62 | 4.0% |
| 5 to 9 Minutes | 450 | 28.7% |
| 10 to 14 Minutes | 204 | 13.0% |
| 15 to 19 Minutes | 110 | 7.0% |
| 20 to 24 Minutes | 113 | 7.2% |
| 25 to 29 Minutes | 118 | 7.5% |
| 30 to 34 Minutes | 131 | 8.4% |
| 35 to 39 Minutes | 24 | 1.5% |
| 40 to 44 Minutes | 43 | 2.8% |
| 45 to 59 Minutes | 42 | 2.7% |
| 60 to 89 Minutes | 261 | 16.7% |
| 90 or more Minutes | 7 | 0.4% |
Commute Time by Sex in Rogersville
The most common commute times in Rogersville are 5 to 9 minutes (197 commuters, 21.4%) for males and 5 to 9 minutes (253 commuters, 39.2%) for females.
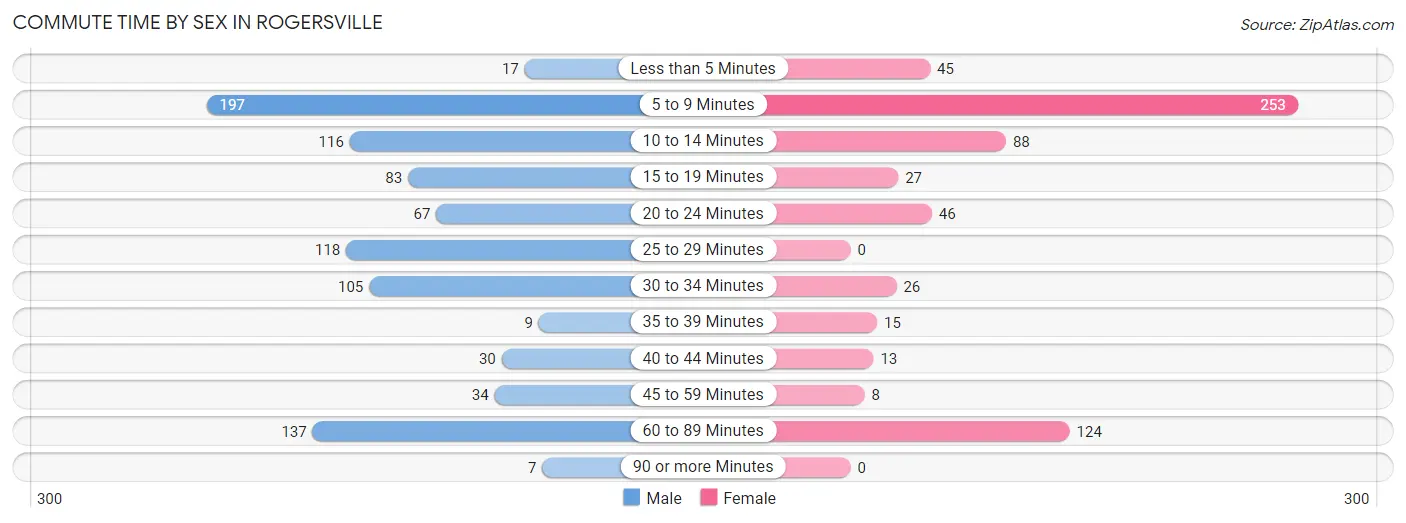
| Commute Time | Male | Female |
| Less than 5 Minutes | 17 (1.8%) | 45 (7.0%) |
| 5 to 9 Minutes | 197 (21.4%) | 253 (39.2%) |
| 10 to 14 Minutes | 116 (12.6%) | 88 (13.6%) |
| 15 to 19 Minutes | 83 (9.0%) | 27 (4.2%) |
| 20 to 24 Minutes | 67 (7.3%) | 46 (7.1%) |
| 25 to 29 Minutes | 118 (12.8%) | 0 (0.0%) |
| 30 to 34 Minutes | 105 (11.4%) | 26 (4.0%) |
| 35 to 39 Minutes | 9 (1.0%) | 15 (2.3%) |
| 40 to 44 Minutes | 30 (3.3%) | 13 (2.0%) |
| 45 to 59 Minutes | 34 (3.7%) | 8 (1.2%) |
| 60 to 89 Minutes | 137 (14.9%) | 124 (19.2%) |
| 90 or more Minutes | 7 (0.8%) | 0 (0.0%) |
Time of Departure to Work by Sex in Rogersville
The most frequent times of departure to work in Rogersville are 8:00 AM to 8:29 AM (214, 23.3%) for males and 6:00 AM to 6:29 AM (162, 25.1%) for females.
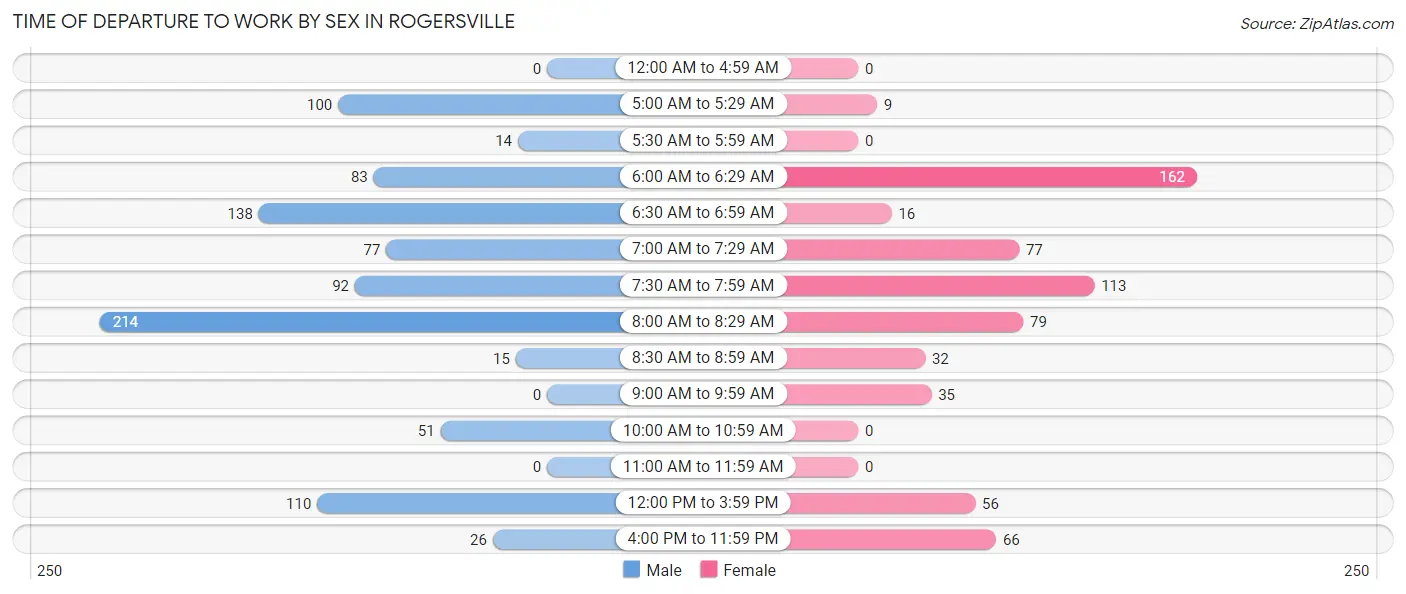
| Time of Departure | Male | Female |
| 12:00 AM to 4:59 AM | 0 (0.0%) | 0 (0.0%) |
| 5:00 AM to 5:29 AM | 100 (10.9%) | 9 (1.4%) |
| 5:30 AM to 5:59 AM | 14 (1.5%) | 0 (0.0%) |
| 6:00 AM to 6:29 AM | 83 (9.0%) | 162 (25.1%) |
| 6:30 AM to 6:59 AM | 138 (15.0%) | 16 (2.5%) |
| 7:00 AM to 7:29 AM | 77 (8.4%) | 77 (11.9%) |
| 7:30 AM to 7:59 AM | 92 (10.0%) | 113 (17.5%) |
| 8:00 AM to 8:29 AM | 214 (23.3%) | 79 (12.2%) |
| 8:30 AM to 8:59 AM | 15 (1.6%) | 32 (5.0%) |
| 9:00 AM to 9:59 AM | 0 (0.0%) | 35 (5.4%) |
| 10:00 AM to 10:59 AM | 51 (5.5%) | 0 (0.0%) |
| 11:00 AM to 11:59 AM | 0 (0.0%) | 0 (0.0%) |
| 12:00 PM to 3:59 PM | 110 (12.0%) | 56 (8.7%) |
| 4:00 PM to 11:59 PM | 26 (2.8%) | 66 (10.2%) |
| Total | 920 (100.0%) | 645 (100.0%) |
Housing Occupancy in Rogersville
Occupancy by Ownership in Rogersville
Of the total 1,784 dwellings in Rogersville, owner-occupied units account for 880 (49.3%), while renter-occupied units make up 904 (50.7%).
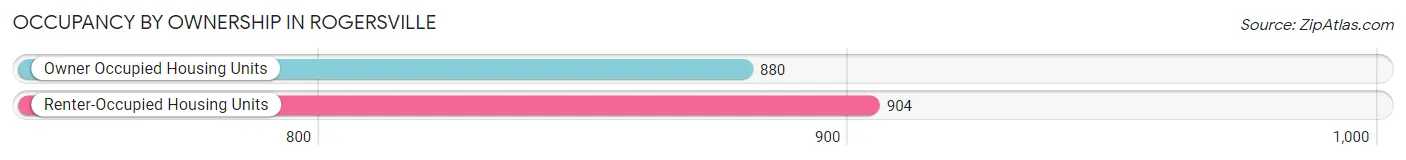
| Occupancy | # Housing Units | % Housing Units |
| Owner Occupied Housing Units | 880 | 49.3% |
| Renter-Occupied Housing Units | 904 | 50.7% |
| Total Occupied Housing Units | 1,784 | 100.0% |
Occupancy by Household Size in Rogersville
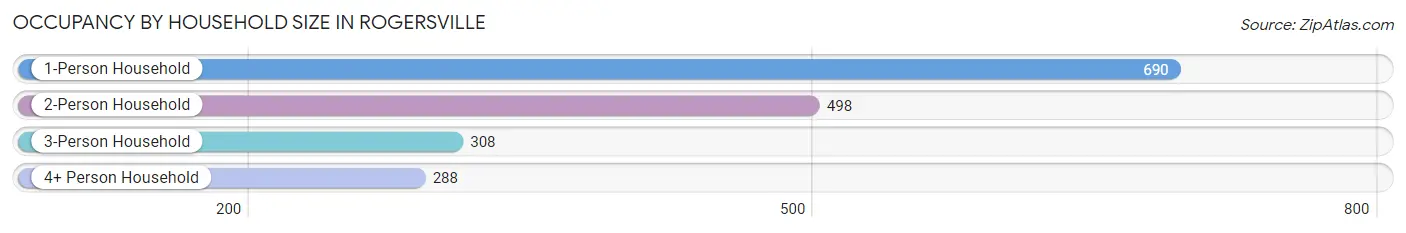
| Household Size | # Housing Units | % Housing Units |
| 1-Person Household | 690 | 38.7% |
| 2-Person Household | 498 | 27.9% |
| 3-Person Household | 308 | 17.3% |
| 4+ Person Household | 288 | 16.1% |
| Total Housing Units | 1,784 | 100.0% |
Occupancy by Ownership by Household Size in Rogersville
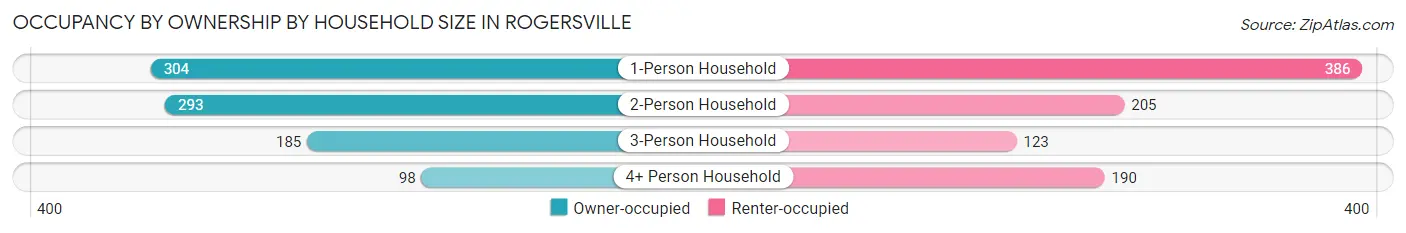
| Household Size | Owner-occupied | Renter-occupied |
| 1-Person Household | 304 (44.1%) | 386 (55.9%) |
| 2-Person Household | 293 (58.8%) | 205 (41.2%) |
| 3-Person Household | 185 (60.1%) | 123 (39.9%) |
| 4+ Person Household | 98 (34.0%) | 190 (66.0%) |
| Total Housing Units | 880 (49.3%) | 904 (50.7%) |
Occupancy by Educational Attainment in Rogersville
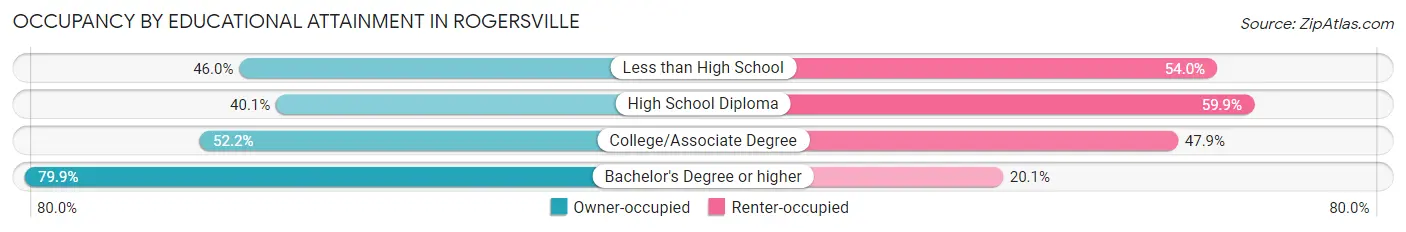
| Household Size | Owner-occupied | Renter-occupied |
| Less than High School | 108 (46.0%) | 127 (54.0%) |
| High School Diploma | 359 (40.1%) | 536 (59.9%) |
| College/Associate Degree | 206 (52.1%) | 189 (47.8%) |
| Bachelor's Degree or higher | 207 (79.9%) | 52 (20.1%) |
Occupancy by Age of Householder in Rogersville
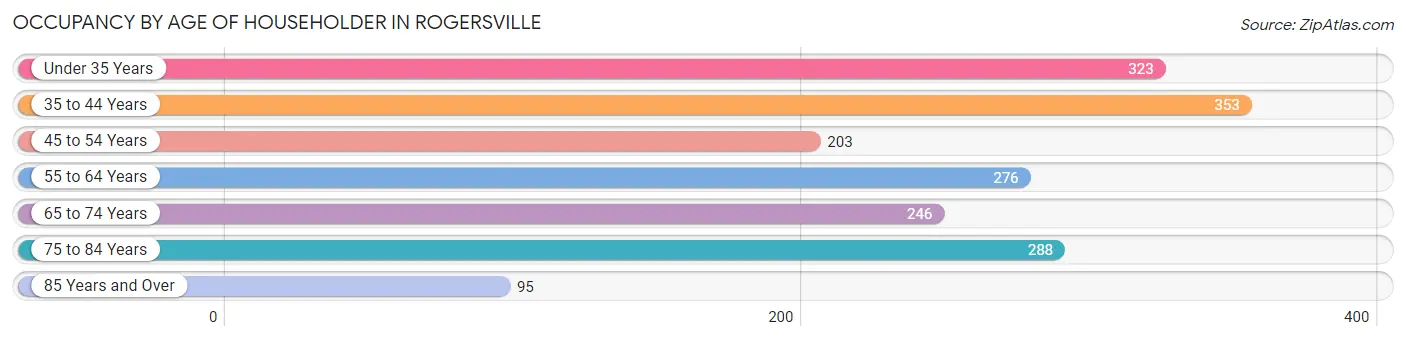
| Age Bracket | # Households | % Households |
| Under 35 Years | 323 | 18.1% |
| 35 to 44 Years | 353 | 19.8% |
| 45 to 54 Years | 203 | 11.4% |
| 55 to 64 Years | 276 | 15.5% |
| 65 to 74 Years | 246 | 13.8% |
| 75 to 84 Years | 288 | 16.1% |
| 85 Years and Over | 95 | 5.3% |
| Total | 1,784 | 100.0% |
Housing Finances in Rogersville
Median Income by Occupancy in Rogersville
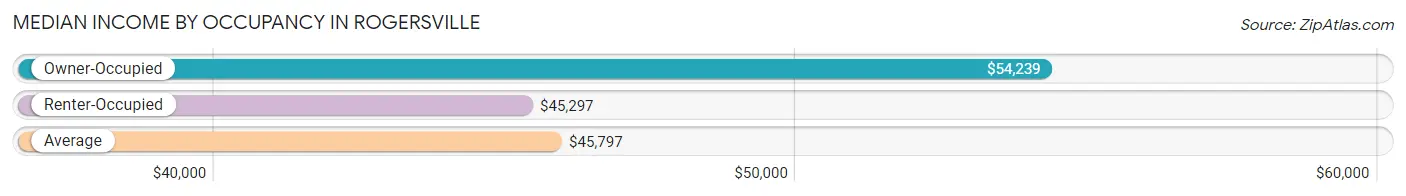
| Occupancy Type | # Households | Median Income |
| Owner-Occupied | 880 (49.3%) | $54,239 |
| Renter-Occupied | 904 (50.7%) | $45,297 |
| Average | 1,784 (100.0%) | $45,797 |
Occupancy by Householder Income Bracket in Rogersville
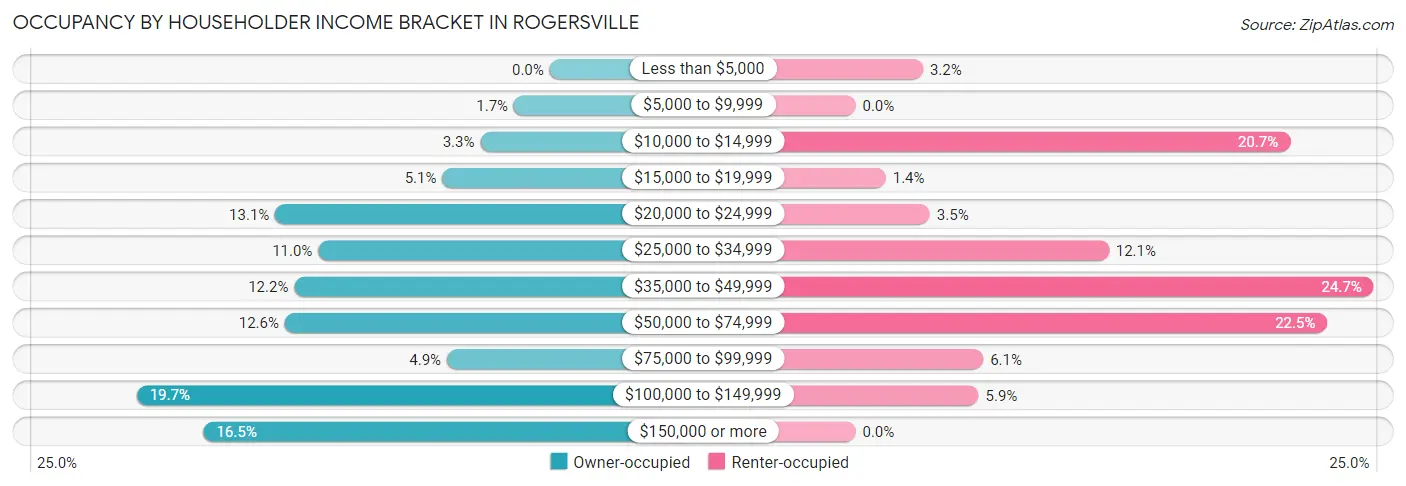
| Income Bracket | Owner-occupied | Renter-occupied |
| Less than $5,000 | 0 (0.0%) | 29 (3.2%) |
| $5,000 to $9,999 | 15 (1.7%) | 0 (0.0%) |
| $10,000 to $14,999 | 29 (3.3%) | 187 (20.7%) |
| $15,000 to $19,999 | 45 (5.1%) | 13 (1.4%) |
| $20,000 to $24,999 | 115 (13.1%) | 32 (3.5%) |
| $25,000 to $34,999 | 97 (11.0%) | 109 (12.1%) |
| $35,000 to $49,999 | 107 (12.2%) | 223 (24.7%) |
| $50,000 to $74,999 | 111 (12.6%) | 203 (22.5%) |
| $75,000 to $99,999 | 43 (4.9%) | 55 (6.1%) |
| $100,000 to $149,999 | 173 (19.7%) | 53 (5.9%) |
| $150,000 or more | 145 (16.5%) | 0 (0.0%) |
| Total | 880 (100.0%) | 904 (100.0%) |
Monthly Housing Cost Tiers in Rogersville
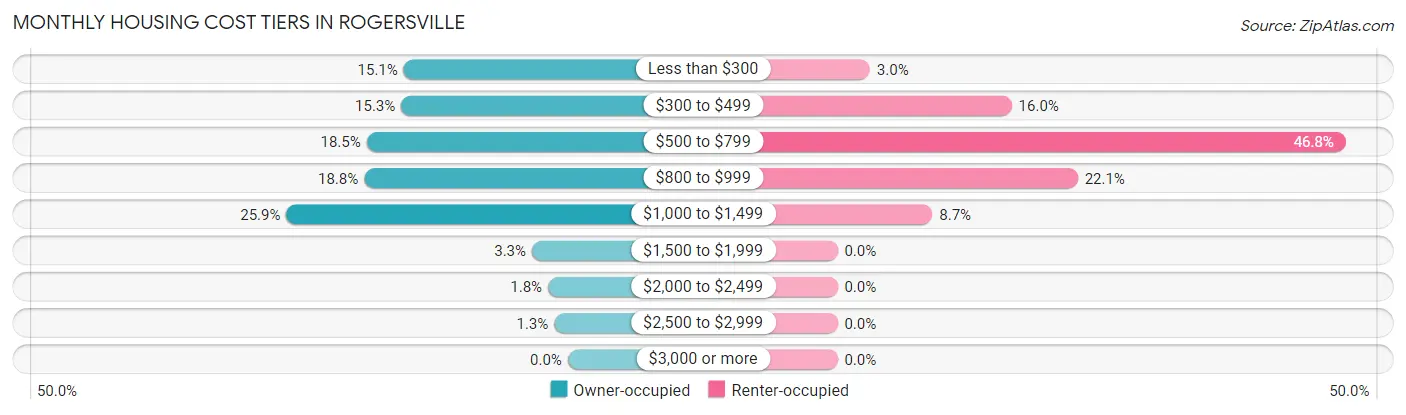
| Monthly Cost | Owner-occupied | Renter-occupied |
| Less than $300 | 133 (15.1%) | 27 (3.0%) |
| $300 to $499 | 135 (15.3%) | 145 (16.0%) |
| $500 to $799 | 163 (18.5%) | 423 (46.8%) |
| $800 to $999 | 165 (18.8%) | 200 (22.1%) |
| $1,000 to $1,499 | 228 (25.9%) | 79 (8.7%) |
| $1,500 to $1,999 | 29 (3.3%) | 0 (0.0%) |
| $2,000 to $2,499 | 16 (1.8%) | 0 (0.0%) |
| $2,500 to $2,999 | 11 (1.3%) | 0 (0.0%) |
| $3,000 or more | 0 (0.0%) | 0 (0.0%) |
| Total | 880 (100.0%) | 904 (100.0%) |
Physical Housing Characteristics in Rogersville
Housing Structures in Rogersville
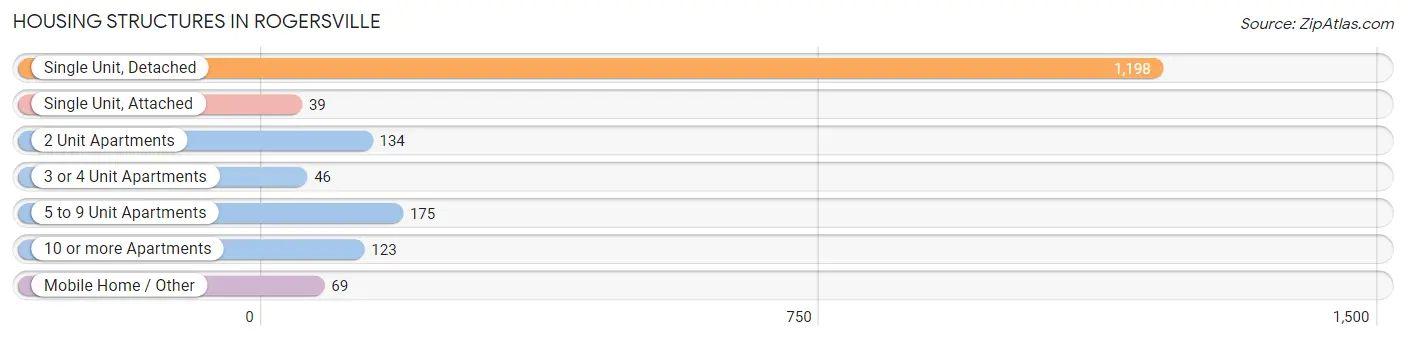
| Structure Type | # Housing Units | % Housing Units |
| Single Unit, Detached | 1,198 | 67.1% |
| Single Unit, Attached | 39 | 2.2% |
| 2 Unit Apartments | 134 | 7.5% |
| 3 or 4 Unit Apartments | 46 | 2.6% |
| 5 to 9 Unit Apartments | 175 | 9.8% |
| 10 or more Apartments | 123 | 6.9% |
| Mobile Home / Other | 69 | 3.9% |
| Total | 1,784 | 100.0% |
Housing Structures by Occupancy in Rogersville
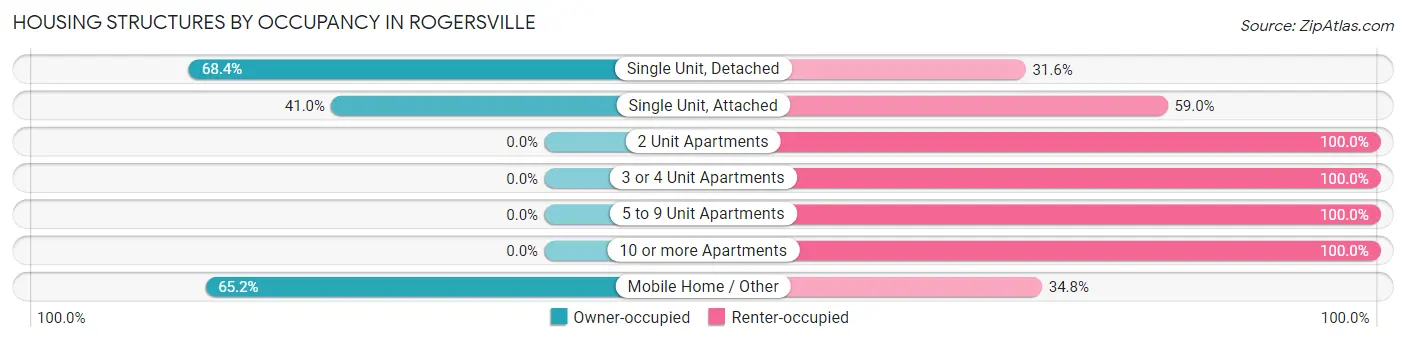
| Structure Type | Owner-occupied | Renter-occupied |
| Single Unit, Detached | 819 (68.4%) | 379 (31.6%) |
| Single Unit, Attached | 16 (41.0%) | 23 (59.0%) |
| 2 Unit Apartments | 0 (0.0%) | 134 (100.0%) |
| 3 or 4 Unit Apartments | 0 (0.0%) | 46 (100.0%) |
| 5 to 9 Unit Apartments | 0 (0.0%) | 175 (100.0%) |
| 10 or more Apartments | 0 (0.0%) | 123 (100.0%) |
| Mobile Home / Other | 45 (65.2%) | 24 (34.8%) |
| Total | 880 (49.3%) | 904 (50.7%) |
Housing Structures by Number of Rooms in Rogersville
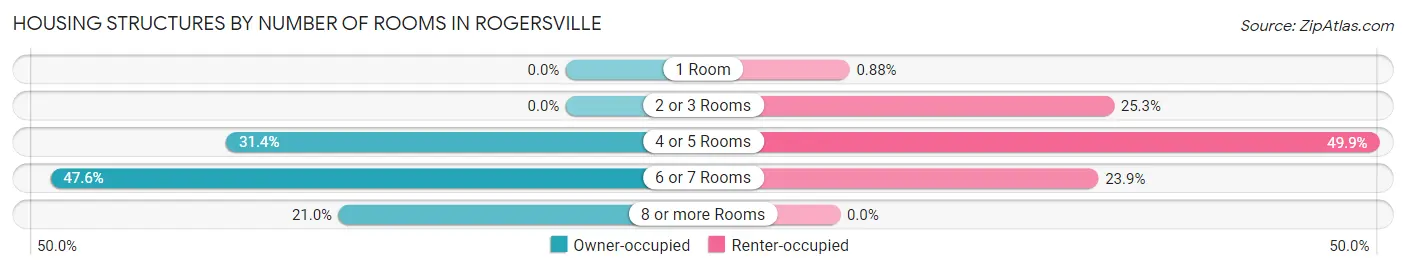
| Number of Rooms | Owner-occupied | Renter-occupied |
| 1 Room | 0 (0.0%) | 8 (0.9%) |
| 2 or 3 Rooms | 0 (0.0%) | 229 (25.3%) |
| 4 or 5 Rooms | 276 (31.4%) | 451 (49.9%) |
| 6 or 7 Rooms | 419 (47.6%) | 216 (23.9%) |
| 8 or more Rooms | 185 (21.0%) | 0 (0.0%) |
| Total | 880 (100.0%) | 904 (100.0%) |
Housing Structure by Heating Type in Rogersville
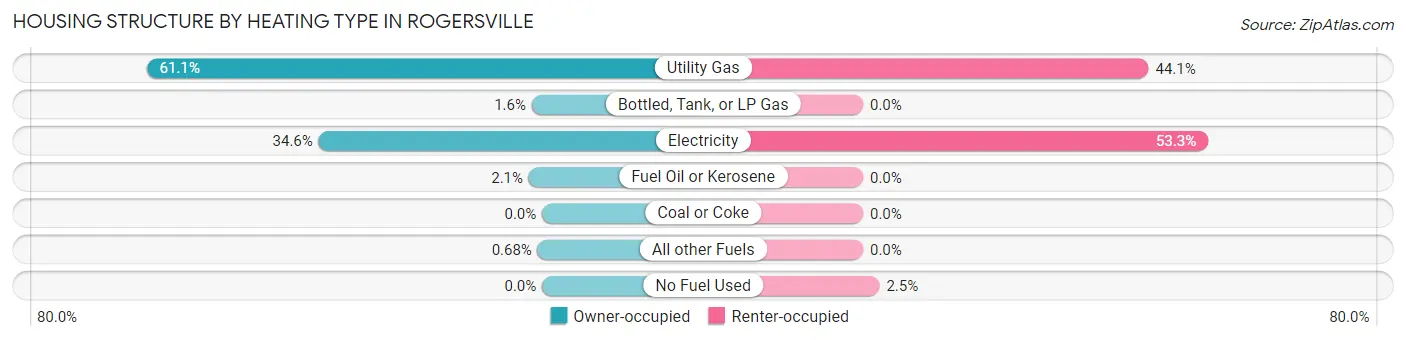
| Heating Type | Owner-occupied | Renter-occupied |
| Utility Gas | 538 (61.1%) | 399 (44.1%) |
| Bottled, Tank, or LP Gas | 14 (1.6%) | 0 (0.0%) |
| Electricity | 304 (34.5%) | 482 (53.3%) |
| Fuel Oil or Kerosene | 18 (2.1%) | 0 (0.0%) |
| Coal or Coke | 0 (0.0%) | 0 (0.0%) |
| All other Fuels | 6 (0.7%) | 0 (0.0%) |
| No Fuel Used | 0 (0.0%) | 23 (2.5%) |
| Total | 880 (100.0%) | 904 (100.0%) |
Household Vehicle Usage in Rogersville
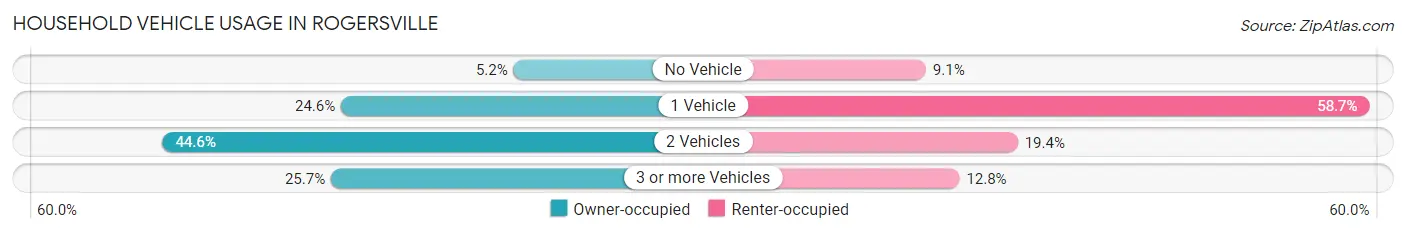
| Vehicles per Household | Owner-occupied | Renter-occupied |
| No Vehicle | 46 (5.2%) | 82 (9.1%) |
| 1 Vehicle | 216 (24.5%) | 531 (58.7%) |
| 2 Vehicles | 392 (44.6%) | 175 (19.4%) |
| 3 or more Vehicles | 226 (25.7%) | 116 (12.8%) |
| Total | 880 (100.0%) | 904 (100.0%) |
Real Estate & Mortgages in Rogersville
Real Estate and Mortgage Overview in Rogersville
| Characteristic | Without Mortgage | With Mortgage |
| Housing Units | 426 | 454 |
| Median Property Value | $148,200 | $200,700 |
| Median Household Income | $41,618 | $93 |
| Monthly Housing Costs | $421 | $0 |
| Real Estate Taxes | $1,346 | $0 |
Property Value by Mortgage Status in Rogersville
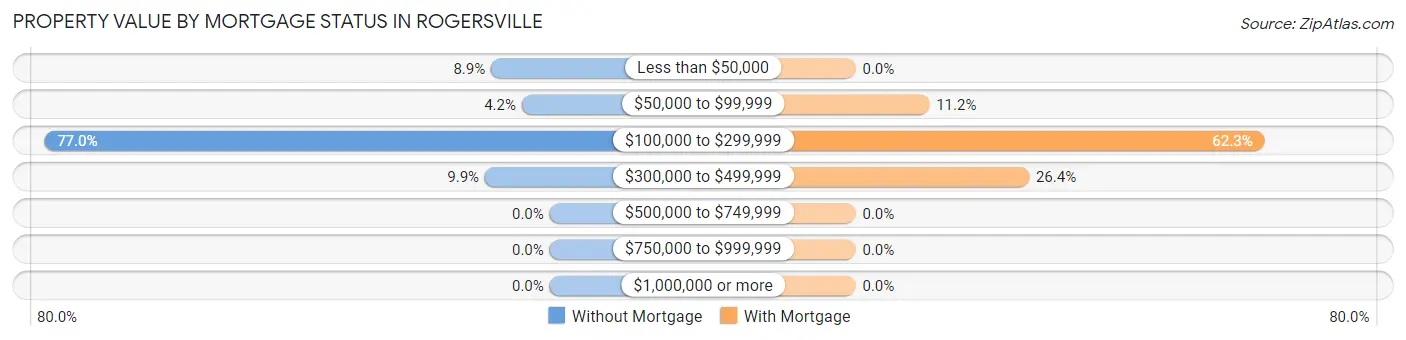
| Property Value | Without Mortgage | With Mortgage |
| Less than $50,000 | 38 (8.9%) | 0 (0.0%) |
| $50,000 to $99,999 | 18 (4.2%) | 51 (11.2%) |
| $100,000 to $299,999 | 328 (77.0%) | 283 (62.3%) |
| $300,000 to $499,999 | 42 (9.9%) | 120 (26.4%) |
| $500,000 to $749,999 | 0 (0.0%) | 0 (0.0%) |
| $750,000 to $999,999 | 0 (0.0%) | 0 (0.0%) |
| $1,000,000 or more | 0 (0.0%) | 0 (0.0%) |
| Total | 426 (100.0%) | 454 (100.0%) |
Household Income by Mortgage Status in Rogersville
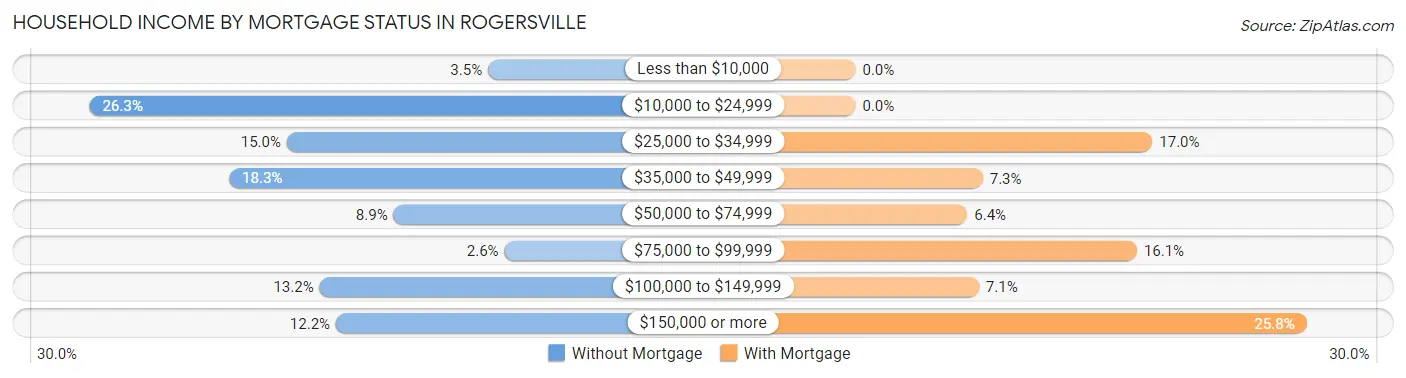
| Household Income | Without Mortgage | With Mortgage |
| Less than $10,000 | 15 (3.5%) | 0 (0.0%) |
| $10,000 to $24,999 | 112 (26.3%) | 0 (0.0%) |
| $25,000 to $34,999 | 64 (15.0%) | 77 (17.0%) |
| $35,000 to $49,999 | 78 (18.3%) | 33 (7.3%) |
| $50,000 to $74,999 | 38 (8.9%) | 29 (6.4%) |
| $75,000 to $99,999 | 11 (2.6%) | 73 (16.1%) |
| $100,000 to $149,999 | 56 (13.2%) | 32 (7.0%) |
| $150,000 or more | 52 (12.2%) | 117 (25.8%) |
| Total | 426 (100.0%) | 454 (100.0%) |
Property Value to Household Income Ratio in Rogersville
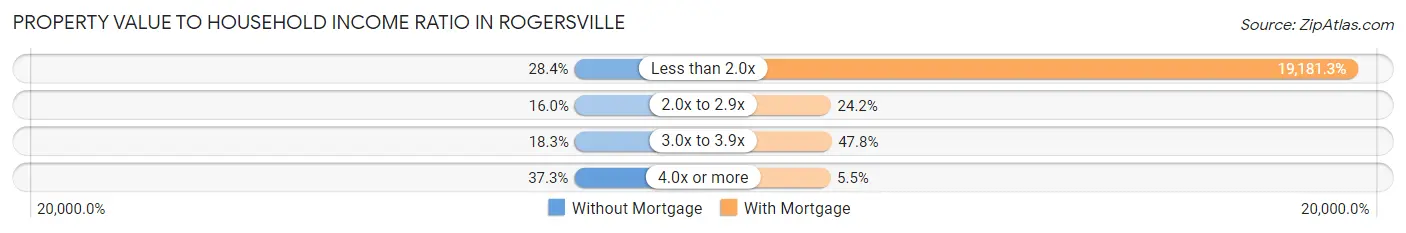
| Value-to-Income Ratio | Without Mortgage | With Mortgage |
| Less than 2.0x | 121 (28.4%) | 87,083 (19,181.3%) |
| 2.0x to 2.9x | 68 (16.0%) | 110 (24.2%) |
| 3.0x to 3.9x | 78 (18.3%) | 217 (47.8%) |
| 4.0x or more | 159 (37.3%) | 25 (5.5%) |
| Total | 426 (100.0%) | 454 (100.0%) |
Real Estate Taxes by Mortgage Status in Rogersville
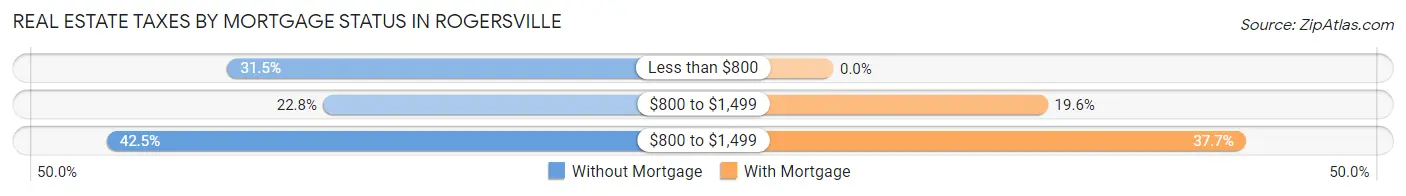
| Property Taxes | Without Mortgage | With Mortgage |
| Less than $800 | 134 (31.5%) | 0 (0.0%) |
| $800 to $1,499 | 97 (22.8%) | 89 (19.6%) |
| $800 to $1,499 | 181 (42.5%) | 171 (37.7%) |
| Total | 426 (100.0%) | 454 (100.0%) |
Health & Disability in Rogersville
Health Insurance Coverage by Age in Rogersville
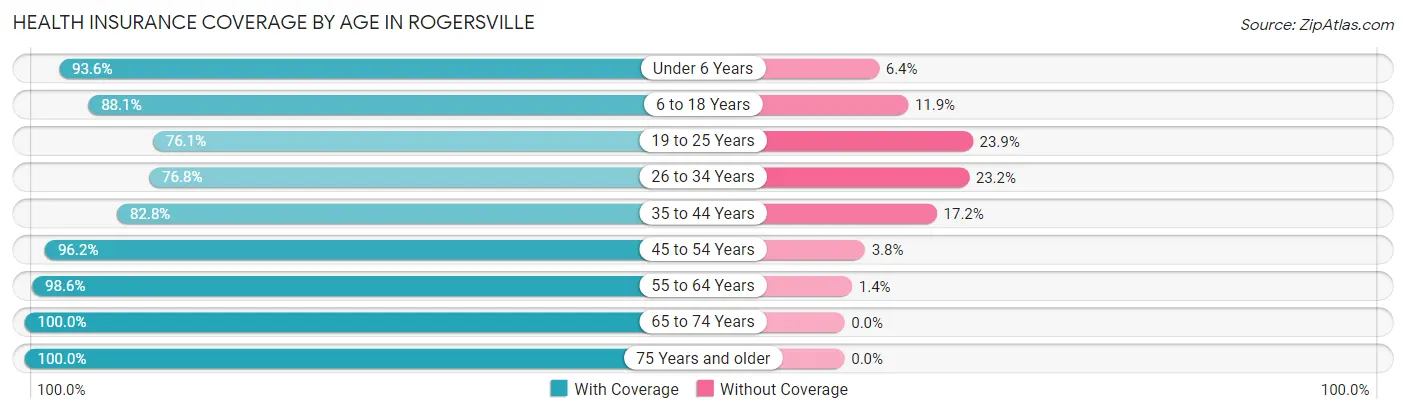
| Age Bracket | With Coverage | Without Coverage |
| Under 6 Years | 320 (93.6%) | 22 (6.4%) |
| 6 to 18 Years | 490 (88.1%) | 66 (11.9%) |
| 19 to 25 Years | 471 (76.1%) | 148 (23.9%) |
| 26 to 34 Years | 182 (76.8%) | 55 (23.2%) |
| 35 to 44 Years | 577 (82.8%) | 120 (17.2%) |
| 45 to 54 Years | 353 (96.2%) | 14 (3.8%) |
| 55 to 64 Years | 419 (98.6%) | 6 (1.4%) |
| 65 to 74 Years | 422 (100.0%) | 0 (0.0%) |
| 75 Years and older | 581 (100.0%) | 0 (0.0%) |
| Total | 3,815 (89.8%) | 431 (10.2%) |
Health Insurance Coverage by Citizenship Status in Rogersville
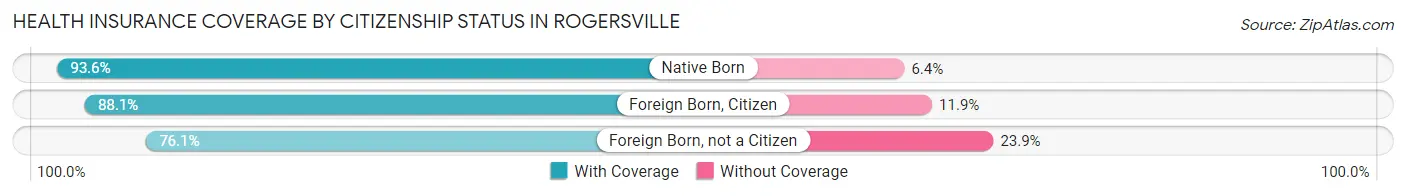
| Citizenship Status | With Coverage | Without Coverage |
| Native Born | 320 (93.6%) | 22 (6.4%) |
| Foreign Born, Citizen | 490 (88.1%) | 66 (11.9%) |
| Foreign Born, not a Citizen | 471 (76.1%) | 148 (23.9%) |
Health Insurance Coverage by Household Income in Rogersville
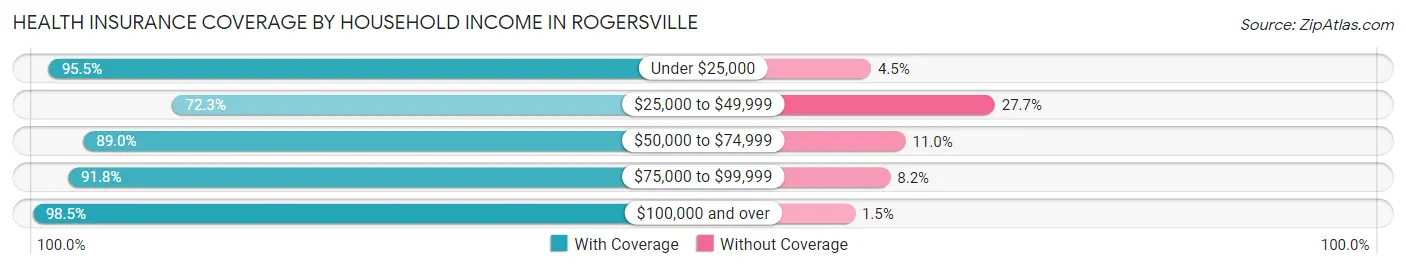
| Household Income | With Coverage | Without Coverage |
| Under $25,000 | 864 (95.5%) | 41 (4.5%) |
| $25,000 to $49,999 | 649 (72.3%) | 249 (27.7%) |
| $50,000 to $74,999 | 760 (89.0%) | 94 (11.0%) |
| $75,000 to $99,999 | 315 (91.8%) | 28 (8.2%) |
| $100,000 and over | 1,223 (98.5%) | 19 (1.5%) |
Public vs Private Health Insurance Coverage by Age in Rogersville
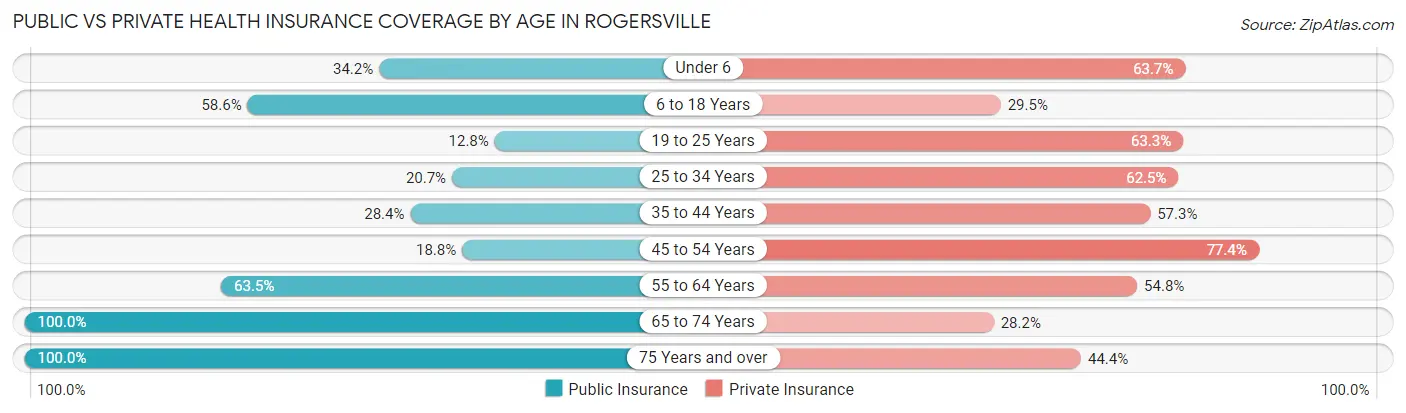
| Age Bracket | Public Insurance | Private Insurance |
| Under 6 | 117 (34.2%) | 218 (63.7%) |
| 6 to 18 Years | 326 (58.6%) | 164 (29.5%) |
| 19 to 25 Years | 79 (12.8%) | 392 (63.3%) |
| 25 to 34 Years | 49 (20.7%) | 148 (62.5%) |
| 35 to 44 Years | 198 (28.4%) | 399 (57.3%) |
| 45 to 54 Years | 69 (18.8%) | 284 (77.4%) |
| 55 to 64 Years | 270 (63.5%) | 233 (54.8%) |
| 65 to 74 Years | 422 (100.0%) | 119 (28.2%) |
| 75 Years and over | 581 (100.0%) | 258 (44.4%) |
| Total | 2,111 (49.7%) | 2,215 (52.2%) |
Disability Status by Sex by Age in Rogersville
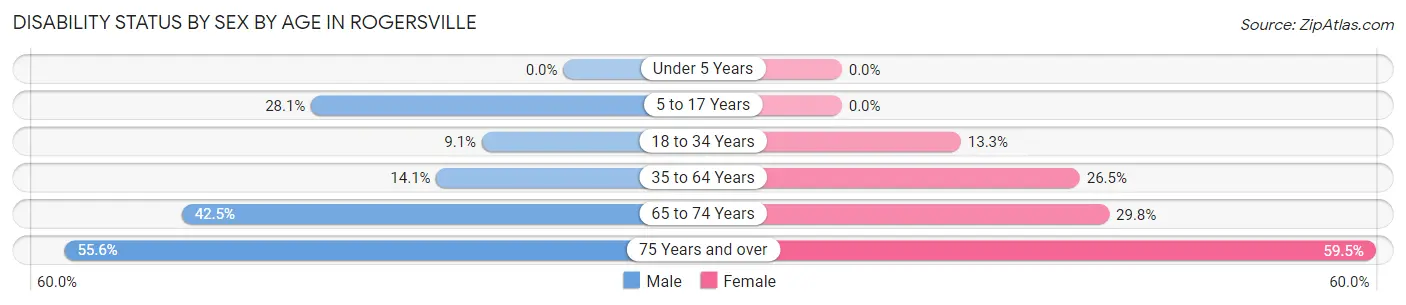
| Age Bracket | Male | Female |
| Under 5 Years | 0 (0.0%) | 0 (0.0%) |
| 5 to 17 Years | 73 (28.1%) | 0 (0.0%) |
| 18 to 34 Years | 51 (9.1%) | 48 (13.3%) |
| 35 to 64 Years | 98 (14.1%) | 211 (26.5%) |
| 65 to 74 Years | 68 (42.5%) | 78 (29.8%) |
| 75 Years and over | 120 (55.6%) | 217 (59.5%) |
Disability Class by Sex by Age in Rogersville
Disability Class: Hearing Difficulty
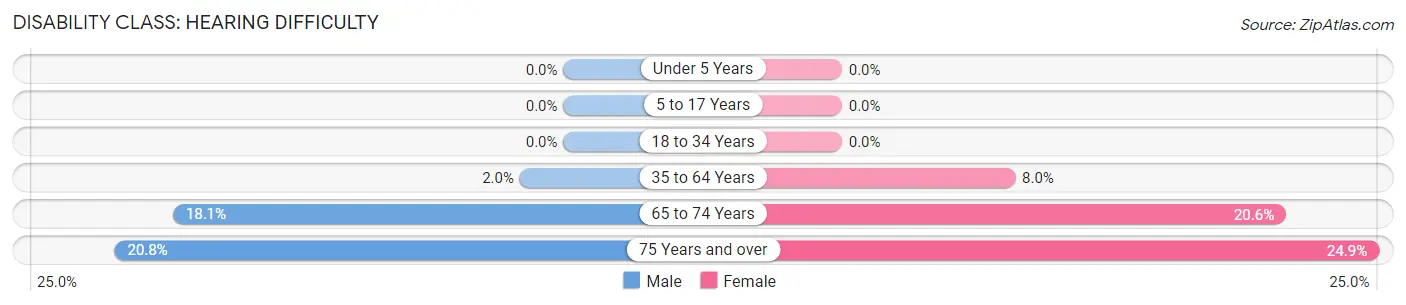
| Age Bracket | Male | Female |
| Under 5 Years | 0 (0.0%) | 0 (0.0%) |
| 5 to 17 Years | 0 (0.0%) | 0 (0.0%) |
| 18 to 34 Years | 0 (0.0%) | 0 (0.0%) |
| 35 to 64 Years | 14 (2.0%) | 64 (8.0%) |
| 65 to 74 Years | 29 (18.1%) | 54 (20.6%) |
| 75 Years and over | 45 (20.8%) | 91 (24.9%) |
Disability Class: Vision Difficulty
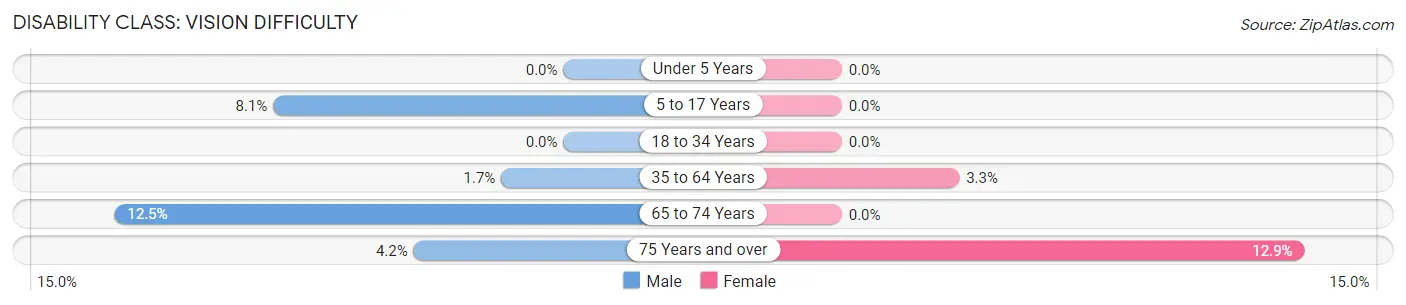
| Age Bracket | Male | Female |
| Under 5 Years | 0 (0.0%) | 0 (0.0%) |
| 5 to 17 Years | 21 (8.1%) | 0 (0.0%) |
| 18 to 34 Years | 0 (0.0%) | 0 (0.0%) |
| 35 to 64 Years | 12 (1.7%) | 26 (3.3%) |
| 65 to 74 Years | 20 (12.5%) | 0 (0.0%) |
| 75 Years and over | 9 (4.2%) | 47 (12.9%) |
Disability Class: Cognitive Difficulty
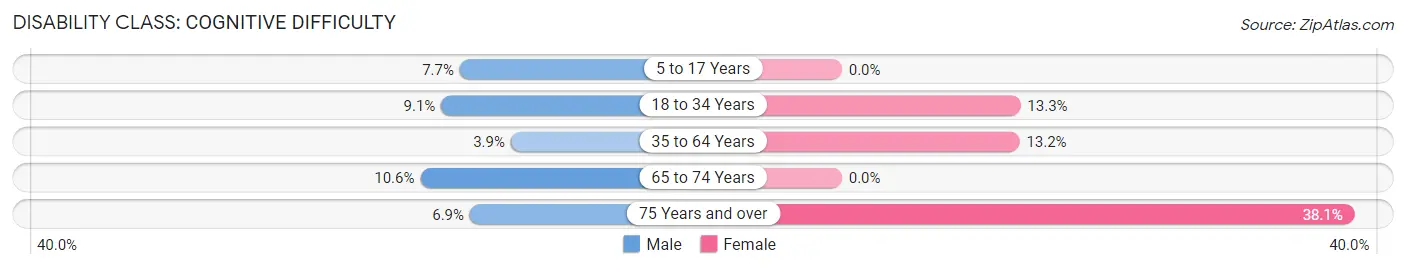
| Age Bracket | Male | Female |
| 5 to 17 Years | 20 (7.7%) | 0 (0.0%) |
| 18 to 34 Years | 51 (9.1%) | 48 (13.3%) |
| 35 to 64 Years | 27 (3.9%) | 105 (13.2%) |
| 65 to 74 Years | 17 (10.6%) | 0 (0.0%) |
| 75 Years and over | 15 (6.9%) | 139 (38.1%) |
Disability Class: Ambulatory Difficulty
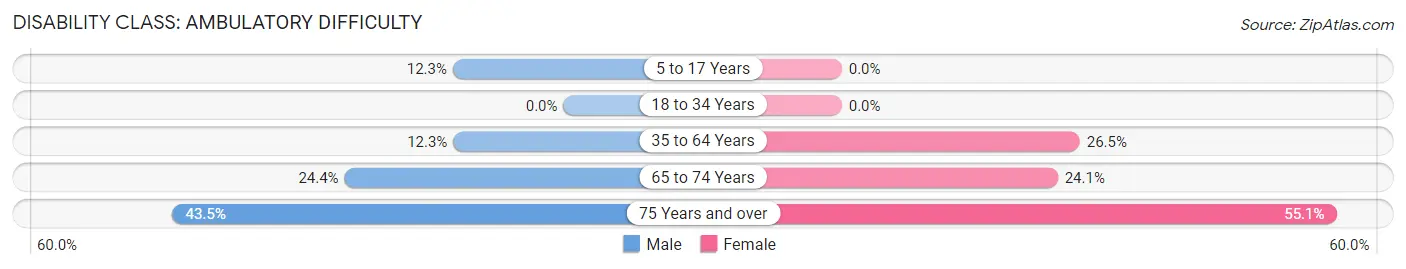
| Age Bracket | Male | Female |
| 5 to 17 Years | 32 (12.3%) | 0 (0.0%) |
| 18 to 34 Years | 0 (0.0%) | 0 (0.0%) |
| 35 to 64 Years | 85 (12.3%) | 211 (26.5%) |
| 65 to 74 Years | 39 (24.4%) | 63 (24.0%) |
| 75 Years and over | 94 (43.5%) | 201 (55.1%) |
Disability Class: Self-Care Difficulty
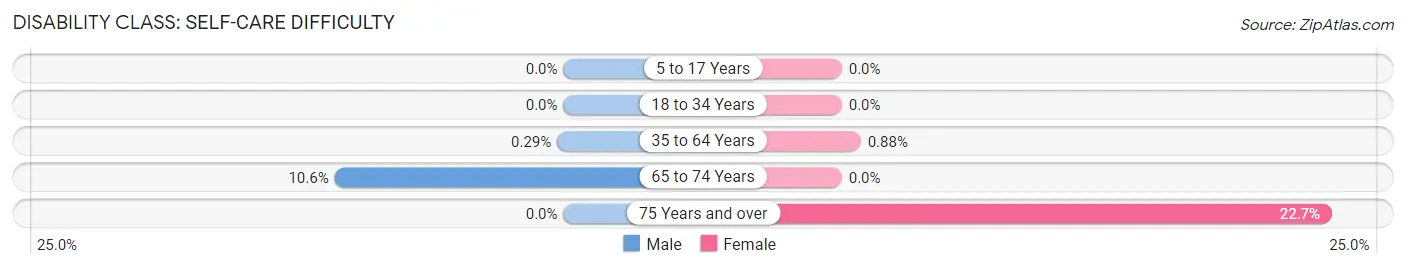
| Age Bracket | Male | Female |
| 5 to 17 Years | 0 (0.0%) | 0 (0.0%) |
| 18 to 34 Years | 0 (0.0%) | 0 (0.0%) |
| 35 to 64 Years | 2 (0.3%) | 7 (0.9%) |
| 65 to 74 Years | 17 (10.6%) | 0 (0.0%) |
| 75 Years and over | 0 (0.0%) | 83 (22.7%) |
Technology Access in Rogersville
Computing Device Access in Rogersville
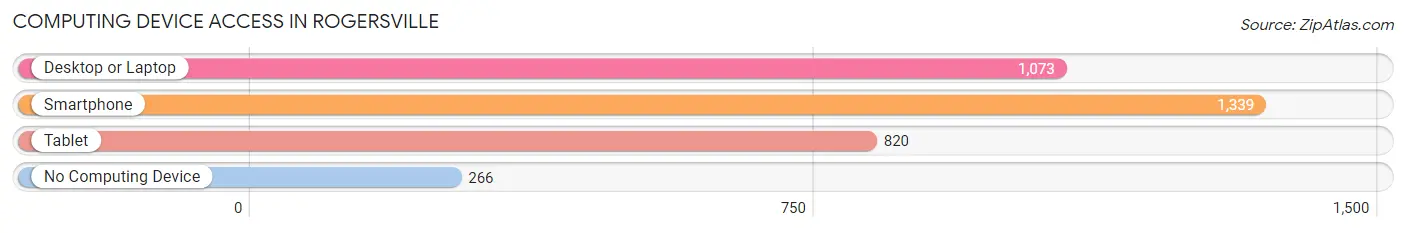
| Device Type | # Households | % Households |
| Desktop or Laptop | 1,073 | 60.2% |
| Smartphone | 1,339 | 75.1% |
| Tablet | 820 | 46.0% |
| No Computing Device | 266 | 14.9% |
| Total | 1,784 | 100.0% |
Internet Access in Rogersville
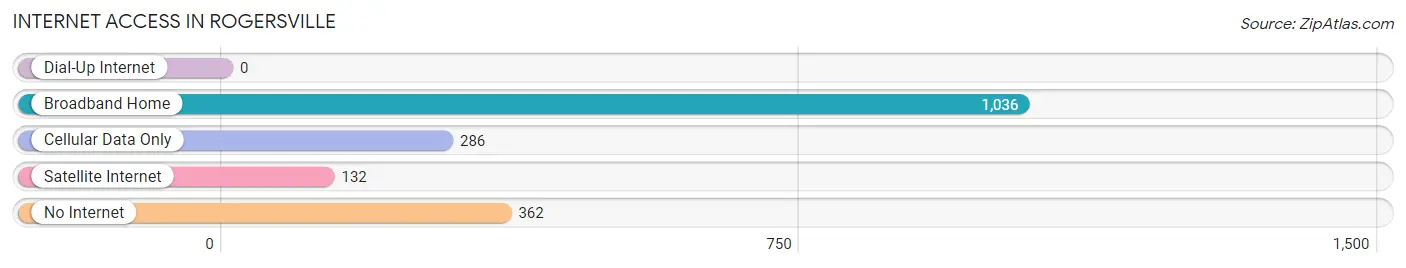
| Internet Type | # Households | % Households |
| Dial-Up Internet | 0 | 0.0% |
| Broadband Home | 1,036 | 58.1% |
| Cellular Data Only | 286 | 16.0% |
| Satellite Internet | 132 | 7.4% |
| No Internet | 362 | 20.3% |
| Total | 1,784 | 100.0% |
Rogersville Summary
Rogersville, Tennessee is a small town located in Hawkins County, in the eastern part of the state. It is situated in the foothills of the Appalachian Mountains, and is the second oldest town in Tennessee. The town was founded in 1775 by Joseph Rogers, a Revolutionary War veteran, and was named after him. The town has a population of 4,846, according to the 2010 census.
Geography
Rogersville is located in the eastern part of Tennessee, in Hawkins County. It is situated in the foothills of the Appalachian Mountains, and is surrounded by the Cherokee National Forest. The town is located at the intersection of US Route 11W and US Route 70. The town is situated at an elevation of 1,068 feet above sea level. The climate in Rogersville is humid subtropical, with hot summers and mild winters.
Economy
The economy of Rogersville is largely based on agriculture and tourism. The town is home to several farms, which produce a variety of crops, including corn, soybeans, wheat, and hay. The town is also home to several manufacturing companies, including a furniture factory, a textile mill, and a paper mill. Tourism is also an important part of the economy, with visitors coming to the town to enjoy the natural beauty of the area.
Demographics
According to the 2010 census, the population of Rogersville was 4,846. The racial makeup of the town was 95.2% White, 2.2% African American, 0.3% Native American, 0.4% Asian, 0.1% Pacific Islander, 0.7% from other races, and 1.1% from two or more races. Hispanic or Latino of any race were 1.7% of the population. The median household income was $30,945, and the median family income was $37,917.
History
Rogersville was founded in 1775 by Joseph Rogers, a Revolutionary War veteran. The town was named after him, and was the second oldest town in Tennessee. The town was an important stop on the Great Stage Road, which connected the east coast to the west. During the Civil War, the town was the site of several battles, including the Battle of Rogersville. After the war, the town experienced a period of growth, with the establishment of several businesses, including a furniture factory, a textile mill, and a paper mill. The town was also home to several schools, including the Rogersville Academy, which was founded in 1810.
Today, Rogersville is a small town with a rich history. The town is home to several historic sites, including the Rogersville Historic District, which is listed on the National Register of Historic Places. The town is also home to several parks and recreational areas, including the Cherokee National Forest. The town is also home to several festivals and events, including the Rogersville Heritage Festival, which is held every year in October.
Common Questions
What is Per Capita Income in Rogersville?
Per Capita income in Rogersville is $25,799.
What is the Median Family Income in Rogersville?
Median Family Income in Rogersville is $55,349.
What is the Median Household income in Rogersville?
Median Household Income in Rogersville is $45,797.
What is Income or Wage Gap in Rogersville?
Income or Wage Gap in Rogersville is 46.9%.
Women in Rogersville earn 53.1 cents for every dollar earned by a man.
What is Inequality or Gini Index in Rogersville?
Inequality or Gini Index in Rogersville is 0.43.
What is the Total Population of Rogersville?
Total Population of Rogersville is 4,630.
What is the Total Male Population of Rogersville?
Total Male Population of Rogersville is 2,275.
What is the Total Female Population of Rogersville?
Total Female Population of Rogersville is 2,355.
What is the Ratio of Males per 100 Females in Rogersville?
There are 96.60 Males per 100 Females in Rogersville.
What is the Ratio of Females per 100 Males in Rogersville?
There are 103.52 Females per 100 Males in Rogersville.
What is the Median Population Age in Rogersville?
Median Population Age in Rogersville is 41.8 Years.
What is the Average Family Size in Rogersville
Average Family Size in Rogersville is 3.0 People.
What is the Average Household Size in Rogersville
Average Household Size in Rogersville is 2.4 People.
How Large is the Labor Force in Rogersville?
There are 1,841 People in the Labor Forcein in Rogersville.
What is the Percentage of People in the Labor Force in Rogersville?
47.6% of People are in the Labor Force in Rogersville.
What is the Unemployment Rate in Rogersville?
Unemployment Rate in Rogersville is 10.6%.