Winchester, TN Map & Demographics
Winchester Map
Winchester Overview
$33,957
PER CAPITA INCOME
$68,413
AVG FAMILY INCOME
$58,054
AVG HOUSEHOLD INCOME
22.8%
WAGE / INCOME GAP [ % ]
77.2¢/ $1
WAGE / INCOME GAP [ $ ]
$13,114
FAMILY INCOME DEFICIT
0.47
INEQUALITY / GINI INDEX
9,450
TOTAL POPULATION
4,664
MALE POPULATION
4,786
FEMALE POPULATION
97.45
MALES / 100 FEMALES
102.62
FEMALES / 100 MALES
43.6
MEDIAN AGE
3.1
AVG FAMILY SIZE
2.4
AVG HOUSEHOLD SIZE
4,374
LABOR FORCE [ PEOPLE ]
58.4%
PERCENT IN LABOR FORCE
3.2%
UNEMPLOYMENT RATE
Winchester Zip Codes
Winchester Area Codes
Income in Winchester
Income Overview in Winchester
Per Capita Income in Winchester is $33,957, while median incomes of families and households are $68,413 and $58,054 respectively.
| Characteristic | Number | Measure |
| Per Capita Income | 9,450 | $33,957 |
| Median Family Income | 2,180 | $68,413 |
| Mean Family Income | 2,180 | $101,413 |
| Median Household Income | 3,822 | $58,054 |
| Mean Household Income | 3,822 | $79,468 |
| Income Deficit | 2,180 | $13,114 |
| Wage / Income Gap (%) | 9,450 | 22.77% |
| Wage / Income Gap ($) | 9,450 | 77.23¢ per $1 |
| Gini / Inequality Index | 9,450 | 0.47 |
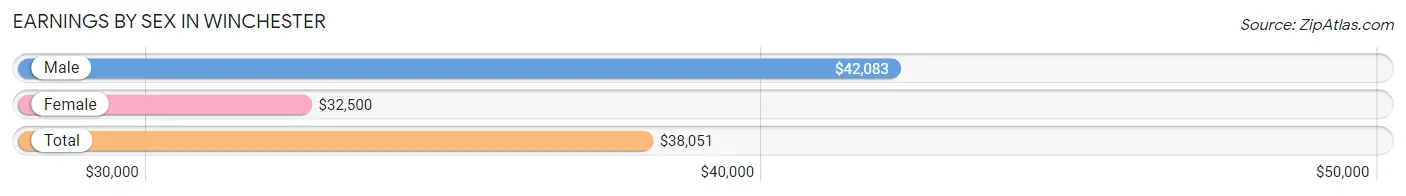
Earnings by Sex in Winchester
Average Earnings in Winchester are $38,051, $42,083 for men and $32,500 for women, a difference of 22.8%.
| Sex | Number | Average Earnings |
| Male | 2,348 (52.0%) | $42,083 |
| Female | 2,166 (48.0%) | $32,500 |
| Total | 4,514 (100.0%) | $38,051 |
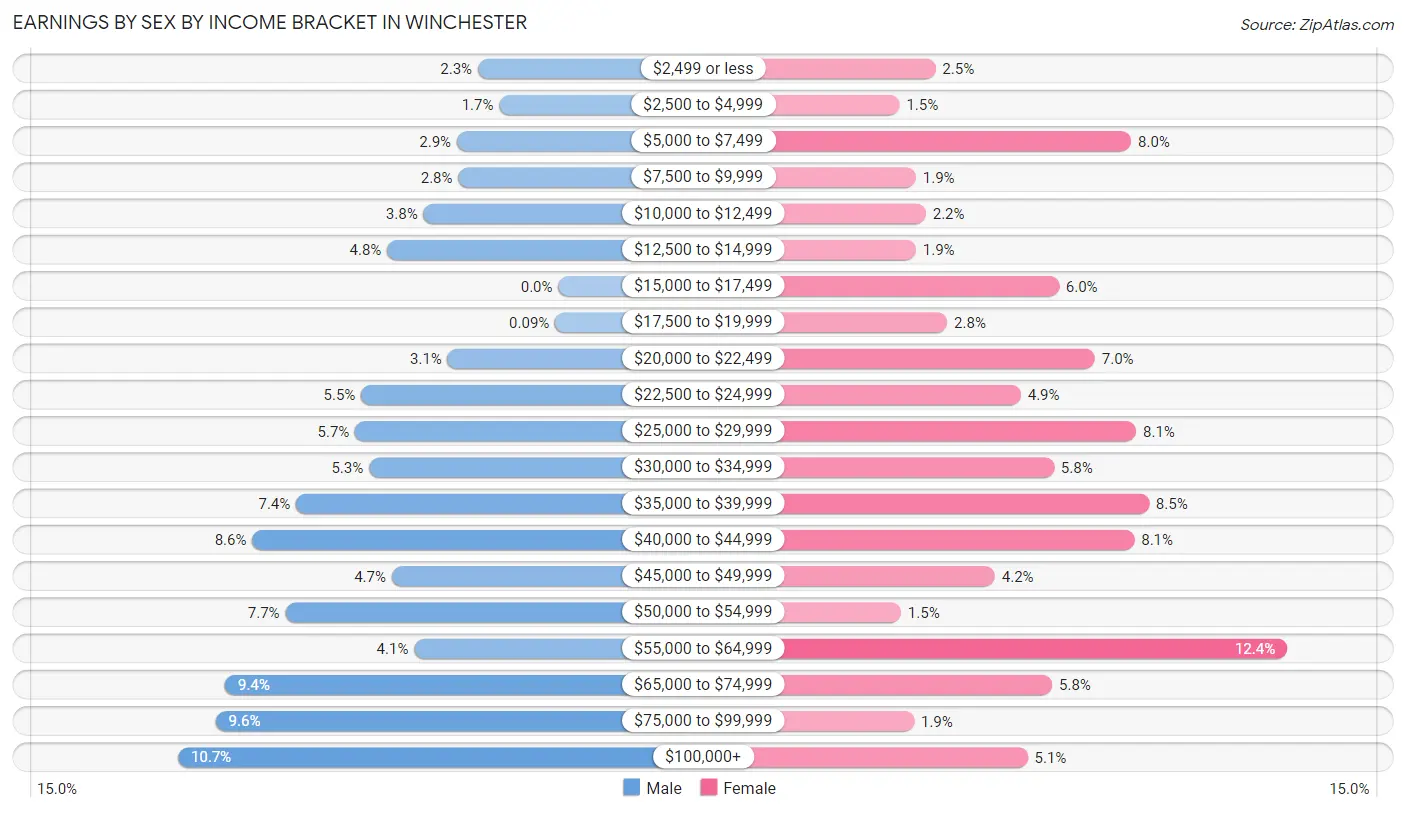
Earnings by Sex by Income Bracket in Winchester
The most common earnings brackets in Winchester are $100,000+ for men (251 | 10.7%) and $55,000 to $64,999 for women (268 | 12.4%).
| Income | Male | Female |
| $2,499 or less | 53 (2.3%) | 54 (2.5%) |
| $2,500 to $4,999 | 39 (1.7%) | 32 (1.5%) |
| $5,000 to $7,499 | 67 (2.9%) | 173 (8.0%) |
| $7,500 to $9,999 | 66 (2.8%) | 42 (1.9%) |
| $10,000 to $12,499 | 89 (3.8%) | 48 (2.2%) |
| $12,500 to $14,999 | 113 (4.8%) | 42 (1.9%) |
| $15,000 to $17,499 | 0 (0.0%) | 129 (6.0%) |
| $17,500 to $19,999 | 2 (0.1%) | 61 (2.8%) |
| $20,000 to $22,499 | 73 (3.1%) | 151 (7.0%) |
| $22,500 to $24,999 | 130 (5.5%) | 106 (4.9%) |
| $25,000 to $29,999 | 134 (5.7%) | 176 (8.1%) |
| $30,000 to $34,999 | 125 (5.3%) | 126 (5.8%) |
| $35,000 to $39,999 | 173 (7.4%) | 184 (8.5%) |
| $40,000 to $44,999 | 202 (8.6%) | 175 (8.1%) |
| $45,000 to $49,999 | 110 (4.7%) | 90 (4.2%) |
| $50,000 to $54,999 | 180 (7.7%) | 33 (1.5%) |
| $55,000 to $64,999 | 95 (4.1%) | 268 (12.4%) |
| $65,000 to $74,999 | 220 (9.4%) | 125 (5.8%) |
| $75,000 to $99,999 | 226 (9.6%) | 41 (1.9%) |
| $100,000+ | 251 (10.7%) | 110 (5.1%) |
| Total | 2,348 (100.0%) | 2,166 (100.0%) |
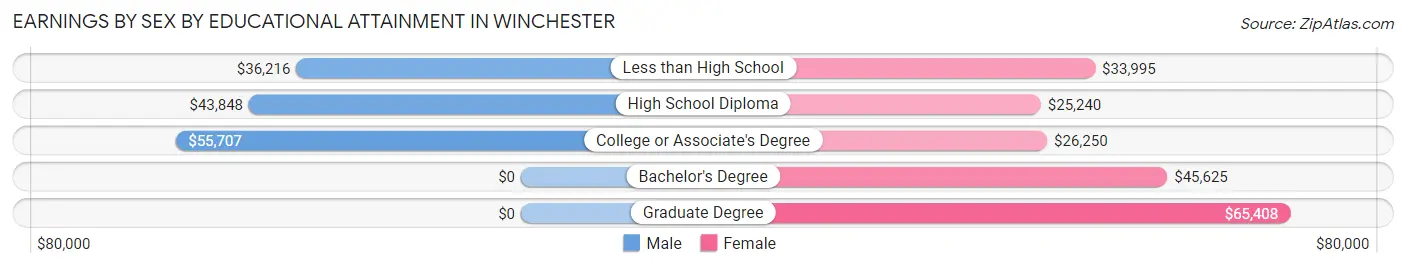
Earnings by Sex by Educational Attainment in Winchester
Average earnings in Winchester are $47,247 for men and $36,435 for women, a difference of 22.9%. Men with an educational attainment of college or associate's degree enjoy the highest average annual earnings of $55,707, while those with less than high school education earn the least with $36,216. Women with an educational attainment of graduate degree earn the most with the average annual earnings of $65,408, while those with high school diploma education have the smallest earnings of $25,240.
| Educational Attainment | Male Income | Female Income |
| Less than High School | $36,216 | $33,995 |
| High School Diploma | $43,848 | $25,240 |
| College or Associate's Degree | $55,707 | $26,250 |
| Bachelor's Degree | - | - |
| Graduate Degree | - | - |
| Total | $47,247 | $36,435 |
Family Income in Winchester
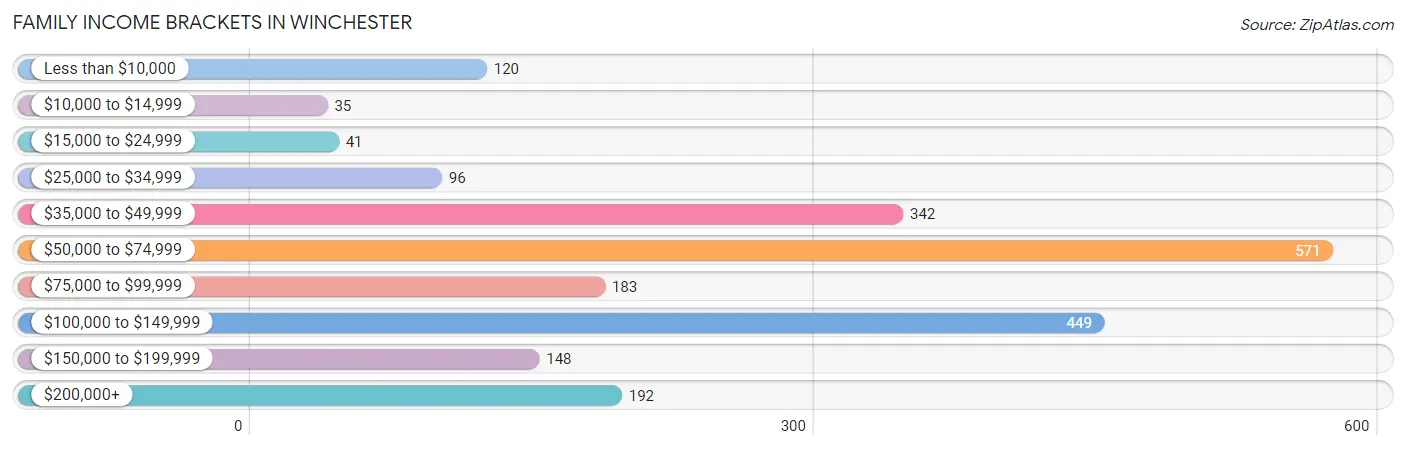
Family Income Brackets in Winchester
According to the Winchester family income data, there are 571 families falling into the $50,000 to $74,999 income range, which is the most common income bracket and makes up 26.2% of all families. Conversely, the $10,000 to $14,999 income bracket is the least frequent group with only 35 families (1.6%) belonging to this category.
| Income Bracket | # Families | % Families |
| Less than $10,000 | 120 | 5.5% |
| $10,000 to $14,999 | 35 | 1.6% |
| $15,000 to $24,999 | 41 | 1.9% |
| $25,000 to $34,999 | 96 | 4.4% |
| $35,000 to $49,999 | 342 | 15.7% |
| $50,000 to $74,999 | 571 | 26.2% |
| $75,000 to $99,999 | 183 | 8.4% |
| $100,000 to $149,999 | 449 | 20.6% |
| $150,000 to $199,999 | 148 | 6.8% |
| $200,000+ | 192 | 8.8% |
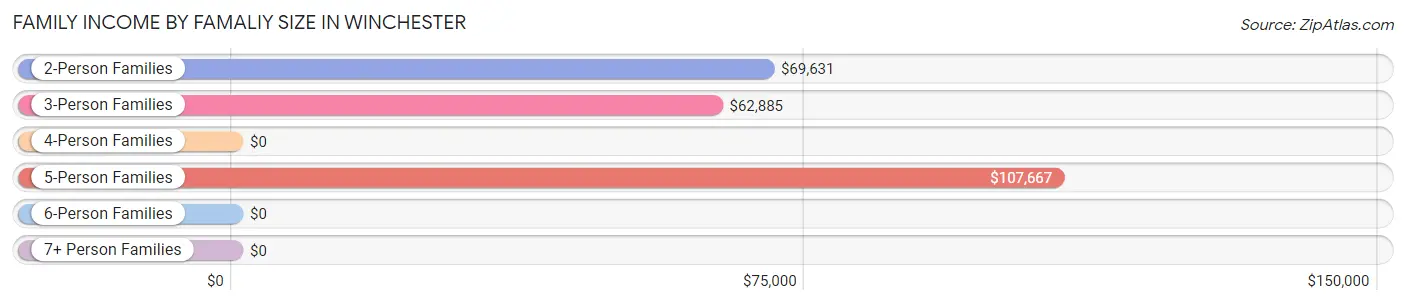
Family Income by Famaliy Size in Winchester
5-person families (136 | 6.2%) account for the highest median family income in Winchester with $107,667 per family, while 2-person families (1,123 | 51.5%) have the highest median income of $34,816 per family member.
| Income Bracket | # Families | Median Income |
| 2-Person Families | 1,123 (51.5%) | $69,631 |
| 3-Person Families | 474 (21.7%) | $62,885 |
| 4-Person Families | 382 (17.5%) | $0 |
| 5-Person Families | 136 (6.2%) | $107,667 |
| 6-Person Families | 15 (0.7%) | $0 |
| 7+ Person Families | 50 (2.3%) | $0 |
| Total | 2,180 (100.0%) | $68,413 |
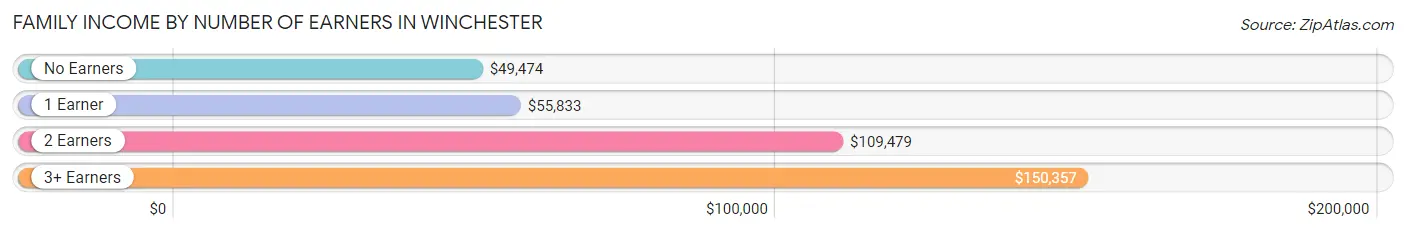
Family Income by Number of Earners in Winchester
The median family income in Winchester is $68,413, with families comprising 3+ earners (204) having the highest median family income of $150,357, while families with no earners (508) have the lowest median family income of $49,474, accounting for 9.4% and 23.3% of families, respectively.
| Number of Earners | # Families | Median Income |
| No Earners | 508 (23.3%) | $49,474 |
| 1 Earner | 764 (35.0%) | $55,833 |
| 2 Earners | 704 (32.3%) | $109,479 |
| 3+ Earners | 204 (9.4%) | $150,357 |
| Total | 2,180 (100.0%) | $68,413 |
Household Income in Winchester
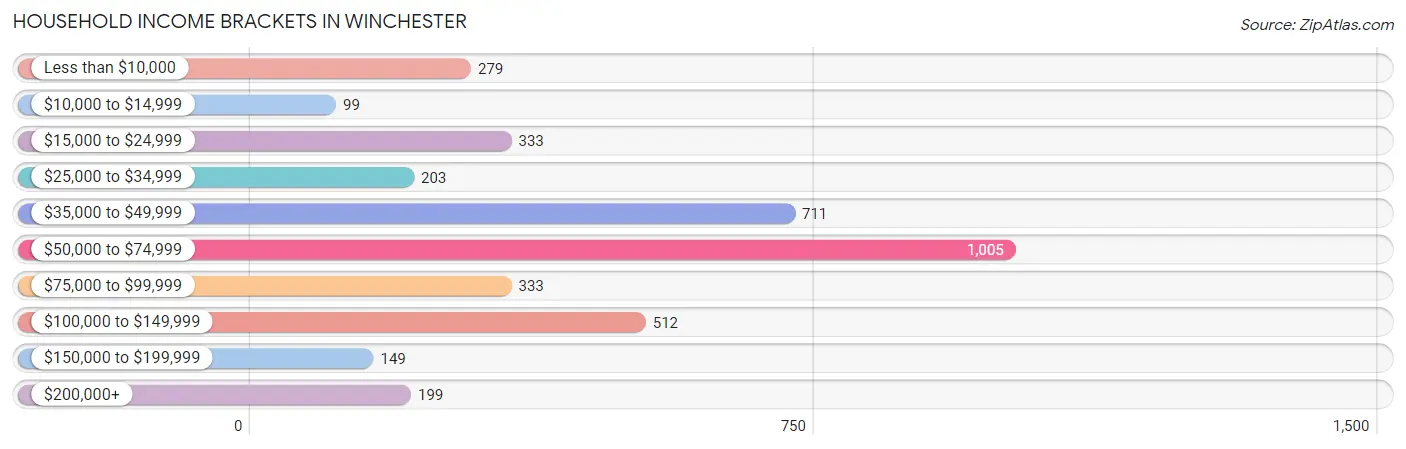
Household Income Brackets in Winchester
With 1,005 households falling in the category, the $50,000 to $74,999 income range is the most frequent in Winchester, accounting for 26.3% of all households. In contrast, only 99 households (2.6%) fall into the $10,000 to $14,999 income bracket, making it the least populous group.
| Income Bracket | # Households | % Households |
| Less than $10,000 | 279 | 7.3% |
| $10,000 to $14,999 | 99 | 2.6% |
| $15,000 to $24,999 | 333 | 8.7% |
| $25,000 to $34,999 | 203 | 5.3% |
| $35,000 to $49,999 | 711 | 18.6% |
| $50,000 to $74,999 | 1,005 | 26.3% |
| $75,000 to $99,999 | 333 | 8.7% |
| $100,000 to $149,999 | 512 | 13.4% |
| $150,000 to $199,999 | 149 | 3.9% |
| $200,000+ | 199 | 5.2% |
Household Income by Householder Age in Winchester
The median household income in Winchester is $58,054, with the highest median household income of $63,333 found in the 25 to 44 years age bracket for the primary householder. A total of 1,008 households (26.4%) fall into this category. Meanwhile, the 65+ years age bracket for the primary householder has the lowest median household income of $47,842, with 1,160 households (30.3%) in this group.
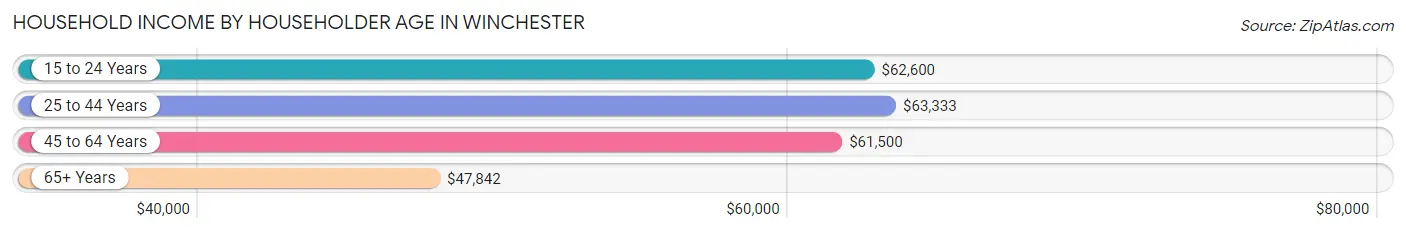
| Income Bracket | # Households | Median Income |
| 15 to 24 Years | 156 (4.1%) | $62,600 |
| 25 to 44 Years | 1,008 (26.4%) | $63,333 |
| 45 to 64 Years | 1,498 (39.2%) | $61,500 |
| 65+ Years | 1,160 (30.3%) | $47,842 |
| Total | 3,822 (100.0%) | $58,054 |
Poverty in Winchester
Income Below Poverty by Sex and Age in Winchester
With 11.9% poverty level for males and 18.8% for females among the residents of Winchester, under 5 year old males and 5 year old females are the most vulnerable to poverty, with 90 males (40.4%) and 86 females (85.2%) in their respective age groups living below the poverty level.
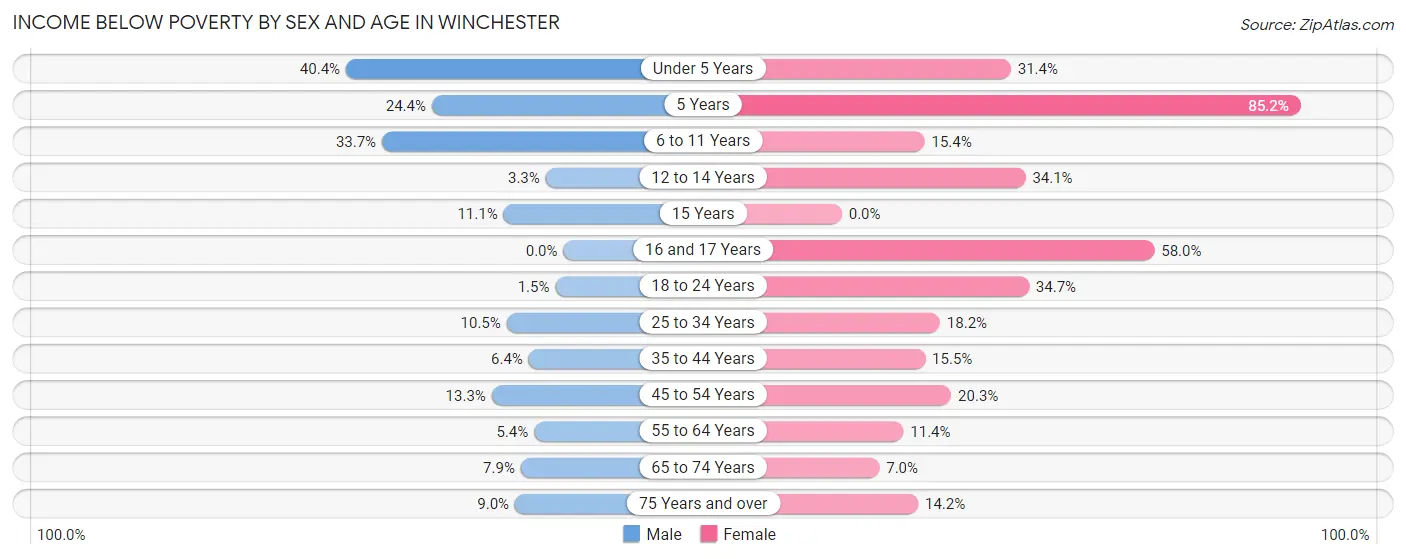
| Age Bracket | Male | Female |
| Under 5 Years | 90 (40.4%) | 64 (31.4%) |
| 5 Years | 42 (24.4%) | 86 (85.2%) |
| 6 to 11 Years | 132 (33.7%) | 53 (15.4%) |
| 12 to 14 Years | 5 (3.3%) | 30 (34.1%) |
| 15 Years | 11 (11.1%) | 0 (0.0%) |
| 16 and 17 Years | 0 (0.0%) | 29 (58.0%) |
| 18 to 24 Years | 7 (1.5%) | 83 (34.7%) |
| 25 to 34 Years | 40 (10.5%) | 130 (18.2%) |
| 35 to 44 Years | 33 (6.4%) | 73 (15.5%) |
| 45 to 54 Years | 66 (13.3%) | 123 (20.3%) |
| 55 to 64 Years | 36 (5.4%) | 83 (11.4%) |
| 65 to 74 Years | 37 (7.9%) | 36 (7.0%) |
| 75 Years and over | 32 (9.0%) | 59 (14.1%) |
| Total | 531 (11.9%) | 849 (18.8%) |
Income Above Poverty by Sex and Age in Winchester
According to the poverty statistics in Winchester, males aged 16 and 17 years and females aged 15 years are the age groups that are most secure financially, with 100.0% of males and 100.0% of females in these age groups living above the poverty line.
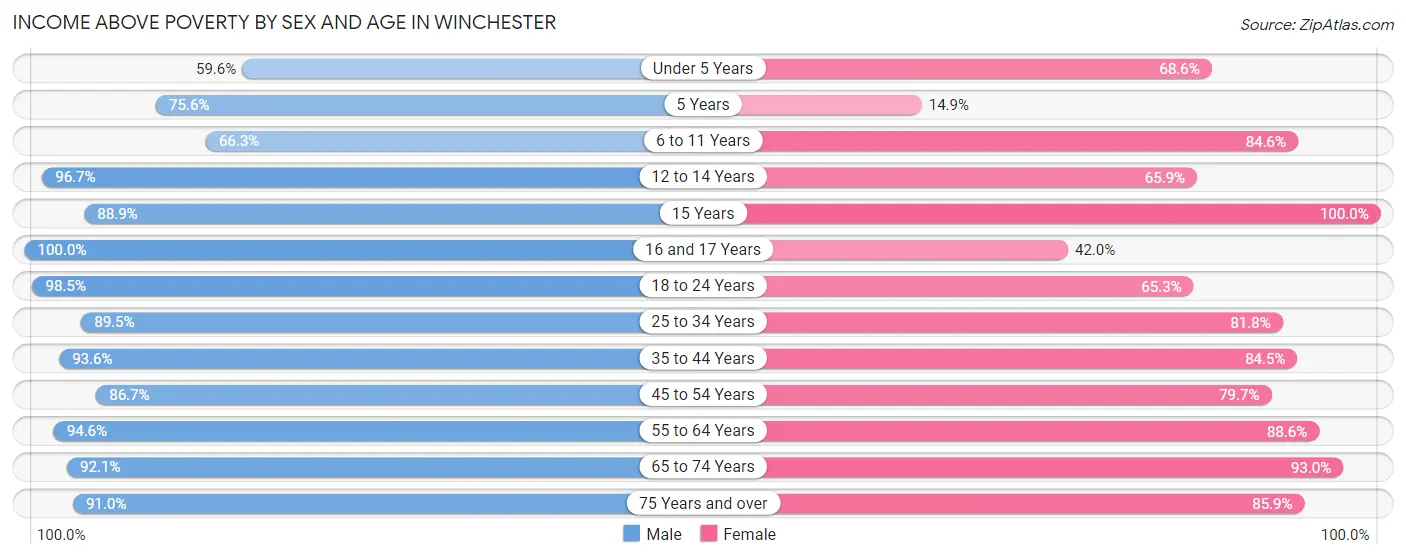
| Age Bracket | Male | Female |
| Under 5 Years | 133 (59.6%) | 140 (68.6%) |
| 5 Years | 130 (75.6%) | 15 (14.8%) |
| 6 to 11 Years | 260 (66.3%) | 292 (84.6%) |
| 12 to 14 Years | 147 (96.7%) | 58 (65.9%) |
| 15 Years | 88 (88.9%) | 27 (100.0%) |
| 16 and 17 Years | 65 (100.0%) | 21 (42.0%) |
| 18 to 24 Years | 464 (98.5%) | 156 (65.3%) |
| 25 to 34 Years | 340 (89.5%) | 584 (81.8%) |
| 35 to 44 Years | 480 (93.6%) | 399 (84.5%) |
| 45 to 54 Years | 430 (86.7%) | 483 (79.7%) |
| 55 to 64 Years | 626 (94.6%) | 643 (88.6%) |
| 65 to 74 Years | 431 (92.1%) | 481 (93.0%) |
| 75 Years and over | 324 (91.0%) | 358 (85.9%) |
| Total | 3,918 (88.1%) | 3,657 (81.2%) |
Income Below Poverty Among Married-Couple Families in Winchester
The poverty statistics for married-couple families in Winchester show that 7.6% or 121 of the total 1,587 families live below the poverty line. Families with 5 or more children have the highest poverty rate of 100.0%, comprising of 48 families. On the other hand, families with 3 or 4 children have the lowest poverty rate of 2.2%, which includes 2 families.
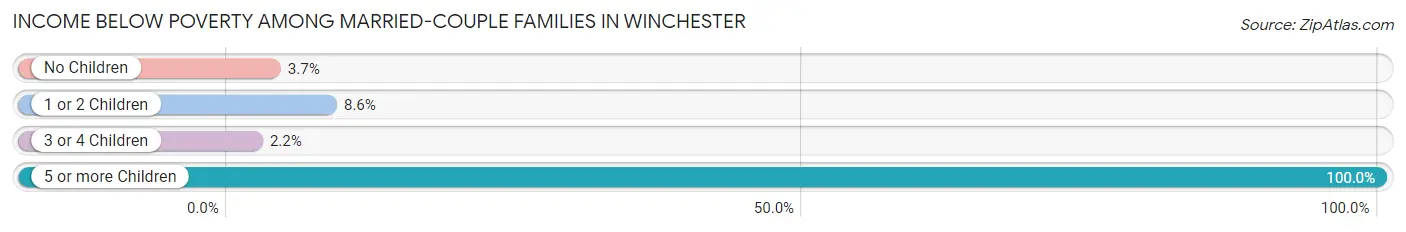
| Children | Above Poverty | Below Poverty |
| No Children | 1,058 (96.3%) | 41 (3.7%) |
| 1 or 2 Children | 318 (91.4%) | 30 (8.6%) |
| 3 or 4 Children | 90 (97.8%) | 2 (2.2%) |
| 5 or more Children | 0 (0.0%) | 48 (100.0%) |
| Total | 1,466 (92.4%) | 121 (7.6%) |
Income Below Poverty Among Single-Parent Households in Winchester
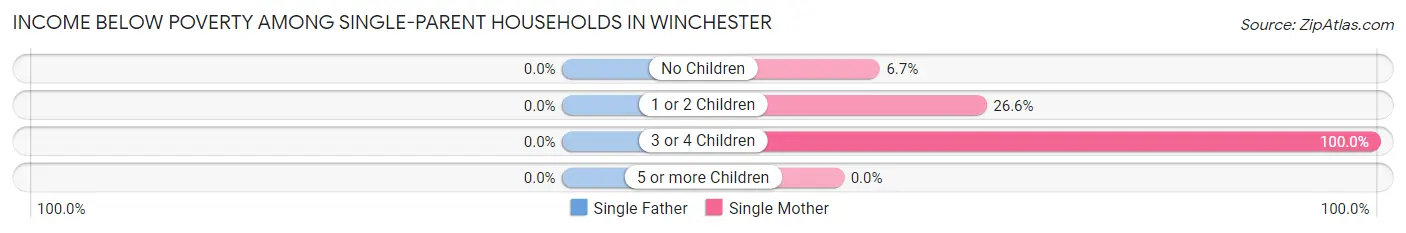
| Children | Single Father | Single Mother |
| No Children | 0 (0.0%) | 8 (6.7%) |
| 1 or 2 Children | 0 (0.0%) | 84 (26.6%) |
| 3 or 4 Children | 0 (0.0%) | 7 (100.0%) |
| 5 or more Children | 0 (0.0%) | 0 (0.0%) |
| Total | 0 (0.0%) | 99 (22.4%) |
Income Below Poverty Among Married-Couple vs Single-Parent Households in Winchester
The poverty data for Winchester shows that 121 of the married-couple family households (7.6%) and 99 of the single-parent households (16.7%) are living below the poverty level. Within the married-couple family households, those with 5 or more children have the highest poverty rate, with 48 households (100.0%) falling below the poverty line. Among the single-parent households, those with 3 or 4 children have the highest poverty rate, with 7 household (100.0%) living below poverty.
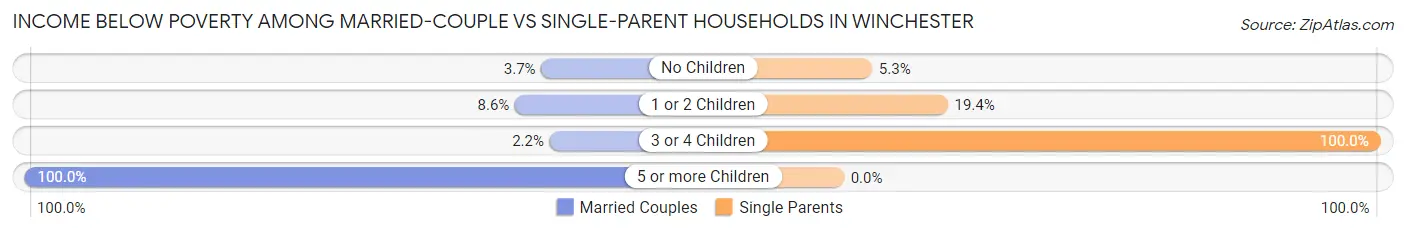
| Children | Married-Couple Families | Single-Parent Households |
| No Children | 41 (3.7%) | 8 (5.3%) |
| 1 or 2 Children | 30 (8.6%) | 84 (19.4%) |
| 3 or 4 Children | 2 (2.2%) | 7 (100.0%) |
| 5 or more Children | 48 (100.0%) | 0 (0.0%) |
| Total | 121 (7.6%) | 99 (16.7%) |
Race in Winchester
The most populous races in Winchester are White / Caucasian (7,417 | 78.5%), Black / African American (969 | 10.2%), and Hispanic or Latino (942 | 10.0%).
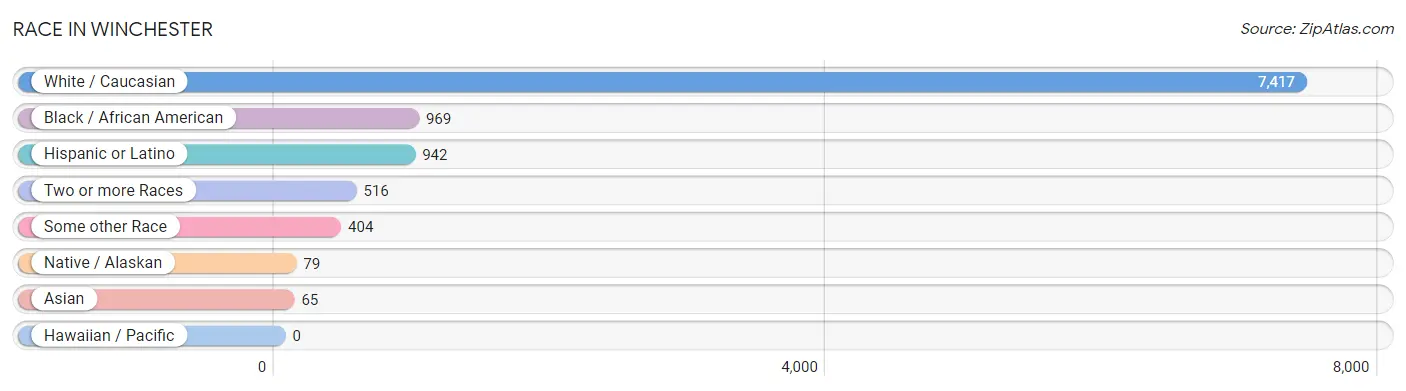
| Race | # Population | % Population |
| Asian | 65 | 0.7% |
| Black / African American | 969 | 10.2% |
| Hawaiian / Pacific | 0 | 0.0% |
| Hispanic or Latino | 942 | 10.0% |
| Native / Alaskan | 79 | 0.8% |
| White / Caucasian | 7,417 | 78.5% |
| Two or more Races | 516 | 5.5% |
| Some other Race | 404 | 4.3% |
| Total | 9,450 | 100.0% |
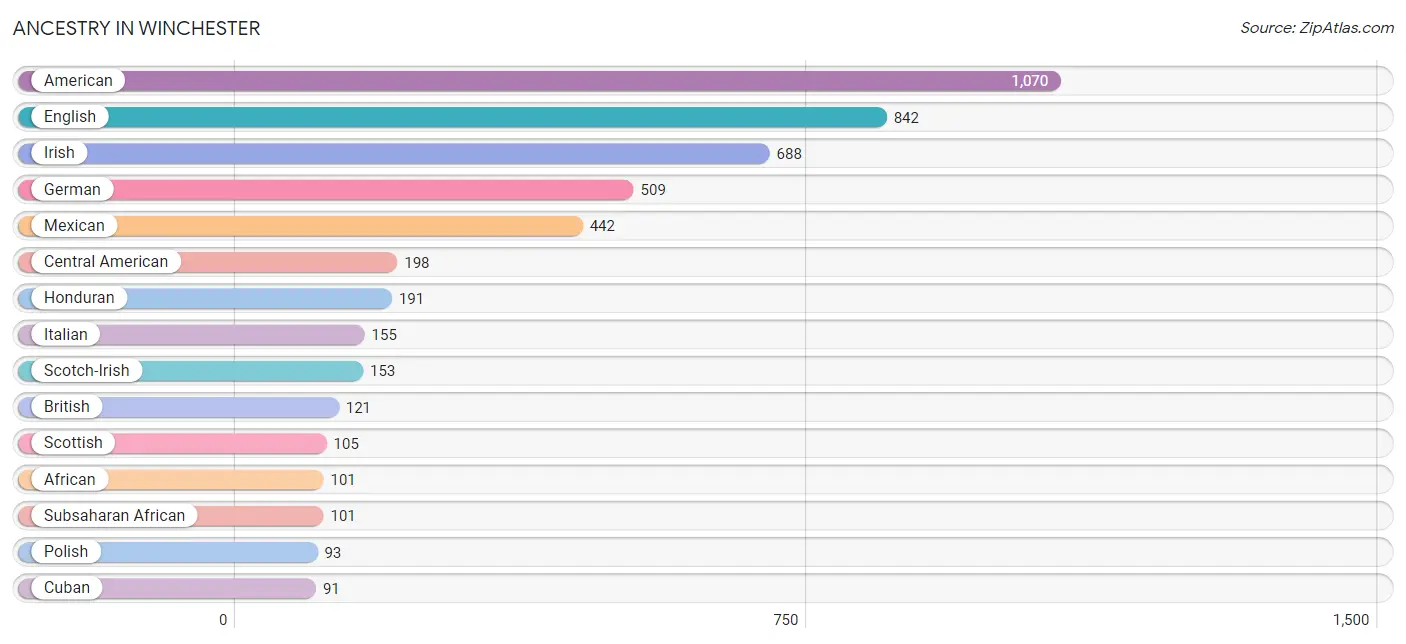
Ancestry in Winchester
The most populous ancestries reported in Winchester are American (1,070 | 11.3%), English (842 | 8.9%), Irish (688 | 7.3%), German (509 | 5.4%), and Mexican (442 | 4.7%), together accounting for 37.6% of all Winchester residents.
| Ancestry | # Population | % Population |
| African | 101 | 1.1% |
| American | 1,070 | 11.3% |
| Belizean | 34 | 0.4% |
| Bhutanese | 24 | 0.3% |
| British | 121 | 1.3% |
| Burmese | 15 | 0.2% |
| Cajun | 6 | 0.1% |
| Central American | 198 | 2.1% |
| Central American Indian | 74 | 0.8% |
| Cherokee | 44 | 0.5% |
| Cuban | 91 | 1.0% |
| Danish | 23 | 0.2% |
| Dutch | 42 | 0.4% |
| Eastern European | 27 | 0.3% |
| English | 842 | 8.9% |
| European | 31 | 0.3% |
| Finnish | 44 | 0.5% |
| French | 31 | 0.3% |
| French Canadian | 24 | 0.3% |
| German | 509 | 5.4% |
| Greek | 25 | 0.3% |
| Guatemalan | 7 | 0.1% |
| Honduran | 191 | 2.0% |
| Indian (Asian) | 9 | 0.1% |
| Irish | 688 | 7.3% |
| Italian | 155 | 1.6% |
| Korean | 31 | 0.3% |
| Lithuanian | 11 | 0.1% |
| Mexican | 442 | 4.7% |
| Pakistani | 31 | 0.3% |
| Polish | 93 | 1.0% |
| Scotch-Irish | 153 | 1.6% |
| Scottish | 105 | 1.1% |
| Spaniard | 43 | 0.5% |
| Spanish | 55 | 0.6% |
| Sri Lankan | 9 | 0.1% |
| Subsaharan African | 101 | 1.1% |
| Swedish | 8 | 0.1% |
| Swiss | 14 | 0.2% |
| Thai | 30 | 0.3% |
| West Indian | 2 | 0.0% | View All 41 Rows |
Immigrants in Winchester
The most numerous immigrant groups reported in Winchester came from Central America (309 | 3.3%), Latin America (309 | 3.3%), Mexico (148 | 1.6%), Honduras (120 | 1.3%), and Europe (63 | 0.7%), together accounting for 10.1% of all Winchester residents.
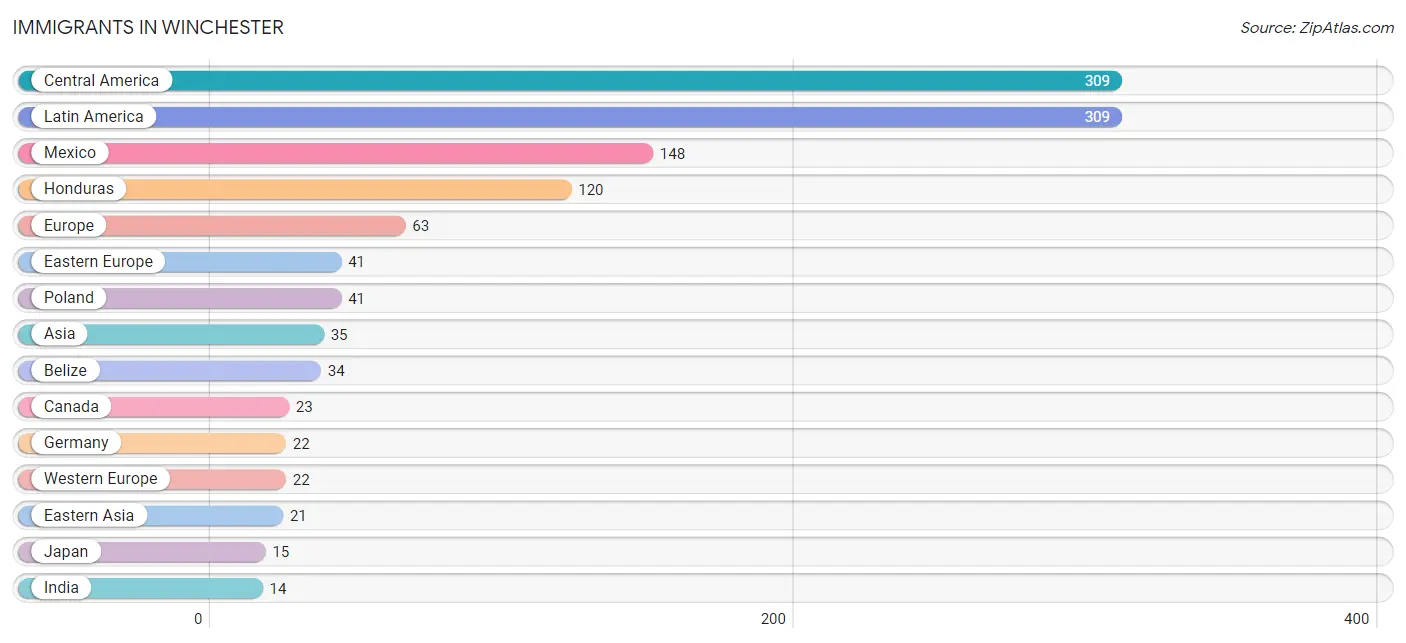
| Immigration Origin | # Population | % Population |
| Asia | 35 | 0.4% |
| Belize | 34 | 0.4% |
| Canada | 23 | 0.2% |
| Central America | 309 | 3.3% |
| Eastern Asia | 21 | 0.2% |
| Eastern Europe | 41 | 0.4% |
| Europe | 63 | 0.7% |
| Germany | 22 | 0.2% |
| Guatemala | 7 | 0.1% |
| Honduras | 120 | 1.3% |
| India | 14 | 0.2% |
| Japan | 15 | 0.2% |
| Korea | 6 | 0.1% |
| Latin America | 309 | 3.3% |
| Mexico | 148 | 1.6% |
| Poland | 41 | 0.4% |
| South Central Asia | 14 | 0.2% |
| Western Europe | 22 | 0.2% | View All 18 Rows |
Sex and Age in Winchester
Sex and Age in Winchester
The most populous age groups in Winchester are 5 to 9 Years (503 | 10.8%) for men and 25 to 29 Years (386 | 8.1%) for women.
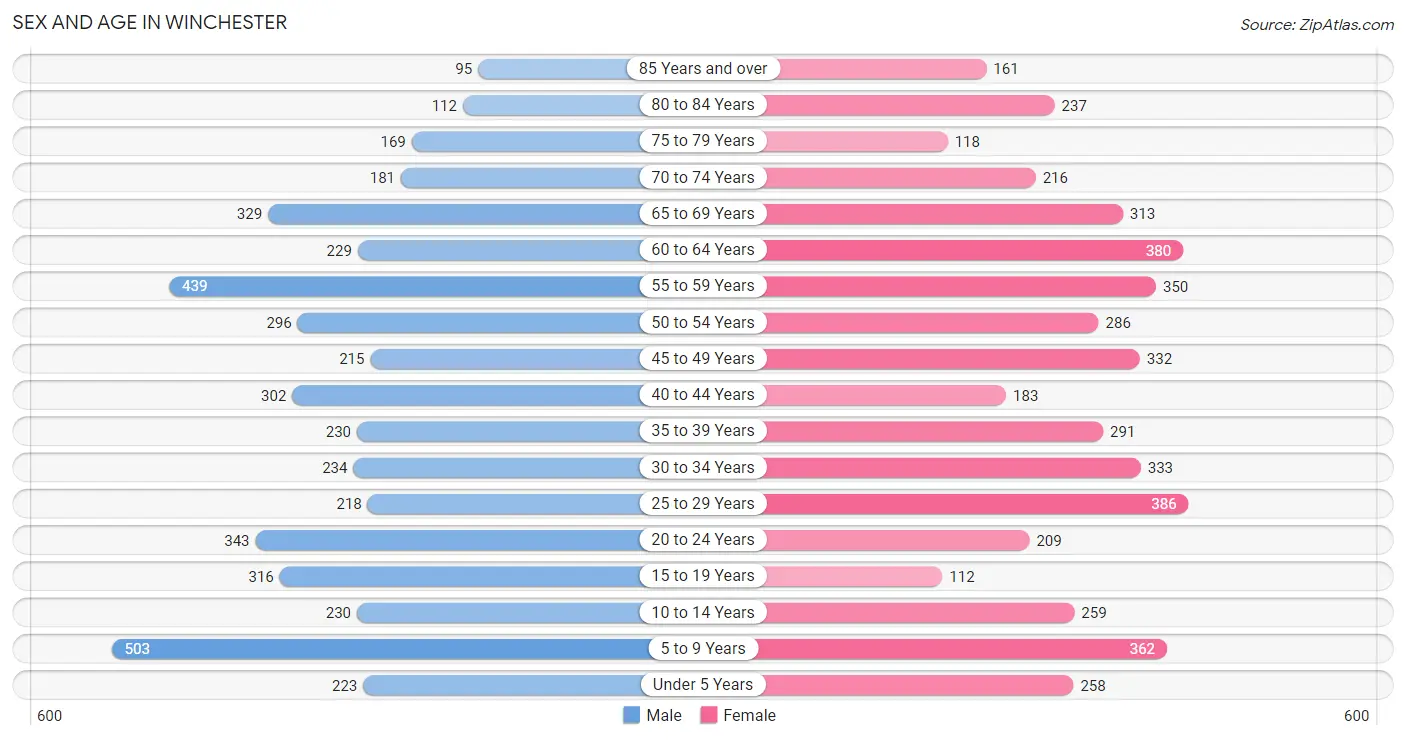
| Age Bracket | Male | Female |
| Under 5 Years | 223 (4.8%) | 258 (5.4%) |
| 5 to 9 Years | 503 (10.8%) | 362 (7.6%) |
| 10 to 14 Years | 230 (4.9%) | 259 (5.4%) |
| 15 to 19 Years | 316 (6.8%) | 112 (2.3%) |
| 20 to 24 Years | 343 (7.3%) | 209 (4.4%) |
| 25 to 29 Years | 218 (4.7%) | 386 (8.1%) |
| 30 to 34 Years | 234 (5.0%) | 333 (7.0%) |
| 35 to 39 Years | 230 (4.9%) | 291 (6.1%) |
| 40 to 44 Years | 302 (6.5%) | 183 (3.8%) |
| 45 to 49 Years | 215 (4.6%) | 332 (6.9%) |
| 50 to 54 Years | 296 (6.4%) | 286 (6.0%) |
| 55 to 59 Years | 439 (9.4%) | 350 (7.3%) |
| 60 to 64 Years | 229 (4.9%) | 380 (7.9%) |
| 65 to 69 Years | 329 (7.0%) | 313 (6.5%) |
| 70 to 74 Years | 181 (3.9%) | 216 (4.5%) |
| 75 to 79 Years | 169 (3.6%) | 118 (2.5%) |
| 80 to 84 Years | 112 (2.4%) | 237 (5.0%) |
| 85 Years and over | 95 (2.0%) | 161 (3.4%) |
| Total | 4,664 (100.0%) | 4,786 (100.0%) |
Families and Households in Winchester
Median Family Size in Winchester
The median family size in Winchester is 3.11 persons per family, with married-couple families (1,587 | 72.8%) accounting for the largest median family size of 3.3 persons per family. On the other hand, single female/mother families (443 | 20.3%) represent the smallest median family size with 2.52 persons per family.
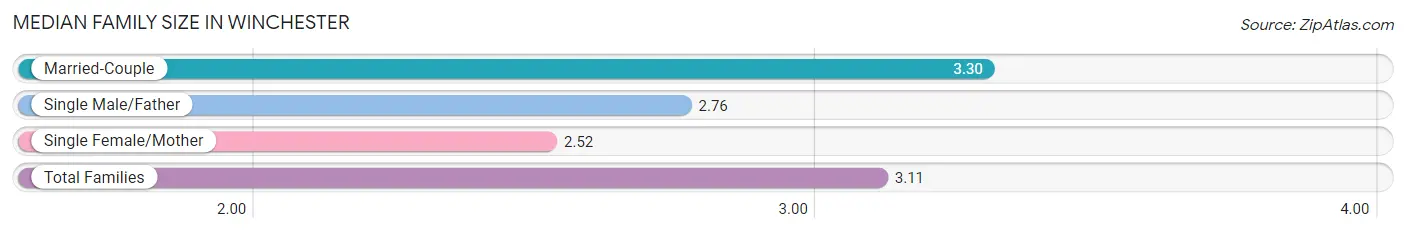
| Family Type | # Families | Family Size |
| Married-Couple | 1,587 (72.8%) | 3.30 |
| Single Male/Father | 150 (6.9%) | 2.76 |
| Single Female/Mother | 443 (20.3%) | 2.52 |
| Total Families | 2,180 (100.0%) | 3.11 |
Median Household Size in Winchester
The median household size in Winchester is 2.38 persons per household, with single male/father households (150 | 3.9%) accounting for the largest median household size of 4.03 persons per household. non-family households (1,642 | 43.0%) represent the smallest median household size with 1.22 persons per household.
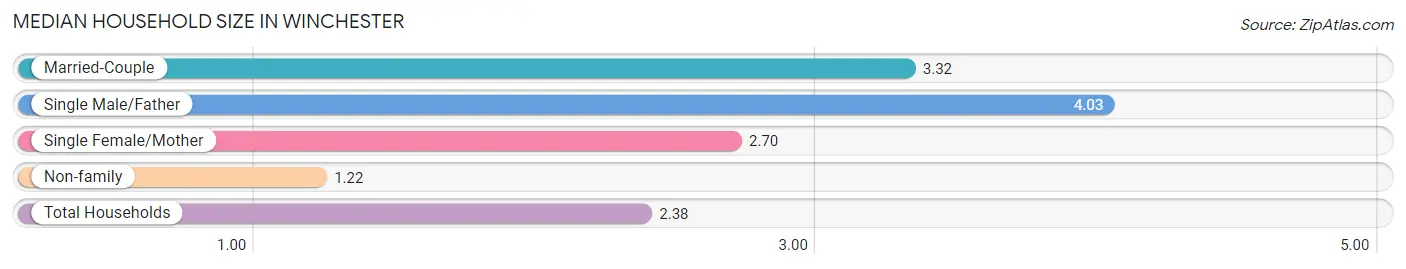
| Household Type | # Households | Household Size |
| Married-Couple | 1,587 (41.5%) | 3.32 |
| Single Male/Father | 150 (3.9%) | 4.03 |
| Single Female/Mother | 443 (11.6%) | 2.70 |
| Non-family | 1,642 (43.0%) | 1.22 |
| Total Households | 3,822 (100.0%) | 2.38 |
Household Size by Marriage Status in Winchester
Out of a total of 3,822 households in Winchester, 2,180 (57.0%) are family households, while 1,642 (43.0%) are nonfamily households. The most numerous type of family households are 2-person households, comprising 1,022, and the most common type of nonfamily households are 1-person households, comprising 1,377.
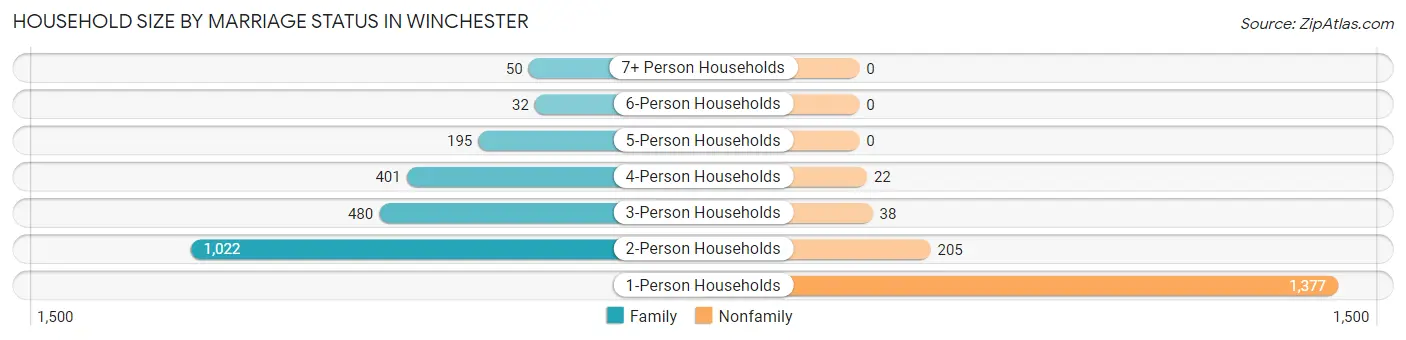
| Household Size | Family Households | Nonfamily Households |
| 1-Person Households | - | 1,377 (36.0%) |
| 2-Person Households | 1,022 (26.7%) | 205 (5.4%) |
| 3-Person Households | 480 (12.6%) | 38 (1.0%) |
| 4-Person Households | 401 (10.5%) | 22 (0.6%) |
| 5-Person Households | 195 (5.1%) | 0 (0.0%) |
| 6-Person Households | 32 (0.8%) | 0 (0.0%) |
| 7+ Person Households | 50 (1.3%) | 0 (0.0%) |
| Total | 2,180 (57.0%) | 1,642 (43.0%) |
Female Fertility in Winchester
Fertility by Age in Winchester
Average fertility rate in Winchester is 78.0 births per 1,000 women. Women in the age bracket of 20 to 34 years have the highest fertility rate with 162.0 births per 1,000 women. Women in the age bracket of 20 to 34 years acount for 100.0% of all women with births.
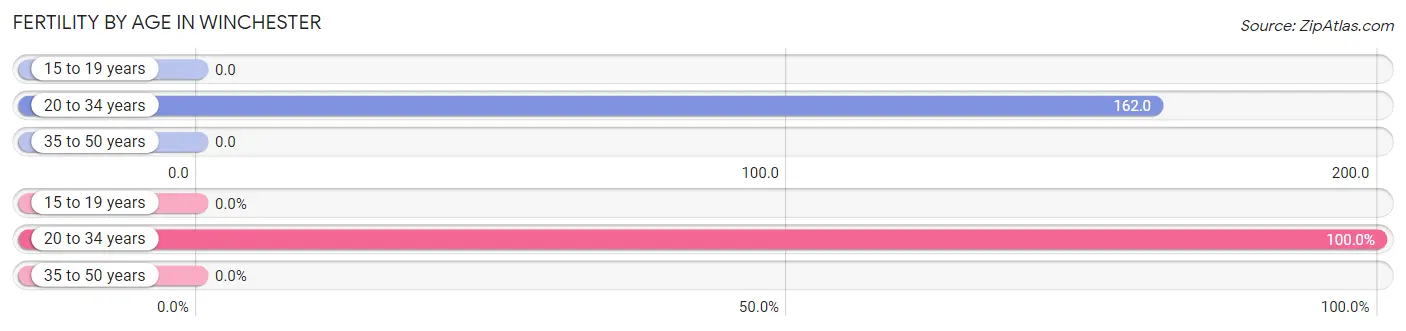
| Age Bracket | Women with Births | Births / 1,000 Women |
| 15 to 19 years | 0 (0.0%) | 0.0 |
| 20 to 34 years | 150 (100.0%) | 162.0 |
| 35 to 50 years | 0 (0.0%) | 0.0 |
| Total | 150 (100.0%) | 78.0 |
Fertility by Age by Marriage Status in Winchester
42.0% of women with births (150) in Winchester are married. The highest percentage of unmarried women with births falls into 20 to 34 years age bracket with 58.0% of them unmarried at the time of birth, while the lowest percentage of unmarried women with births belong to 20 to 34 years age bracket with 58.0% of them unmarried.
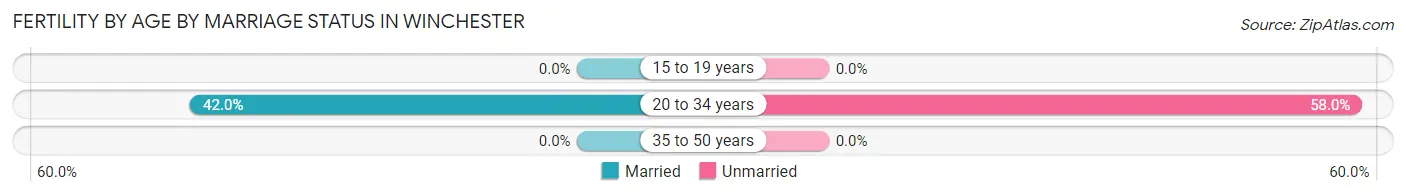
| Age Bracket | Married | Unmarried |
| 15 to 19 years | 0 (0.0%) | 0 (0.0%) |
| 20 to 34 years | 63 (42.0%) | 87 (58.0%) |
| 35 to 50 years | 0 (0.0%) | 0 (0.0%) |
| Total | 63 (42.0%) | 87 (58.0%) |
Fertility by Education in Winchester
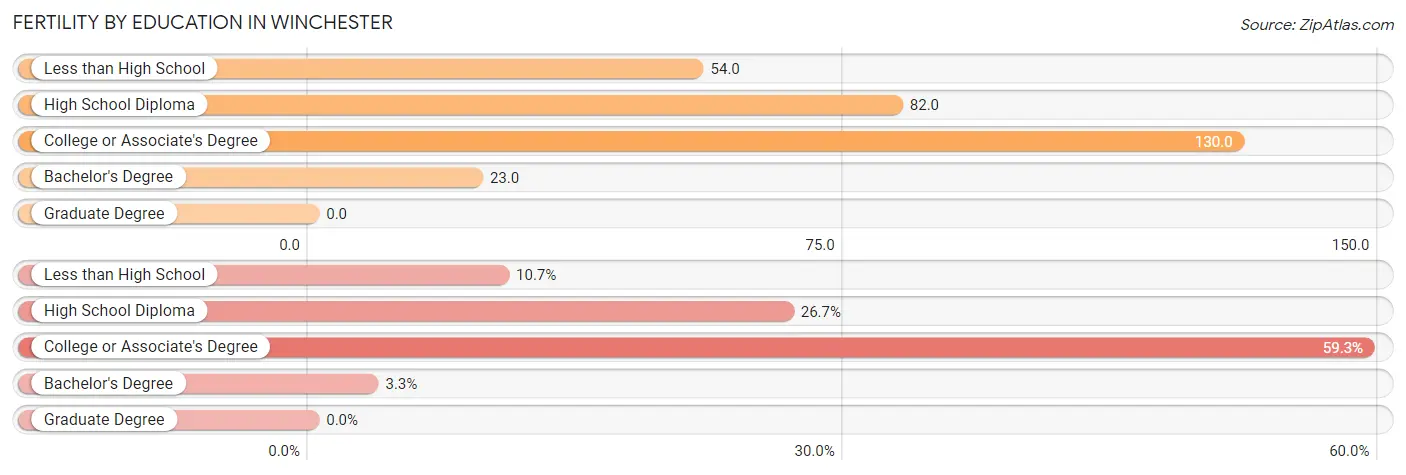
| Educational Attainment | Women with Births | Births / 1,000 Women |
| Less than High School | 16 (10.7%) | 54.0 |
| High School Diploma | 40 (26.7%) | 82.0 |
| College or Associate's Degree | 89 (59.3%) | 130.0 |
| Bachelor's Degree | 5 (3.3%) | 23.0 |
| Graduate Degree | 0 (0.0%) | 0.0 |
| Total | 150 (100.0%) | 78.0 |
Fertility by Education by Marriage Status in Winchester
58.0% of women with births in Winchester are unmarried. Women with the educational attainment of high school diploma are most likely to be married with 100.0% of them married at childbirth, while women with the educational attainment of less than high school are least likely to be married with 100.0% of them unmarried at childbirth.
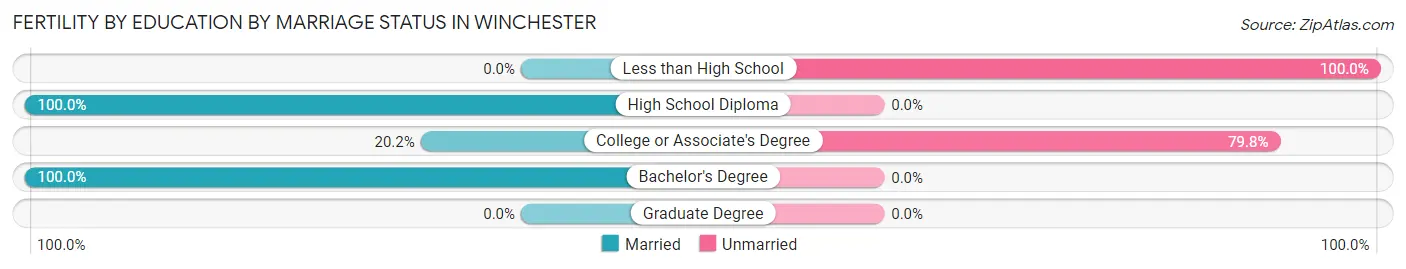
| Educational Attainment | Married | Unmarried |
| Less than High School | 0 (0.0%) | 16 (100.0%) |
| High School Diploma | 40 (100.0%) | 0 (0.0%) |
| College or Associate's Degree | 18 (20.2%) | 71 (79.8%) |
| Bachelor's Degree | 5 (100.0%) | 0 (0.0%) |
| Graduate Degree | 0 (0.0%) | 0 (0.0%) |
| Total | 63 (42.0%) | 87 (58.0%) |
Employment Characteristics in Winchester
Employment by Class of Employer in Winchester
Among the 4,172 employed individuals in Winchester, private company employees (2,947 | 70.6%), local government employees (349 | 8.4%), and state government employees (283 | 6.8%) make up the most common classes of employment.
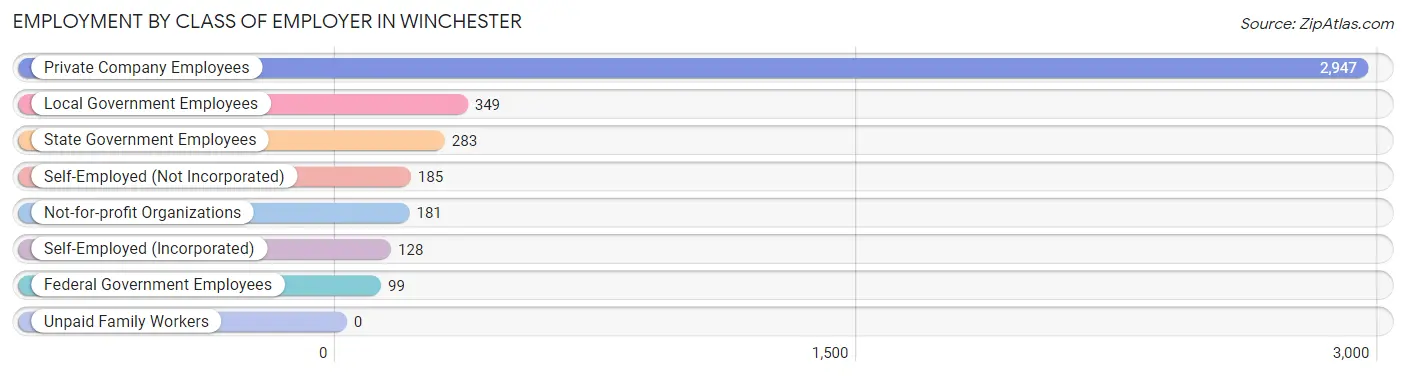
| Employer Class | # Employees | % Employees |
| Private Company Employees | 2,947 | 70.6% |
| Self-Employed (Incorporated) | 128 | 3.1% |
| Self-Employed (Not Incorporated) | 185 | 4.4% |
| Not-for-profit Organizations | 181 | 4.3% |
| Local Government Employees | 349 | 8.4% |
| State Government Employees | 283 | 6.8% |
| Federal Government Employees | 99 | 2.4% |
| Unpaid Family Workers | 0 | 0.0% |
| Total | 4,172 | 100.0% |
Employment Status by Age in Winchester
According to the labor force statistics for Winchester, out of the total population over 16 years of age (7,489), 58.4% or 4,374 individuals are in the labor force, with 3.2% or 140 of them unemployed. The age group with the highest labor force participation rate is 35 to 44 years, with 90.5% or 910 individuals in the labor force. Within the labor force, the 30 to 34 years age range has the highest percentage of unemployed individuals, with 9.6% or 41 of them being unemployed.
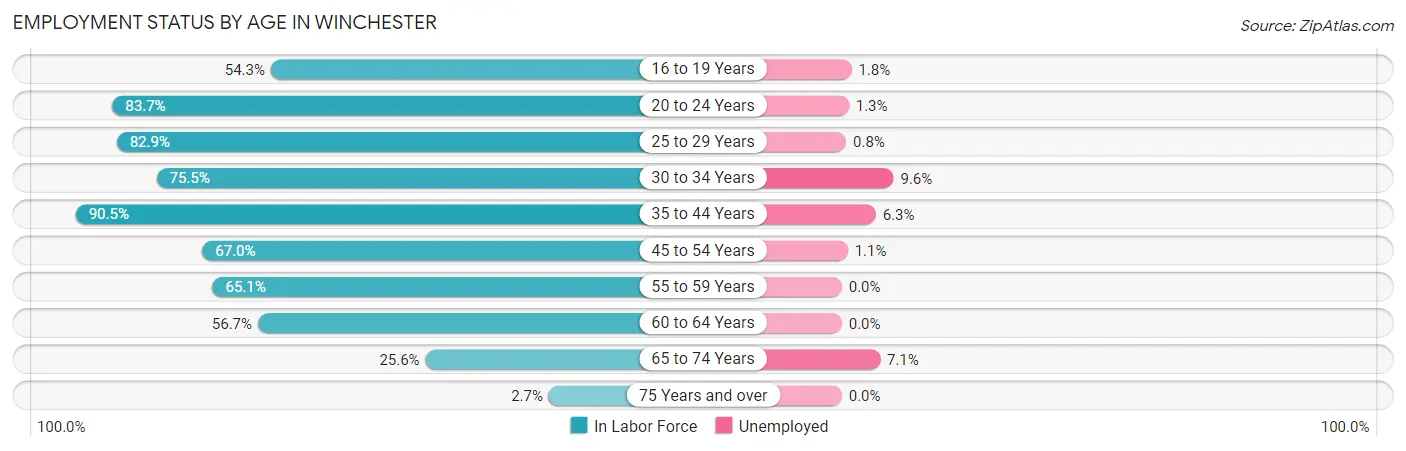
| Age Bracket | In Labor Force | Unemployed |
| 16 to 19 Years | 164 (54.3%) | 3 (1.8%) |
| 20 to 24 Years | 462 (83.7%) | 6 (1.3%) |
| 25 to 29 Years | 501 (82.9%) | 4 (0.8%) |
| 30 to 34 Years | 428 (75.5%) | 41 (9.6%) |
| 35 to 44 Years | 910 (90.5%) | 57 (6.3%) |
| 45 to 54 Years | 756 (67.0%) | 8 (1.1%) |
| 55 to 59 Years | 514 (65.1%) | 0 (0.0%) |
| 60 to 64 Years | 345 (56.7%) | 0 (0.0%) |
| 65 to 74 Years | 266 (25.6%) | 19 (7.1%) |
| 75 Years and over | 24 (2.7%) | 0 (0.0%) |
| Total | 4,374 (58.4%) | 140 (3.2%) |
Employment Status by Educational Attainment in Winchester
According to labor force statistics for Winchester, 73.4% of individuals (3,453) out of the total population between 25 and 64 years of age (4,704) are in the labor force, with 3.2% or 110 of them being unemployed. The group with the highest labor force participation rate are those with the educational attainment of bachelor's degree or higher, with 88.8% or 1,059 individuals in the labor force. Within the labor force, individuals with college / associate degree education have the highest percentage of unemployment, with 4.9% or 49 of them being unemployed.
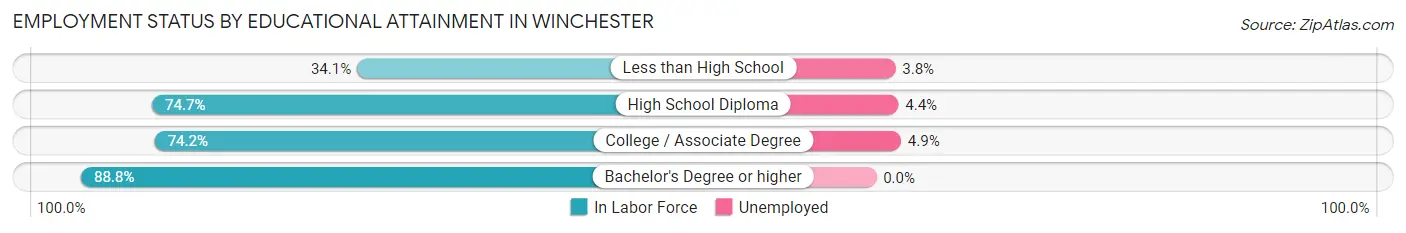
| Educational Attainment | In Labor Force | Unemployed |
| Less than High School | 185 (34.1%) | 21 (3.8%) |
| High School Diploma | 1,219 (74.7%) | 72 (4.4%) |
| College / Associate Degree | 991 (74.2%) | 65 (4.9%) |
| Bachelor's Degree or higher | 1,059 (88.8%) | 0 (0.0%) |
| Total | 3,453 (73.4%) | 151 (3.2%) |
Employment Occupations by Sex in Winchester
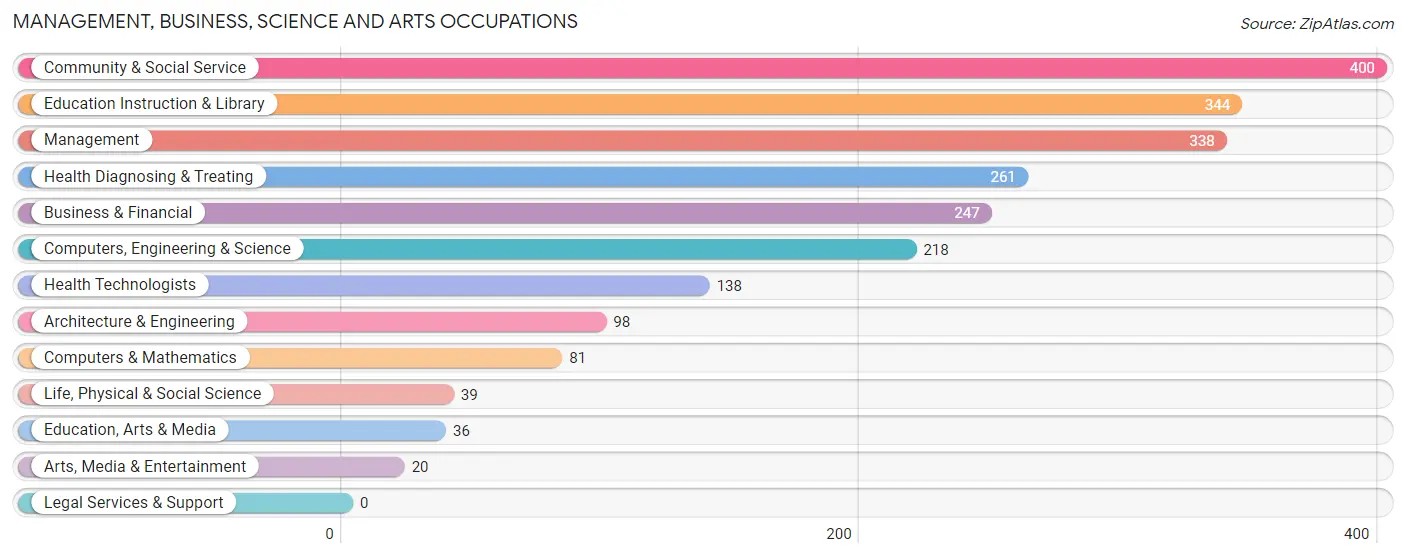
Management, Business, Science and Arts Occupations
The most common Management, Business, Science and Arts occupations in Winchester are Community & Social Service (400 | 9.5%), Education Instruction & Library (344 | 8.1%), Management (338 | 8.0%), Health Diagnosing & Treating (261 | 6.2%), and Business & Financial (247 | 5.8%).
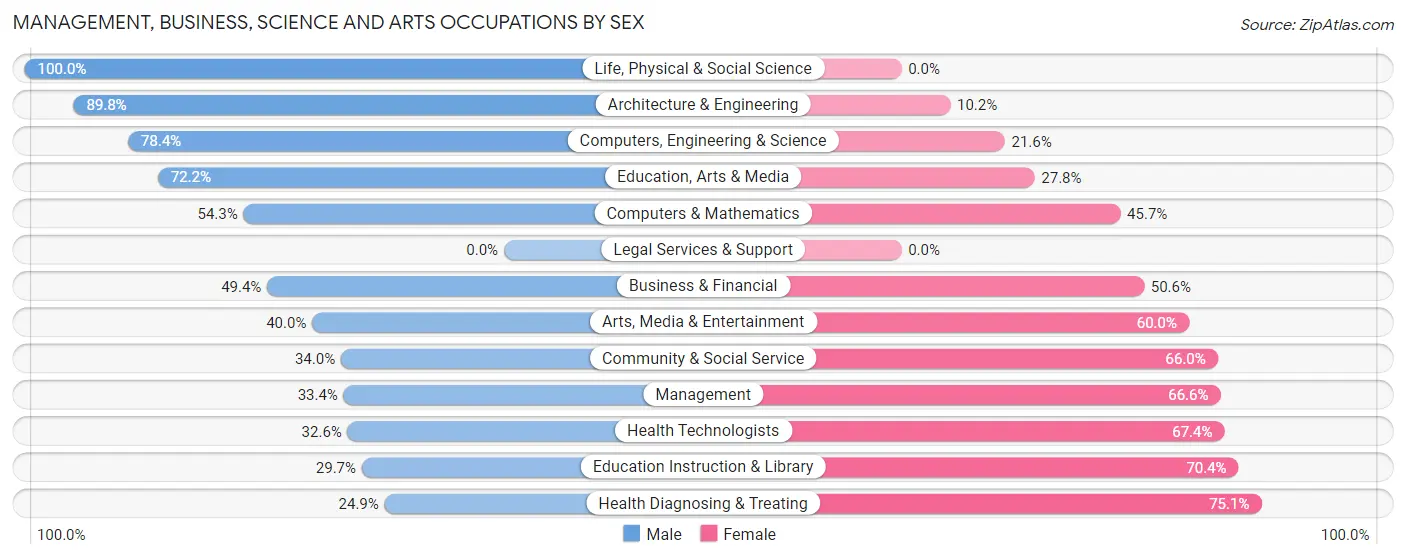
Management, Business, Science and Arts Occupations by Sex
Within the Management, Business, Science and Arts occupations in Winchester, the most male-oriented occupations are Life, Physical & Social Science (100.0%), Architecture & Engineering (89.8%), and Computers, Engineering & Science (78.4%), while the most female-oriented occupations are Health Diagnosing & Treating (75.1%), Education Instruction & Library (70.4%), and Health Technologists (67.4%).
| Occupation | Male | Female |
| Management | 113 (33.4%) | 225 (66.6%) |
| Business & Financial | 122 (49.4%) | 125 (50.6%) |
| Computers, Engineering & Science | 171 (78.4%) | 47 (21.6%) |
| Computers & Mathematics | 44 (54.3%) | 37 (45.7%) |
| Architecture & Engineering | 88 (89.8%) | 10 (10.2%) |
| Life, Physical & Social Science | 39 (100.0%) | 0 (0.0%) |
| Community & Social Service | 136 (34.0%) | 264 (66.0%) |
| Education, Arts & Media | 26 (72.2%) | 10 (27.8%) |
| Legal Services & Support | 0 (0.0%) | 0 (0.0%) |
| Education Instruction & Library | 102 (29.6%) | 242 (70.4%) |
| Arts, Media & Entertainment | 8 (40.0%) | 12 (60.0%) |
| Health Diagnosing & Treating | 65 (24.9%) | 196 (75.1%) |
| Health Technologists | 45 (32.6%) | 93 (67.4%) |
| Total (Category) | 607 (41.5%) | 857 (58.5%) |
| Total (Overall) | 2,126 (50.2%) | 2,106 (49.8%) |
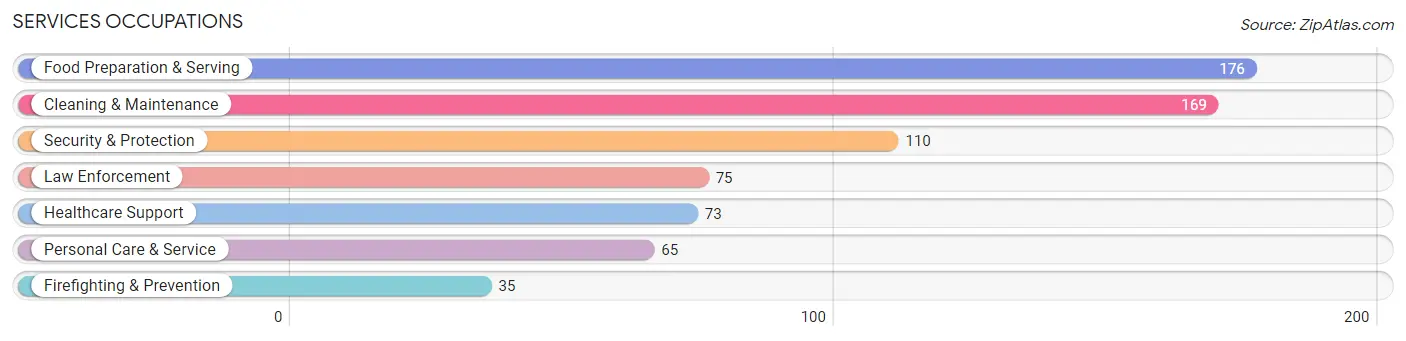
Services Occupations
The most common Services occupations in Winchester are Food Preparation & Serving (176 | 4.2%), Cleaning & Maintenance (169 | 4.0%), Security & Protection (110 | 2.6%), Law Enforcement (75 | 1.8%), and Healthcare Support (73 | 1.7%).
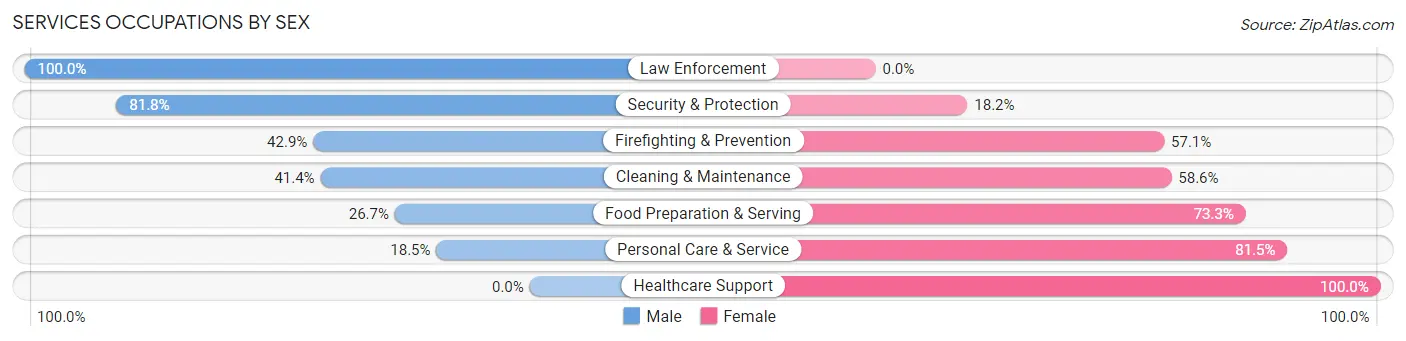
Services Occupations by Sex
Within the Services occupations in Winchester, the most male-oriented occupations are Law Enforcement (100.0%), Security & Protection (81.8%), and Firefighting & Prevention (42.9%), while the most female-oriented occupations are Healthcare Support (100.0%), Personal Care & Service (81.5%), and Food Preparation & Serving (73.3%).
| Occupation | Male | Female |
| Healthcare Support | 0 (0.0%) | 73 (100.0%) |
| Security & Protection | 90 (81.8%) | 20 (18.2%) |
| Firefighting & Prevention | 15 (42.9%) | 20 (57.1%) |
| Law Enforcement | 75 (100.0%) | 0 (0.0%) |
| Food Preparation & Serving | 47 (26.7%) | 129 (73.3%) |
| Cleaning & Maintenance | 70 (41.4%) | 99 (58.6%) |
| Personal Care & Service | 12 (18.5%) | 53 (81.5%) |
| Total (Category) | 219 (36.9%) | 374 (63.1%) |
| Total (Overall) | 2,126 (50.2%) | 2,106 (49.8%) |
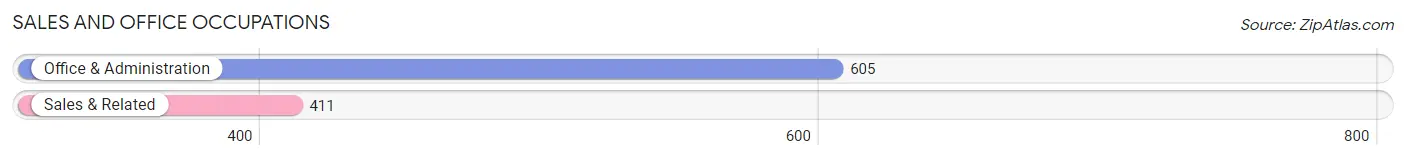
Sales and Office Occupations
The most common Sales and Office occupations in Winchester are Office & Administration (605 | 14.3%), and Sales & Related (411 | 9.7%).
Sales and Office Occupations by Sex
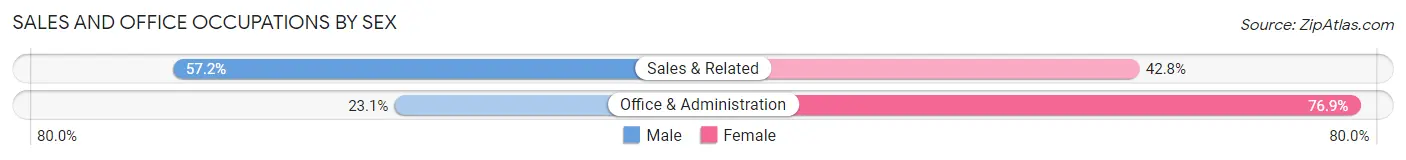
| Occupation | Male | Female |
| Sales & Related | 235 (57.2%) | 176 (42.8%) |
| Office & Administration | 140 (23.1%) | 465 (76.9%) |
| Total (Category) | 375 (36.9%) | 641 (63.1%) |
| Total (Overall) | 2,126 (50.2%) | 2,106 (49.8%) |
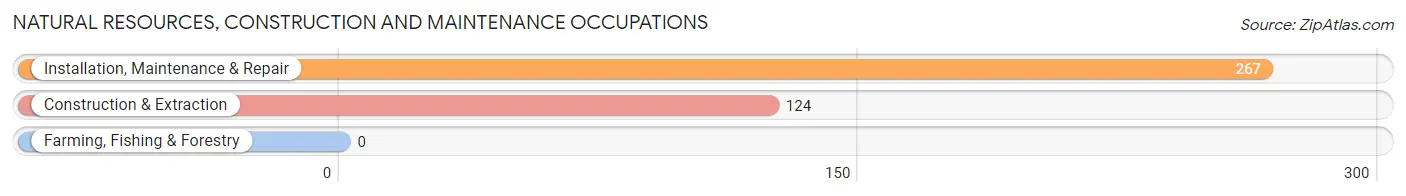
Natural Resources, Construction and Maintenance Occupations
The most common Natural Resources, Construction and Maintenance occupations in Winchester are Installation, Maintenance & Repair (267 | 6.3%), and Construction & Extraction (124 | 2.9%).
Natural Resources, Construction and Maintenance Occupations by Sex
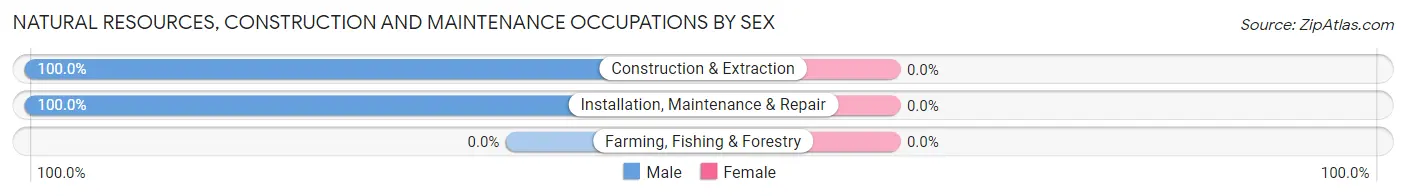
| Occupation | Male | Female |
| Farming, Fishing & Forestry | 0 (0.0%) | 0 (0.0%) |
| Construction & Extraction | 124 (100.0%) | 0 (0.0%) |
| Installation, Maintenance & Repair | 267 (100.0%) | 0 (0.0%) |
| Total (Category) | 391 (100.0%) | 0 (0.0%) |
| Total (Overall) | 2,126 (50.2%) | 2,106 (49.8%) |
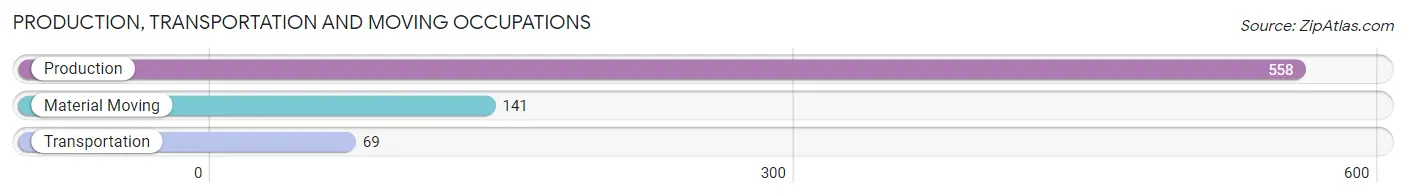
Production, Transportation and Moving Occupations
The most common Production, Transportation and Moving occupations in Winchester are Production (558 | 13.2%), Material Moving (141 | 3.3%), and Transportation (69 | 1.6%).
Production, Transportation and Moving Occupations by Sex
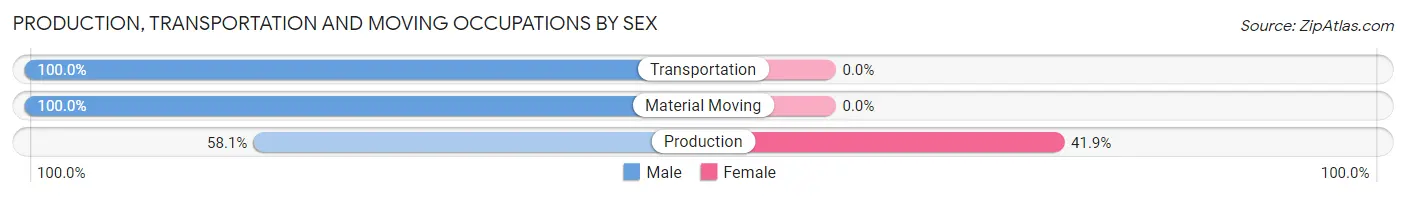
| Occupation | Male | Female |
| Production | 324 (58.1%) | 234 (41.9%) |
| Transportation | 69 (100.0%) | 0 (0.0%) |
| Material Moving | 141 (100.0%) | 0 (0.0%) |
| Total (Category) | 534 (69.5%) | 234 (30.5%) |
| Total (Overall) | 2,126 (50.2%) | 2,106 (49.8%) |
Employment Industries by Sex in Winchester
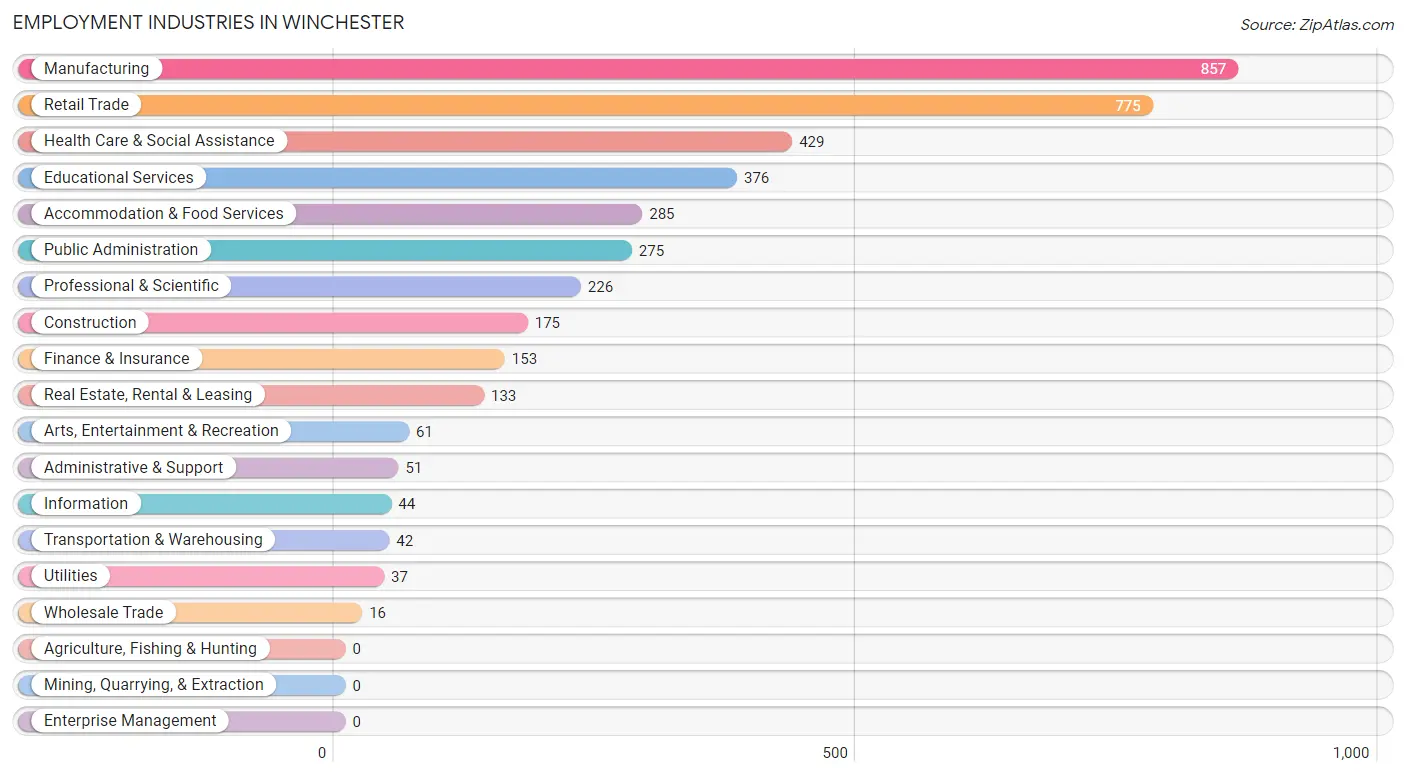
Employment Industries in Winchester
The major employment industries in Winchester include Manufacturing (857 | 20.3%), Retail Trade (775 | 18.3%), Health Care & Social Assistance (429 | 10.1%), Educational Services (376 | 8.9%), and Accommodation & Food Services (285 | 6.7%).
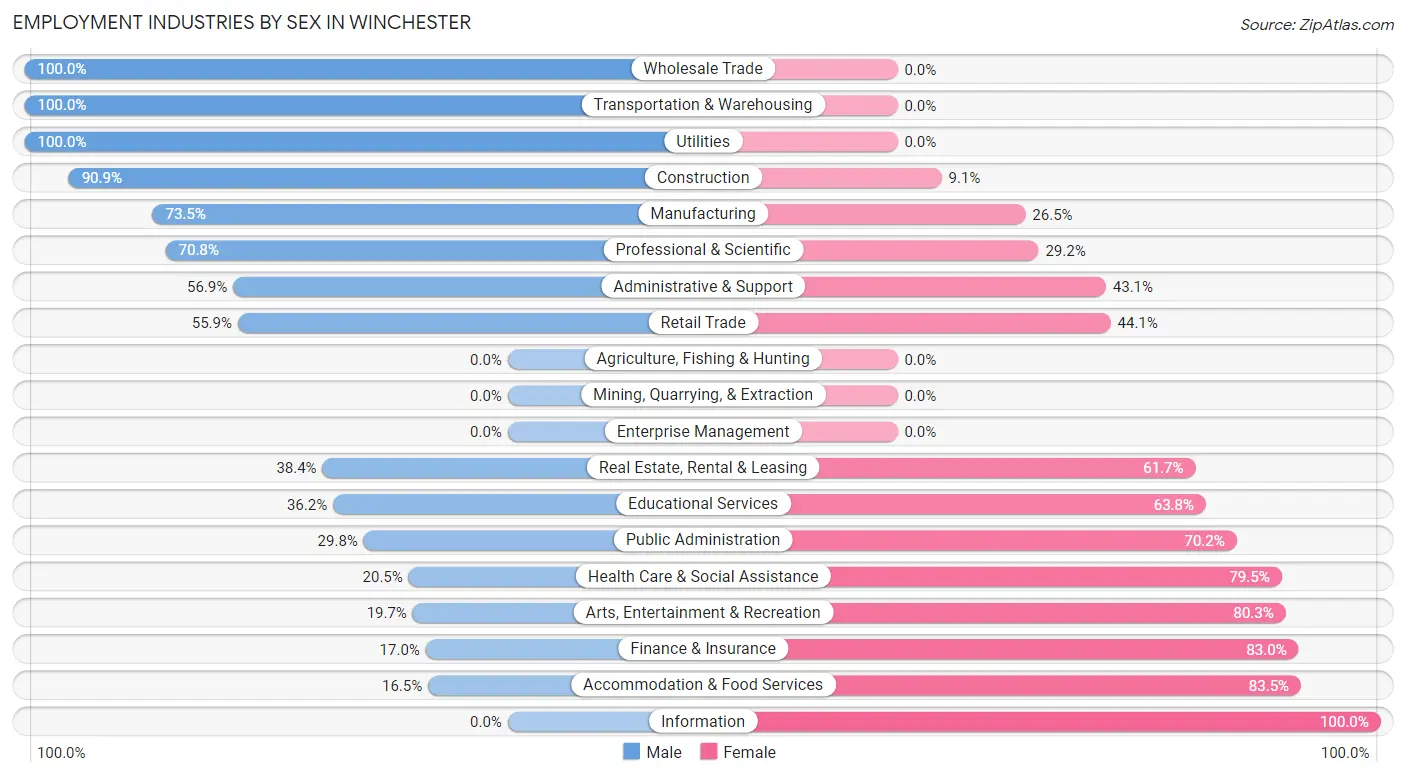
Employment Industries by Sex in Winchester
The Winchester industries that see more men than women are Wholesale Trade (100.0%), Transportation & Warehousing (100.0%), and Utilities (100.0%), whereas the industries that tend to have a higher number of women are Information (100.0%), Accommodation & Food Services (83.5%), and Finance & Insurance (83.0%).
| Industry | Male | Female |
| Agriculture, Fishing & Hunting | 0 (0.0%) | 0 (0.0%) |
| Mining, Quarrying, & Extraction | 0 (0.0%) | 0 (0.0%) |
| Construction | 159 (90.9%) | 16 (9.1%) |
| Manufacturing | 630 (73.5%) | 227 (26.5%) |
| Wholesale Trade | 16 (100.0%) | 0 (0.0%) |
| Retail Trade | 433 (55.9%) | 342 (44.1%) |
| Transportation & Warehousing | 42 (100.0%) | 0 (0.0%) |
| Utilities | 37 (100.0%) | 0 (0.0%) |
| Information | 0 (0.0%) | 44 (100.0%) |
| Finance & Insurance | 26 (17.0%) | 127 (83.0%) |
| Real Estate, Rental & Leasing | 51 (38.4%) | 82 (61.7%) |
| Professional & Scientific | 160 (70.8%) | 66 (29.2%) |
| Enterprise Management | 0 (0.0%) | 0 (0.0%) |
| Administrative & Support | 29 (56.9%) | 22 (43.1%) |
| Educational Services | 136 (36.2%) | 240 (63.8%) |
| Health Care & Social Assistance | 88 (20.5%) | 341 (79.5%) |
| Arts, Entertainment & Recreation | 12 (19.7%) | 49 (80.3%) |
| Accommodation & Food Services | 47 (16.5%) | 238 (83.5%) |
| Public Administration | 82 (29.8%) | 193 (70.2%) |
| Total | 2,126 (50.2%) | 2,106 (49.8%) |
Education in Winchester
School Enrollment in Winchester
The most common levels of schooling among the 2,058 students in Winchester are elementary school (647 | 31.4%), middle school (401 | 19.5%), and college / undergraduate (358 | 17.4%).
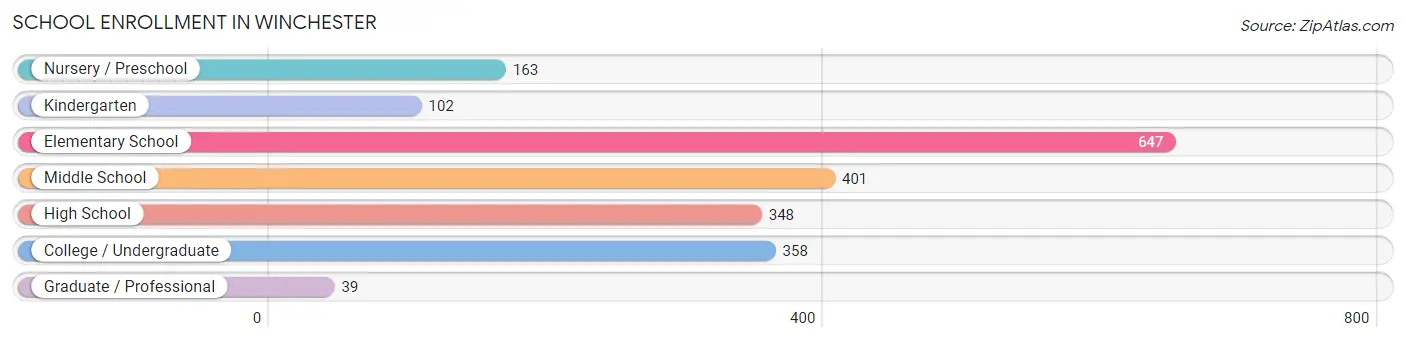
| School Level | # Students | % Students |
| Nursery / Preschool | 163 | 7.9% |
| Kindergarten | 102 | 5.0% |
| Elementary School | 647 | 31.4% |
| Middle School | 401 | 19.5% |
| High School | 348 | 16.9% |
| College / Undergraduate | 358 | 17.4% |
| Graduate / Professional | 39 | 1.9% |
| Total | 2,058 | 100.0% |
School Enrollment by Age by Funding Source in Winchester
Out of a total of 2,058 students who are enrolled in schools in Winchester, 270 (13.1%) attend a private institution, while the remaining 1,788 (86.9%) are enrolled in public schools. The age group of 3 to 4 year olds has the highest likelihood of being enrolled in private schools, with 49 (90.7% in the age bracket) enrolled. Conversely, the age group of 25 to 34 year olds has the lowest likelihood of being enrolled in a private school, with 108 (100.0% in the age bracket) attending a public institution.
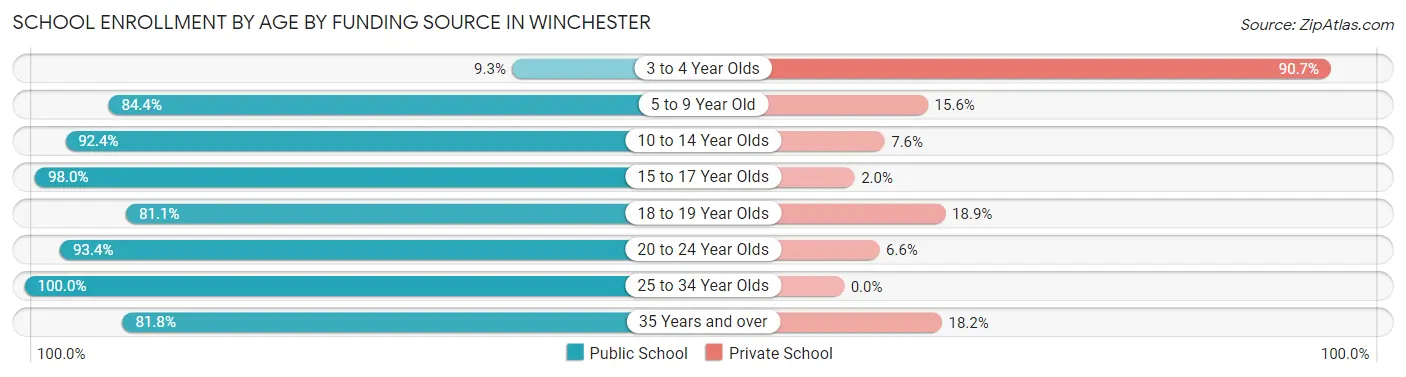
| Age Bracket | Public School | Private School |
| 3 to 4 Year Olds | 5 (9.3%) | 49 (90.7%) |
| 5 to 9 Year Old | 642 (84.4%) | 119 (15.6%) |
| 10 to 14 Year Olds | 452 (92.4%) | 37 (7.6%) |
| 15 to 17 Year Olds | 249 (98.0%) | 5 (2.0%) |
| 18 to 19 Year Olds | 103 (81.1%) | 24 (18.9%) |
| 20 to 24 Year Olds | 99 (93.4%) | 7 (6.6%) |
| 25 to 34 Year Olds | 108 (100.0%) | 0 (0.0%) |
| 35 Years and over | 130 (81.8%) | 29 (18.2%) |
| Total | 1,788 (86.9%) | 270 (13.1%) |
Educational Attainment by Field of Study in Winchester
Science & technology (481 | 24.4%), business (348 | 17.7%), education (315 | 16.0%), engineering (208 | 10.6%), and arts & humanities (181 | 9.2%) are the most common fields of study among 1,968 individuals in Winchester who have obtained a bachelor's degree or higher.
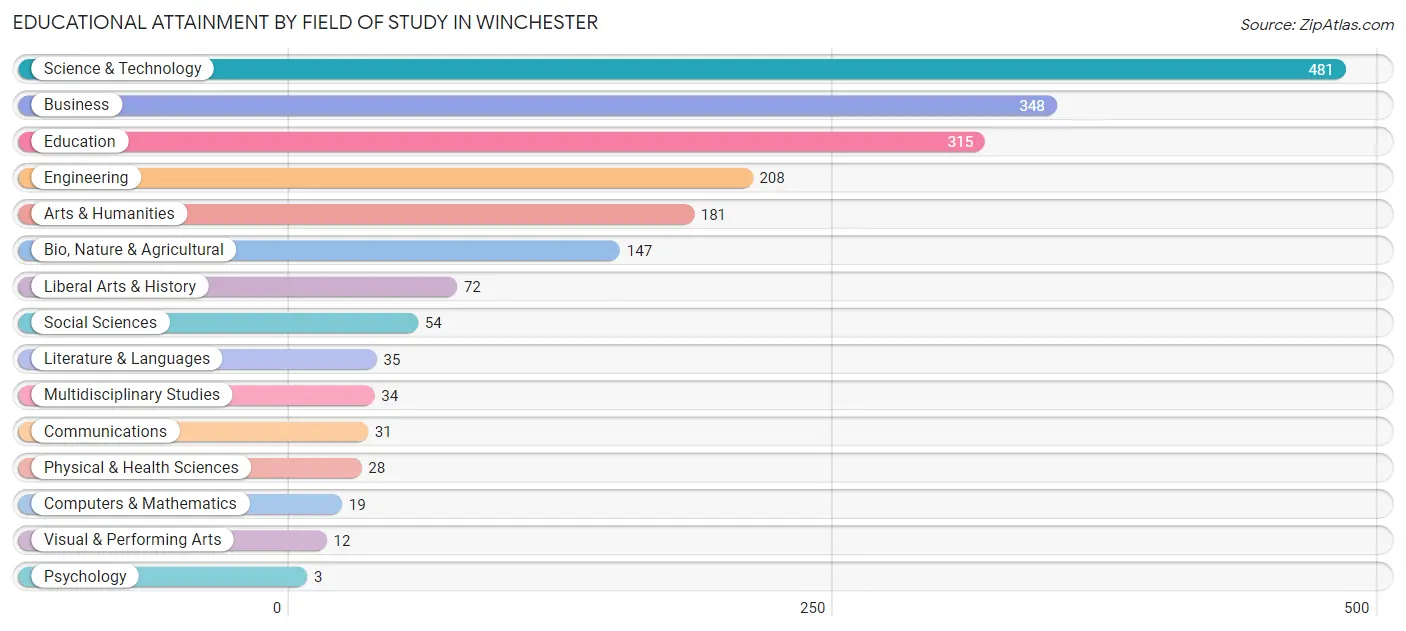
| Field of Study | # Graduates | % Graduates |
| Computers & Mathematics | 19 | 1.0% |
| Bio, Nature & Agricultural | 147 | 7.5% |
| Physical & Health Sciences | 28 | 1.4% |
| Psychology | 3 | 0.2% |
| Social Sciences | 54 | 2.7% |
| Engineering | 208 | 10.6% |
| Multidisciplinary Studies | 34 | 1.7% |
| Science & Technology | 481 | 24.4% |
| Business | 348 | 17.7% |
| Education | 315 | 16.0% |
| Literature & Languages | 35 | 1.8% |
| Liberal Arts & History | 72 | 3.7% |
| Visual & Performing Arts | 12 | 0.6% |
| Communications | 31 | 1.6% |
| Arts & Humanities | 181 | 9.2% |
| Total | 1,968 | 100.0% |
Transportation & Commute in Winchester
Vehicle Availability by Sex in Winchester
The most prevalent vehicle ownership categories in Winchester are males with 2 vehicles (1,025, accounting for 49.4%) and females with 2 vehicles (861, making up 48.9%).
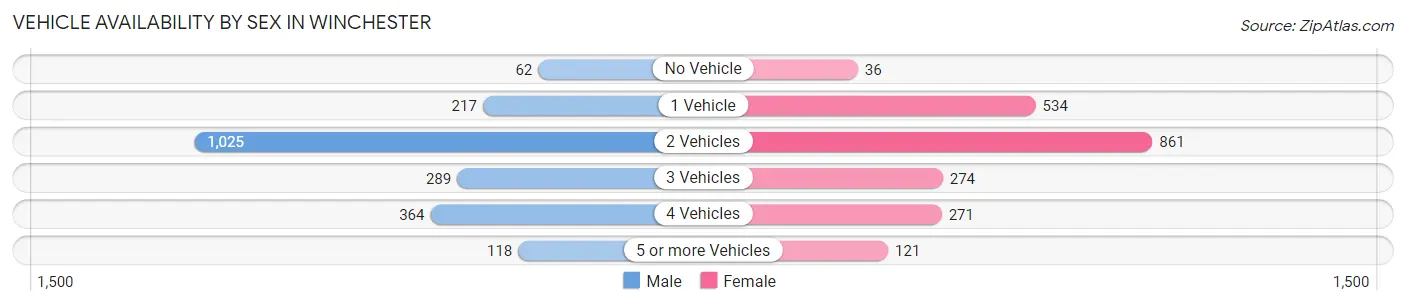
| Vehicles Available | Male | Female |
| No Vehicle | 62 (3.0%) | 36 (1.7%) |
| 1 Vehicle | 217 (10.5%) | 534 (25.5%) |
| 2 Vehicles | 1,025 (49.4%) | 861 (41.1%) |
| 3 Vehicles | 289 (13.9%) | 274 (13.1%) |
| 4 Vehicles | 364 (17.5%) | 271 (12.9%) |
| 5 or more Vehicles | 118 (5.7%) | 121 (5.8%) |
| Total | 2,075 (100.0%) | 2,097 (100.0%) |
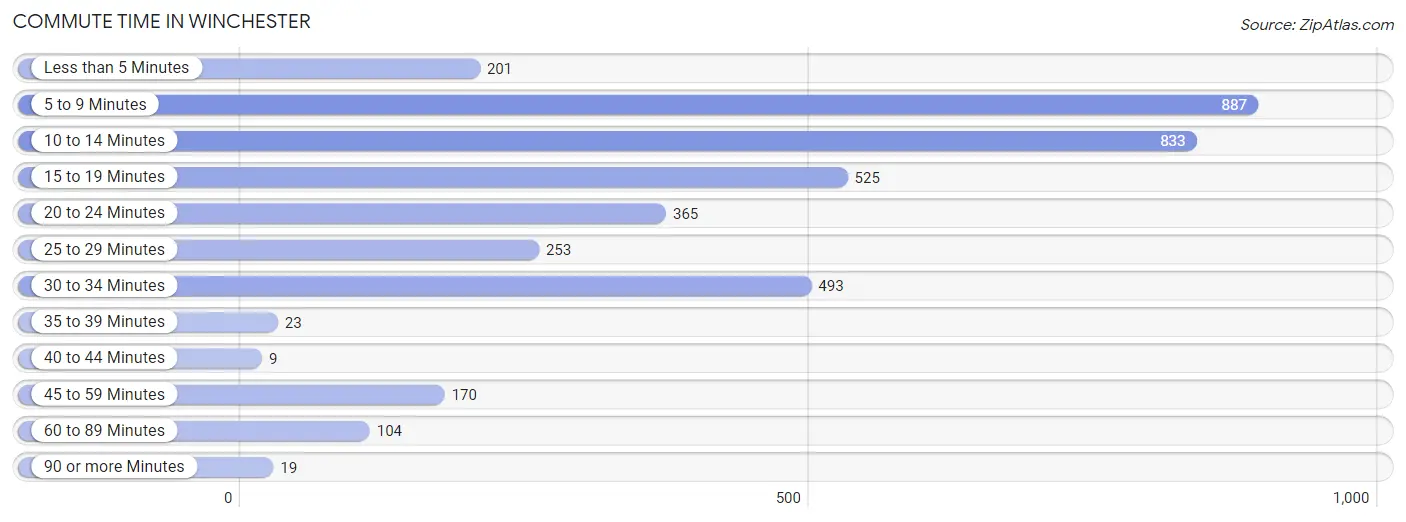
Commute Time in Winchester
The most frequently occuring commute durations in Winchester are 5 to 9 minutes (887 commuters, 22.9%), 10 to 14 minutes (833 commuters, 21.5%), and 15 to 19 minutes (525 commuters, 13.5%).
| Commute Time | # Commuters | % Commuters |
| Less than 5 Minutes | 201 | 5.2% |
| 5 to 9 Minutes | 887 | 22.9% |
| 10 to 14 Minutes | 833 | 21.5% |
| 15 to 19 Minutes | 525 | 13.5% |
| 20 to 24 Minutes | 365 | 9.4% |
| 25 to 29 Minutes | 253 | 6.5% |
| 30 to 34 Minutes | 493 | 12.7% |
| 35 to 39 Minutes | 23 | 0.6% |
| 40 to 44 Minutes | 9 | 0.2% |
| 45 to 59 Minutes | 170 | 4.4% |
| 60 to 89 Minutes | 104 | 2.7% |
| 90 or more Minutes | 19 | 0.5% |
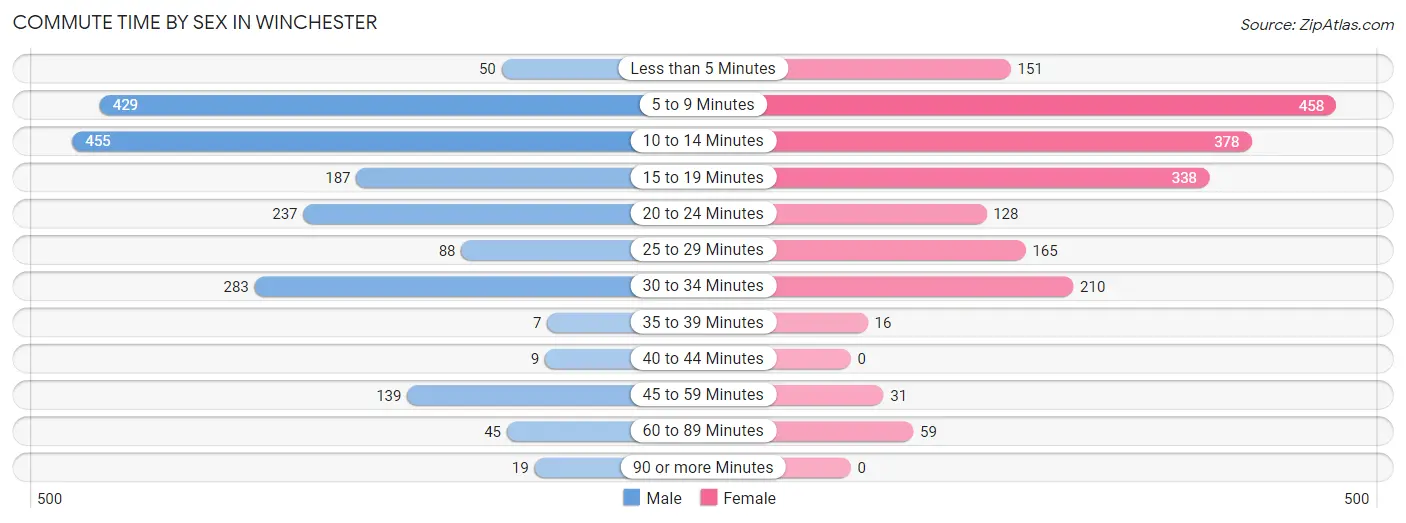
Commute Time by Sex in Winchester
The most common commute times in Winchester are 10 to 14 minutes (455 commuters, 23.4%) for males and 5 to 9 minutes (458 commuters, 23.7%) for females.
| Commute Time | Male | Female |
| Less than 5 Minutes | 50 (2.6%) | 151 (7.8%) |
| 5 to 9 Minutes | 429 (22.0%) | 458 (23.7%) |
| 10 to 14 Minutes | 455 (23.4%) | 378 (19.5%) |
| 15 to 19 Minutes | 187 (9.6%) | 338 (17.5%) |
| 20 to 24 Minutes | 237 (12.2%) | 128 (6.6%) |
| 25 to 29 Minutes | 88 (4.5%) | 165 (8.5%) |
| 30 to 34 Minutes | 283 (14.5%) | 210 (10.9%) |
| 35 to 39 Minutes | 7 (0.4%) | 16 (0.8%) |
| 40 to 44 Minutes | 9 (0.5%) | 0 (0.0%) |
| 45 to 59 Minutes | 139 (7.1%) | 31 (1.6%) |
| 60 to 89 Minutes | 45 (2.3%) | 59 (3.0%) |
| 90 or more Minutes | 19 (1.0%) | 0 (0.0%) |
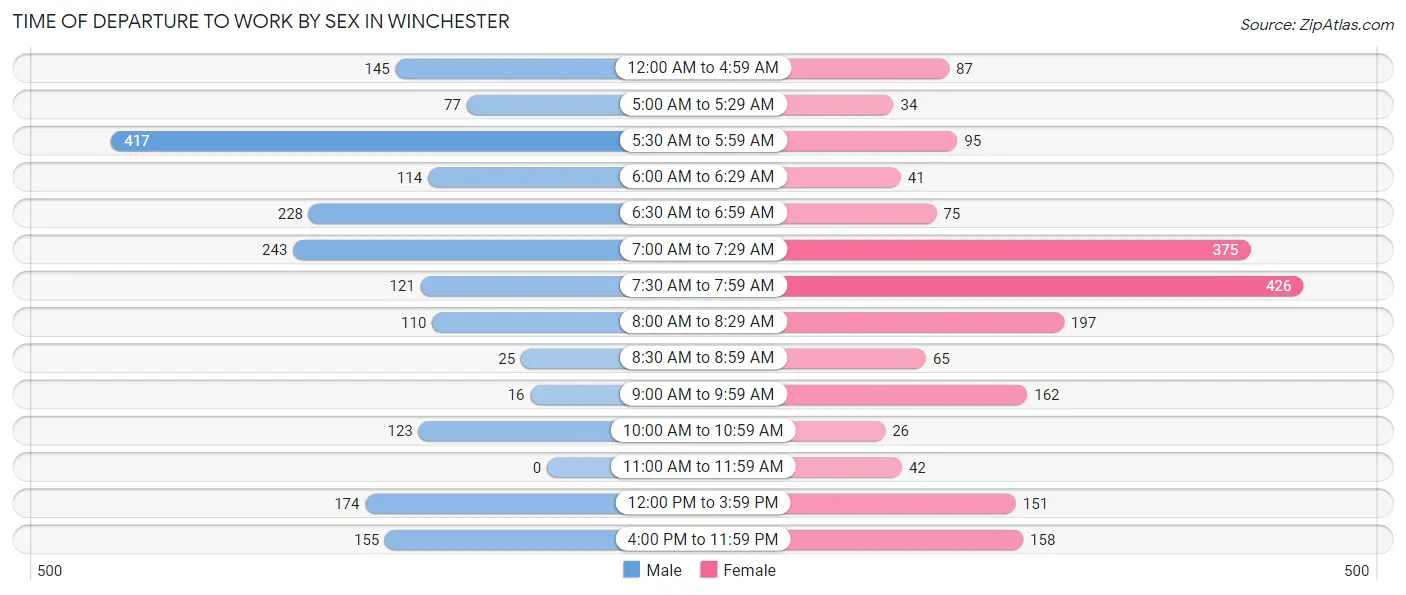
Time of Departure to Work by Sex in Winchester
The most frequent times of departure to work in Winchester are 5:30 AM to 5:59 AM (417, 21.4%) for males and 7:30 AM to 7:59 AM (426, 22.0%) for females.
| Time of Departure | Male | Female |
| 12:00 AM to 4:59 AM | 145 (7.4%) | 87 (4.5%) |
| 5:00 AM to 5:29 AM | 77 (4.0%) | 34 (1.8%) |
| 5:30 AM to 5:59 AM | 417 (21.4%) | 95 (4.9%) |
| 6:00 AM to 6:29 AM | 114 (5.9%) | 41 (2.1%) |
| 6:30 AM to 6:59 AM | 228 (11.7%) | 75 (3.9%) |
| 7:00 AM to 7:29 AM | 243 (12.5%) | 375 (19.4%) |
| 7:30 AM to 7:59 AM | 121 (6.2%) | 426 (22.0%) |
| 8:00 AM to 8:29 AM | 110 (5.7%) | 197 (10.2%) |
| 8:30 AM to 8:59 AM | 25 (1.3%) | 65 (3.4%) |
| 9:00 AM to 9:59 AM | 16 (0.8%) | 162 (8.4%) |
| 10:00 AM to 10:59 AM | 123 (6.3%) | 26 (1.3%) |
| 11:00 AM to 11:59 AM | 0 (0.0%) | 42 (2.2%) |
| 12:00 PM to 3:59 PM | 174 (8.9%) | 151 (7.8%) |
| 4:00 PM to 11:59 PM | 155 (8.0%) | 158 (8.2%) |
| Total | 1,948 (100.0%) | 1,934 (100.0%) |
Housing Occupancy in Winchester
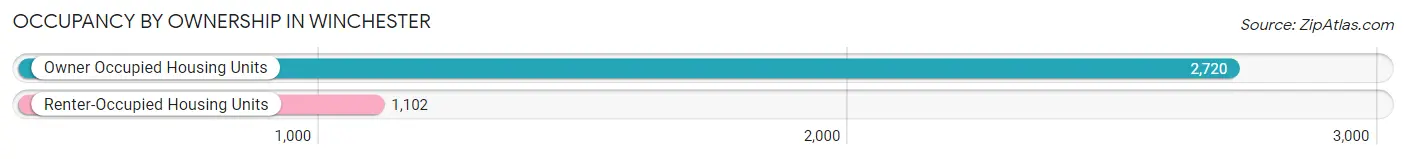
Occupancy by Ownership in Winchester
Of the total 3,822 dwellings in Winchester, owner-occupied units account for 2,720 (71.2%), while renter-occupied units make up 1,102 (28.8%).
| Occupancy | # Housing Units | % Housing Units |
| Owner Occupied Housing Units | 2,720 | 71.2% |
| Renter-Occupied Housing Units | 1,102 | 28.8% |
| Total Occupied Housing Units | 3,822 | 100.0% |
Occupancy by Household Size in Winchester
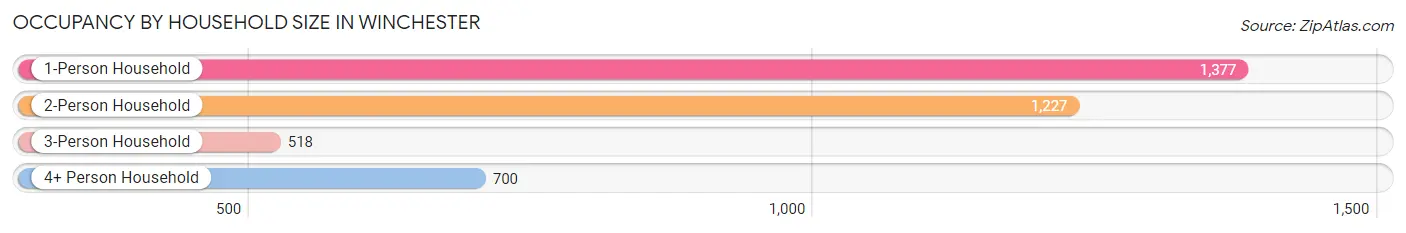
| Household Size | # Housing Units | % Housing Units |
| 1-Person Household | 1,377 | 36.0% |
| 2-Person Household | 1,227 | 32.1% |
| 3-Person Household | 518 | 13.6% |
| 4+ Person Household | 700 | 18.3% |
| Total Housing Units | 3,822 | 100.0% |
Occupancy by Ownership by Household Size in Winchester
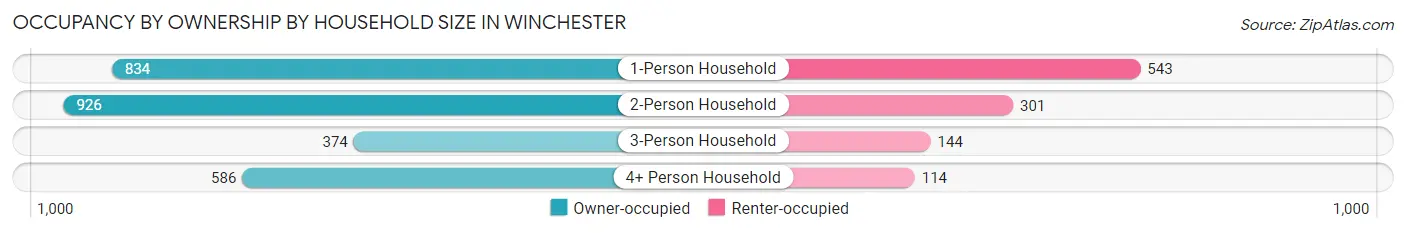
| Household Size | Owner-occupied | Renter-occupied |
| 1-Person Household | 834 (60.6%) | 543 (39.4%) |
| 2-Person Household | 926 (75.5%) | 301 (24.5%) |
| 3-Person Household | 374 (72.2%) | 144 (27.8%) |
| 4+ Person Household | 586 (83.7%) | 114 (16.3%) |
| Total Housing Units | 2,720 (71.2%) | 1,102 (28.8%) |
Occupancy by Educational Attainment in Winchester
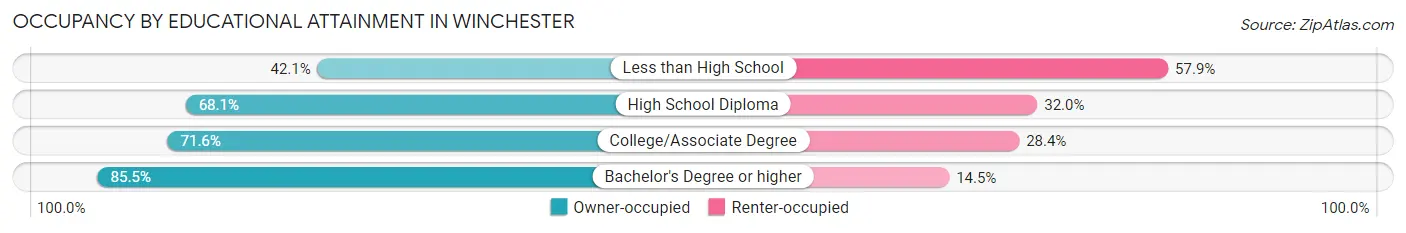
| Household Size | Owner-occupied | Renter-occupied |
| Less than High School | 160 (42.1%) | 220 (57.9%) |
| High School Diploma | 903 (68.0%) | 424 (32.0%) |
| College/Associate Degree | 783 (71.6%) | 310 (28.4%) |
| Bachelor's Degree or higher | 874 (85.5%) | 148 (14.5%) |
Occupancy by Age of Householder in Winchester
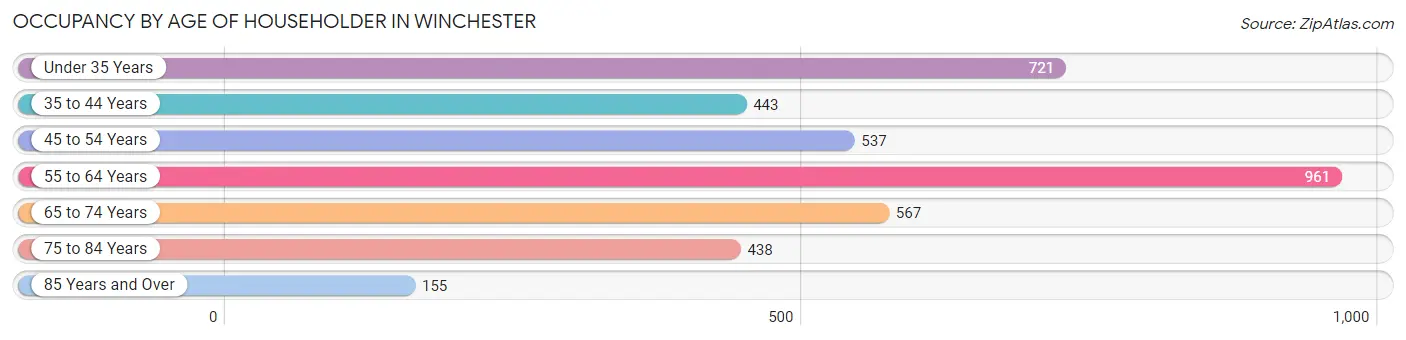
| Age Bracket | # Households | % Households |
| Under 35 Years | 721 | 18.9% |
| 35 to 44 Years | 443 | 11.6% |
| 45 to 54 Years | 537 | 14.1% |
| 55 to 64 Years | 961 | 25.1% |
| 65 to 74 Years | 567 | 14.8% |
| 75 to 84 Years | 438 | 11.5% |
| 85 Years and Over | 155 | 4.1% |
| Total | 3,822 | 100.0% |
Housing Finances in Winchester
Median Income by Occupancy in Winchester
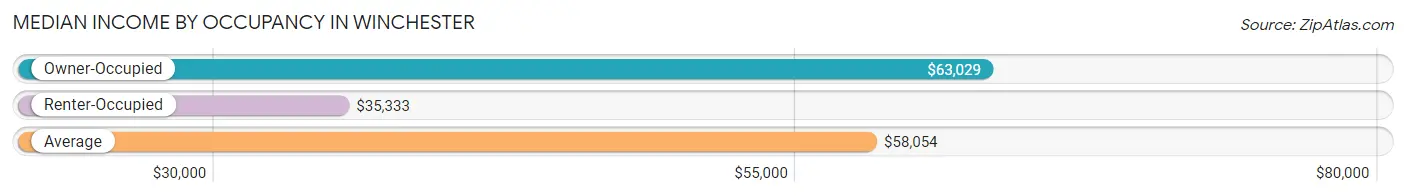
| Occupancy Type | # Households | Median Income |
| Owner-Occupied | 2,720 (71.2%) | $63,029 |
| Renter-Occupied | 1,102 (28.8%) | $35,333 |
| Average | 3,822 (100.0%) | $58,054 |
Occupancy by Householder Income Bracket in Winchester
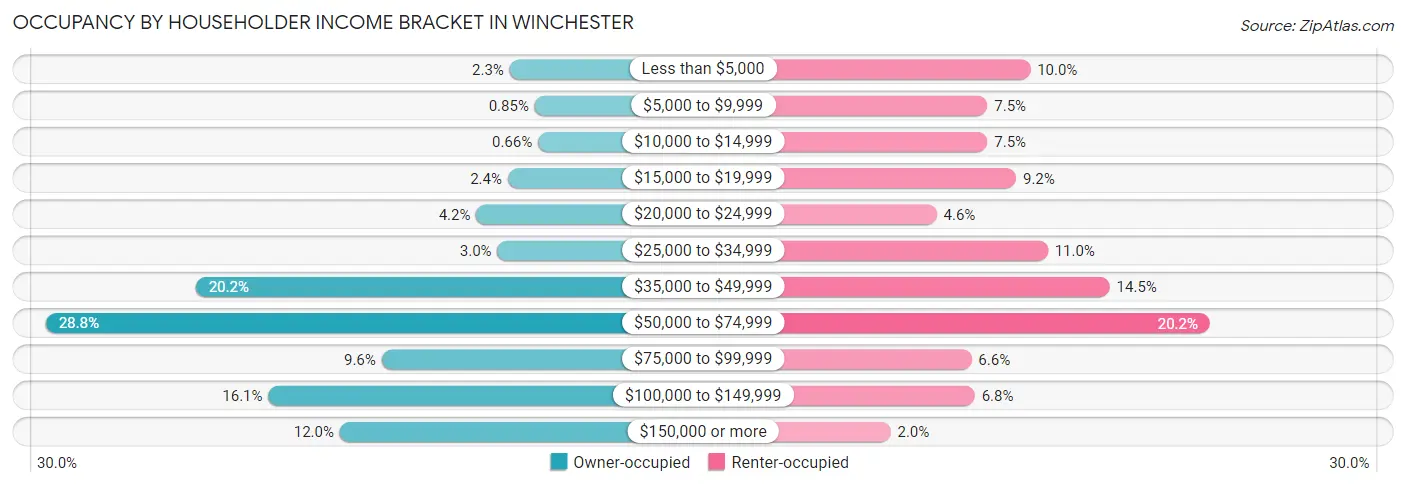
| Income Bracket | Owner-occupied | Renter-occupied |
| Less than $5,000 | 62 (2.3%) | 110 (10.0%) |
| $5,000 to $9,999 | 23 (0.9%) | 83 (7.5%) |
| $10,000 to $14,999 | 18 (0.7%) | 83 (7.5%) |
| $15,000 to $19,999 | 65 (2.4%) | 101 (9.2%) |
| $20,000 to $24,999 | 114 (4.2%) | 51 (4.6%) |
| $25,000 to $34,999 | 81 (3.0%) | 121 (11.0%) |
| $35,000 to $49,999 | 550 (20.2%) | 160 (14.5%) |
| $50,000 to $74,999 | 783 (28.8%) | 223 (20.2%) |
| $75,000 to $99,999 | 261 (9.6%) | 73 (6.6%) |
| $100,000 to $149,999 | 437 (16.1%) | 75 (6.8%) |
| $150,000 or more | 326 (12.0%) | 22 (2.0%) |
| Total | 2,720 (100.0%) | 1,102 (100.0%) |
Monthly Housing Cost Tiers in Winchester
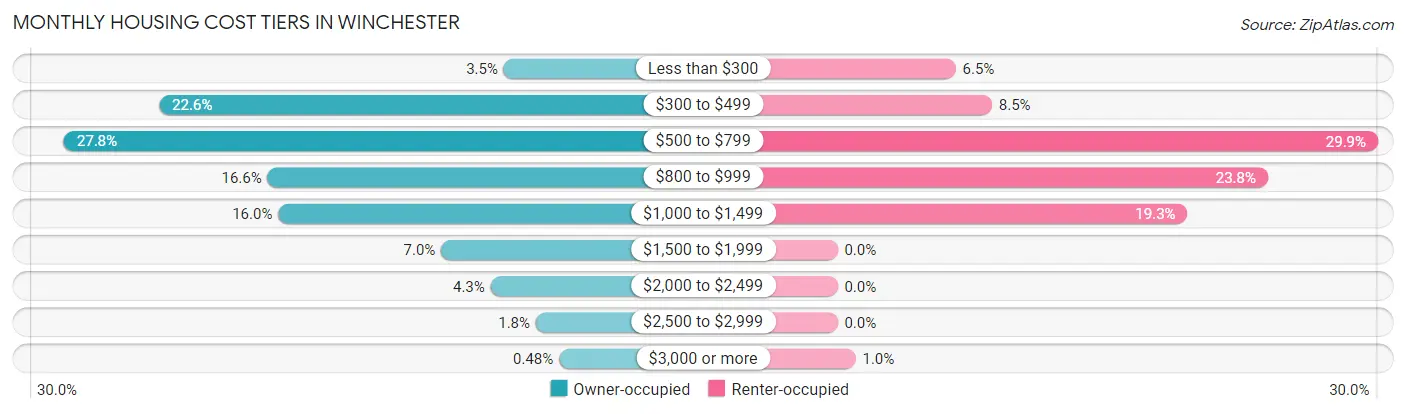
| Monthly Cost | Owner-occupied | Renter-occupied |
| Less than $300 | 96 (3.5%) | 72 (6.5%) |
| $300 to $499 | 614 (22.6%) | 94 (8.5%) |
| $500 to $799 | 757 (27.8%) | 329 (29.8%) |
| $800 to $999 | 451 (16.6%) | 262 (23.8%) |
| $1,000 to $1,499 | 435 (16.0%) | 213 (19.3%) |
| $1,500 to $1,999 | 190 (7.0%) | 0 (0.0%) |
| $2,000 to $2,499 | 116 (4.3%) | 0 (0.0%) |
| $2,500 to $2,999 | 48 (1.8%) | 0 (0.0%) |
| $3,000 or more | 13 (0.5%) | 11 (1.0%) |
| Total | 2,720 (100.0%) | 1,102 (100.0%) |
Physical Housing Characteristics in Winchester
Housing Structures in Winchester
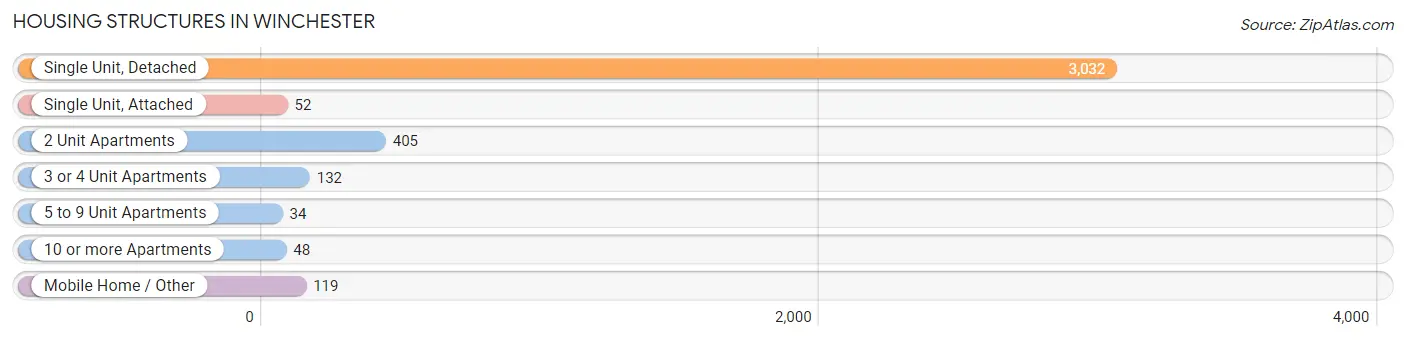
| Structure Type | # Housing Units | % Housing Units |
| Single Unit, Detached | 3,032 | 79.3% |
| Single Unit, Attached | 52 | 1.4% |
| 2 Unit Apartments | 405 | 10.6% |
| 3 or 4 Unit Apartments | 132 | 3.5% |
| 5 to 9 Unit Apartments | 34 | 0.9% |
| 10 or more Apartments | 48 | 1.3% |
| Mobile Home / Other | 119 | 3.1% |
| Total | 3,822 | 100.0% |
Housing Structures by Occupancy in Winchester
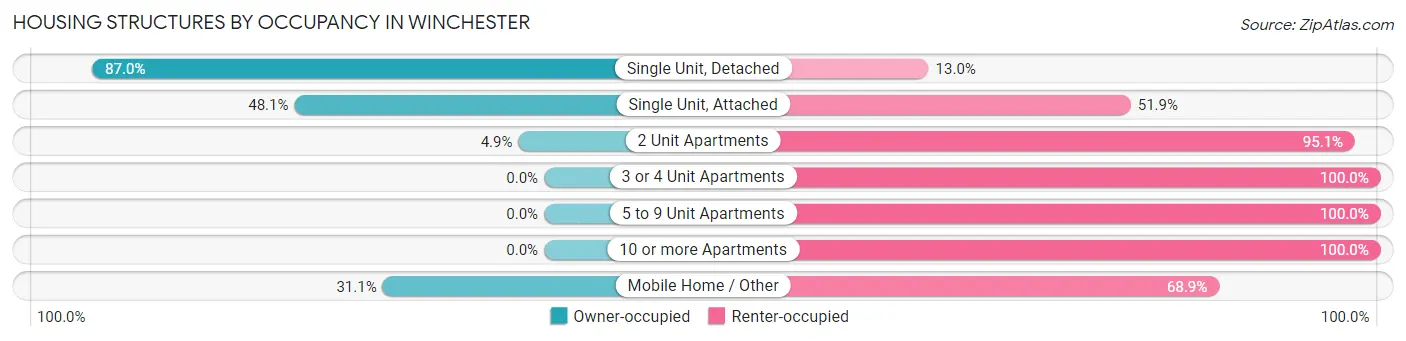
| Structure Type | Owner-occupied | Renter-occupied |
| Single Unit, Detached | 2,638 (87.0%) | 394 (13.0%) |
| Single Unit, Attached | 25 (48.1%) | 27 (51.9%) |
| 2 Unit Apartments | 20 (4.9%) | 385 (95.1%) |
| 3 or 4 Unit Apartments | 0 (0.0%) | 132 (100.0%) |
| 5 to 9 Unit Apartments | 0 (0.0%) | 34 (100.0%) |
| 10 or more Apartments | 0 (0.0%) | 48 (100.0%) |
| Mobile Home / Other | 37 (31.1%) | 82 (68.9%) |
| Total | 2,720 (71.2%) | 1,102 (28.8%) |
Housing Structures by Number of Rooms in Winchester
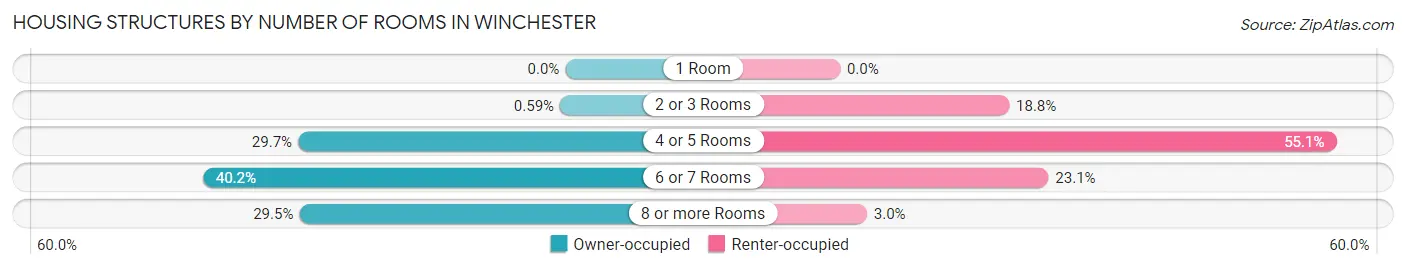
| Number of Rooms | Owner-occupied | Renter-occupied |
| 1 Room | 0 (0.0%) | 0 (0.0%) |
| 2 or 3 Rooms | 16 (0.6%) | 207 (18.8%) |
| 4 or 5 Rooms | 807 (29.7%) | 607 (55.1%) |
| 6 or 7 Rooms | 1,094 (40.2%) | 255 (23.1%) |
| 8 or more Rooms | 803 (29.5%) | 33 (3.0%) |
| Total | 2,720 (100.0%) | 1,102 (100.0%) |
Housing Structure by Heating Type in Winchester
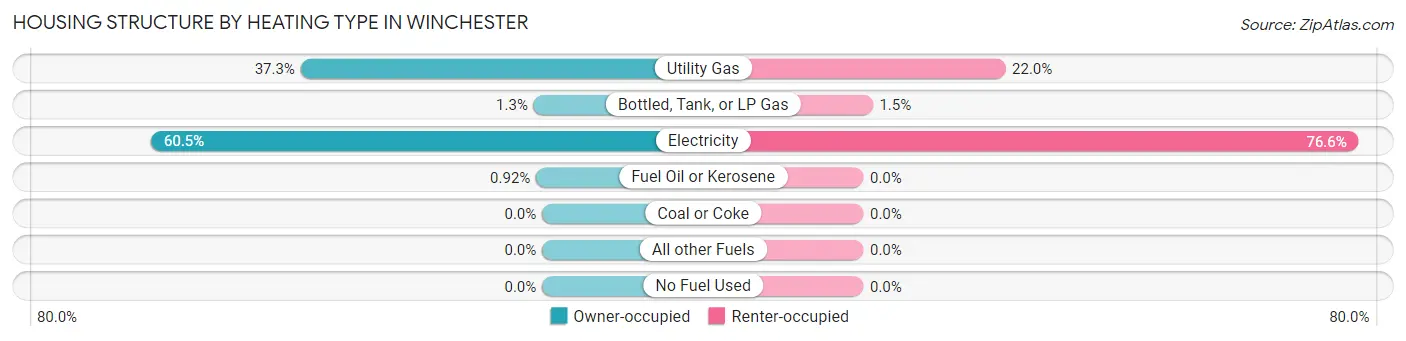
| Heating Type | Owner-occupied | Renter-occupied |
| Utility Gas | 1,015 (37.3%) | 242 (22.0%) |
| Bottled, Tank, or LP Gas | 35 (1.3%) | 16 (1.5%) |
| Electricity | 1,645 (60.5%) | 844 (76.6%) |
| Fuel Oil or Kerosene | 25 (0.9%) | 0 (0.0%) |
| Coal or Coke | 0 (0.0%) | 0 (0.0%) |
| All other Fuels | 0 (0.0%) | 0 (0.0%) |
| No Fuel Used | 0 (0.0%) | 0 (0.0%) |
| Total | 2,720 (100.0%) | 1,102 (100.0%) |
Household Vehicle Usage in Winchester
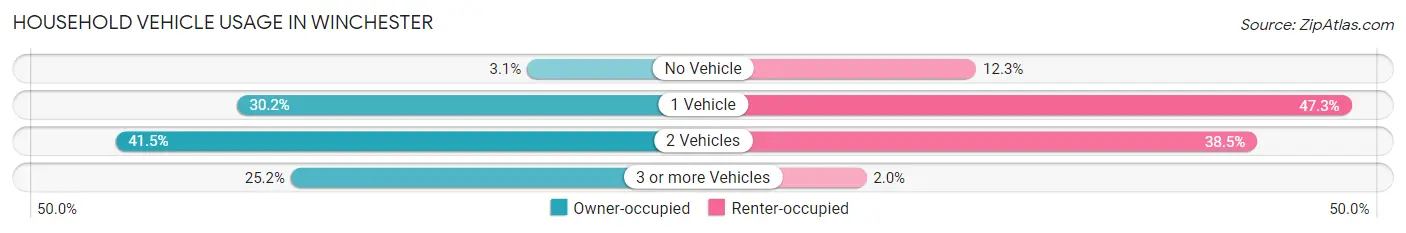
| Vehicles per Household | Owner-occupied | Renter-occupied |
| No Vehicle | 84 (3.1%) | 135 (12.2%) |
| 1 Vehicle | 822 (30.2%) | 521 (47.3%) |
| 2 Vehicles | 1,130 (41.5%) | 424 (38.5%) |
| 3 or more Vehicles | 684 (25.2%) | 22 (2.0%) |
| Total | 2,720 (100.0%) | 1,102 (100.0%) |
Real Estate & Mortgages in Winchester
Real Estate and Mortgage Overview in Winchester
| Characteristic | Without Mortgage | With Mortgage |
| Housing Units | 1,386 | 1,334 |
| Median Property Value | $204,600 | $182,500 |
| Median Household Income | $54,801 | $154 |
| Monthly Housing Costs | $496 | $13 |
| Real Estate Taxes | $1,244 | $64 |
Property Value by Mortgage Status in Winchester
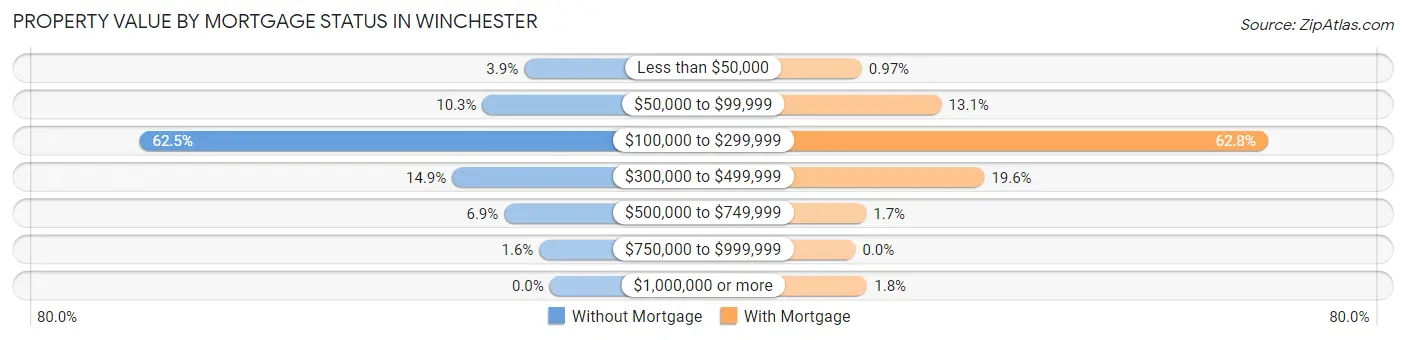
| Property Value | Without Mortgage | With Mortgage |
| Less than $50,000 | 54 (3.9%) | 13 (1.0%) |
| $50,000 to $99,999 | 142 (10.2%) | 175 (13.1%) |
| $100,000 to $299,999 | 866 (62.5%) | 838 (62.8%) |
| $300,000 to $499,999 | 206 (14.9%) | 262 (19.6%) |
| $500,000 to $749,999 | 96 (6.9%) | 22 (1.7%) |
| $750,000 to $999,999 | 22 (1.6%) | 0 (0.0%) |
| $1,000,000 or more | 0 (0.0%) | 24 (1.8%) |
| Total | 1,386 (100.0%) | 1,334 (100.0%) |
Household Income by Mortgage Status in Winchester
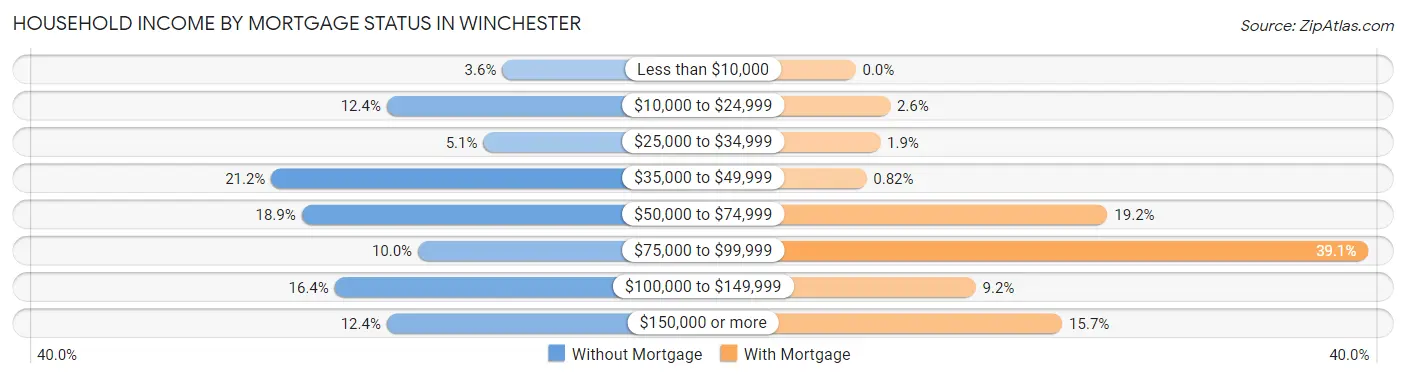
| Household Income | Without Mortgage | With Mortgage |
| Less than $10,000 | 50 (3.6%) | 0 (0.0%) |
| $10,000 to $24,999 | 172 (12.4%) | 35 (2.6%) |
| $25,000 to $34,999 | 70 (5.1%) | 25 (1.9%) |
| $35,000 to $49,999 | 294 (21.2%) | 11 (0.8%) |
| $50,000 to $74,999 | 262 (18.9%) | 256 (19.2%) |
| $75,000 to $99,999 | 139 (10.0%) | 521 (39.1%) |
| $100,000 to $149,999 | 227 (16.4%) | 122 (9.1%) |
| $150,000 or more | 172 (12.4%) | 210 (15.7%) |
| Total | 1,386 (100.0%) | 1,334 (100.0%) |
Property Value to Household Income Ratio in Winchester
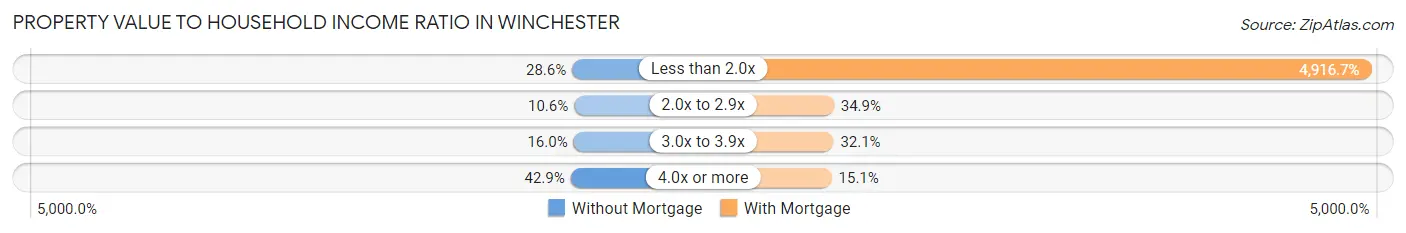
| Value-to-Income Ratio | Without Mortgage | With Mortgage |
| Less than 2.0x | 397 (28.6%) | 65,589 (4,916.7%) |
| 2.0x to 2.9x | 147 (10.6%) | 466 (34.9%) |
| 3.0x to 3.9x | 221 (16.0%) | 428 (32.1%) |
| 4.0x or more | 594 (42.9%) | 202 (15.1%) |
| Total | 1,386 (100.0%) | 1,334 (100.0%) |
Real Estate Taxes by Mortgage Status in Winchester
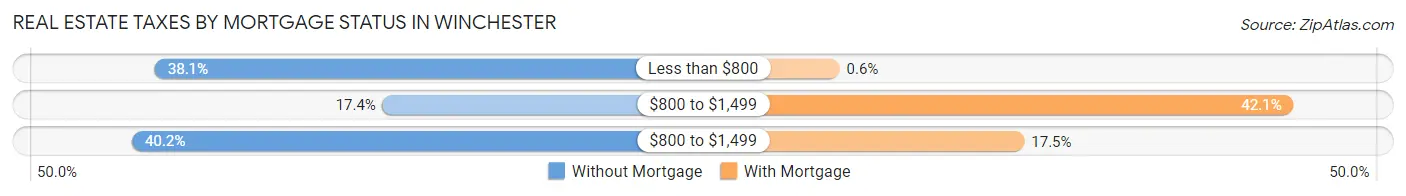
| Property Taxes | Without Mortgage | With Mortgage |
| Less than $800 | 528 (38.1%) | 8 (0.6%) |
| $800 to $1,499 | 241 (17.4%) | 561 (42.0%) |
| $800 to $1,499 | 557 (40.2%) | 233 (17.5%) |
| Total | 1,386 (100.0%) | 1,334 (100.0%) |
Health & Disability in Winchester
Health Insurance Coverage by Age in Winchester
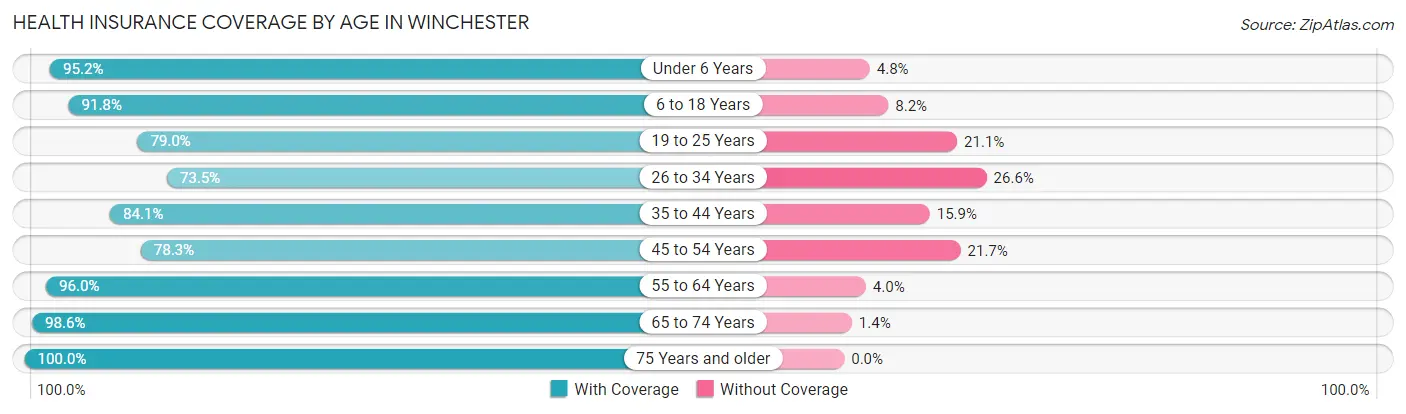
| Age Bracket | With Coverage | Without Coverage |
| Under 6 Years | 718 (95.2%) | 36 (4.8%) |
| 6 to 18 Years | 1,252 (91.8%) | 112 (8.2%) |
| 19 to 25 Years | 615 (78.9%) | 164 (21.0%) |
| 26 to 34 Years | 722 (73.5%) | 261 (26.6%) |
| 35 to 44 Years | 828 (84.1%) | 157 (15.9%) |
| 45 to 54 Years | 863 (78.3%) | 239 (21.7%) |
| 55 to 64 Years | 1,332 (96.0%) | 56 (4.0%) |
| 65 to 74 Years | 971 (98.6%) | 14 (1.4%) |
| 75 Years and older | 773 (100.0%) | 0 (0.0%) |
| Total | 8,074 (88.6%) | 1,039 (11.4%) |
Health Insurance Coverage by Citizenship Status in Winchester
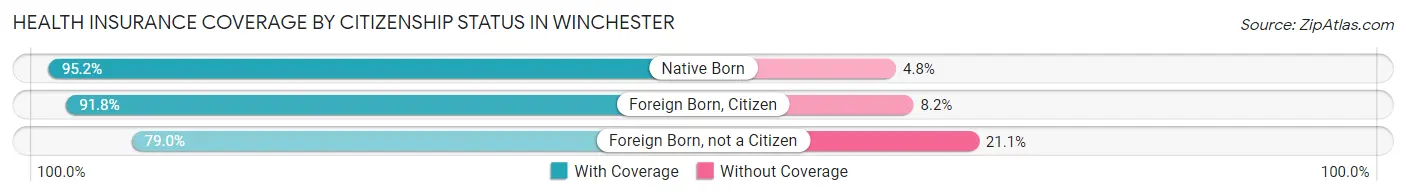
| Citizenship Status | With Coverage | Without Coverage |
| Native Born | 718 (95.2%) | 36 (4.8%) |
| Foreign Born, Citizen | 1,252 (91.8%) | 112 (8.2%) |
| Foreign Born, not a Citizen | 615 (78.9%) | 164 (21.0%) |
Health Insurance Coverage by Household Income in Winchester
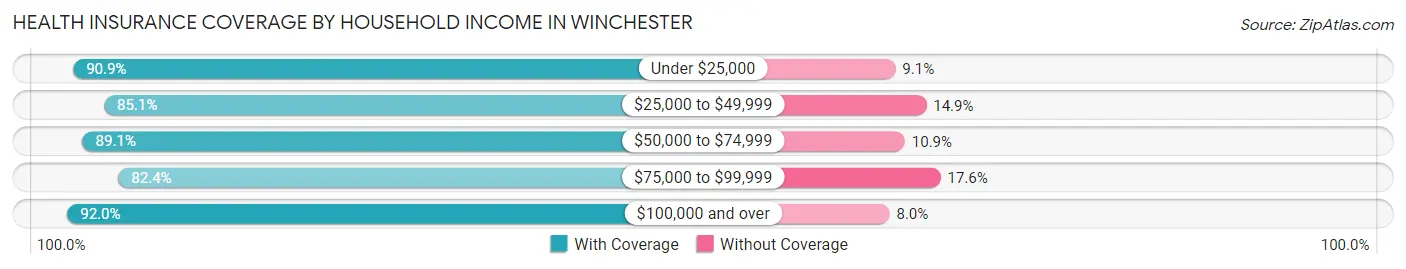
| Household Income | With Coverage | Without Coverage |
| Under $25,000 | 1,087 (90.9%) | 109 (9.1%) |
| $25,000 to $49,999 | 1,537 (85.1%) | 269 (14.9%) |
| $50,000 to $74,999 | 2,105 (89.1%) | 257 (10.9%) |
| $75,000 to $99,999 | 914 (82.4%) | 195 (17.6%) |
| $100,000 and over | 2,400 (92.0%) | 209 (8.0%) |
Public vs Private Health Insurance Coverage by Age in Winchester
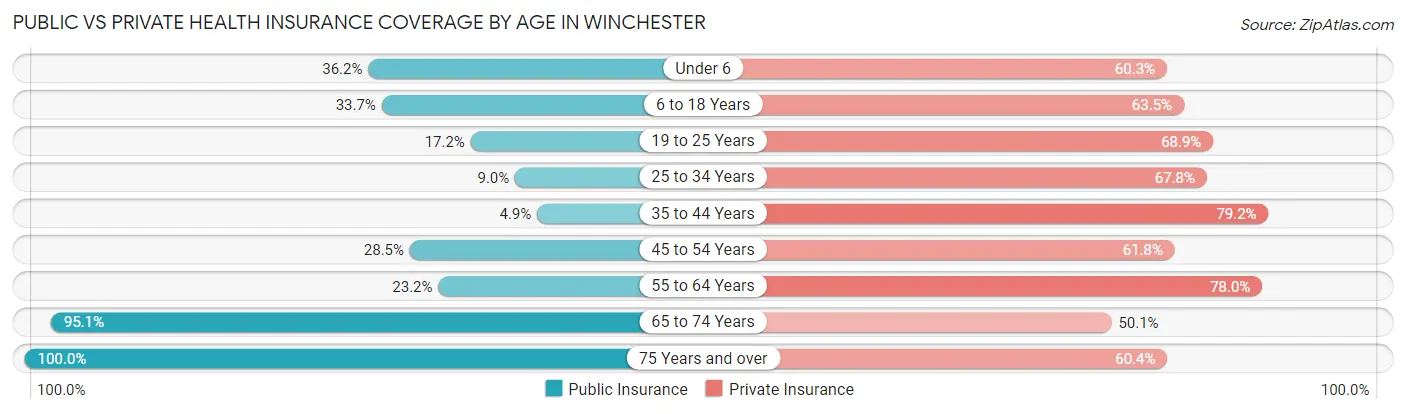
| Age Bracket | Public Insurance | Private Insurance |
| Under 6 | 273 (36.2%) | 455 (60.3%) |
| 6 to 18 Years | 460 (33.7%) | 866 (63.5%) |
| 19 to 25 Years | 134 (17.2%) | 537 (68.9%) |
| 25 to 34 Years | 88 (8.9%) | 666 (67.7%) |
| 35 to 44 Years | 48 (4.9%) | 780 (79.2%) |
| 45 to 54 Years | 314 (28.5%) | 681 (61.8%) |
| 55 to 64 Years | 322 (23.2%) | 1,083 (78.0%) |
| 65 to 74 Years | 937 (95.1%) | 493 (50.0%) |
| 75 Years and over | 773 (100.0%) | 467 (60.4%) |
| Total | 3,349 (36.7%) | 6,028 (66.1%) |
Disability Status by Sex by Age in Winchester
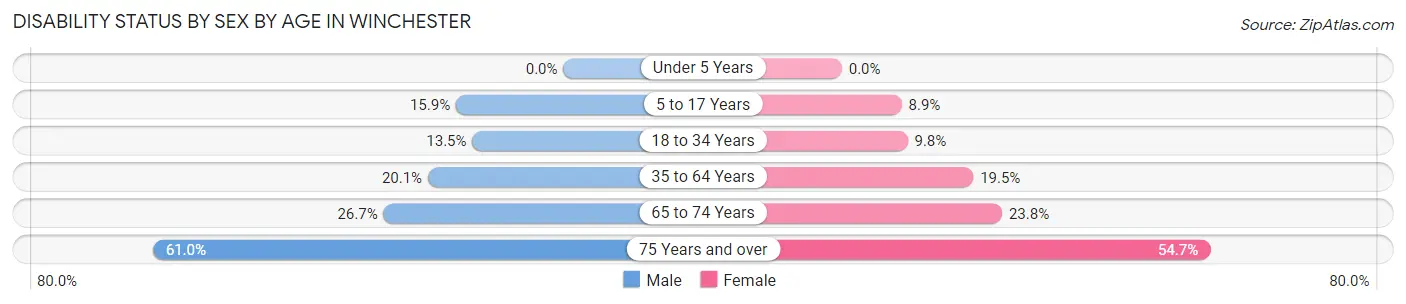
| Age Bracket | Male | Female |
| Under 5 Years | 0 (0.0%) | 0 (0.0%) |
| 5 to 17 Years | 143 (15.9%) | 62 (8.9%) |
| 18 to 34 Years | 115 (13.5%) | 93 (9.8%) |
| 35 to 64 Years | 336 (20.1%) | 352 (19.5%) |
| 65 to 74 Years | 125 (26.7%) | 123 (23.8%) |
| 75 Years and over | 217 (61.0%) | 228 (54.7%) |
Disability Class by Sex by Age in Winchester
Disability Class: Hearing Difficulty
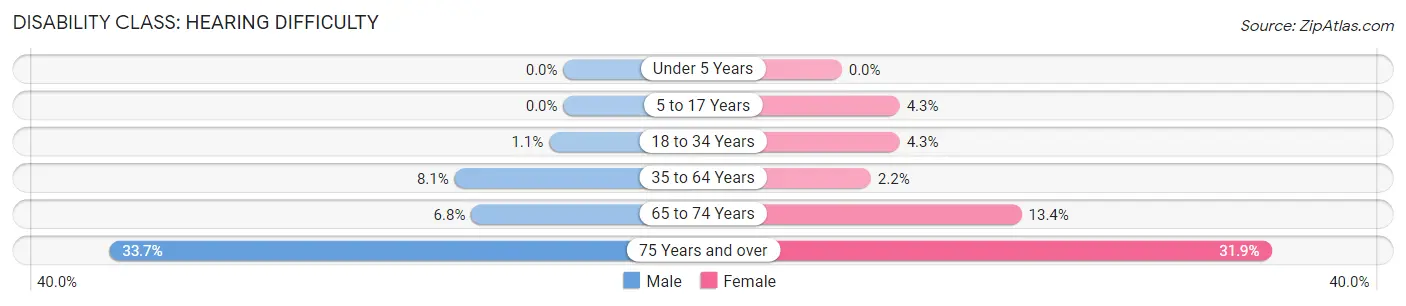
| Age Bracket | Male | Female |
| Under 5 Years | 0 (0.0%) | 0 (0.0%) |
| 5 to 17 Years | 0 (0.0%) | 30 (4.3%) |
| 18 to 34 Years | 9 (1.1%) | 41 (4.3%) |
| 35 to 64 Years | 135 (8.1%) | 39 (2.2%) |
| 65 to 74 Years | 32 (6.8%) | 69 (13.4%) |
| 75 Years and over | 120 (33.7%) | 133 (31.9%) |
Disability Class: Vision Difficulty
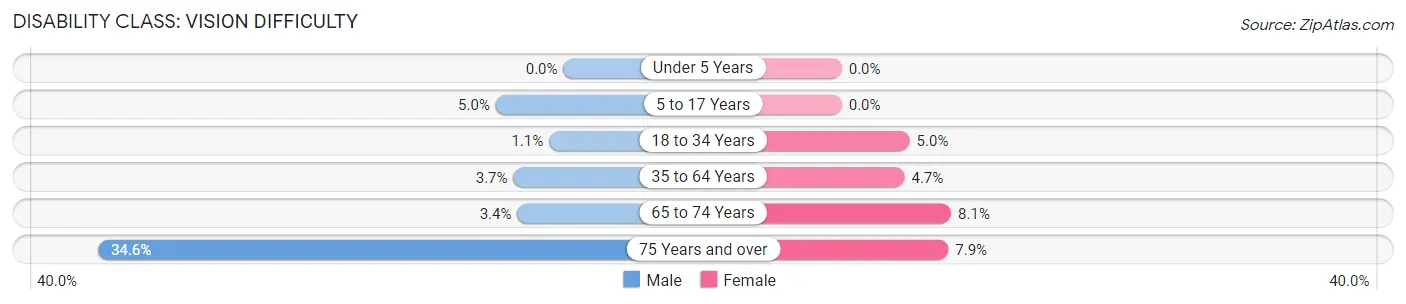
| Age Bracket | Male | Female |
| Under 5 Years | 0 (0.0%) | 0 (0.0%) |
| 5 to 17 Years | 45 (5.0%) | 0 (0.0%) |
| 18 to 34 Years | 9 (1.1%) | 48 (5.0%) |
| 35 to 64 Years | 62 (3.7%) | 84 (4.7%) |
| 65 to 74 Years | 16 (3.4%) | 42 (8.1%) |
| 75 Years and over | 123 (34.5%) | 33 (7.9%) |
Disability Class: Cognitive Difficulty
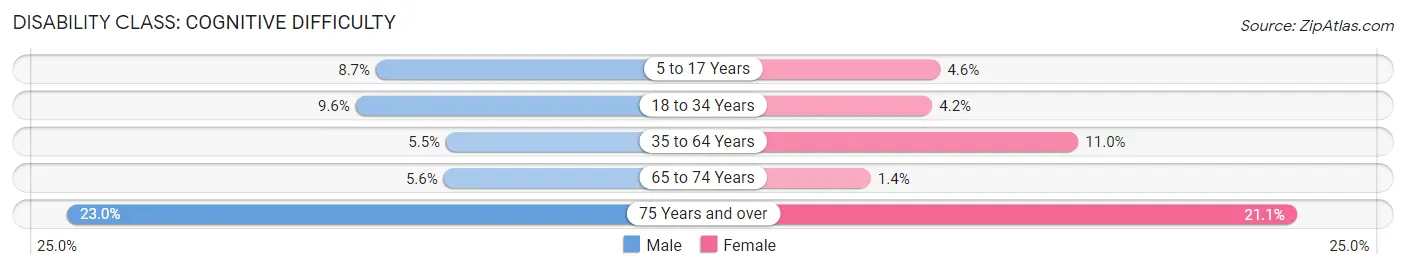
| Age Bracket | Male | Female |
| 5 to 17 Years | 78 (8.7%) | 32 (4.6%) |
| 18 to 34 Years | 82 (9.6%) | 40 (4.2%) |
| 35 to 64 Years | 91 (5.4%) | 198 (11.0%) |
| 65 to 74 Years | 26 (5.6%) | 7 (1.3%) |
| 75 Years and over | 82 (23.0%) | 88 (21.1%) |
Disability Class: Ambulatory Difficulty
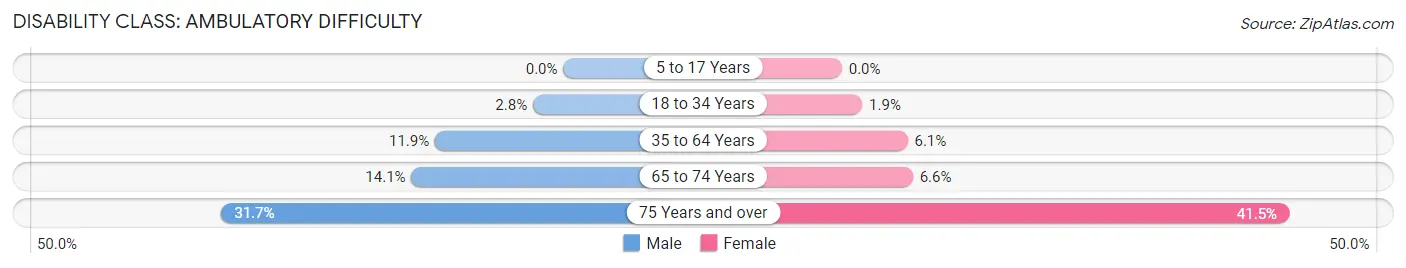
| Age Bracket | Male | Female |
| 5 to 17 Years | 0 (0.0%) | 0 (0.0%) |
| 18 to 34 Years | 24 (2.8%) | 18 (1.9%) |
| 35 to 64 Years | 199 (11.9%) | 110 (6.1%) |
| 65 to 74 Years | 66 (14.1%) | 34 (6.6%) |
| 75 Years and over | 113 (31.7%) | 173 (41.5%) |
Disability Class: Self-Care Difficulty
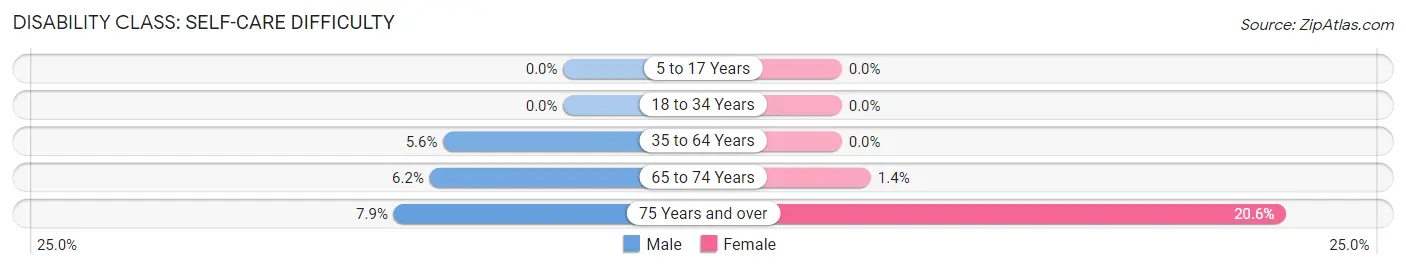
| Age Bracket | Male | Female |
| 5 to 17 Years | 0 (0.0%) | 0 (0.0%) |
| 18 to 34 Years | 0 (0.0%) | 0 (0.0%) |
| 35 to 64 Years | 93 (5.6%) | 0 (0.0%) |
| 65 to 74 Years | 29 (6.2%) | 7 (1.3%) |
| 75 Years and over | 28 (7.9%) | 86 (20.6%) |
Technology Access in Winchester
Computing Device Access in Winchester
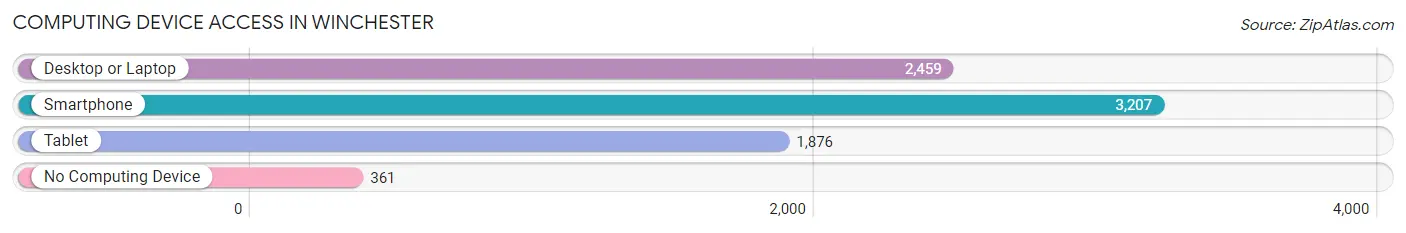
| Device Type | # Households | % Households |
| Desktop or Laptop | 2,459 | 64.3% |
| Smartphone | 3,207 | 83.9% |
| Tablet | 1,876 | 49.1% |
| No Computing Device | 361 | 9.5% |
| Total | 3,822 | 100.0% |
Internet Access in Winchester
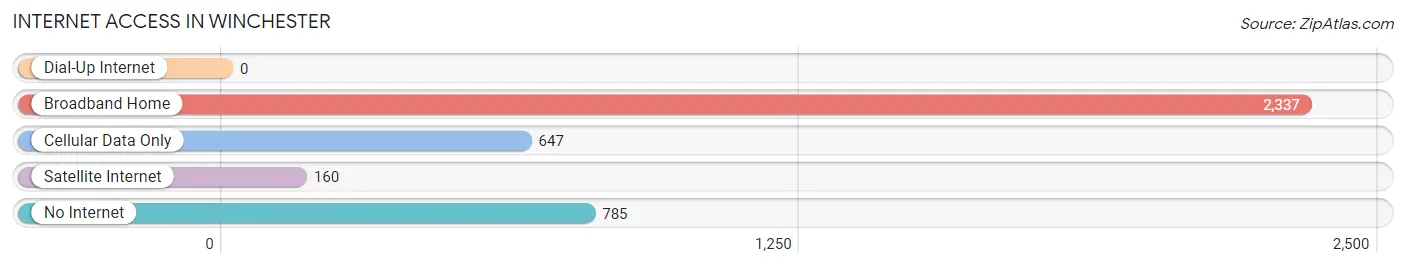
| Internet Type | # Households | % Households |
| Dial-Up Internet | 0 | 0.0% |
| Broadband Home | 2,337 | 61.2% |
| Cellular Data Only | 647 | 16.9% |
| Satellite Internet | 160 | 4.2% |
| No Internet | 785 | 20.5% |
| Total | 3,822 | 100.0% |
Winchester Summary
Winchester, Tennessee is a small city located in Franklin County, Tennessee. It is situated in the foothills of the Cumberland Mountains, approximately 70 miles south of Nashville. The city has a population of approximately 8,000 people and is the county seat of Franklin County.
History
The area that is now Winchester was first settled in the early 1800s by settlers from North Carolina. The city was originally known as Winchester Station, named after the nearby Winchester Railroad Station. The city was officially incorporated in 1877 and was named after the nearby town of Winchester, Virginia.
The city was an important stop on the Nashville and Chattanooga Railroad, which connected the city to the rest of the state. The railroad was a major factor in the city's growth and development. In the late 1800s, Winchester was a thriving agricultural center, with cotton, tobacco, and corn being the main crops.
In the early 1900s, Winchester began to experience a period of industrial growth. The city was home to several factories, including a cotton mill, a furniture factory, and a shoe factory. The city also had a thriving business district, with several banks, stores, and restaurants.
Geography
Winchester is located in the foothills of the Cumberland Mountains, approximately 70 miles south of Nashville. The city is situated on the banks of the Elk River, which flows through the city. The city is surrounded by rolling hills and forests, making it a popular destination for outdoor activities such as hiking, camping, and fishing.
Economy
Winchester's economy is largely based on agriculture and manufacturing. The city is home to several factories, including a cotton mill, a furniture factory, and a shoe factory. The city also has a thriving business district, with several banks, stores, and restaurants.
The city is also home to several educational institutions, including the University of Tennessee at Martin, Motlow State Community College, and the Tennessee College of Applied Technology.
Demographics
As of the 2010 census, Winchester had a population of 8,000 people. The racial makeup of the city was 87.3% White, 8.2% African American, 0.3% Native American, 0.7% Asian, 0.1% Pacific Islander, and 3.4% from other races. The median household income was $35,000, and the median family income was $41,000.
Conclusion
Winchester, Tennessee is a small city located in Franklin County, Tennessee. It is situated in the foothills of the Cumberland Mountains, approximately 70 miles south of Nashville. The city has a population of approximately 8,000 people and is the county seat of Franklin County. The city's economy is largely based on agriculture and manufacturing, and it is home to several educational institutions. The city is also a popular destination for outdoor activities such as hiking, camping, and fishing.
Common Questions
What is Per Capita Income in Winchester?
Per Capita income in Winchester is $33,957.
What is the Median Family Income in Winchester?
Median Family Income in Winchester is $68,413.
What is the Median Household income in Winchester?
Median Household Income in Winchester is $58,054.
What is Income or Wage Gap in Winchester?
Income or Wage Gap in Winchester is 22.8%.
Women in Winchester earn 77.2 cents for every dollar earned by a man.
What is Family Income Deficit in Winchester?
Family Income Deficit in Winchester is $13,114.
Families that are below poverty line in Winchester earn $13,114 less on average than the poverty threshold level.
What is Inequality or Gini Index in Winchester?
Inequality or Gini Index in Winchester is 0.47.
What is the Total Population of Winchester?
Total Population of Winchester is 9,450.
What is the Total Male Population of Winchester?
Total Male Population of Winchester is 4,664.
What is the Total Female Population of Winchester?
Total Female Population of Winchester is 4,786.
What is the Ratio of Males per 100 Females in Winchester?
There are 97.45 Males per 100 Females in Winchester.
What is the Ratio of Females per 100 Males in Winchester?
There are 102.62 Females per 100 Males in Winchester.
What is the Median Population Age in Winchester?
Median Population Age in Winchester is 43.6 Years.
What is the Average Family Size in Winchester
Average Family Size in Winchester is 3.1 People.
What is the Average Household Size in Winchester
Average Household Size in Winchester is 2.4 People.
How Large is the Labor Force in Winchester?
There are 4,374 People in the Labor Forcein in Winchester.
What is the Percentage of People in the Labor Force in Winchester?
58.4% of People are in the Labor Force in Winchester.
What is the Unemployment Rate in Winchester?
Unemployment Rate in Winchester is 3.2%.