Bolivar, TN Map & Demographics
Bolivar Map
Bolivar Overview
$24,367
PER CAPITA INCOME
$41,365
AVG FAMILY INCOME
$36,348
AVG HOUSEHOLD INCOME
22.1%
WAGE / INCOME GAP [ % ]
77.9¢/ $1
WAGE / INCOME GAP [ $ ]
0.45
INEQUALITY / GINI INDEX
5,197
TOTAL POPULATION
2,814
MALE POPULATION
2,383
FEMALE POPULATION
118.09
MALES / 100 FEMALES
84.68
FEMALES / 100 MALES
39.9
MEDIAN AGE
3.1
AVG FAMILY SIZE
2.2
AVG HOUSEHOLD SIZE
2,794
LABOR FORCE [ PEOPLE ]
62.3%
PERCENT IN LABOR FORCE
21.9%
UNEMPLOYMENT RATE
Bolivar Zip Codes
Bolivar Area Codes
Income in Bolivar
Income Overview in Bolivar
Per Capita Income in Bolivar is $24,367, while median incomes of families and households are $41,365 and $36,348 respectively.
| Characteristic | Number | Measure |
| Per Capita Income | 5,197 | $24,367 |
| Median Family Income | 1,259 | $41,365 |
| Mean Family Income | 1,259 | $69,058 |
| Median Household Income | 2,311 | $36,348 |
| Mean Household Income | 2,311 | $51,523 |
| Income Deficit | 1,259 | $0 |
| Wage / Income Gap (%) | 5,197 | 22.08% |
| Wage / Income Gap ($) | 5,197 | 77.92¢ per $1 |
| Gini / Inequality Index | 5,197 | 0.45 |
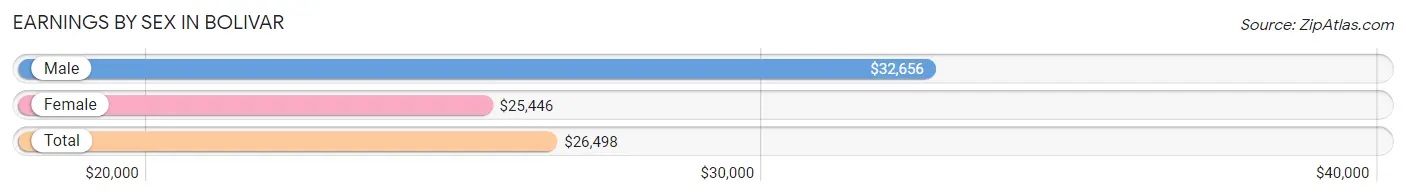
Earnings by Sex in Bolivar
Average Earnings in Bolivar are $26,498, $32,656 for men and $25,446 for women, a difference of 22.1%.
| Sex | Number | Average Earnings |
| Male | 1,547 (59.5%) | $32,656 |
| Female | 1,052 (40.5%) | $25,446 |
| Total | 2,599 (100.0%) | $26,498 |
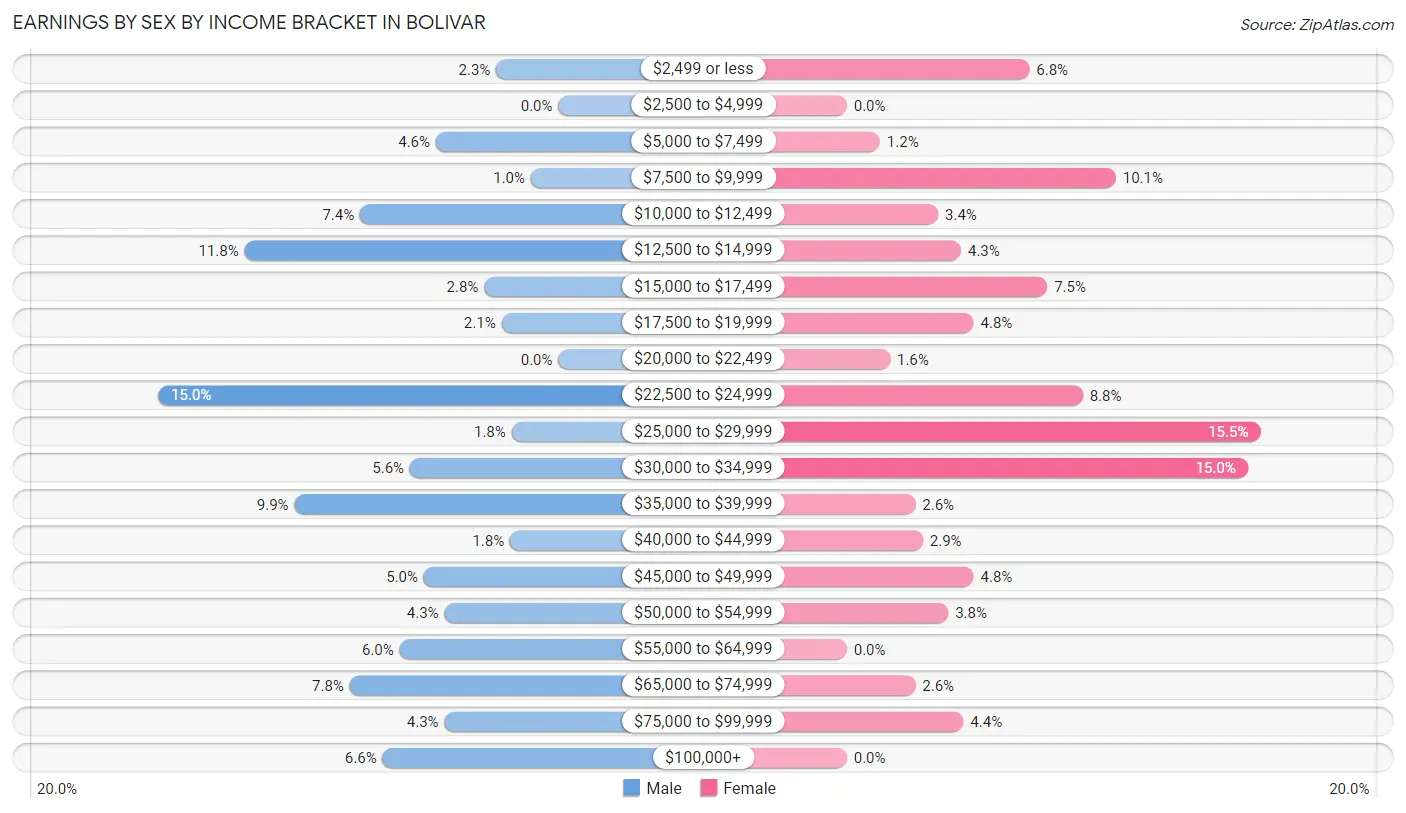
Earnings by Sex by Income Bracket in Bolivar
The most common earnings brackets in Bolivar are $22,500 to $24,999 for men (232 | 15.0%) and $25,000 to $29,999 for women (163 | 15.5%).
| Income | Male | Female |
| $2,499 or less | 36 (2.3%) | 72 (6.8%) |
| $2,500 to $4,999 | 0 (0.0%) | 0 (0.0%) |
| $5,000 to $7,499 | 71 (4.6%) | 13 (1.2%) |
| $7,500 to $9,999 | 16 (1.0%) | 106 (10.1%) |
| $10,000 to $12,499 | 115 (7.4%) | 36 (3.4%) |
| $12,500 to $14,999 | 182 (11.8%) | 45 (4.3%) |
| $15,000 to $17,499 | 43 (2.8%) | 79 (7.5%) |
| $17,500 to $19,999 | 33 (2.1%) | 50 (4.8%) |
| $20,000 to $22,499 | 0 (0.0%) | 17 (1.6%) |
| $22,500 to $24,999 | 232 (15.0%) | 93 (8.8%) |
| $25,000 to $29,999 | 27 (1.8%) | 163 (15.5%) |
| $30,000 to $34,999 | 86 (5.6%) | 158 (15.0%) |
| $35,000 to $39,999 | 153 (9.9%) | 27 (2.6%) |
| $40,000 to $44,999 | 28 (1.8%) | 30 (2.9%) |
| $45,000 to $49,999 | 78 (5.0%) | 50 (4.8%) |
| $50,000 to $54,999 | 66 (4.3%) | 40 (3.8%) |
| $55,000 to $64,999 | 92 (5.9%) | 0 (0.0%) |
| $65,000 to $74,999 | 121 (7.8%) | 27 (2.6%) |
| $75,000 to $99,999 | 66 (4.3%) | 46 (4.4%) |
| $100,000+ | 102 (6.6%) | 0 (0.0%) |
| Total | 1,547 (100.0%) | 1,052 (100.0%) |
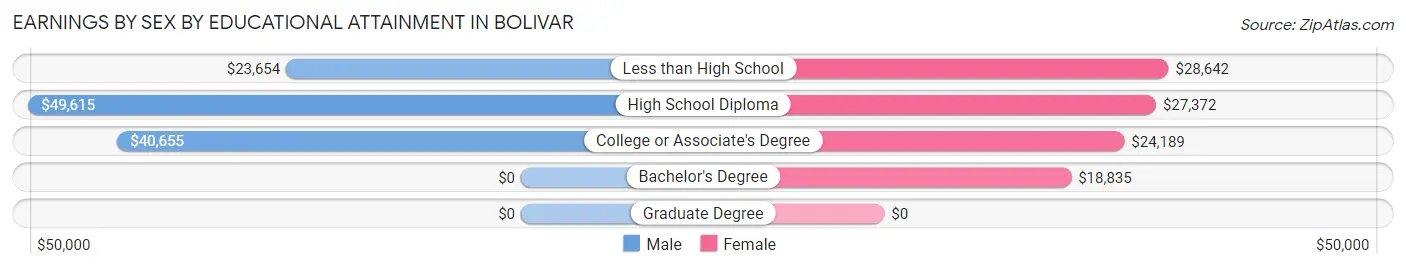
Earnings by Sex by Educational Attainment in Bolivar
Average earnings in Bolivar are $37,296 for men and $25,818 for women, a difference of 30.8%. Men with an educational attainment of high school diploma enjoy the highest average annual earnings of $49,615, while those with less than high school education earn the least with $23,654. Women with an educational attainment of less than high school earn the most with the average annual earnings of $28,642, while those with bachelor's degree education have the smallest earnings of $18,835.
| Educational Attainment | Male Income | Female Income |
| Less than High School | $23,654 | $28,642 |
| High School Diploma | $49,615 | $27,372 |
| College or Associate's Degree | $40,655 | $24,189 |
| Bachelor's Degree | - | - |
| Graduate Degree | - | - |
| Total | $37,296 | $25,818 |
Family Income in Bolivar
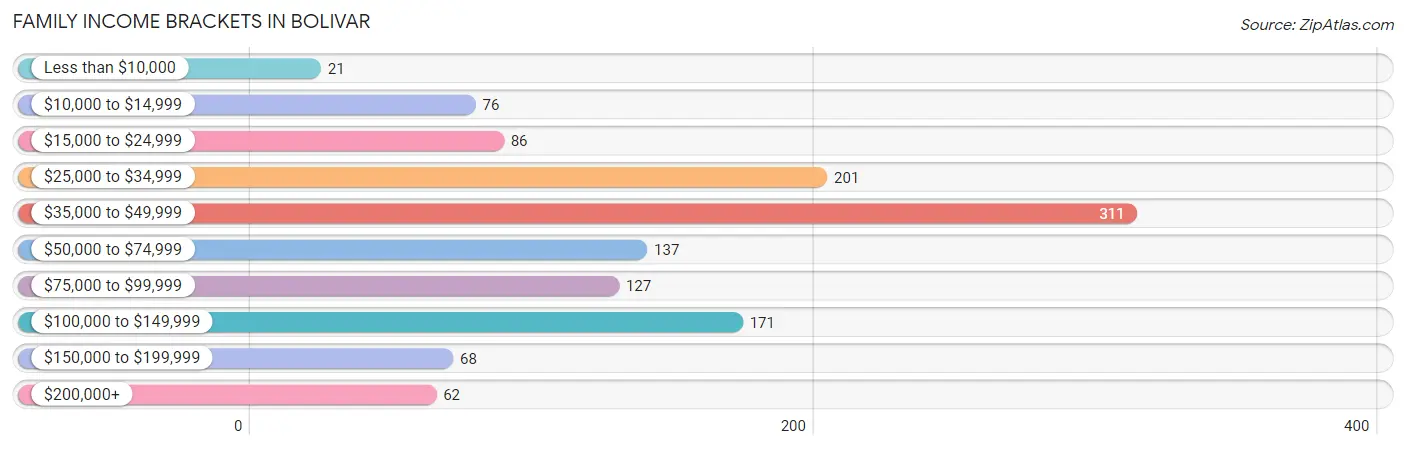
Family Income Brackets in Bolivar
According to the Bolivar family income data, there are 311 families falling into the $35,000 to $49,999 income range, which is the most common income bracket and makes up 24.7% of all families. Conversely, the less than $10,000 income bracket is the least frequent group with only 21 families (1.7%) belonging to this category.
| Income Bracket | # Families | % Families |
| Less than $10,000 | 21 | 1.7% |
| $10,000 to $14,999 | 76 | 6.0% |
| $15,000 to $24,999 | 86 | 6.8% |
| $25,000 to $34,999 | 201 | 16.0% |
| $35,000 to $49,999 | 311 | 24.7% |
| $50,000 to $74,999 | 137 | 10.9% |
| $75,000 to $99,999 | 127 | 10.1% |
| $100,000 to $149,999 | 171 | 13.6% |
| $150,000 to $199,999 | 68 | 5.4% |
| $200,000+ | 62 | 4.9% |
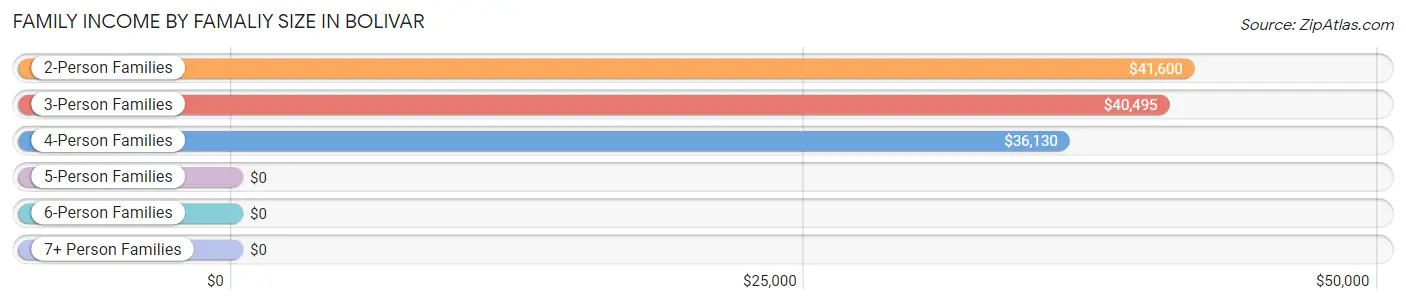
Family Income by Famaliy Size in Bolivar
2-person families (736 | 58.5%) account for the highest median family income in Bolivar with $41,600 per family, while 2-person families (736 | 58.5%) have the highest median income of $20,800 per family member.
| Income Bracket | # Families | Median Income |
| 2-Person Families | 736 (58.5%) | $41,600 |
| 3-Person Families | 237 (18.8%) | $40,495 |
| 4-Person Families | 182 (14.5%) | $36,130 |
| 5-Person Families | 100 (7.9%) | $0 |
| 6-Person Families | 0 (0.0%) | $0 |
| 7+ Person Families | 4 (0.3%) | $0 |
| Total | 1,259 (100.0%) | $41,365 |
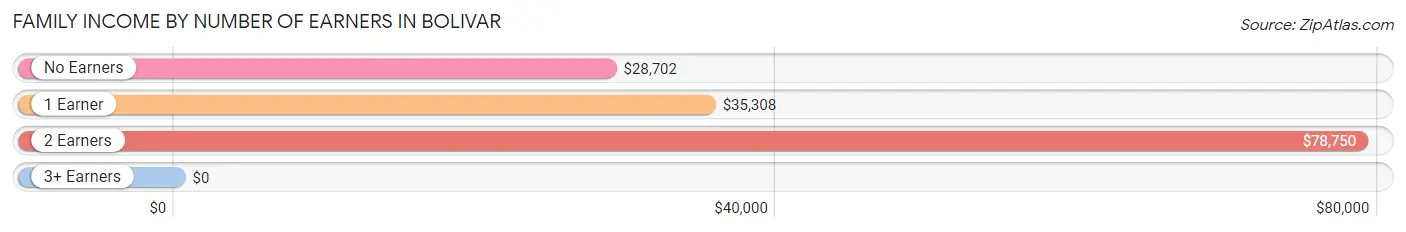
Family Income by Number of Earners in Bolivar
| Number of Earners | # Families | Median Income |
| No Earners | 177 (14.1%) | $28,702 |
| 1 Earner | 528 (41.9%) | $35,308 |
| 2 Earners | 449 (35.7%) | $78,750 |
| 3+ Earners | 105 (8.3%) | $0 |
| Total | 1,259 (100.0%) | $41,365 |
Household Income in Bolivar
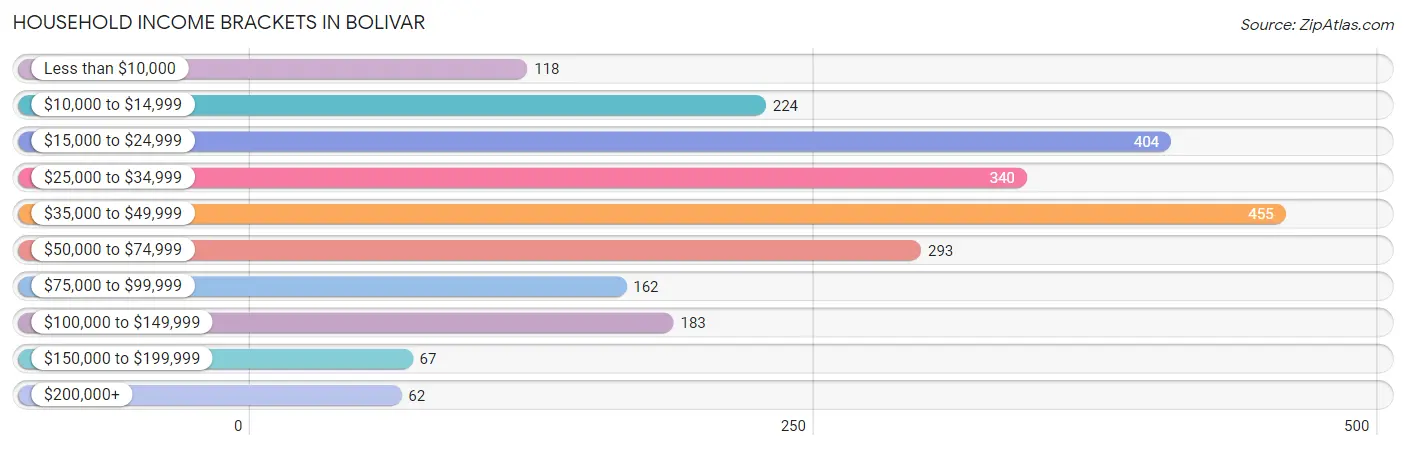
Household Income Brackets in Bolivar
With 455 households falling in the category, the $35,000 to $49,999 income range is the most frequent in Bolivar, accounting for 19.7% of all households. In contrast, only 62 households (2.7%) fall into the $200,000+ income bracket, making it the least populous group.
| Income Bracket | # Households | % Households |
| Less than $10,000 | 118 | 5.1% |
| $10,000 to $14,999 | 224 | 9.7% |
| $15,000 to $24,999 | 404 | 17.5% |
| $25,000 to $34,999 | 340 | 14.7% |
| $35,000 to $49,999 | 455 | 19.7% |
| $50,000 to $74,999 | 293 | 12.7% |
| $75,000 to $99,999 | 162 | 7.0% |
| $100,000 to $149,999 | 183 | 7.9% |
| $150,000 to $199,999 | 67 | 2.9% |
| $200,000+ | 62 | 2.7% |
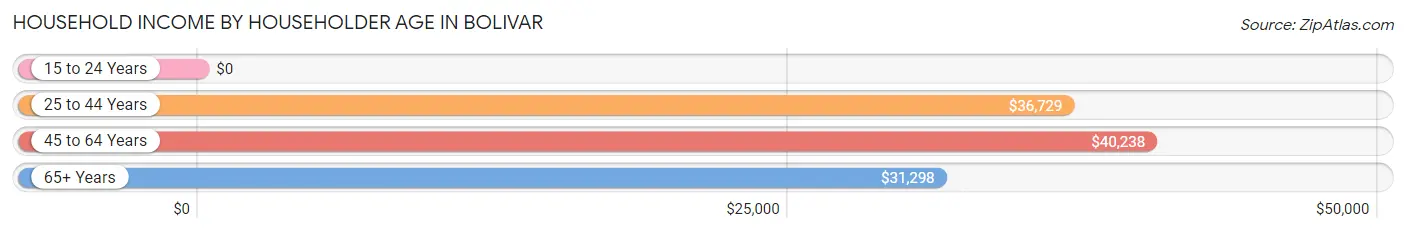
Household Income by Householder Age in Bolivar
The median household income in Bolivar is $36,348, with the highest median household income of $40,238 found in the 45 to 64 years age bracket for the primary householder. A total of 1,092 households (47.2%) fall into this category. Meanwhile, the 15 to 24 years age bracket for the primary householder has the lowest median household income of $0, with 76 households (3.3%) in this group.
| Income Bracket | # Households | Median Income |
| 15 to 24 Years | 76 (3.3%) | $0 |
| 25 to 44 Years | 553 (23.9%) | $36,729 |
| 45 to 64 Years | 1,092 (47.2%) | $40,238 |
| 65+ Years | 590 (25.5%) | $31,298 |
| Total | 2,311 (100.0%) | $36,348 |
Poverty in Bolivar
Income Below Poverty by Sex and Age in Bolivar
With 13.0% poverty level for males and 22.1% for females among the residents of Bolivar, 12 to 14 year old males and 18 to 24 year old females are the most vulnerable to poverty, with 41 males (100.0%) and 47 females (65.3%) in their respective age groups living below the poverty level.
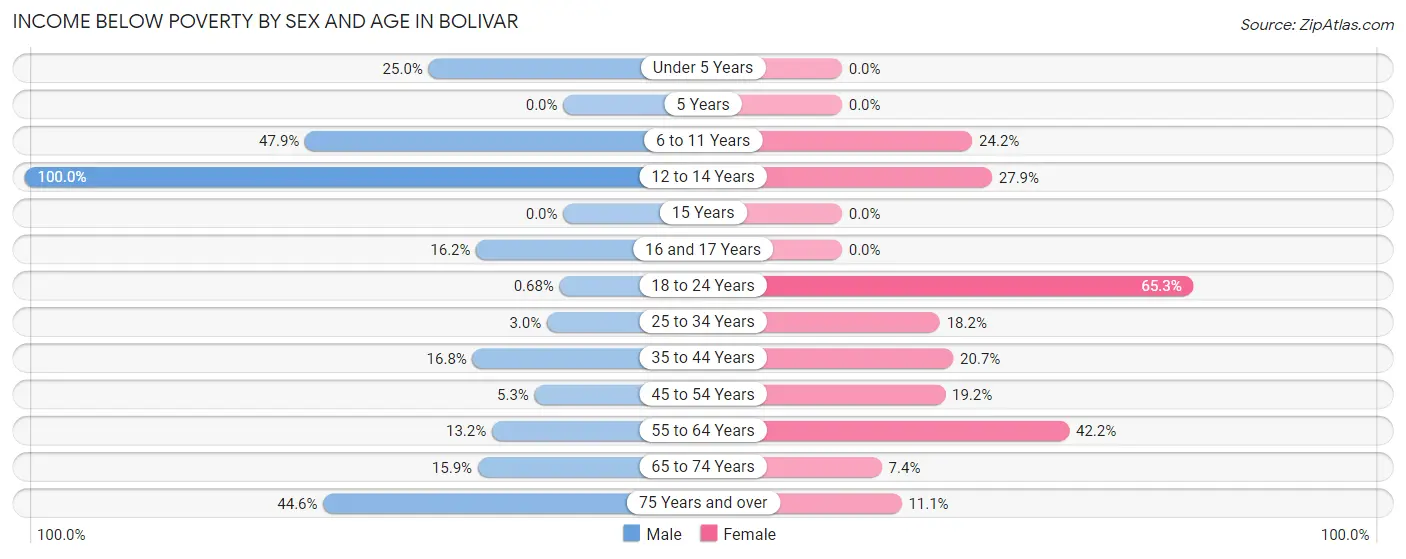
| Age Bracket | Male | Female |
| Under 5 Years | 52 (25.0%) | 0 (0.0%) |
| 5 Years | 0 (0.0%) | 0 (0.0%) |
| 6 to 11 Years | 46 (47.9%) | 38 (24.2%) |
| 12 to 14 Years | 41 (100.0%) | 39 (27.9%) |
| 15 Years | 0 (0.0%) | 0 (0.0%) |
| 16 and 17 Years | 21 (16.2%) | 0 (0.0%) |
| 18 to 24 Years | 3 (0.7%) | 47 (65.3%) |
| 25 to 34 Years | 18 (3.0%) | 70 (18.2%) |
| 35 to 44 Years | 17 (16.8%) | 43 (20.7%) |
| 45 to 54 Years | 16 (5.3%) | 50 (19.2%) |
| 55 to 64 Years | 56 (13.2%) | 178 (42.2%) |
| 65 to 74 Years | 46 (15.9%) | 23 (7.4%) |
| 75 Years and over | 45 (44.6%) | 33 (11.1%) |
| Total | 361 (13.0%) | 521 (22.1%) |
Income Above Poverty by Sex and Age in Bolivar
According to the poverty statistics in Bolivar, males aged 5 years and females aged under 5 years are the age groups that are most secure financially, with 100.0% of males and 100.0% of females in these age groups living above the poverty line.
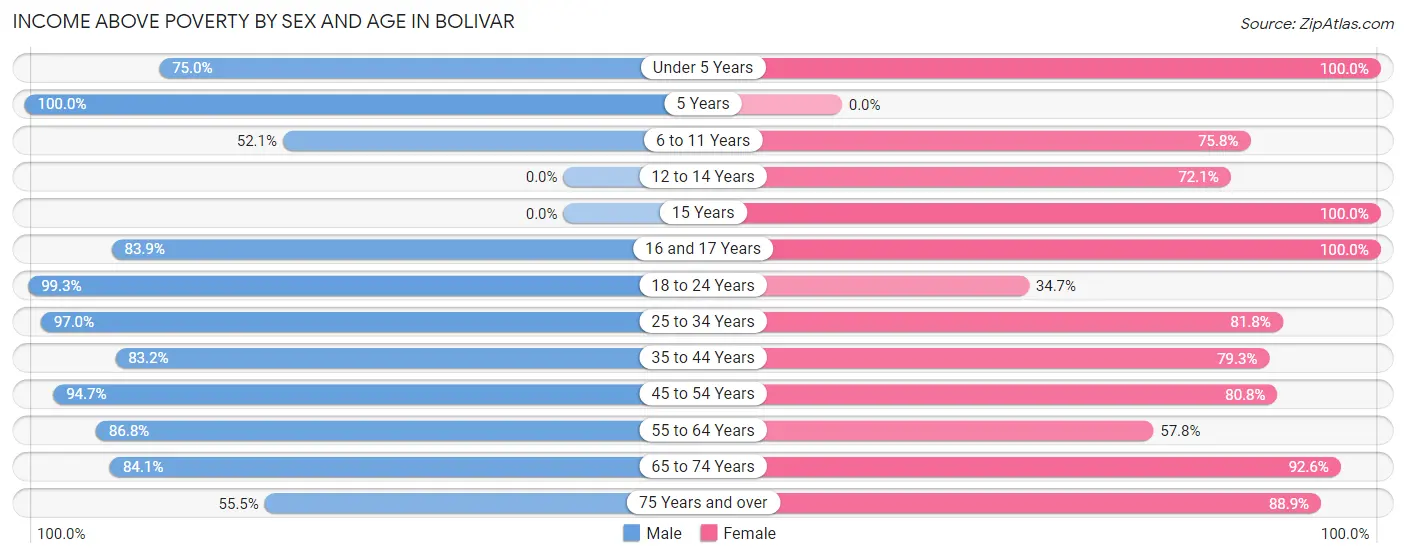
| Age Bracket | Male | Female |
| Under 5 Years | 156 (75.0%) | 7 (100.0%) |
| 5 Years | 53 (100.0%) | 0 (0.0%) |
| 6 to 11 Years | 50 (52.1%) | 119 (75.8%) |
| 12 to 14 Years | 0 (0.0%) | 101 (72.1%) |
| 15 Years | 0 (0.0%) | 10 (100.0%) |
| 16 and 17 Years | 109 (83.9%) | 92 (100.0%) |
| 18 to 24 Years | 436 (99.3%) | 25 (34.7%) |
| 25 to 34 Years | 578 (97.0%) | 315 (81.8%) |
| 35 to 44 Years | 84 (83.2%) | 165 (79.3%) |
| 45 to 54 Years | 285 (94.7%) | 211 (80.8%) |
| 55 to 64 Years | 367 (86.8%) | 244 (57.8%) |
| 65 to 74 Years | 244 (84.1%) | 288 (92.6%) |
| 75 Years and over | 56 (55.4%) | 265 (88.9%) |
| Total | 2,418 (87.0%) | 1,842 (77.9%) |
Income Below Poverty Among Married-Couple Families in Bolivar
The poverty statistics for married-couple families in Bolivar show that 2.1% or 15 of the total 723 families live below the poverty line. Families with no children have the highest poverty rate of 3.0%, comprising of 15 families. On the other hand, families with 1 or 2 children have the lowest poverty rate of 0.0%, which includes 0 families.
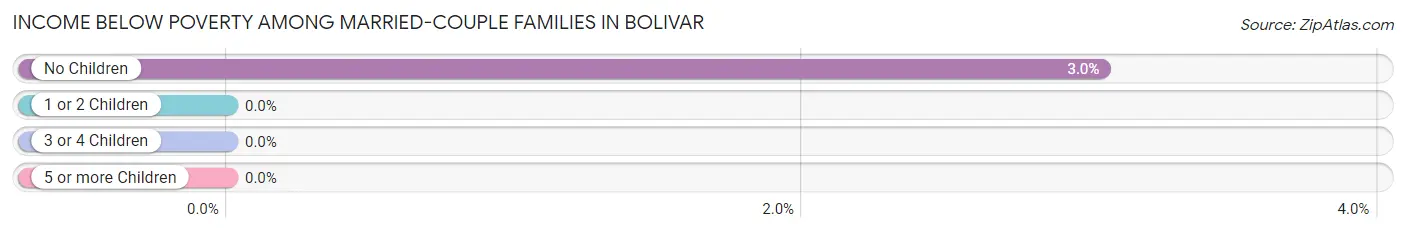
| Children | Above Poverty | Below Poverty |
| No Children | 478 (97.0%) | 15 (3.0%) |
| 1 or 2 Children | 126 (100.0%) | 0 (0.0%) |
| 3 or 4 Children | 100 (100.0%) | 0 (0.0%) |
| 5 or more Children | 4 (100.0%) | 0 (0.0%) |
| Total | 708 (97.9%) | 15 (2.1%) |
Income Below Poverty Among Single-Parent Households in Bolivar
According to the poverty data in Bolivar, 100.0% or 15 single-father households and 29.2% or 152 single-mother households are living below the poverty line. Among single-father households, those with no children have the highest poverty rate, with 15 households (100.0%) experiencing poverty. Likewise, among single-mother households, those with 3 or 4 children have the highest poverty rate, with 48 households (100.0%) falling below the poverty line.
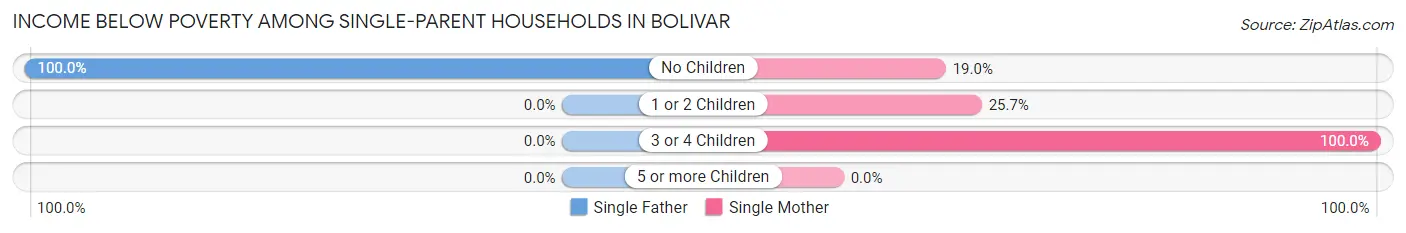
| Children | Single Father | Single Mother |
| No Children | 15 (100.0%) | 50 (19.0%) |
| 1 or 2 Children | 0 (0.0%) | 54 (25.7%) |
| 3 or 4 Children | 0 (0.0%) | 48 (100.0%) |
| 5 or more Children | 0 (0.0%) | 0 (0.0%) |
| Total | 15 (100.0%) | 152 (29.2%) |
Income Below Poverty Among Married-Couple vs Single-Parent Households in Bolivar
The poverty data for Bolivar shows that 15 of the married-couple family households (2.1%) and 167 of the single-parent households (31.2%) are living below the poverty level. Within the married-couple family households, those with no children have the highest poverty rate, with 15 households (3.0%) falling below the poverty line. Among the single-parent households, those with 3 or 4 children have the highest poverty rate, with 48 household (100.0%) living below poverty.
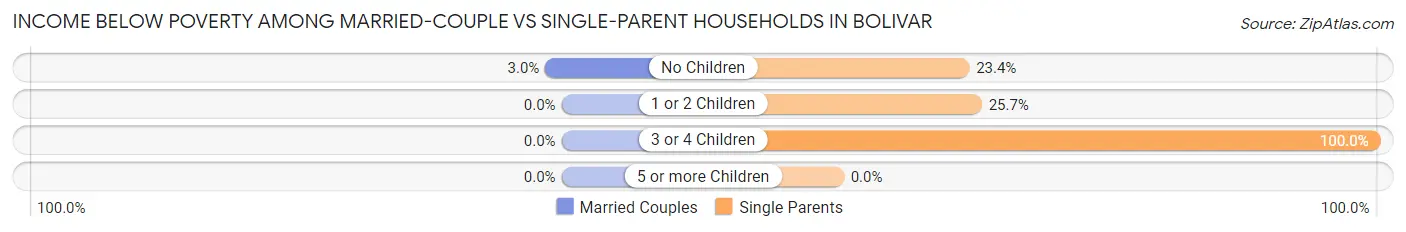
| Children | Married-Couple Families | Single-Parent Households |
| No Children | 15 (3.0%) | 65 (23.4%) |
| 1 or 2 Children | 0 (0.0%) | 54 (25.7%) |
| 3 or 4 Children | 0 (0.0%) | 48 (100.0%) |
| 5 or more Children | 0 (0.0%) | 0 (0.0%) |
| Total | 15 (2.1%) | 167 (31.2%) |
Race in Bolivar
The most populous races in Bolivar are Black / African American (3,232 | 62.2%), White / Caucasian (1,510 | 29.1%), and Two or more Races (248 | 4.8%).
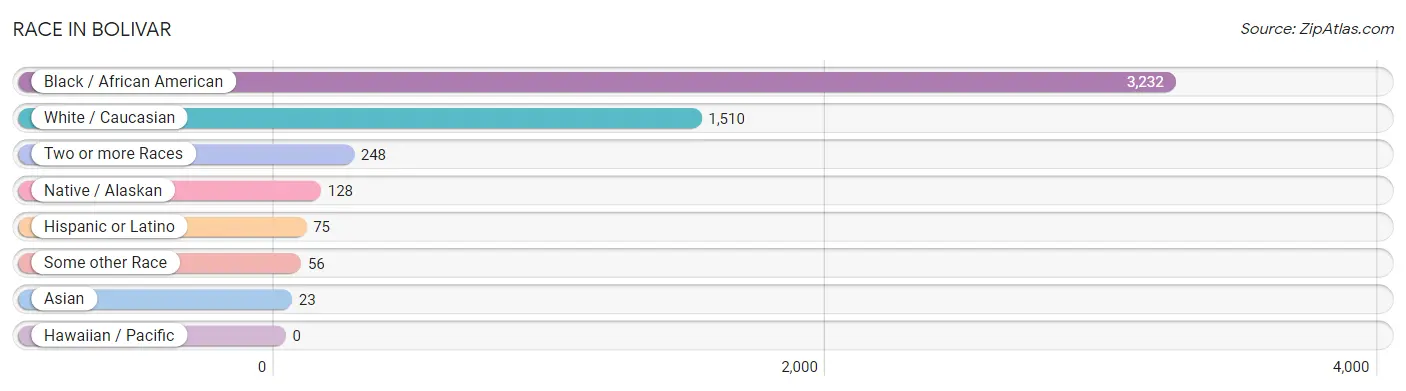
| Race | # Population | % Population |
| Asian | 23 | 0.4% |
| Black / African American | 3,232 | 62.2% |
| Hawaiian / Pacific | 0 | 0.0% |
| Hispanic or Latino | 75 | 1.4% |
| Native / Alaskan | 128 | 2.5% |
| White / Caucasian | 1,510 | 29.1% |
| Two or more Races | 248 | 4.8% |
| Some other Race | 56 | 1.1% |
| Total | 5,197 | 100.0% |
Ancestry in Bolivar
The most populous ancestries reported in Bolivar are American (626 | 12.0%), English (367 | 7.1%), Irish (151 | 2.9%), Blackfeet (76 | 1.5%), and Scottish (74 | 1.4%), together accounting for 24.9% of all Bolivar residents.
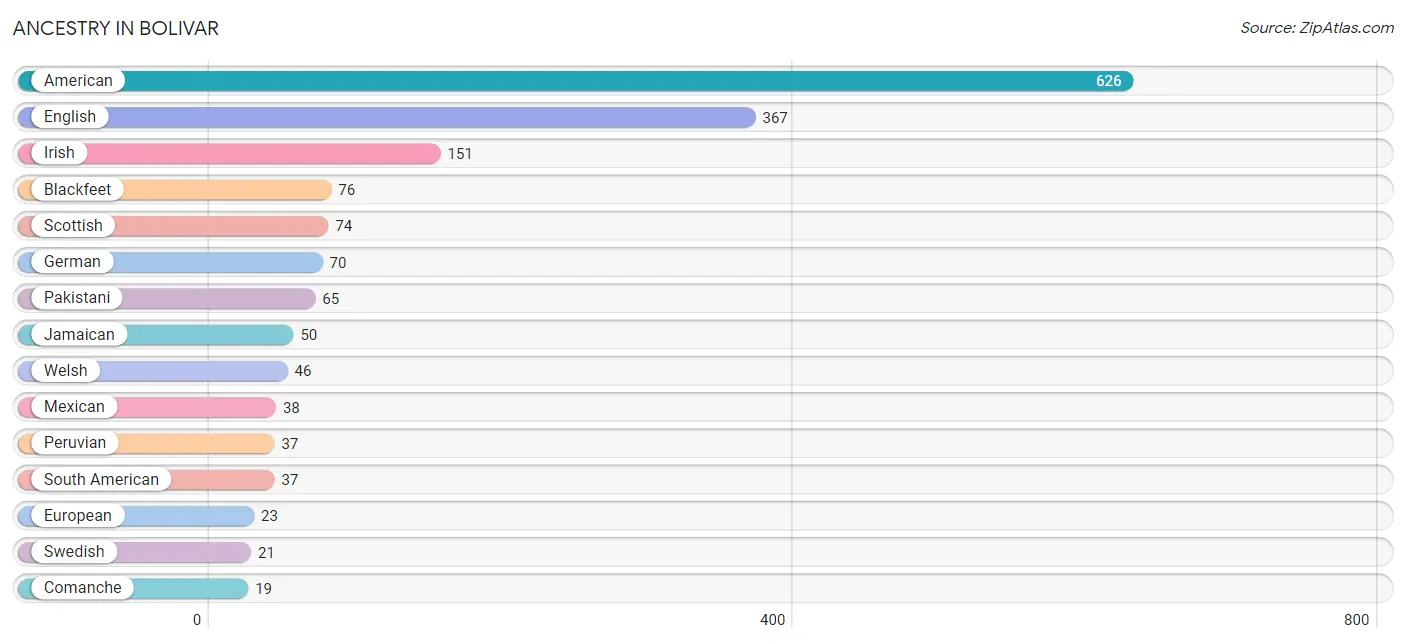
| Ancestry | # Population | % Population |
| American | 626 | 12.0% |
| Blackfeet | 76 | 1.5% |
| British | 8 | 0.2% |
| Chickasaw | 1 | 0.0% |
| Comanche | 19 | 0.4% |
| Dutch | 18 | 0.4% |
| English | 367 | 7.1% |
| European | 23 | 0.4% |
| French | 10 | 0.2% |
| German | 70 | 1.3% |
| Indian (Asian) | 10 | 0.2% |
| Irish | 151 | 2.9% |
| Jamaican | 50 | 1.0% |
| Mexican | 38 | 0.7% |
| Northern European | 15 | 0.3% |
| Pakistani | 65 | 1.3% |
| Peruvian | 37 | 0.7% |
| Scandinavian | 19 | 0.4% |
| Scotch-Irish | 11 | 0.2% |
| Scottish | 74 | 1.4% |
| South American | 37 | 0.7% |
| Swedish | 21 | 0.4% |
| Welsh | 46 | 0.9% | View All 23 Rows |
Immigrants in Bolivar
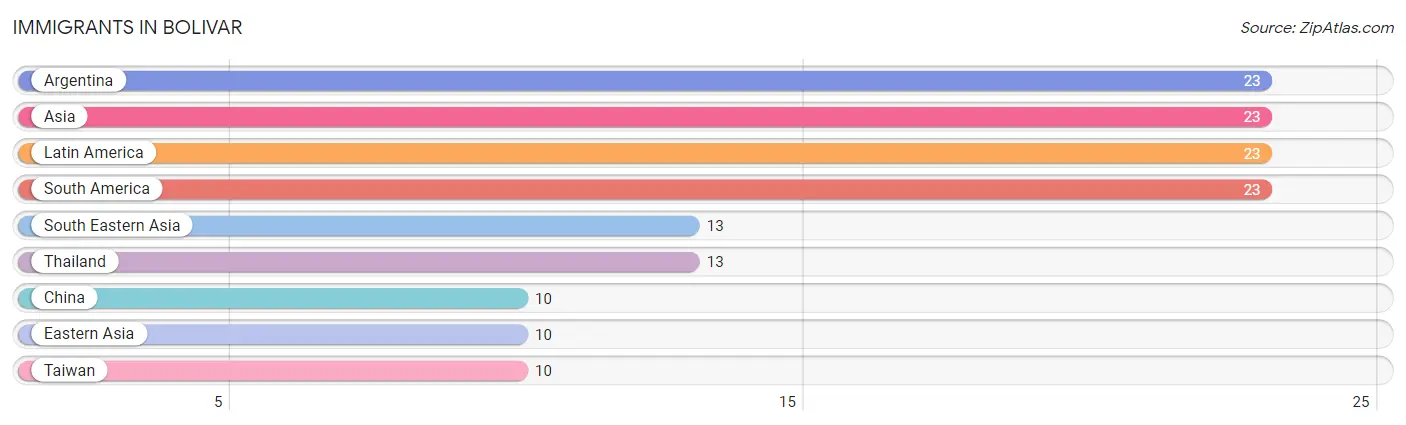
The most numerous immigrant groups reported in Bolivar came from Argentina (23 | 0.4%), Asia (23 | 0.4%), Latin America (23 | 0.4%), South America (23 | 0.4%), and South Eastern Asia (13 | 0.3%), together accounting for 2.0% of all Bolivar residents.
| Immigration Origin | # Population | % Population |
| Argentina | 23 | 0.4% |
| Asia | 23 | 0.4% |
| China | 10 | 0.2% |
| Eastern Asia | 10 | 0.2% |
| Latin America | 23 | 0.4% |
| South America | 23 | 0.4% |
| South Eastern Asia | 13 | 0.3% |
| Taiwan | 10 | 0.2% |
| Thailand | 13 | 0.3% | View All 9 Rows |
Sex and Age in Bolivar
Sex and Age in Bolivar
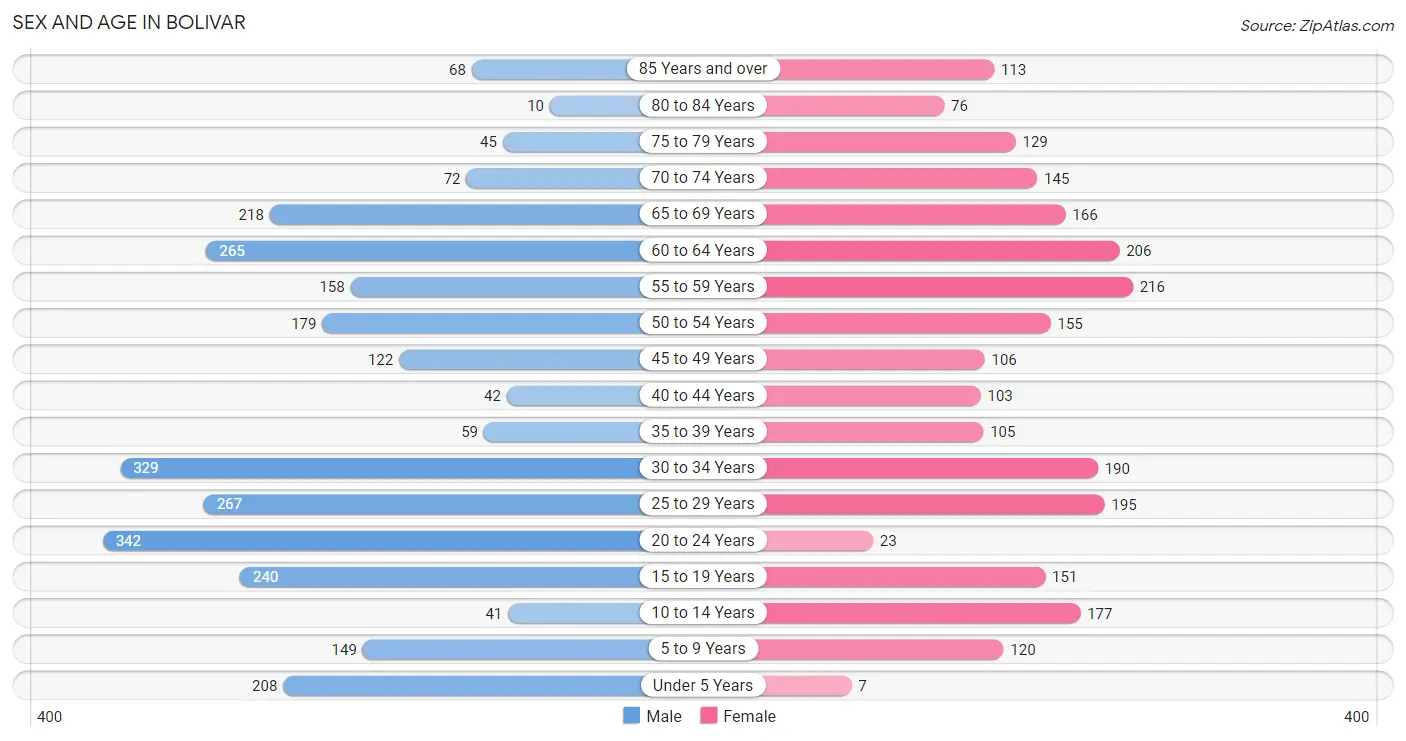
The most populous age groups in Bolivar are 20 to 24 Years (342 | 12.1%) for men and 55 to 59 Years (216 | 9.1%) for women.
| Age Bracket | Male | Female |
| Under 5 Years | 208 (7.4%) | 7 (0.3%) |
| 5 to 9 Years | 149 (5.3%) | 120 (5.0%) |
| 10 to 14 Years | 41 (1.5%) | 177 (7.4%) |
| 15 to 19 Years | 240 (8.5%) | 151 (6.3%) |
| 20 to 24 Years | 342 (12.1%) | 23 (1.0%) |
| 25 to 29 Years | 267 (9.5%) | 195 (8.2%) |
| 30 to 34 Years | 329 (11.7%) | 190 (8.0%) |
| 35 to 39 Years | 59 (2.1%) | 105 (4.4%) |
| 40 to 44 Years | 42 (1.5%) | 103 (4.3%) |
| 45 to 49 Years | 122 (4.3%) | 106 (4.4%) |
| 50 to 54 Years | 179 (6.4%) | 155 (6.5%) |
| 55 to 59 Years | 158 (5.6%) | 216 (9.1%) |
| 60 to 64 Years | 265 (9.4%) | 206 (8.6%) |
| 65 to 69 Years | 218 (7.7%) | 166 (7.0%) |
| 70 to 74 Years | 72 (2.6%) | 145 (6.1%) |
| 75 to 79 Years | 45 (1.6%) | 129 (5.4%) |
| 80 to 84 Years | 10 (0.4%) | 76 (3.2%) |
| 85 Years and over | 68 (2.4%) | 113 (4.7%) |
| Total | 2,814 (100.0%) | 2,383 (100.0%) |
Families and Households in Bolivar
Median Family Size in Bolivar
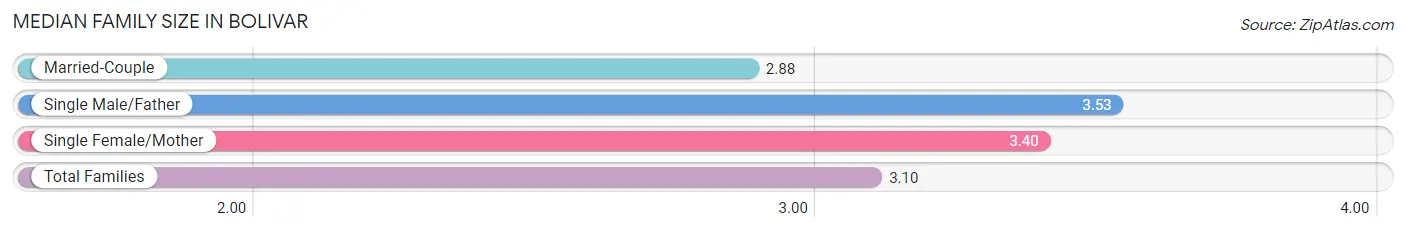
The median family size in Bolivar is 3.10 persons per family, with single male/father families (15 | 1.2%) accounting for the largest median family size of 3.53 persons per family. On the other hand, married-couple families (723 | 57.4%) represent the smallest median family size with 2.88 persons per family.
| Family Type | # Families | Family Size |
| Married-Couple | 723 (57.4%) | 2.88 |
| Single Male/Father | 15 (1.2%) | 3.53 |
| Single Female/Mother | 521 (41.4%) | 3.40 |
| Total Families | 1,259 (100.0%) | 3.10 |
Median Household Size in Bolivar
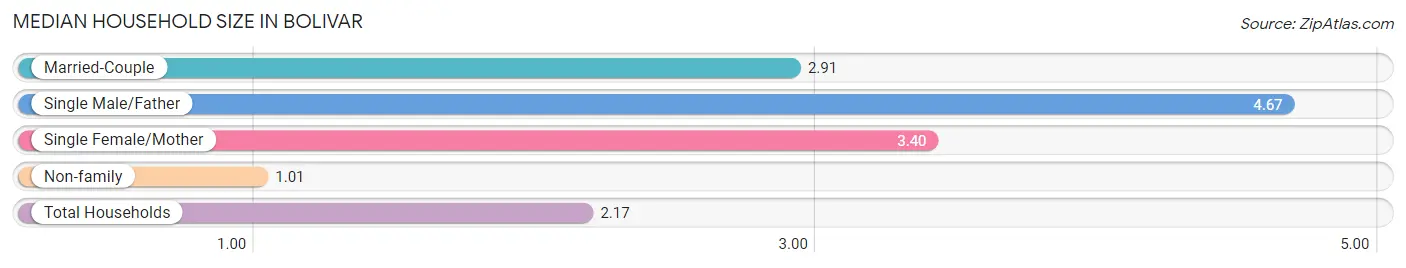
The median household size in Bolivar is 2.17 persons per household, with single male/father households (15 | 0.6%) accounting for the largest median household size of 4.67 persons per household. non-family households (1,052 | 45.5%) represent the smallest median household size with 1.01 persons per household.
| Household Type | # Households | Household Size |
| Married-Couple | 723 (31.3%) | 2.91 |
| Single Male/Father | 15 (0.6%) | 4.67 |
| Single Female/Mother | 521 (22.5%) | 3.40 |
| Non-family | 1,052 (45.5%) | 1.01 |
| Total Households | 2,311 (100.0%) | 2.17 |
Household Size by Marriage Status in Bolivar
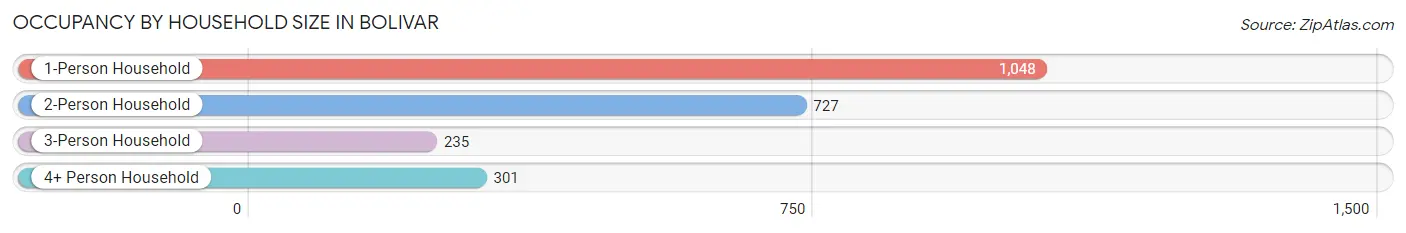
Out of a total of 2,311 households in Bolivar, 1,259 (54.5%) are family households, while 1,052 (45.5%) are nonfamily households. The most numerous type of family households are 2-person households, comprising 723, and the most common type of nonfamily households are 1-person households, comprising 1,048.
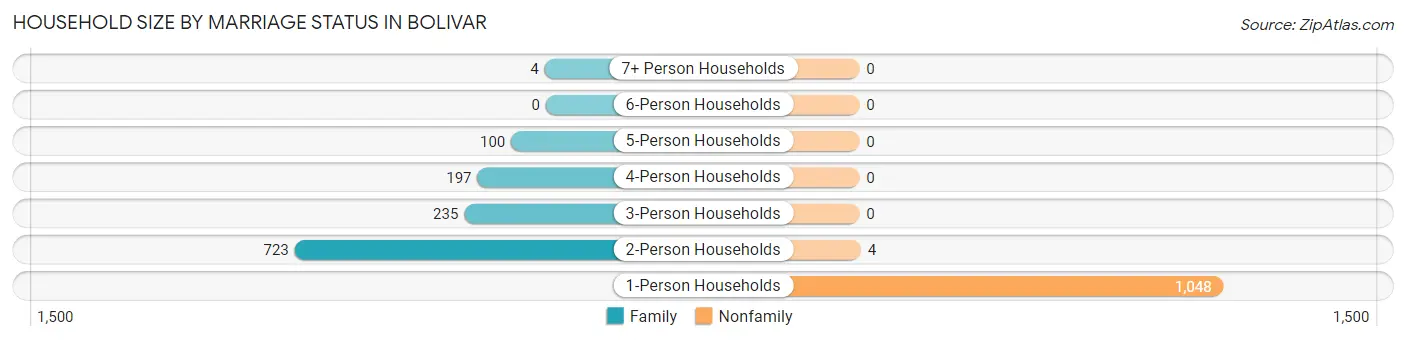
| Household Size | Family Households | Nonfamily Households |
| 1-Person Households | - | 1,048 (45.4%) |
| 2-Person Households | 723 (31.3%) | 4 (0.2%) |
| 3-Person Households | 235 (10.2%) | 0 (0.0%) |
| 4-Person Households | 197 (8.5%) | 0 (0.0%) |
| 5-Person Households | 100 (4.3%) | 0 (0.0%) |
| 6-Person Households | 0 (0.0%) | 0 (0.0%) |
| 7+ Person Households | 4 (0.2%) | 0 (0.0%) |
| Total | 1,259 (54.5%) | 1,052 (45.5%) |
Female Fertility in Bolivar
Fertility by Age in Bolivar
Average fertility rate in Bolivar is 49.0 births per 1,000 women. Women in the age bracket of 20 to 34 years have the highest fertility rate with 105.0 births per 1,000 women. Women in the age bracket of 20 to 34 years acount for 100.0% of all women with births.
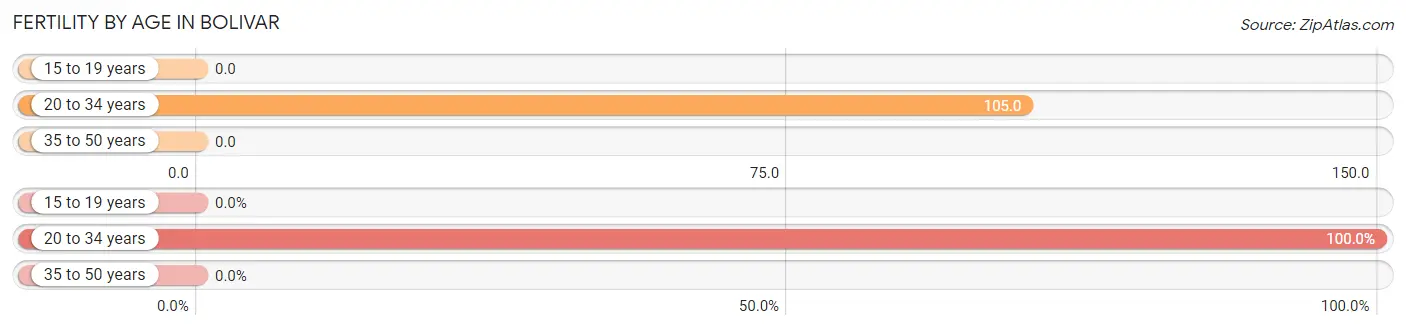
| Age Bracket | Women with Births | Births / 1,000 Women |
| 15 to 19 years | 0 (0.0%) | 0.0 |
| 20 to 34 years | 43 (100.0%) | 105.0 |
| 35 to 50 years | 0 (0.0%) | 0.0 |
| Total | 43 (100.0%) | 49.0 |
Fertility by Age by Marriage Status in Bolivar
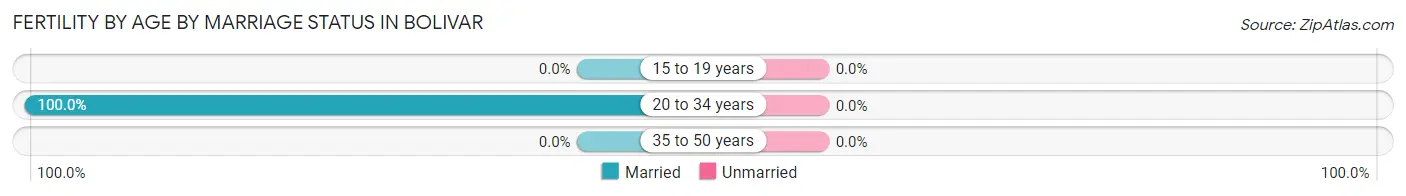
| Age Bracket | Married | Unmarried |
| 15 to 19 years | 0 (0.0%) | 0 (0.0%) |
| 20 to 34 years | 43 (100.0%) | 0 (0.0%) |
| 35 to 50 years | 0 (0.0%) | 0 (0.0%) |
| Total | 43 (100.0%) | 0 (0.0%) |
Fertility by Education in Bolivar
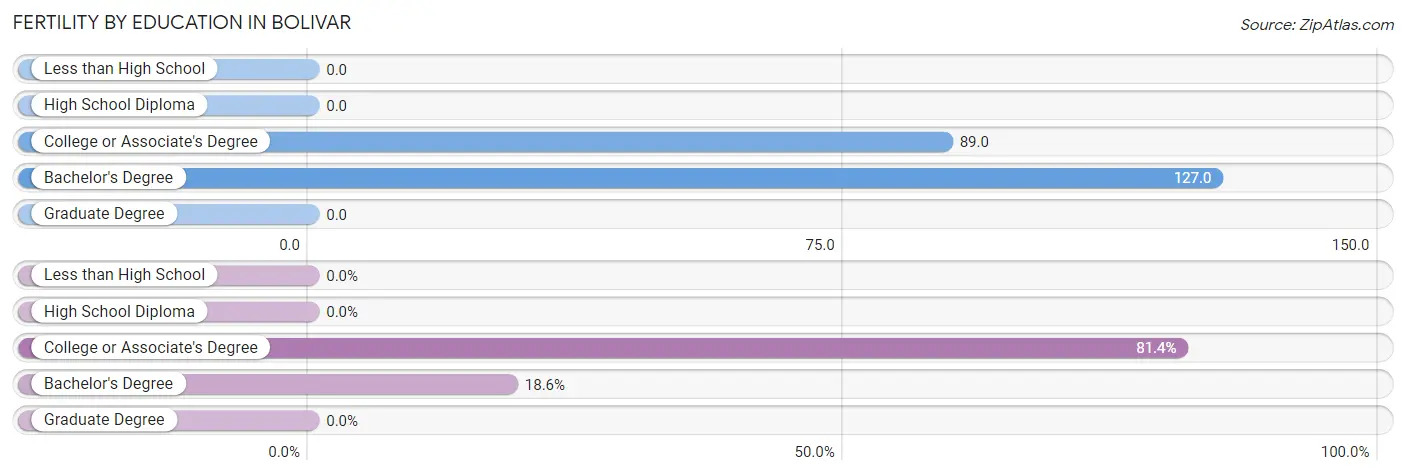
| Educational Attainment | Women with Births | Births / 1,000 Women |
| Less than High School | 0 (0.0%) | 0.0 |
| High School Diploma | 0 (0.0%) | 0.0 |
| College or Associate's Degree | 35 (81.4%) | 89.0 |
| Bachelor's Degree | 8 (18.6%) | 127.0 |
| Graduate Degree | 0 (0.0%) | 0.0 |
| Total | 43 (100.0%) | 49.0 |
Fertility by Education by Marriage Status in Bolivar
| Educational Attainment | Married | Unmarried |
| Less than High School | 0 (0.0%) | 0 (0.0%) |
| High School Diploma | 0 (0.0%) | 0 (0.0%) |
| College or Associate's Degree | 35 (100.0%) | 0 (0.0%) |
| Bachelor's Degree | 8 (100.0%) | 0 (0.0%) |
| Graduate Degree | 0 (0.0%) | 0 (0.0%) |
| Total | 43 (100.0%) | 0 (0.0%) |
Employment Characteristics in Bolivar
Employment by Class of Employer in Bolivar
Among the 2,101 employed individuals in Bolivar, private company employees (1,421 | 67.6%), state government employees (230 | 11.0%), and local government employees (220 | 10.5%) make up the most common classes of employment.
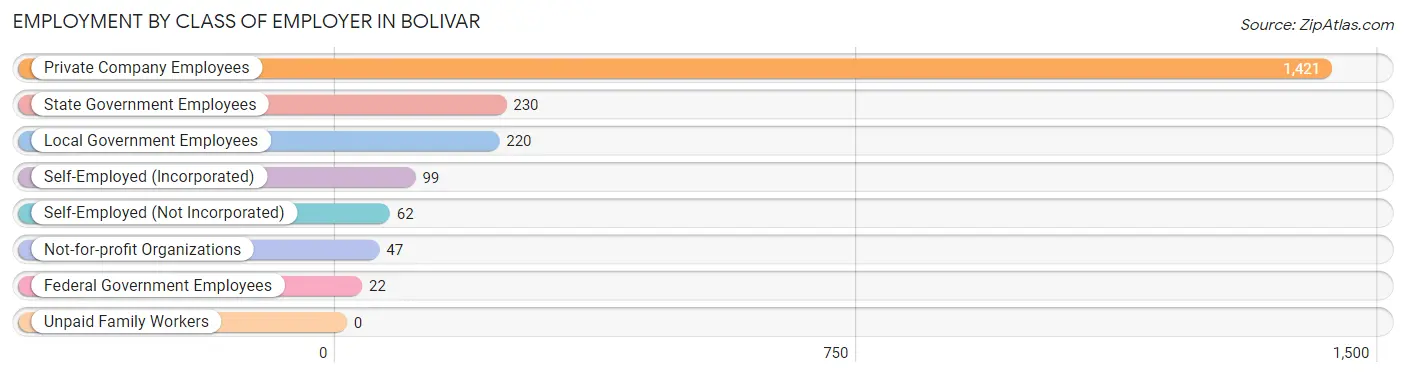
| Employer Class | # Employees | % Employees |
| Private Company Employees | 1,421 | 67.6% |
| Self-Employed (Incorporated) | 99 | 4.7% |
| Self-Employed (Not Incorporated) | 62 | 2.9% |
| Not-for-profit Organizations | 47 | 2.2% |
| Local Government Employees | 220 | 10.5% |
| State Government Employees | 230 | 11.0% |
| Federal Government Employees | 22 | 1.1% |
| Unpaid Family Workers | 0 | 0.0% |
| Total | 2,101 | 100.0% |
Employment Status by Age in Bolivar
According to the labor force statistics for Bolivar, out of the total population over 16 years of age (4,485), 62.3% or 2,794 individuals are in the labor force, with 21.9% or 612 of them unemployed. The age group with the highest labor force participation rate is 25 to 29 years, with 100.0% or 462 individuals in the labor force. Within the labor force, the 16 to 19 years age range has the highest percentage of unemployed individuals, with 53.2% or 115 of them being unemployed.
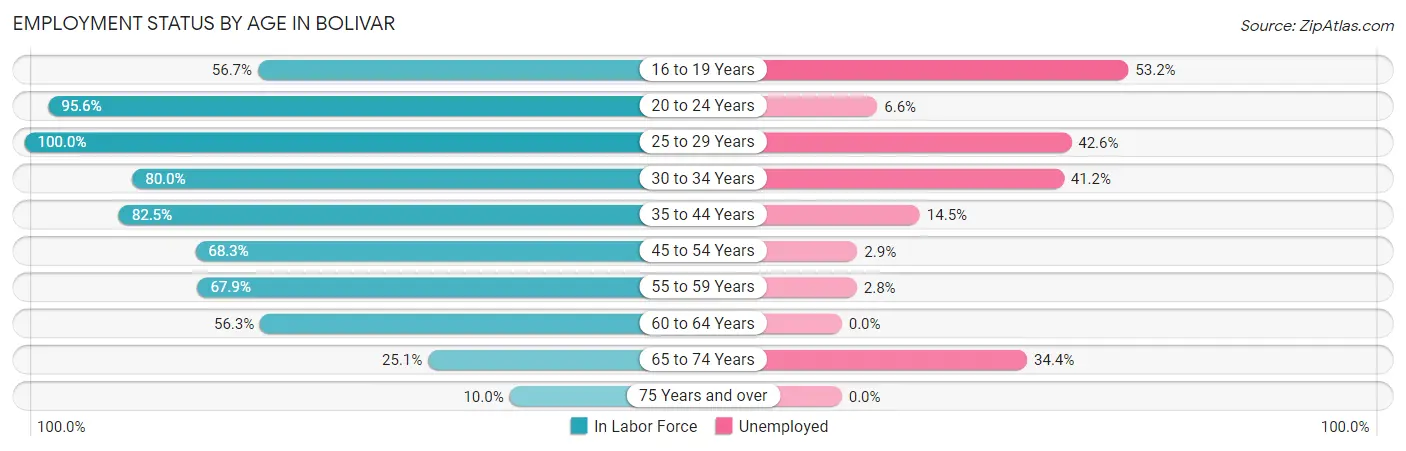
| Age Bracket | In Labor Force | Unemployed |
| 16 to 19 Years | 216 (56.7%) | 115 (53.2%) |
| 20 to 24 Years | 349 (95.6%) | 23 (6.6%) |
| 25 to 29 Years | 462 (100.0%) | 197 (42.6%) |
| 30 to 34 Years | 415 (80.0%) | 171 (41.2%) |
| 35 to 44 Years | 255 (82.5%) | 37 (14.5%) |
| 45 to 54 Years | 384 (68.3%) | 11 (2.9%) |
| 55 to 59 Years | 254 (67.9%) | 7 (2.8%) |
| 60 to 64 Years | 265 (56.3%) | 0 (0.0%) |
| 65 to 74 Years | 151 (25.1%) | 52 (34.4%) |
| 75 Years and over | 44 (10.0%) | 0 (0.0%) |
| Total | 2,794 (62.3%) | 612 (21.9%) |
Employment Status by Educational Attainment in Bolivar
According to labor force statistics for Bolivar, 75.5% of individuals (2,036) out of the total population between 25 and 64 years of age (2,697) are in the labor force, with 20.8% or 423 of them being unemployed. The group with the highest labor force participation rate are those with the educational attainment of less than high school, with 86.6% or 427 individuals in the labor force. Within the labor force, individuals with less than high school education have the highest percentage of unemployment, with 71.9% or 307 of them being unemployed.
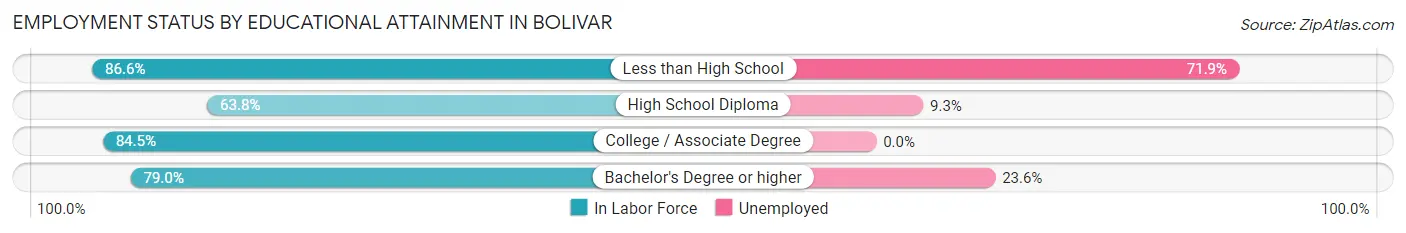
| Educational Attainment | In Labor Force | Unemployed |
| Less than High School | 427 (86.6%) | 354 (71.9%) |
| High School Diploma | 742 (63.8%) | 108 (9.3%) |
| College / Associate Degree | 667 (84.5%) | 0 (0.0%) |
| Bachelor's Degree or higher | 199 (79.0%) | 59 (23.6%) |
| Total | 2,036 (75.5%) | 561 (20.8%) |
Employment Occupations by Sex in Bolivar
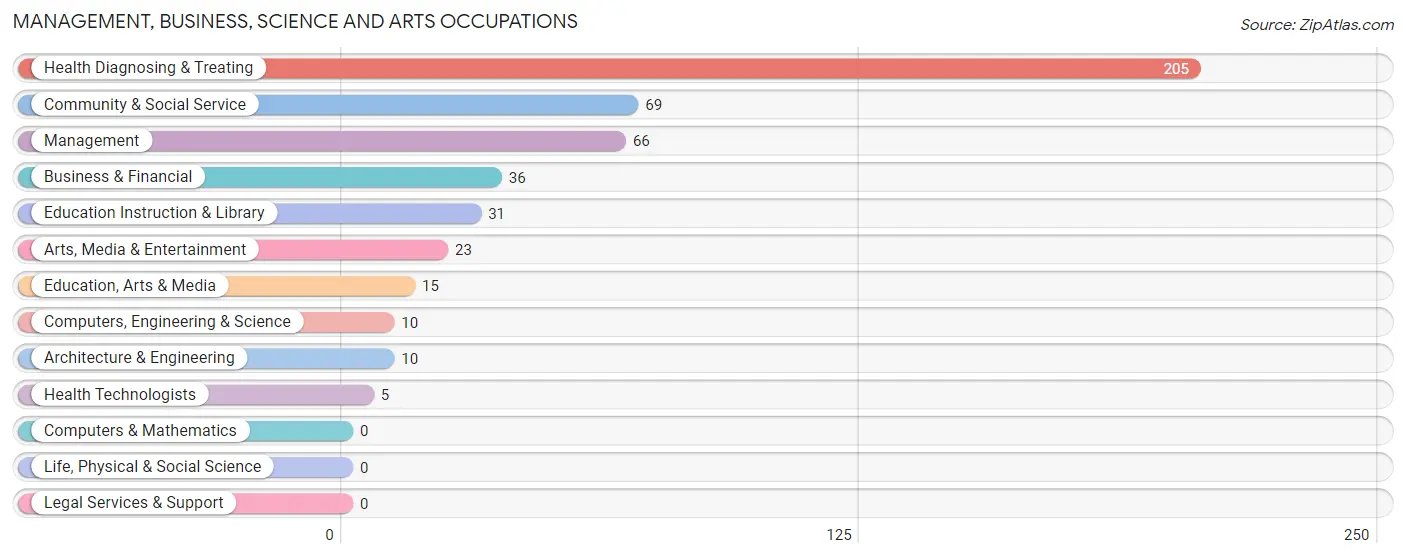
Management, Business, Science and Arts Occupations
The most common Management, Business, Science and Arts occupations in Bolivar are Health Diagnosing & Treating (205 | 9.4%), Community & Social Service (69 | 3.2%), Management (66 | 3.0%), Business & Financial (36 | 1.7%), and Education Instruction & Library (31 | 1.4%).
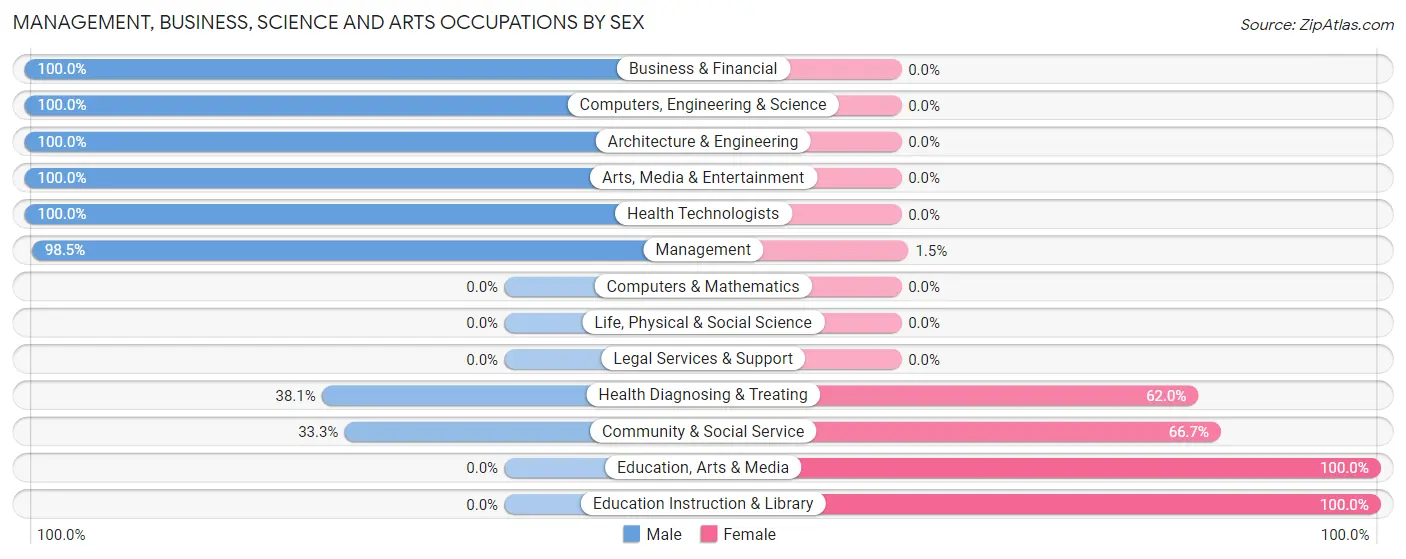
Management, Business, Science and Arts Occupations by Sex
Within the Management, Business, Science and Arts occupations in Bolivar, the most male-oriented occupations are Business & Financial (100.0%), Computers, Engineering & Science (100.0%), and Architecture & Engineering (100.0%), while the most female-oriented occupations are Education, Arts & Media (100.0%), Education Instruction & Library (100.0%), and Community & Social Service (66.7%).
| Occupation | Male | Female |
| Management | 65 (98.5%) | 1 (1.5%) |
| Business & Financial | 36 (100.0%) | 0 (0.0%) |
| Computers, Engineering & Science | 10 (100.0%) | 0 (0.0%) |
| Computers & Mathematics | 0 (0.0%) | 0 (0.0%) |
| Architecture & Engineering | 10 (100.0%) | 0 (0.0%) |
| Life, Physical & Social Science | 0 (0.0%) | 0 (0.0%) |
| Community & Social Service | 23 (33.3%) | 46 (66.7%) |
| Education, Arts & Media | 0 (0.0%) | 15 (100.0%) |
| Legal Services & Support | 0 (0.0%) | 0 (0.0%) |
| Education Instruction & Library | 0 (0.0%) | 31 (100.0%) |
| Arts, Media & Entertainment | 23 (100.0%) | 0 (0.0%) |
| Health Diagnosing & Treating | 78 (38.1%) | 127 (62.0%) |
| Health Technologists | 5 (100.0%) | 0 (0.0%) |
| Total (Category) | 212 (54.9%) | 174 (45.1%) |
| Total (Overall) | 1,306 (59.9%) | 876 (40.2%) |
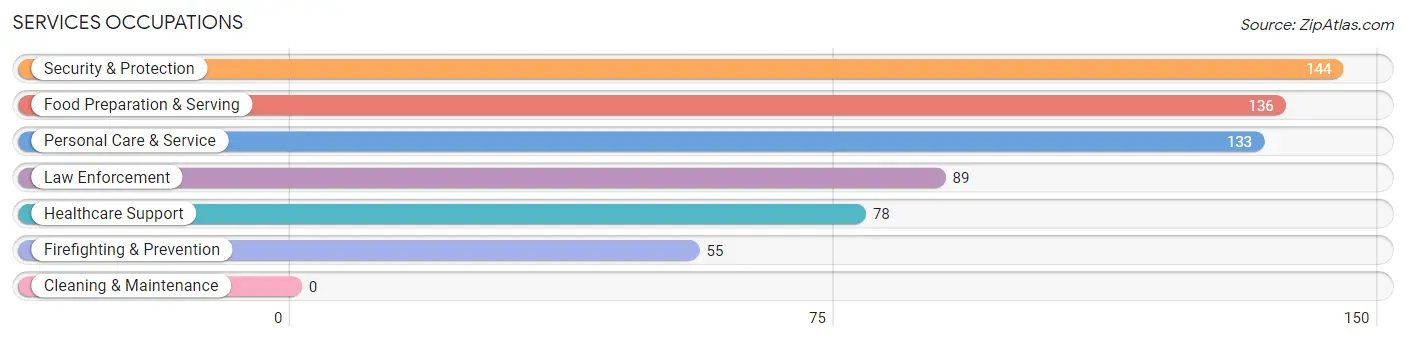
Services Occupations
The most common Services occupations in Bolivar are Security & Protection (144 | 6.6%), Food Preparation & Serving (136 | 6.2%), Personal Care & Service (133 | 6.1%), Law Enforcement (89 | 4.1%), and Healthcare Support (78 | 3.6%).
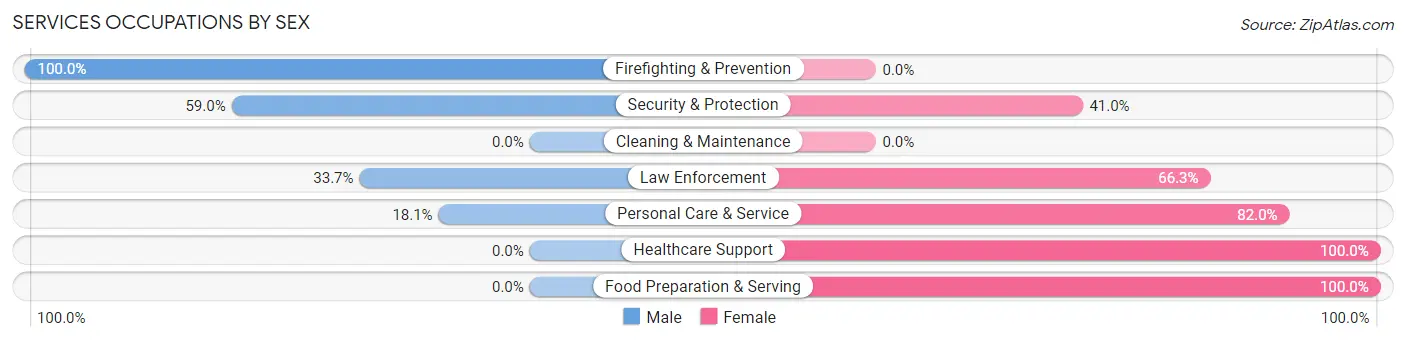
Services Occupations by Sex
Within the Services occupations in Bolivar, the most male-oriented occupations are Firefighting & Prevention (100.0%), Security & Protection (59.0%), and Law Enforcement (33.7%), while the most female-oriented occupations are Healthcare Support (100.0%), Food Preparation & Serving (100.0%), and Personal Care & Service (82.0%).
| Occupation | Male | Female |
| Healthcare Support | 0 (0.0%) | 78 (100.0%) |
| Security & Protection | 85 (59.0%) | 59 (41.0%) |
| Firefighting & Prevention | 55 (100.0%) | 0 (0.0%) |
| Law Enforcement | 30 (33.7%) | 59 (66.3%) |
| Food Preparation & Serving | 0 (0.0%) | 136 (100.0%) |
| Cleaning & Maintenance | 0 (0.0%) | 0 (0.0%) |
| Personal Care & Service | 24 (18.0%) | 109 (82.0%) |
| Total (Category) | 109 (22.2%) | 382 (77.8%) |
| Total (Overall) | 1,306 (59.9%) | 876 (40.2%) |
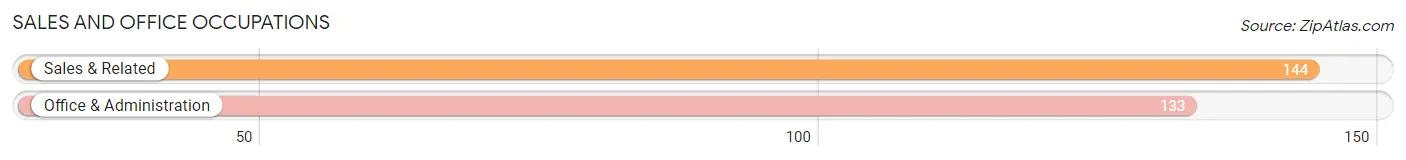
Sales and Office Occupations
The most common Sales and Office occupations in Bolivar are Sales & Related (144 | 6.6%), and Office & Administration (133 | 6.1%).
Sales and Office Occupations by Sex
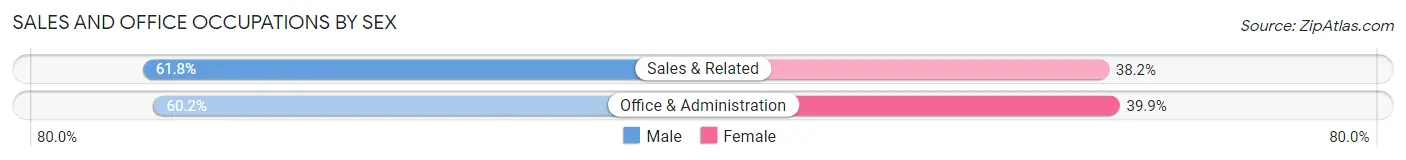
| Occupation | Male | Female |
| Sales & Related | 89 (61.8%) | 55 (38.2%) |
| Office & Administration | 80 (60.2%) | 53 (39.9%) |
| Total (Category) | 169 (61.0%) | 108 (39.0%) |
| Total (Overall) | 1,306 (59.9%) | 876 (40.2%) |
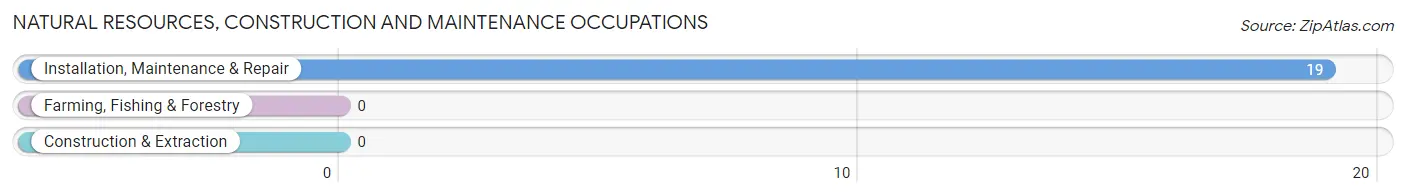
Natural Resources, Construction and Maintenance Occupations
The most common Natural Resources, Construction and Maintenance occupations in Bolivar are , and Installation, Maintenance & Repair (19 | 0.9%).
Natural Resources, Construction and Maintenance Occupations by Sex
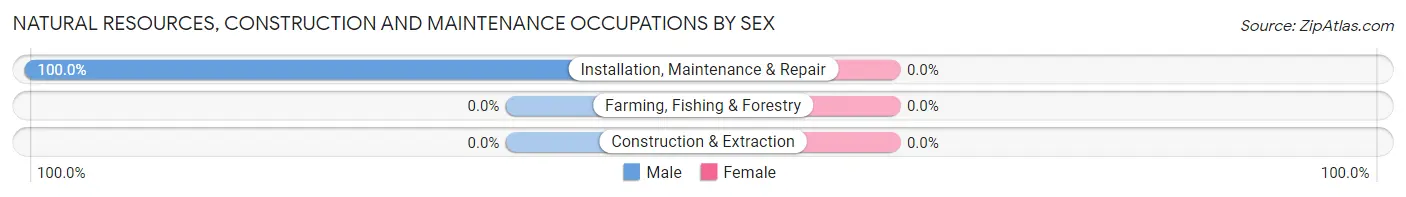
| Occupation | Male | Female |
| Farming, Fishing & Forestry | 0 (0.0%) | 0 (0.0%) |
| Construction & Extraction | 0 (0.0%) | 0 (0.0%) |
| Installation, Maintenance & Repair | 19 (100.0%) | 0 (0.0%) |
| Total (Category) | 19 (100.0%) | 0 (0.0%) |
| Total (Overall) | 1,306 (59.9%) | 876 (40.2%) |
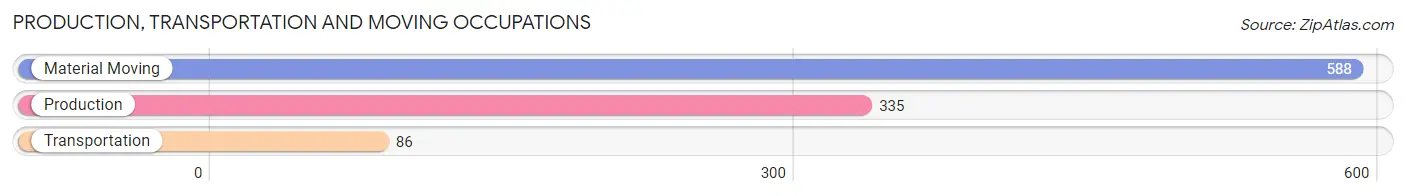
Production, Transportation and Moving Occupations
The most common Production, Transportation and Moving occupations in Bolivar are Material Moving (588 | 27.0%), Production (335 | 15.3%), and Transportation (86 | 3.9%).
Production, Transportation and Moving Occupations by Sex
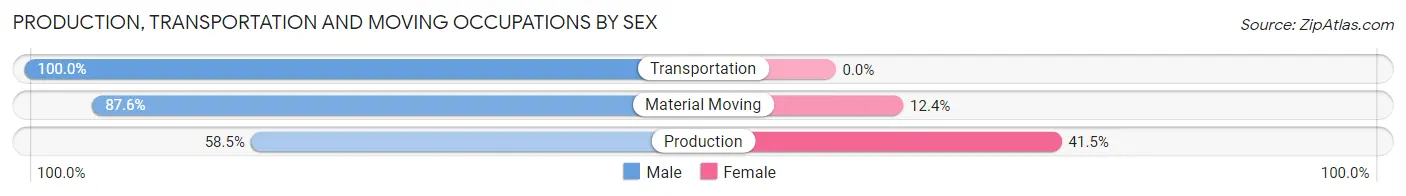
| Occupation | Male | Female |
| Production | 196 (58.5%) | 139 (41.5%) |
| Transportation | 86 (100.0%) | 0 (0.0%) |
| Material Moving | 515 (87.6%) | 73 (12.4%) |
| Total (Category) | 797 (79.0%) | 212 (21.0%) |
| Total (Overall) | 1,306 (59.9%) | 876 (40.2%) |
Employment Industries by Sex in Bolivar
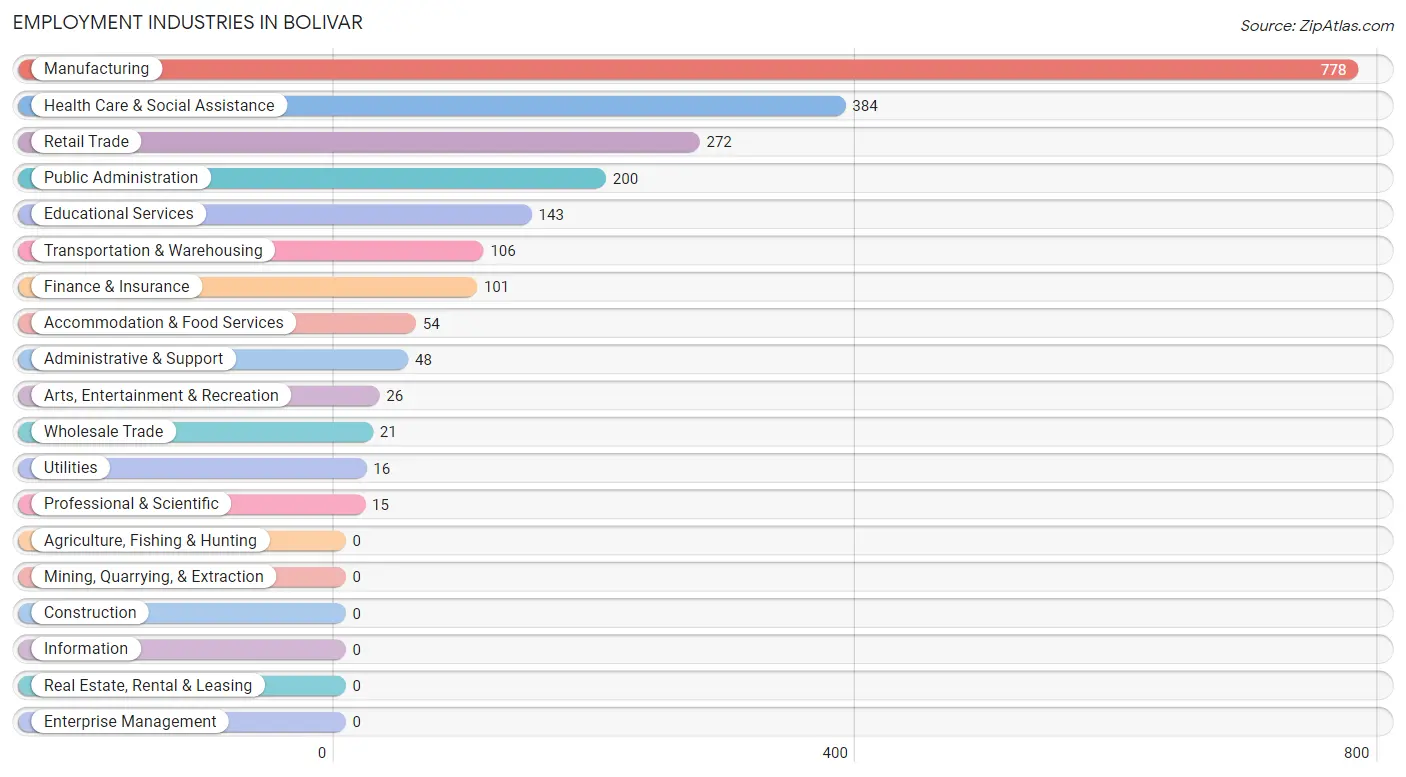
Employment Industries in Bolivar
The major employment industries in Bolivar include Manufacturing (778 | 35.7%), Health Care & Social Assistance (384 | 17.6%), Retail Trade (272 | 12.5%), Public Administration (200 | 9.2%), and Educational Services (143 | 6.6%).
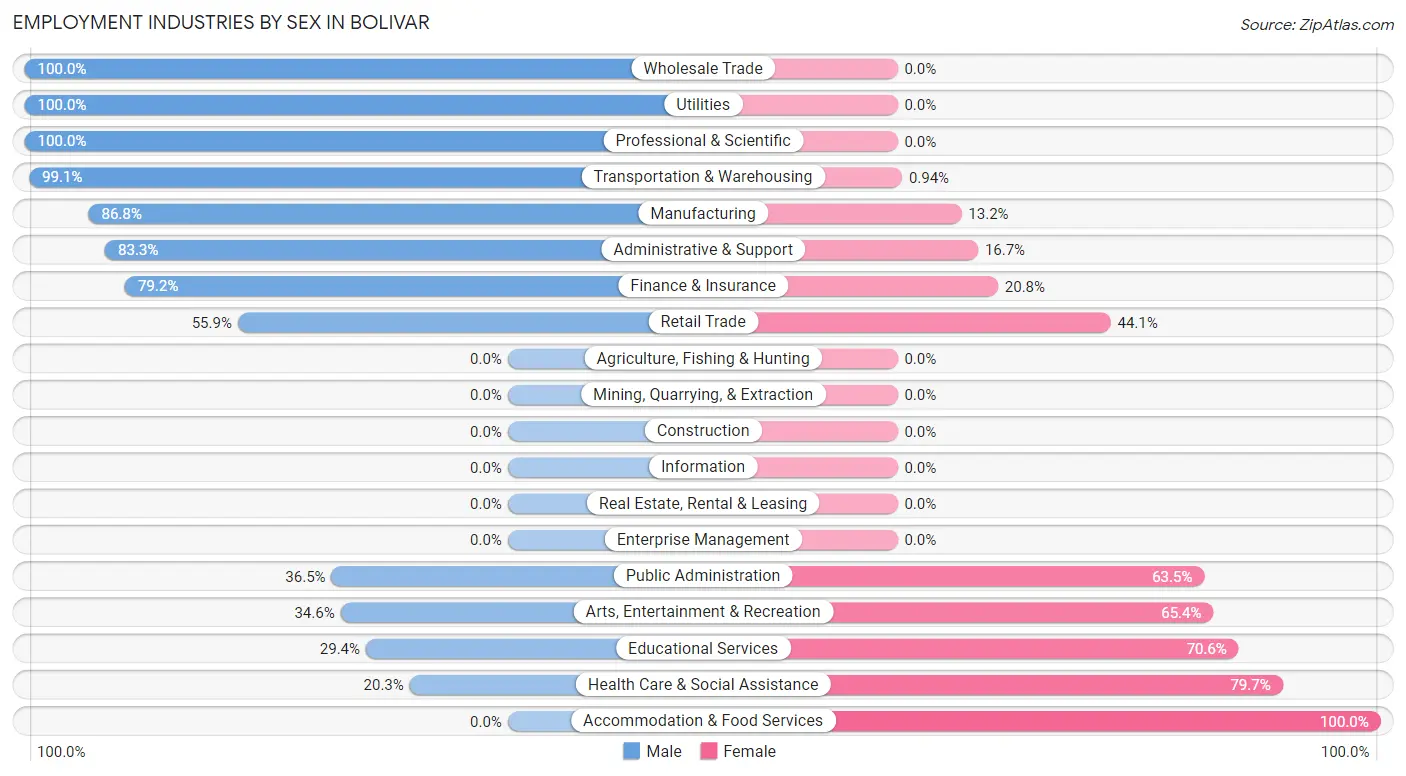
Employment Industries by Sex in Bolivar
The Bolivar industries that see more men than women are Wholesale Trade (100.0%), Utilities (100.0%), and Professional & Scientific (100.0%), whereas the industries that tend to have a higher number of women are Accommodation & Food Services (100.0%), Health Care & Social Assistance (79.7%), and Educational Services (70.6%).
| Industry | Male | Female |
| Agriculture, Fishing & Hunting | 0 (0.0%) | 0 (0.0%) |
| Mining, Quarrying, & Extraction | 0 (0.0%) | 0 (0.0%) |
| Construction | 0 (0.0%) | 0 (0.0%) |
| Manufacturing | 675 (86.8%) | 103 (13.2%) |
| Wholesale Trade | 21 (100.0%) | 0 (0.0%) |
| Retail Trade | 152 (55.9%) | 120 (44.1%) |
| Transportation & Warehousing | 105 (99.1%) | 1 (0.9%) |
| Utilities | 16 (100.0%) | 0 (0.0%) |
| Information | 0 (0.0%) | 0 (0.0%) |
| Finance & Insurance | 80 (79.2%) | 21 (20.8%) |
| Real Estate, Rental & Leasing | 0 (0.0%) | 0 (0.0%) |
| Professional & Scientific | 15 (100.0%) | 0 (0.0%) |
| Enterprise Management | 0 (0.0%) | 0 (0.0%) |
| Administrative & Support | 40 (83.3%) | 8 (16.7%) |
| Educational Services | 42 (29.4%) | 101 (70.6%) |
| Health Care & Social Assistance | 78 (20.3%) | 306 (79.7%) |
| Arts, Entertainment & Recreation | 9 (34.6%) | 17 (65.4%) |
| Accommodation & Food Services | 0 (0.0%) | 54 (100.0%) |
| Public Administration | 73 (36.5%) | 127 (63.5%) |
| Total | 1,306 (59.9%) | 876 (40.2%) |
Education in Bolivar
School Enrollment in Bolivar
The most common levels of schooling among the 1,132 students in Bolivar are college / undergraduate (312 | 27.6%), high school (300 | 26.5%), and elementary school (220 | 19.4%).
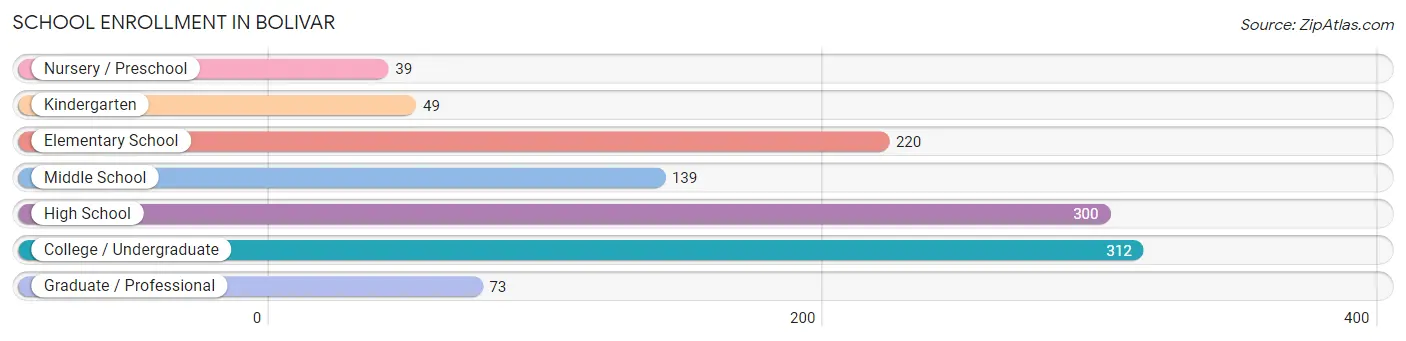
| School Level | # Students | % Students |
| Nursery / Preschool | 39 | 3.5% |
| Kindergarten | 49 | 4.3% |
| Elementary School | 220 | 19.4% |
| Middle School | 139 | 12.3% |
| High School | 300 | 26.5% |
| College / Undergraduate | 312 | 27.6% |
| Graduate / Professional | 73 | 6.5% |
| Total | 1,132 | 100.0% |
School Enrollment by Age by Funding Source in Bolivar
Out of a total of 1,132 students who are enrolled in schools in Bolivar, 194 (17.1%) attend a private institution, while the remaining 938 (82.9%) are enrolled in public schools. The age group of 25 to 34 year olds has the highest likelihood of being enrolled in private schools, with 110 (71.9% in the age bracket) enrolled. Conversely, the age group of 3 to 4 year olds has the lowest likelihood of being enrolled in a private school, with 35 (100.0% in the age bracket) attending a public institution.
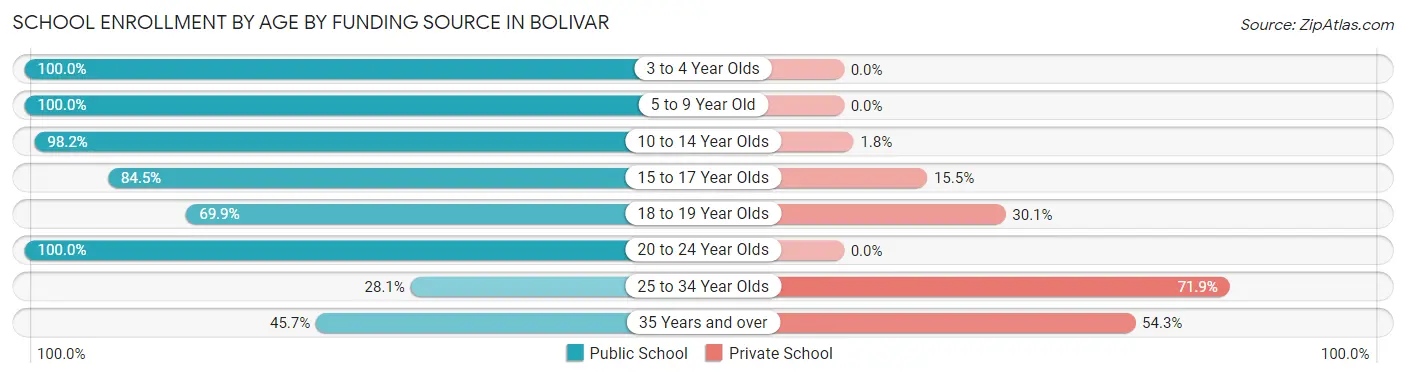
| Age Bracket | Public School | Private School |
| 3 to 4 Year Olds | 35 (100.0%) | 0 (0.0%) |
| 5 to 9 Year Old | 269 (100.0%) | 0 (0.0%) |
| 10 to 14 Year Olds | 214 (98.2%) | 4 (1.8%) |
| 15 to 17 Year Olds | 196 (84.5%) | 36 (15.5%) |
| 18 to 19 Year Olds | 58 (69.9%) | 25 (30.1%) |
| 20 to 24 Year Olds | 107 (100.0%) | 0 (0.0%) |
| 25 to 34 Year Olds | 43 (28.1%) | 110 (71.9%) |
| 35 Years and over | 16 (45.7%) | 19 (54.3%) |
| Total | 938 (82.9%) | 194 (17.1%) |
Educational Attainment by Field of Study in Bolivar
Social sciences (77 | 19.0%), business (64 | 15.8%), education (63 | 15.5%), liberal arts & history (56 | 13.8%), and visual & performing arts (27 | 6.7%) are the most common fields of study among 406 individuals in Bolivar who have obtained a bachelor's degree or higher.
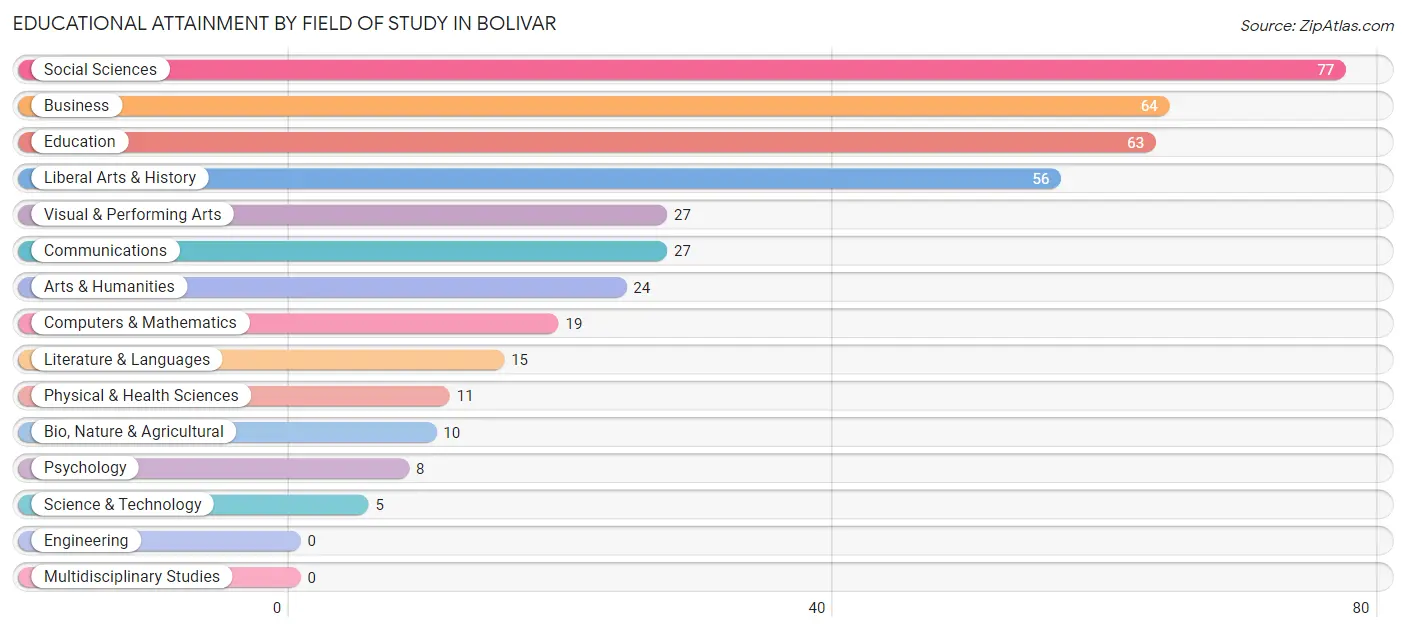
| Field of Study | # Graduates | % Graduates |
| Computers & Mathematics | 19 | 4.7% |
| Bio, Nature & Agricultural | 10 | 2.5% |
| Physical & Health Sciences | 11 | 2.7% |
| Psychology | 8 | 2.0% |
| Social Sciences | 77 | 19.0% |
| Engineering | 0 | 0.0% |
| Multidisciplinary Studies | 0 | 0.0% |
| Science & Technology | 5 | 1.2% |
| Business | 64 | 15.8% |
| Education | 63 | 15.5% |
| Literature & Languages | 15 | 3.7% |
| Liberal Arts & History | 56 | 13.8% |
| Visual & Performing Arts | 27 | 6.7% |
| Communications | 27 | 6.7% |
| Arts & Humanities | 24 | 5.9% |
| Total | 406 | 100.0% |
Transportation & Commute in Bolivar
Vehicle Availability by Sex in Bolivar
The most prevalent vehicle ownership categories in Bolivar are males with 1 vehicle (345, accounting for 26.9%) and females with 1 vehicle (265, making up 42.2%).
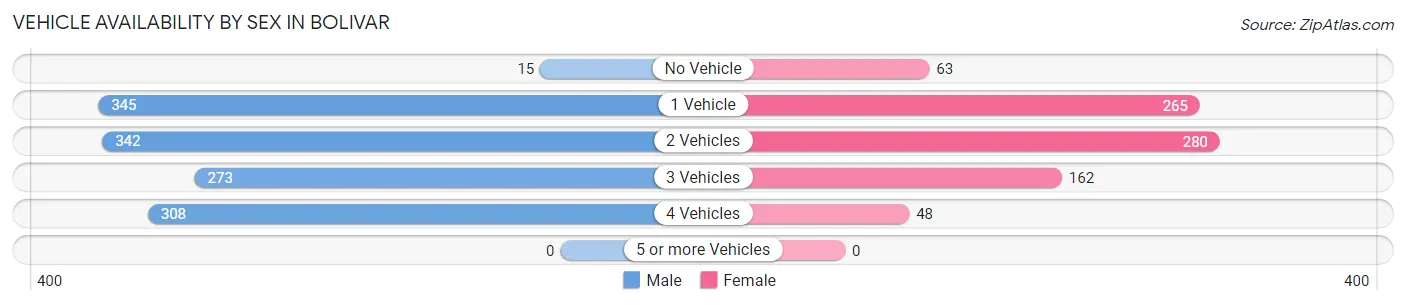
| Vehicles Available | Male | Female |
| No Vehicle | 15 (1.2%) | 63 (7.7%) |
| 1 Vehicle | 345 (26.9%) | 265 (32.4%) |
| 2 Vehicles | 342 (26.7%) | 280 (34.2%) |
| 3 Vehicles | 273 (21.3%) | 162 (19.8%) |
| 4 Vehicles | 308 (24.0%) | 48 (5.9%) |
| 5 or more Vehicles | 0 (0.0%) | 0 (0.0%) |
| Total | 1,283 (100.0%) | 818 (100.0%) |
Commute Time in Bolivar
The most frequently occuring commute durations in Bolivar are 5 to 9 minutes (329 commuters, 16.7%), 45 to 59 minutes (260 commuters, 13.2%), and 15 to 19 minutes (216 commuters, 11.0%).
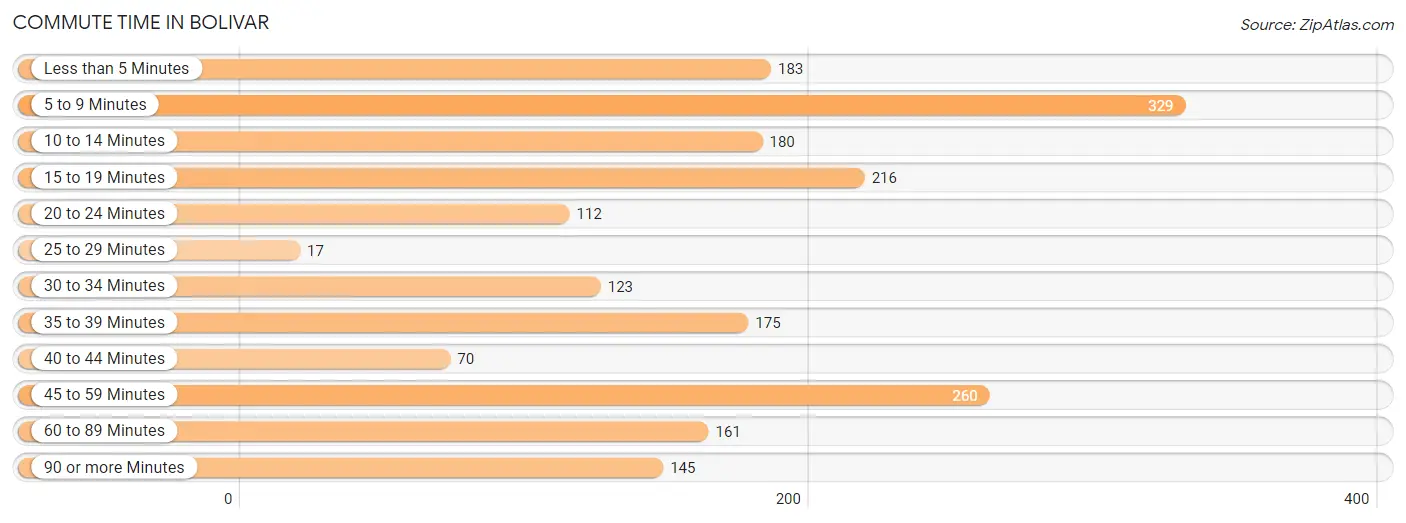
| Commute Time | # Commuters | % Commuters |
| Less than 5 Minutes | 183 | 9.3% |
| 5 to 9 Minutes | 329 | 16.7% |
| 10 to 14 Minutes | 180 | 9.1% |
| 15 to 19 Minutes | 216 | 11.0% |
| 20 to 24 Minutes | 112 | 5.7% |
| 25 to 29 Minutes | 17 | 0.9% |
| 30 to 34 Minutes | 123 | 6.2% |
| 35 to 39 Minutes | 175 | 8.9% |
| 40 to 44 Minutes | 70 | 3.5% |
| 45 to 59 Minutes | 260 | 13.2% |
| 60 to 89 Minutes | 161 | 8.2% |
| 90 or more Minutes | 145 | 7.4% |
Commute Time by Sex in Bolivar
The most common commute times in Bolivar are 5 to 9 minutes (215 commuters, 18.2%) for males and 45 to 59 minutes (177 commuters, 22.3%) for females.
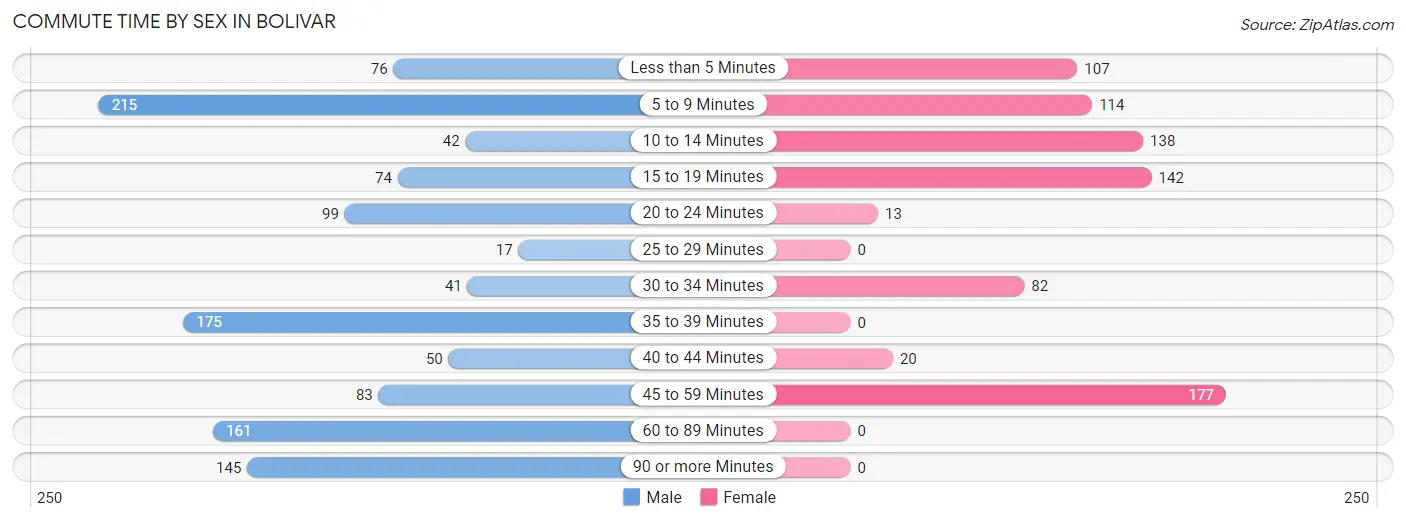
| Commute Time | Male | Female |
| Less than 5 Minutes | 76 (6.5%) | 107 (13.5%) |
| 5 to 9 Minutes | 215 (18.2%) | 114 (14.4%) |
| 10 to 14 Minutes | 42 (3.6%) | 138 (17.4%) |
| 15 to 19 Minutes | 74 (6.3%) | 142 (17.9%) |
| 20 to 24 Minutes | 99 (8.4%) | 13 (1.6%) |
| 25 to 29 Minutes | 17 (1.4%) | 0 (0.0%) |
| 30 to 34 Minutes | 41 (3.5%) | 82 (10.3%) |
| 35 to 39 Minutes | 175 (14.9%) | 0 (0.0%) |
| 40 to 44 Minutes | 50 (4.2%) | 20 (2.5%) |
| 45 to 59 Minutes | 83 (7.0%) | 177 (22.3%) |
| 60 to 89 Minutes | 161 (13.7%) | 0 (0.0%) |
| 90 or more Minutes | 145 (12.3%) | 0 (0.0%) |
Time of Departure to Work by Sex in Bolivar
The most frequent times of departure to work in Bolivar are 12:00 AM to 4:59 AM (240, 20.4%) for males and 7:00 AM to 7:29 AM (167, 21.1%) for females.
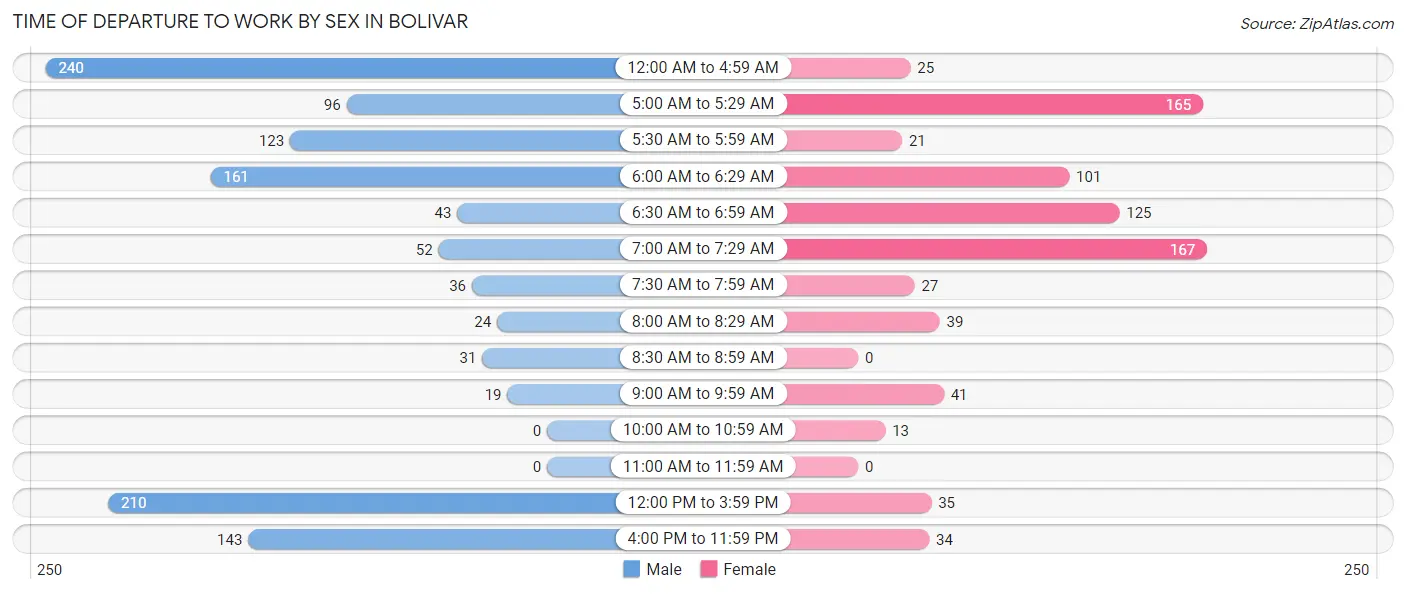
| Time of Departure | Male | Female |
| 12:00 AM to 4:59 AM | 240 (20.4%) | 25 (3.2%) |
| 5:00 AM to 5:29 AM | 96 (8.2%) | 165 (20.8%) |
| 5:30 AM to 5:59 AM | 123 (10.4%) | 21 (2.6%) |
| 6:00 AM to 6:29 AM | 161 (13.7%) | 101 (12.7%) |
| 6:30 AM to 6:59 AM | 43 (3.6%) | 125 (15.8%) |
| 7:00 AM to 7:29 AM | 52 (4.4%) | 167 (21.1%) |
| 7:30 AM to 7:59 AM | 36 (3.1%) | 27 (3.4%) |
| 8:00 AM to 8:29 AM | 24 (2.0%) | 39 (4.9%) |
| 8:30 AM to 8:59 AM | 31 (2.6%) | 0 (0.0%) |
| 9:00 AM to 9:59 AM | 19 (1.6%) | 41 (5.2%) |
| 10:00 AM to 10:59 AM | 0 (0.0%) | 13 (1.6%) |
| 11:00 AM to 11:59 AM | 0 (0.0%) | 0 (0.0%) |
| 12:00 PM to 3:59 PM | 210 (17.8%) | 35 (4.4%) |
| 4:00 PM to 11:59 PM | 143 (12.1%) | 34 (4.3%) |
| Total | 1,178 (100.0%) | 793 (100.0%) |
Housing Occupancy in Bolivar
Occupancy by Ownership in Bolivar
Of the total 2,311 dwellings in Bolivar, owner-occupied units account for 1,346 (58.2%), while renter-occupied units make up 965 (41.8%).
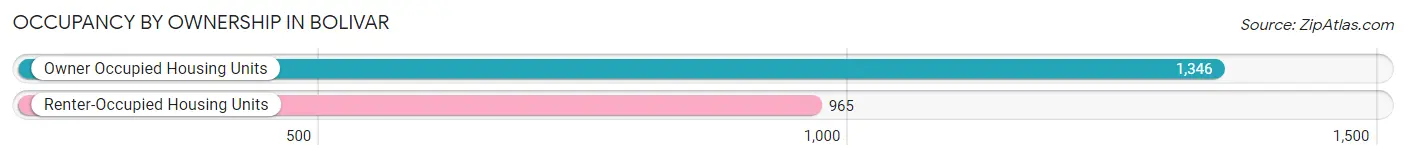
| Occupancy | # Housing Units | % Housing Units |
| Owner Occupied Housing Units | 1,346 | 58.2% |
| Renter-Occupied Housing Units | 965 | 41.8% |
| Total Occupied Housing Units | 2,311 | 100.0% |
Occupancy by Household Size in Bolivar
| Household Size | # Housing Units | % Housing Units |
| 1-Person Household | 1,048 | 45.4% |
| 2-Person Household | 727 | 31.5% |
| 3-Person Household | 235 | 10.2% |
| 4+ Person Household | 301 | 13.0% |
| Total Housing Units | 2,311 | 100.0% |
Occupancy by Ownership by Household Size in Bolivar
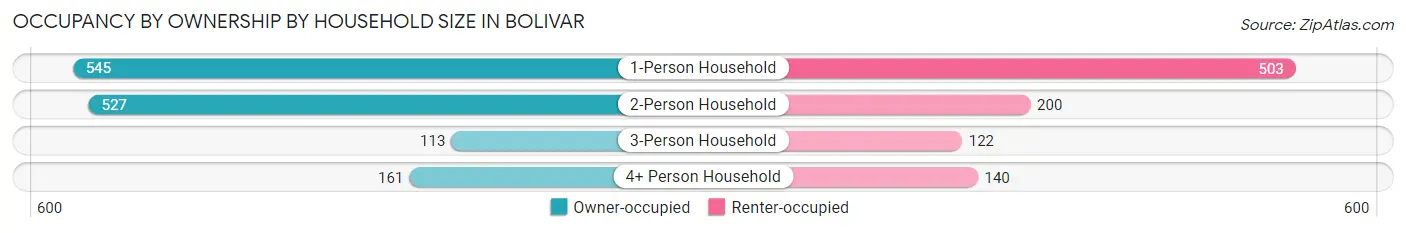
| Household Size | Owner-occupied | Renter-occupied |
| 1-Person Household | 545 (52.0%) | 503 (48.0%) |
| 2-Person Household | 527 (72.5%) | 200 (27.5%) |
| 3-Person Household | 113 (48.1%) | 122 (51.9%) |
| 4+ Person Household | 161 (53.5%) | 140 (46.5%) |
| Total Housing Units | 1,346 (58.2%) | 965 (41.8%) |
Occupancy by Educational Attainment in Bolivar
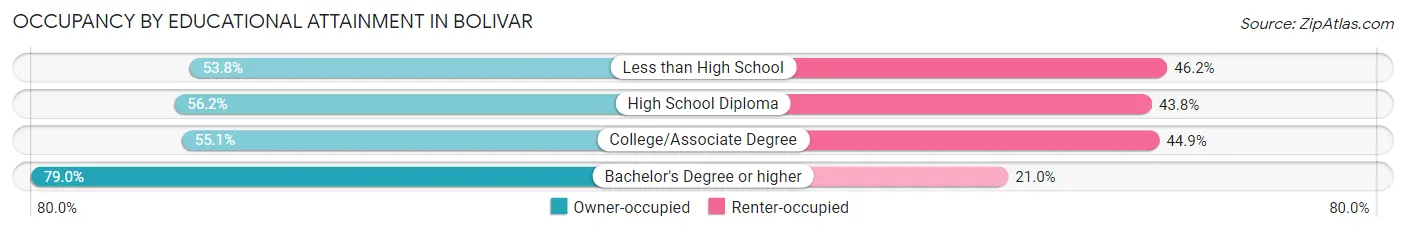
| Household Size | Owner-occupied | Renter-occupied |
| Less than High School | 106 (53.8%) | 91 (46.2%) |
| High School Diploma | 572 (56.2%) | 445 (43.8%) |
| College/Associate Degree | 457 (55.1%) | 373 (44.9%) |
| Bachelor's Degree or higher | 211 (79.0%) | 56 (21.0%) |
Occupancy by Age of Householder in Bolivar
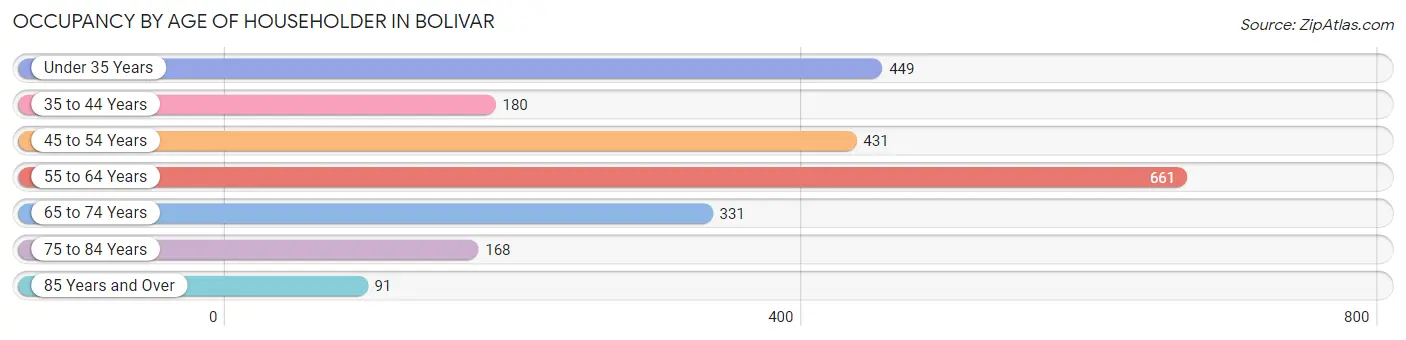
| Age Bracket | # Households | % Households |
| Under 35 Years | 449 | 19.4% |
| 35 to 44 Years | 180 | 7.8% |
| 45 to 54 Years | 431 | 18.6% |
| 55 to 64 Years | 661 | 28.6% |
| 65 to 74 Years | 331 | 14.3% |
| 75 to 84 Years | 168 | 7.3% |
| 85 Years and Over | 91 | 3.9% |
| Total | 2,311 | 100.0% |
Housing Finances in Bolivar
Median Income by Occupancy in Bolivar
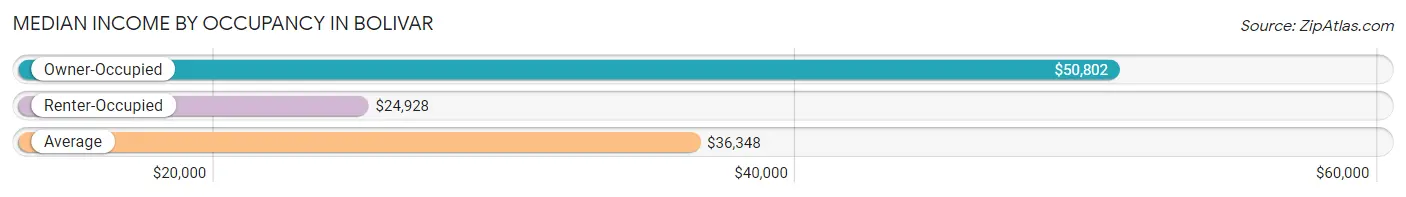
| Occupancy Type | # Households | Median Income |
| Owner-Occupied | 1,346 (58.2%) | $50,802 |
| Renter-Occupied | 965 (41.8%) | $24,928 |
| Average | 2,311 (100.0%) | $36,348 |
Occupancy by Householder Income Bracket in Bolivar
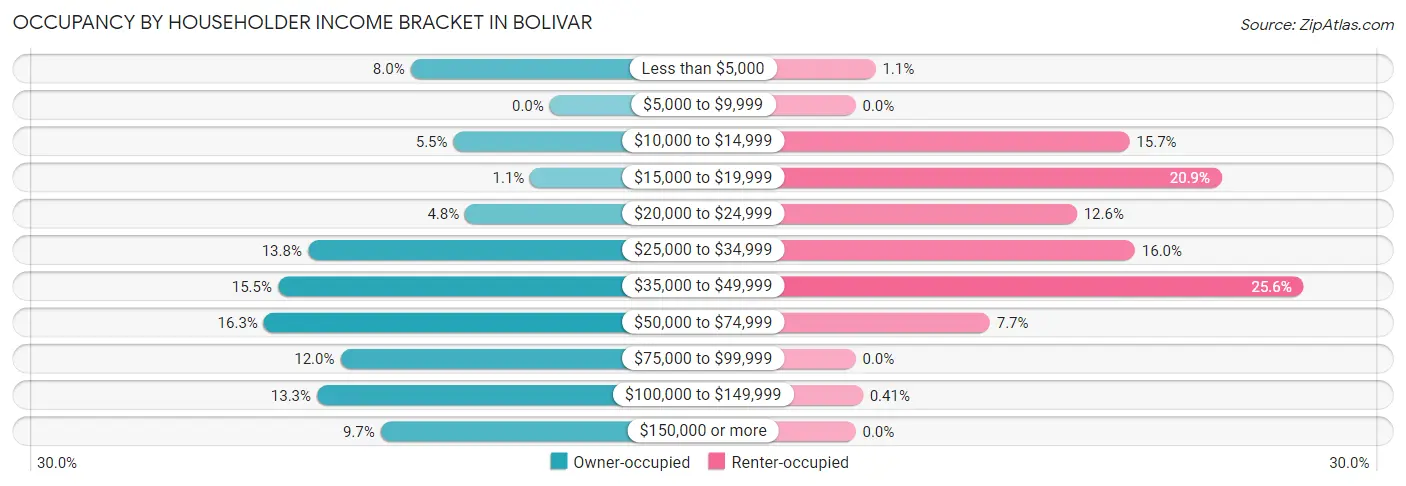
| Income Bracket | Owner-occupied | Renter-occupied |
| Less than $5,000 | 107 (8.0%) | 11 (1.1%) |
| $5,000 to $9,999 | 0 (0.0%) | 0 (0.0%) |
| $10,000 to $14,999 | 74 (5.5%) | 151 (15.7%) |
| $15,000 to $19,999 | 15 (1.1%) | 202 (20.9%) |
| $20,000 to $24,999 | 65 (4.8%) | 122 (12.6%) |
| $25,000 to $34,999 | 186 (13.8%) | 154 (16.0%) |
| $35,000 to $49,999 | 209 (15.5%) | 247 (25.6%) |
| $50,000 to $74,999 | 220 (16.3%) | 74 (7.7%) |
| $75,000 to $99,999 | 161 (12.0%) | 0 (0.0%) |
| $100,000 to $149,999 | 179 (13.3%) | 4 (0.4%) |
| $150,000 or more | 130 (9.7%) | 0 (0.0%) |
| Total | 1,346 (100.0%) | 965 (100.0%) |
Monthly Housing Cost Tiers in Bolivar
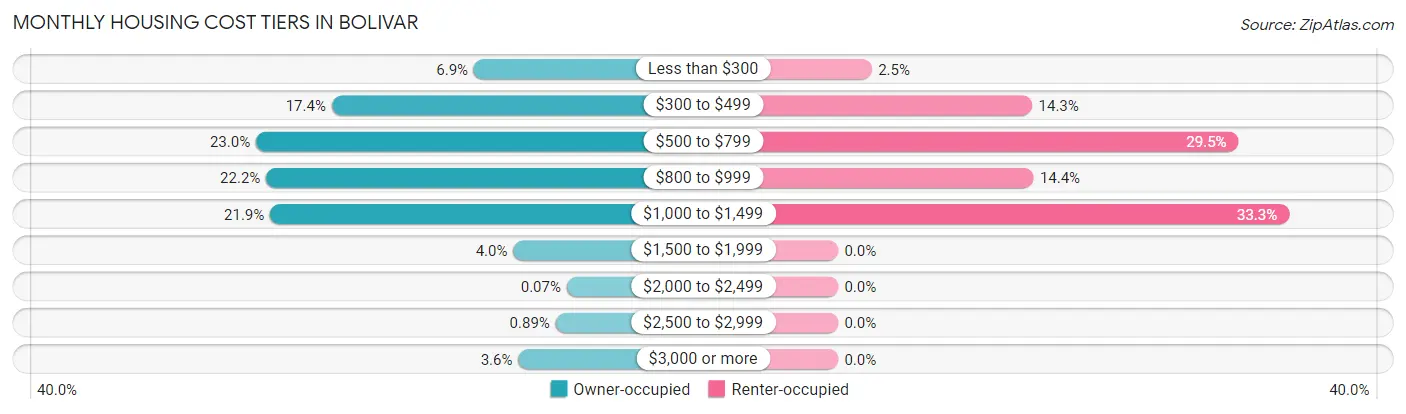
| Monthly Cost | Owner-occupied | Renter-occupied |
| Less than $300 | 93 (6.9%) | 24 (2.5%) |
| $300 to $499 | 234 (17.4%) | 138 (14.3%) |
| $500 to $799 | 309 (23.0%) | 285 (29.5%) |
| $800 to $999 | 299 (22.2%) | 139 (14.4%) |
| $1,000 to $1,499 | 295 (21.9%) | 321 (33.3%) |
| $1,500 to $1,999 | 54 (4.0%) | 0 (0.0%) |
| $2,000 to $2,499 | 1 (0.1%) | 0 (0.0%) |
| $2,500 to $2,999 | 12 (0.9%) | 0 (0.0%) |
| $3,000 or more | 49 (3.6%) | 0 (0.0%) |
| Total | 1,346 (100.0%) | 965 (100.0%) |
Physical Housing Characteristics in Bolivar
Housing Structures in Bolivar
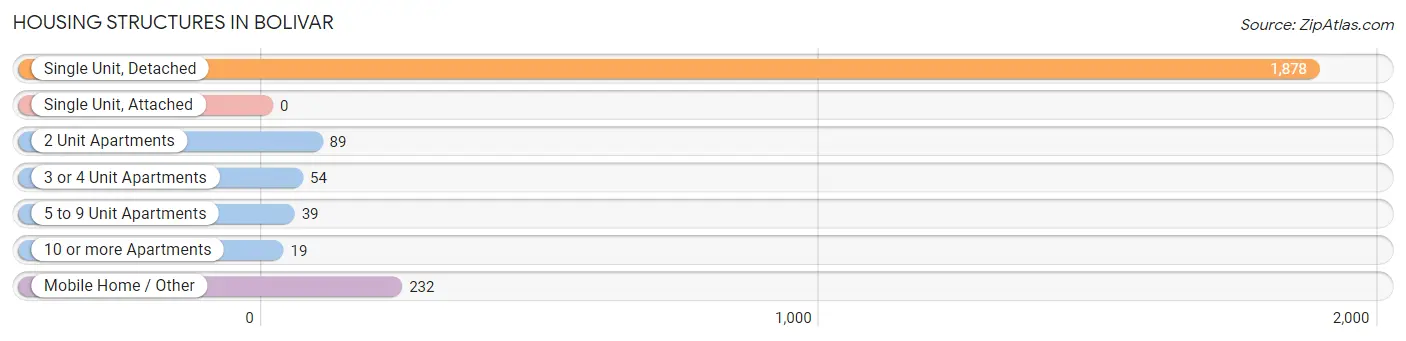
| Structure Type | # Housing Units | % Housing Units |
| Single Unit, Detached | 1,878 | 81.3% |
| Single Unit, Attached | 0 | 0.0% |
| 2 Unit Apartments | 89 | 3.8% |
| 3 or 4 Unit Apartments | 54 | 2.3% |
| 5 to 9 Unit Apartments | 39 | 1.7% |
| 10 or more Apartments | 19 | 0.8% |
| Mobile Home / Other | 232 | 10.0% |
| Total | 2,311 | 100.0% |
Housing Structures by Occupancy in Bolivar
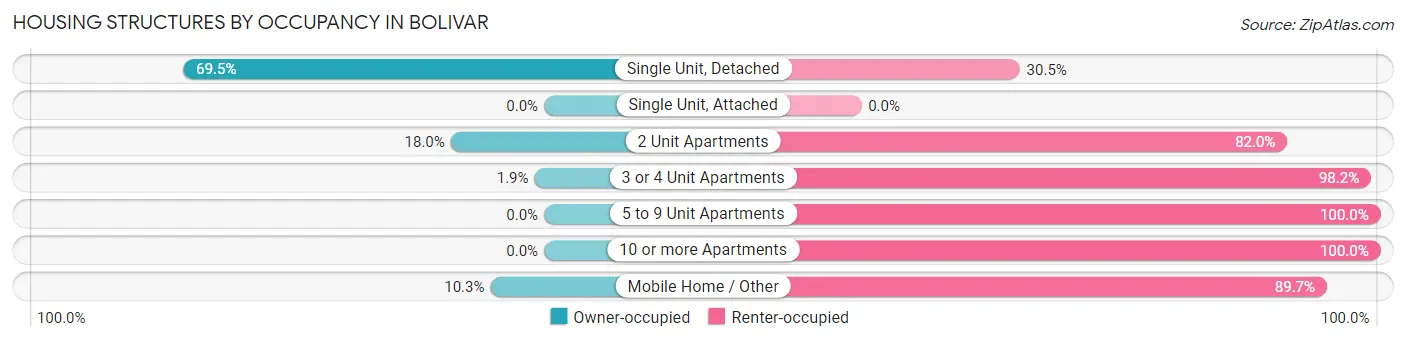
| Structure Type | Owner-occupied | Renter-occupied |
| Single Unit, Detached | 1,305 (69.5%) | 573 (30.5%) |
| Single Unit, Attached | 0 (0.0%) | 0 (0.0%) |
| 2 Unit Apartments | 16 (18.0%) | 73 (82.0%) |
| 3 or 4 Unit Apartments | 1 (1.8%) | 53 (98.2%) |
| 5 to 9 Unit Apartments | 0 (0.0%) | 39 (100.0%) |
| 10 or more Apartments | 0 (0.0%) | 19 (100.0%) |
| Mobile Home / Other | 24 (10.3%) | 208 (89.7%) |
| Total | 1,346 (58.2%) | 965 (41.8%) |
Housing Structures by Number of Rooms in Bolivar
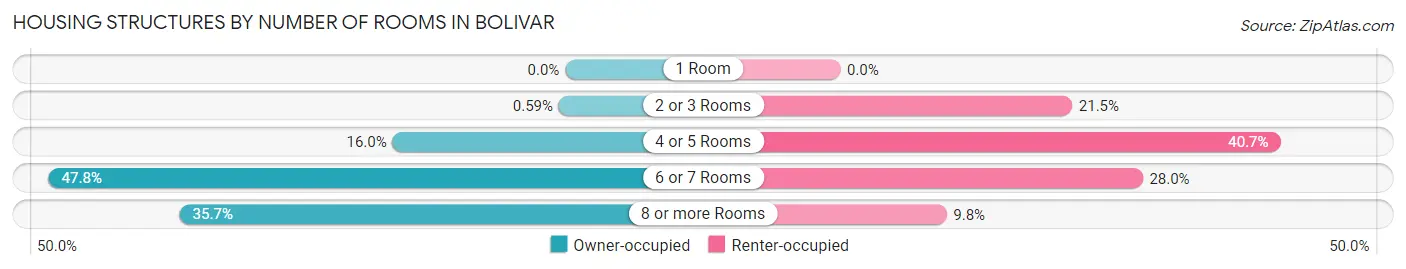
| Number of Rooms | Owner-occupied | Renter-occupied |
| 1 Room | 0 (0.0%) | 0 (0.0%) |
| 2 or 3 Rooms | 8 (0.6%) | 207 (21.4%) |
| 4 or 5 Rooms | 215 (16.0%) | 393 (40.7%) |
| 6 or 7 Rooms | 643 (47.8%) | 270 (28.0%) |
| 8 or more Rooms | 480 (35.7%) | 95 (9.8%) |
| Total | 1,346 (100.0%) | 965 (100.0%) |
Housing Structure by Heating Type in Bolivar
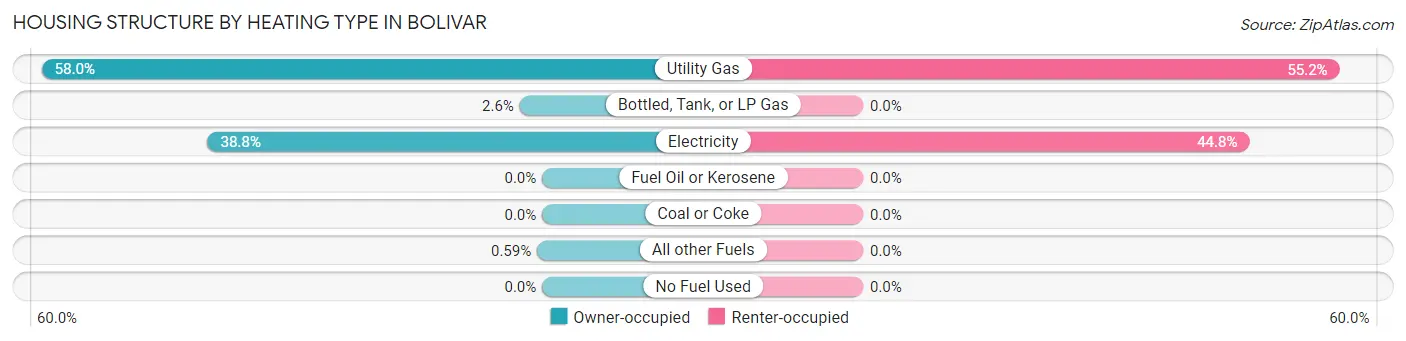
| Heating Type | Owner-occupied | Renter-occupied |
| Utility Gas | 781 (58.0%) | 533 (55.2%) |
| Bottled, Tank, or LP Gas | 35 (2.6%) | 0 (0.0%) |
| Electricity | 522 (38.8%) | 432 (44.8%) |
| Fuel Oil or Kerosene | 0 (0.0%) | 0 (0.0%) |
| Coal or Coke | 0 (0.0%) | 0 (0.0%) |
| All other Fuels | 8 (0.6%) | 0 (0.0%) |
| No Fuel Used | 0 (0.0%) | 0 (0.0%) |
| Total | 1,346 (100.0%) | 965 (100.0%) |
Household Vehicle Usage in Bolivar
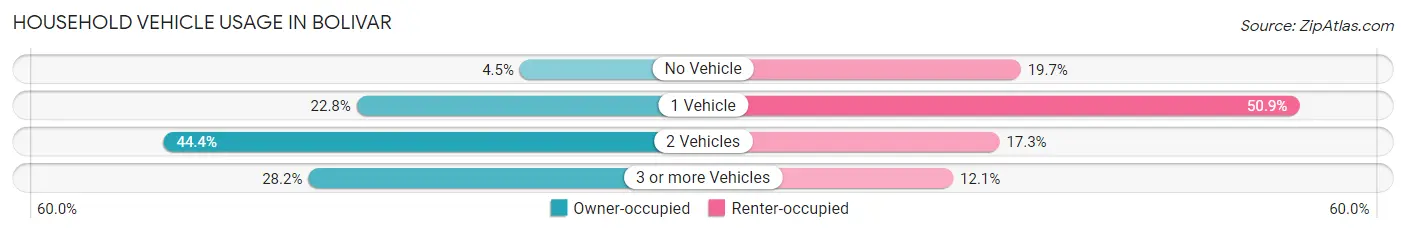
| Vehicles per Household | Owner-occupied | Renter-occupied |
| No Vehicle | 61 (4.5%) | 190 (19.7%) |
| 1 Vehicle | 307 (22.8%) | 491 (50.9%) |
| 2 Vehicles | 598 (44.4%) | 167 (17.3%) |
| 3 or more Vehicles | 380 (28.2%) | 117 (12.1%) |
| Total | 1,346 (100.0%) | 965 (100.0%) |
Real Estate & Mortgages in Bolivar
Real Estate and Mortgage Overview in Bolivar
| Characteristic | Without Mortgage | With Mortgage |
| Housing Units | 603 | 743 |
| Median Property Value | $108,400 | $135,500 |
| Median Household Income | $37,338 | $93 |
| Monthly Housing Costs | $477 | $49 |
| Real Estate Taxes | $1,027 | $0 |
Property Value by Mortgage Status in Bolivar
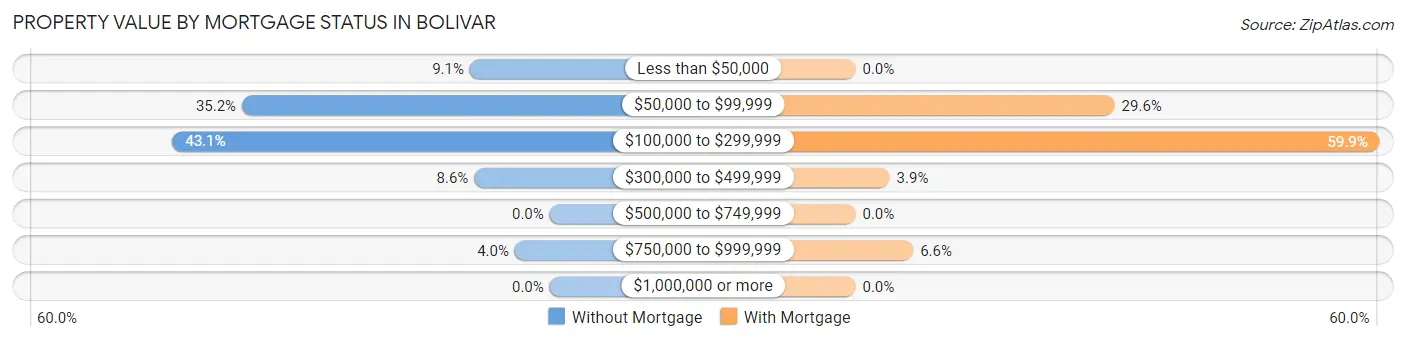
| Property Value | Without Mortgage | With Mortgage |
| Less than $50,000 | 55 (9.1%) | 0 (0.0%) |
| $50,000 to $99,999 | 212 (35.2%) | 220 (29.6%) |
| $100,000 to $299,999 | 260 (43.1%) | 445 (59.9%) |
| $300,000 to $499,999 | 52 (8.6%) | 29 (3.9%) |
| $500,000 to $749,999 | 0 (0.0%) | 0 (0.0%) |
| $750,000 to $999,999 | 24 (4.0%) | 49 (6.6%) |
| $1,000,000 or more | 0 (0.0%) | 0 (0.0%) |
| Total | 603 (100.0%) | 743 (100.0%) |
Household Income by Mortgage Status in Bolivar
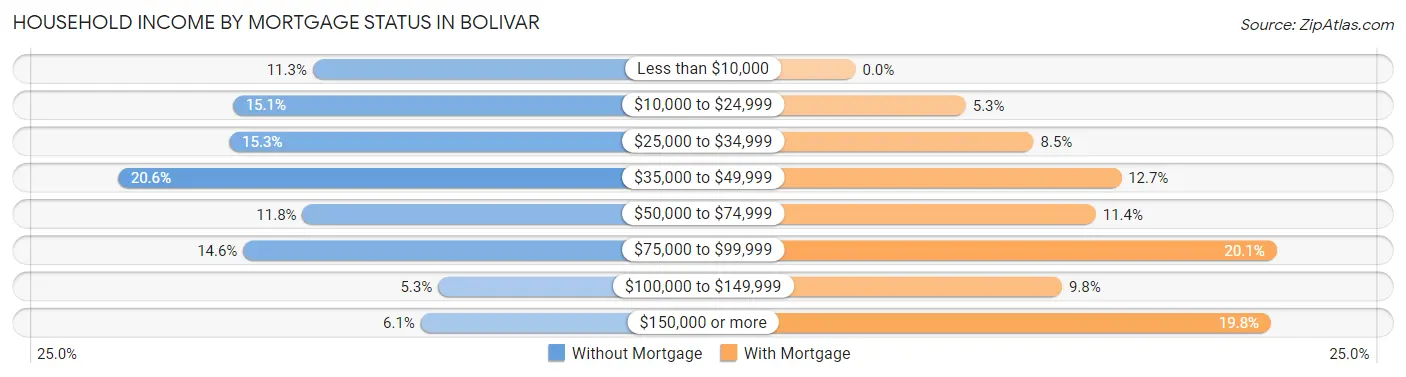
| Household Income | Without Mortgage | With Mortgage |
| Less than $10,000 | 68 (11.3%) | 0 (0.0%) |
| $10,000 to $24,999 | 91 (15.1%) | 39 (5.2%) |
| $25,000 to $34,999 | 92 (15.3%) | 63 (8.5%) |
| $35,000 to $49,999 | 124 (20.6%) | 94 (12.7%) |
| $50,000 to $74,999 | 71 (11.8%) | 85 (11.4%) |
| $75,000 to $99,999 | 88 (14.6%) | 149 (20.1%) |
| $100,000 to $149,999 | 32 (5.3%) | 73 (9.8%) |
| $150,000 or more | 37 (6.1%) | 147 (19.8%) |
| Total | 603 (100.0%) | 743 (100.0%) |
Property Value to Household Income Ratio in Bolivar
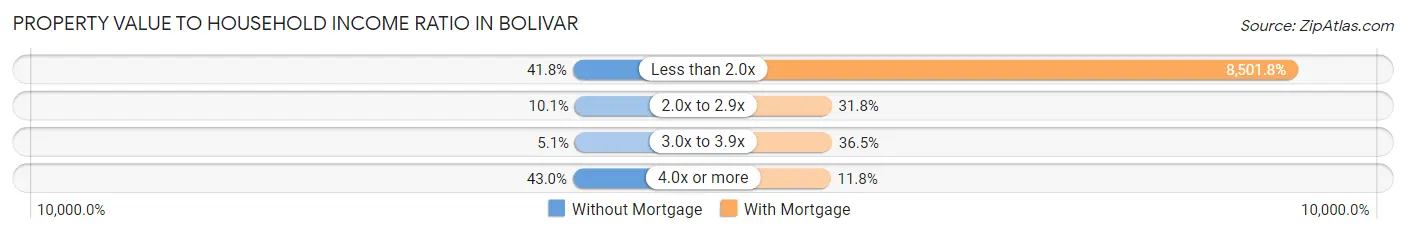
| Value-to-Income Ratio | Without Mortgage | With Mortgage |
| Less than 2.0x | 252 (41.8%) | 63,168 (8,501.7%) |
| 2.0x to 2.9x | 61 (10.1%) | 236 (31.8%) |
| 3.0x to 3.9x | 31 (5.1%) | 271 (36.5%) |
| 4.0x or more | 259 (42.9%) | 88 (11.8%) |
| Total | 603 (100.0%) | 743 (100.0%) |
Real Estate Taxes by Mortgage Status in Bolivar
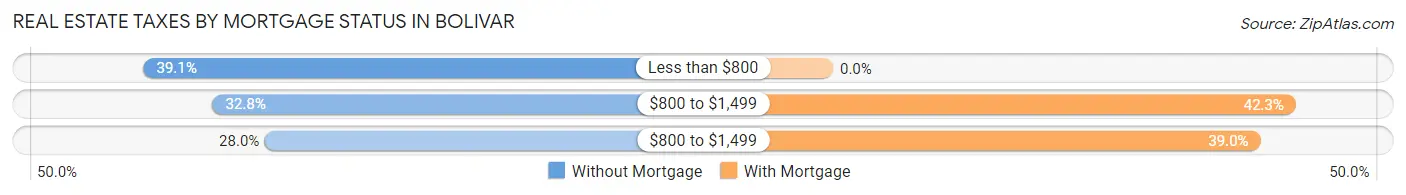
| Property Taxes | Without Mortgage | With Mortgage |
| Less than $800 | 236 (39.1%) | 0 (0.0%) |
| $800 to $1,499 | 198 (32.8%) | 314 (42.3%) |
| $800 to $1,499 | 169 (28.0%) | 290 (39.0%) |
| Total | 603 (100.0%) | 743 (100.0%) |
Health & Disability in Bolivar
Health Insurance Coverage by Age in Bolivar
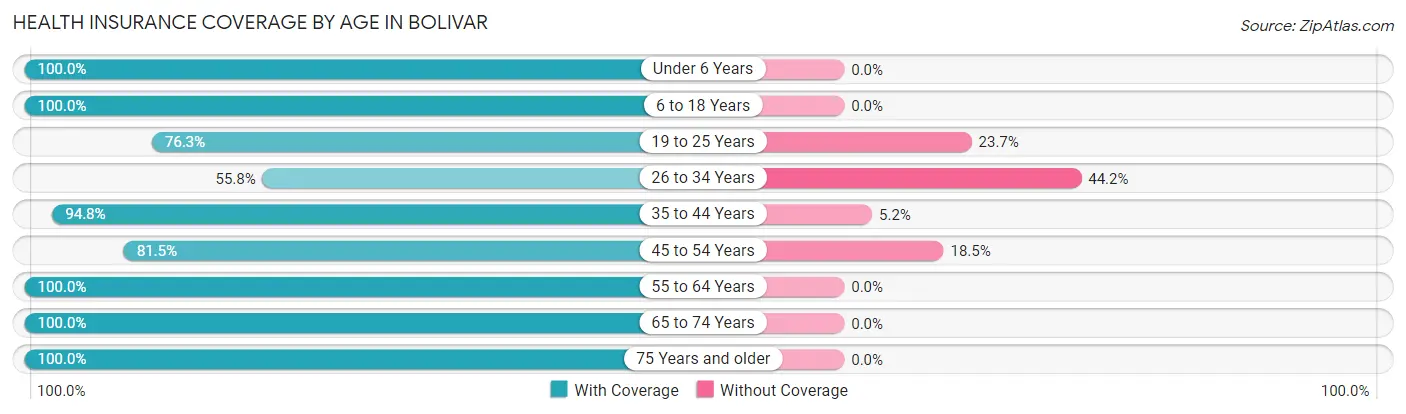
| Age Bracket | With Coverage | Without Coverage |
| Under 6 Years | 268 (100.0%) | 0 (0.0%) |
| 6 to 18 Years | 715 (100.0%) | 0 (0.0%) |
| 19 to 25 Years | 379 (76.3%) | 118 (23.7%) |
| 26 to 34 Years | 528 (55.8%) | 418 (44.2%) |
| 35 to 44 Years | 293 (94.8%) | 16 (5.2%) |
| 45 to 54 Years | 458 (81.5%) | 104 (18.5%) |
| 55 to 64 Years | 845 (100.0%) | 0 (0.0%) |
| 65 to 74 Years | 601 (100.0%) | 0 (0.0%) |
| 75 Years and older | 399 (100.0%) | 0 (0.0%) |
| Total | 4,486 (87.2%) | 656 (12.8%) |
Health Insurance Coverage by Citizenship Status in Bolivar
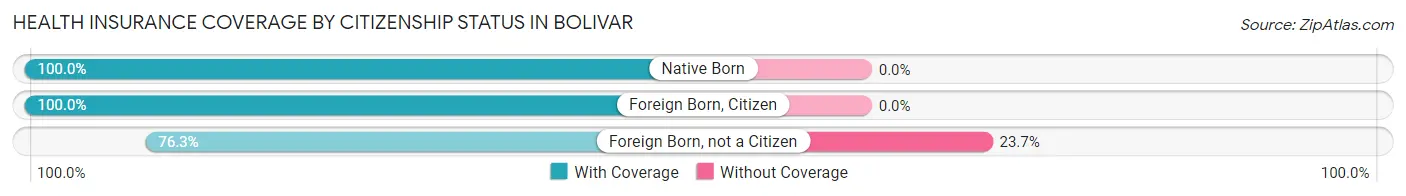
| Citizenship Status | With Coverage | Without Coverage |
| Native Born | 268 (100.0%) | 0 (0.0%) |
| Foreign Born, Citizen | 715 (100.0%) | 0 (0.0%) |
| Foreign Born, not a Citizen | 379 (76.3%) | 118 (23.7%) |
Health Insurance Coverage by Household Income in Bolivar
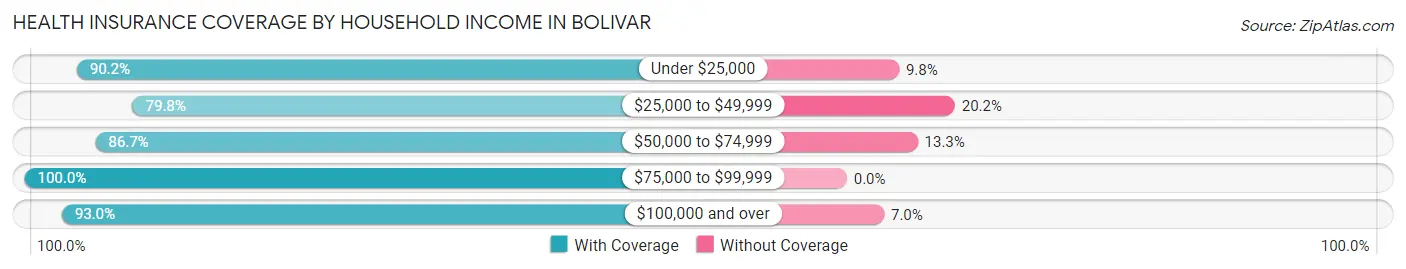
| Household Income | With Coverage | Without Coverage |
| Under $25,000 | 978 (90.2%) | 106 (9.8%) |
| $25,000 to $49,999 | 1,596 (79.8%) | 405 (20.2%) |
| $50,000 to $74,999 | 575 (86.7%) | 88 (13.3%) |
| $75,000 to $99,999 | 572 (100.0%) | 0 (0.0%) |
| $100,000 and over | 640 (93.0%) | 48 (7.0%) |
Public vs Private Health Insurance Coverage by Age in Bolivar
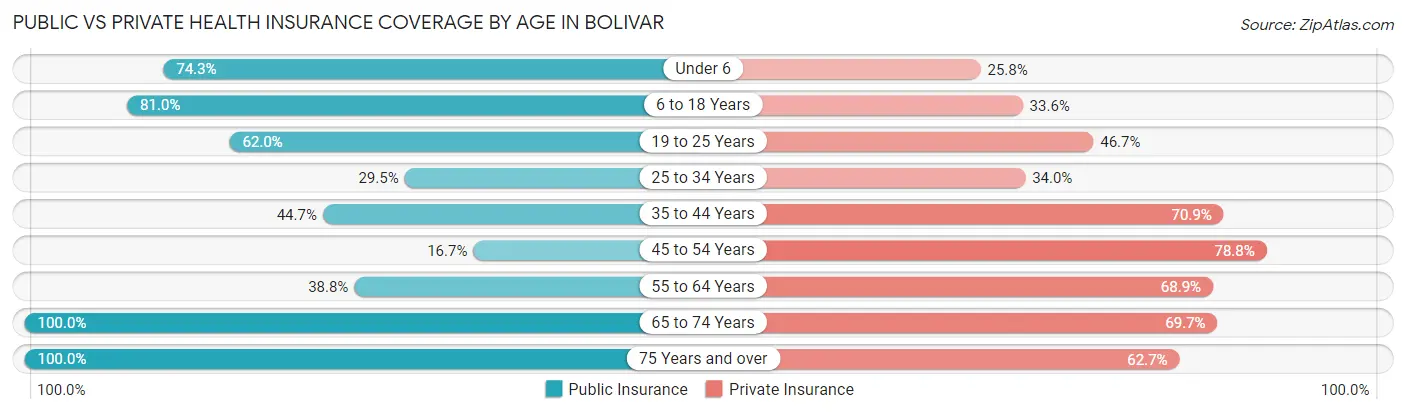
| Age Bracket | Public Insurance | Private Insurance |
| Under 6 | 199 (74.3%) | 69 (25.8%) |
| 6 to 18 Years | 579 (81.0%) | 240 (33.6%) |
| 19 to 25 Years | 308 (62.0%) | 232 (46.7%) |
| 25 to 34 Years | 279 (29.5%) | 322 (34.0%) |
| 35 to 44 Years | 138 (44.7%) | 219 (70.9%) |
| 45 to 54 Years | 94 (16.7%) | 443 (78.8%) |
| 55 to 64 Years | 328 (38.8%) | 582 (68.9%) |
| 65 to 74 Years | 601 (100.0%) | 419 (69.7%) |
| 75 Years and over | 399 (100.0%) | 250 (62.7%) |
| Total | 2,925 (56.9%) | 2,776 (54.0%) |
Disability Status by Sex by Age in Bolivar
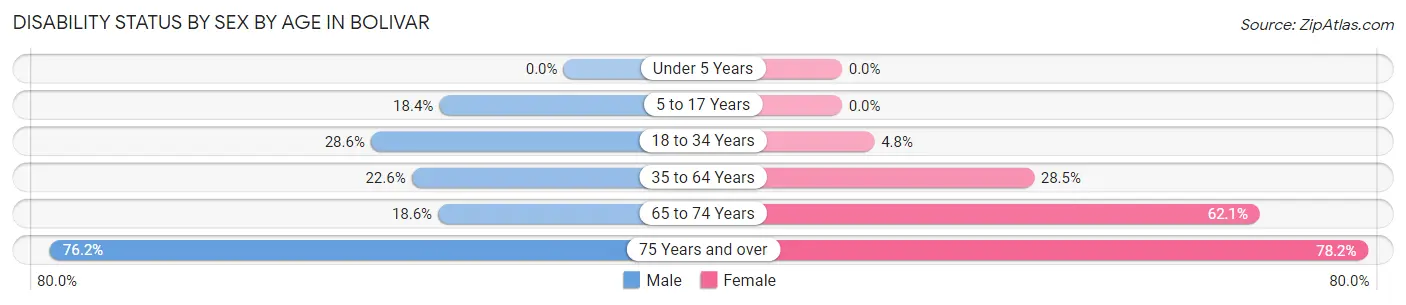
| Age Bracket | Male | Female |
| Under 5 Years | 0 (0.0%) | 0 (0.0%) |
| 5 to 17 Years | 59 (18.4%) | 0 (0.0%) |
| 18 to 34 Years | 296 (28.6%) | 22 (4.8%) |
| 35 to 64 Years | 186 (22.6%) | 254 (28.5%) |
| 65 to 74 Years | 54 (18.6%) | 193 (62.1%) |
| 75 Years and over | 77 (76.2%) | 233 (78.2%) |
Disability Class by Sex by Age in Bolivar
Disability Class: Hearing Difficulty
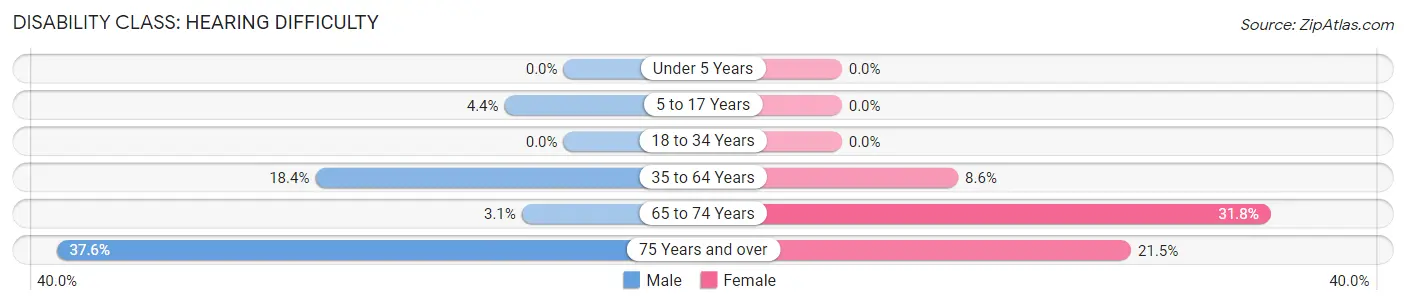
| Age Bracket | Male | Female |
| Under 5 Years | 0 (0.0%) | 0 (0.0%) |
| 5 to 17 Years | 14 (4.4%) | 0 (0.0%) |
| 18 to 34 Years | 0 (0.0%) | 0 (0.0%) |
| 35 to 64 Years | 152 (18.4%) | 77 (8.6%) |
| 65 to 74 Years | 9 (3.1%) | 99 (31.8%) |
| 75 Years and over | 38 (37.6%) | 64 (21.5%) |
Disability Class: Vision Difficulty
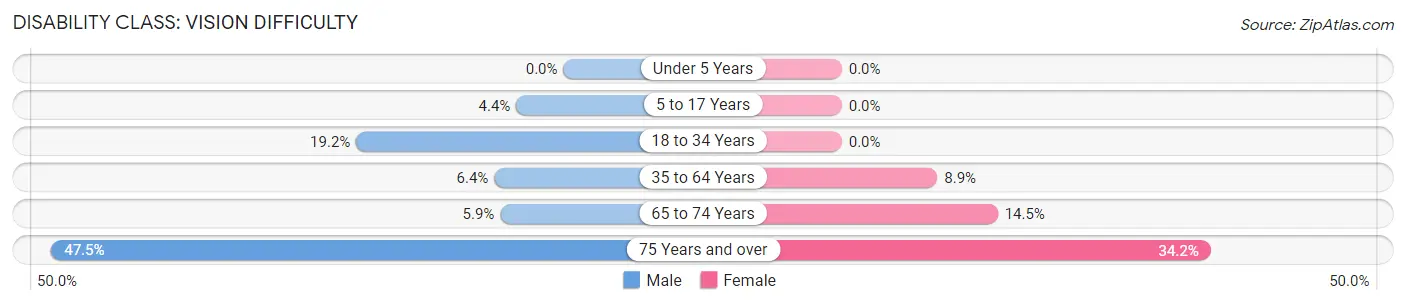
| Age Bracket | Male | Female |
| Under 5 Years | 0 (0.0%) | 0 (0.0%) |
| 5 to 17 Years | 14 (4.4%) | 0 (0.0%) |
| 18 to 34 Years | 199 (19.2%) | 0 (0.0%) |
| 35 to 64 Years | 53 (6.4%) | 79 (8.9%) |
| 65 to 74 Years | 17 (5.9%) | 45 (14.5%) |
| 75 Years and over | 48 (47.5%) | 102 (34.2%) |
Disability Class: Cognitive Difficulty
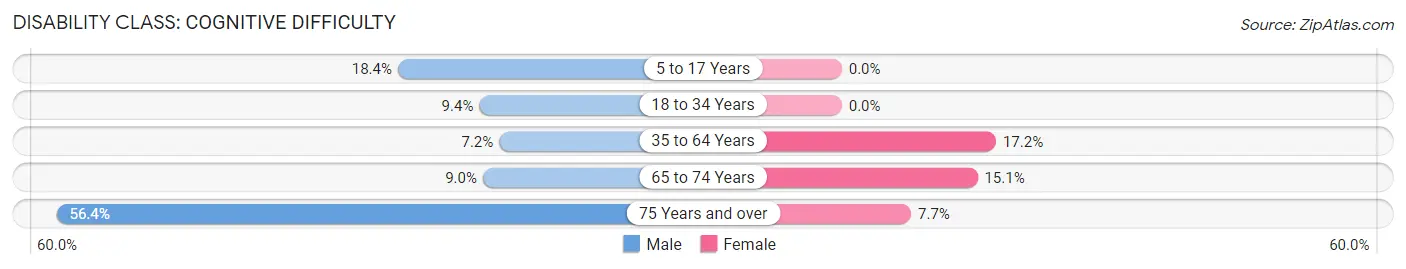
| Age Bracket | Male | Female |
| 5 to 17 Years | 59 (18.4%) | 0 (0.0%) |
| 18 to 34 Years | 97 (9.4%) | 0 (0.0%) |
| 35 to 64 Years | 59 (7.1%) | 153 (17.2%) |
| 65 to 74 Years | 26 (9.0%) | 47 (15.1%) |
| 75 Years and over | 57 (56.4%) | 23 (7.7%) |
Disability Class: Ambulatory Difficulty
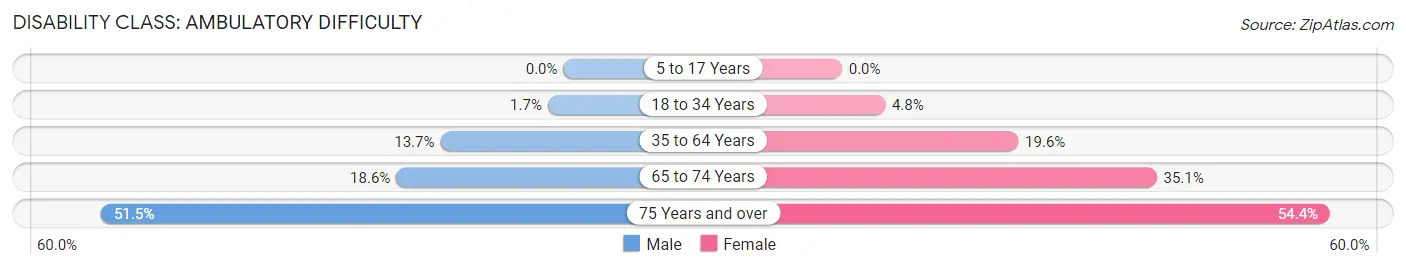
| Age Bracket | Male | Female |
| 5 to 17 Years | 0 (0.0%) | 0 (0.0%) |
| 18 to 34 Years | 18 (1.7%) | 22 (4.8%) |
| 35 to 64 Years | 113 (13.7%) | 175 (19.6%) |
| 65 to 74 Years | 54 (18.6%) | 109 (35.0%) |
| 75 Years and over | 52 (51.5%) | 162 (54.4%) |
Disability Class: Self-Care Difficulty
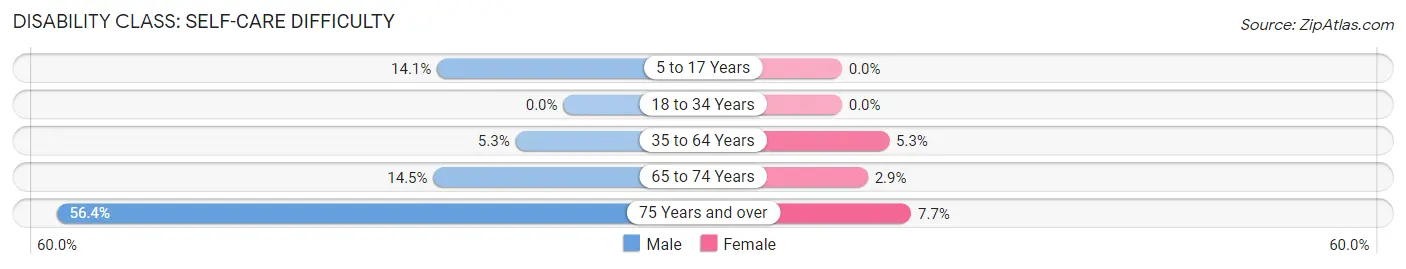
| Age Bracket | Male | Female |
| 5 to 17 Years | 45 (14.1%) | 0 (0.0%) |
| 18 to 34 Years | 0 (0.0%) | 0 (0.0%) |
| 35 to 64 Years | 44 (5.3%) | 47 (5.3%) |
| 65 to 74 Years | 42 (14.5%) | 9 (2.9%) |
| 75 Years and over | 57 (56.4%) | 23 (7.7%) |
Technology Access in Bolivar
Computing Device Access in Bolivar
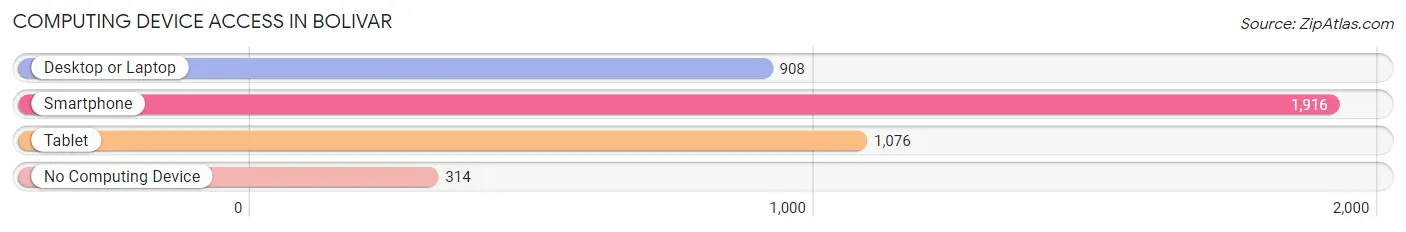
| Device Type | # Households | % Households |
| Desktop or Laptop | 908 | 39.3% |
| Smartphone | 1,916 | 82.9% |
| Tablet | 1,076 | 46.6% |
| No Computing Device | 314 | 13.6% |
| Total | 2,311 | 100.0% |
Internet Access in Bolivar
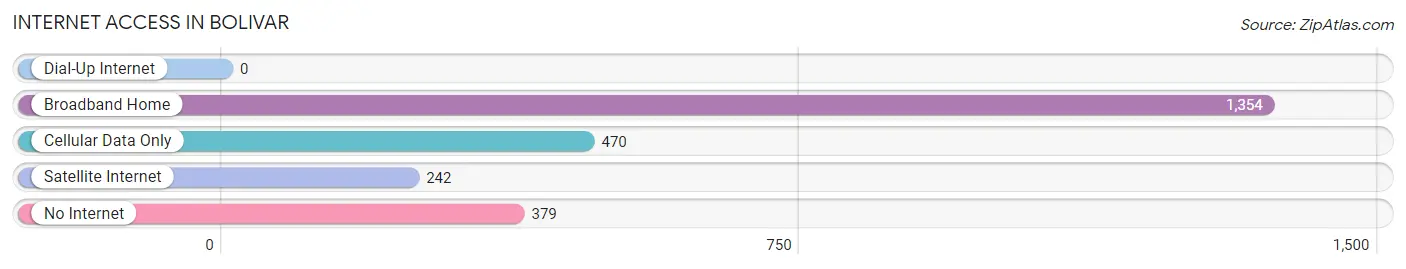
| Internet Type | # Households | % Households |
| Dial-Up Internet | 0 | 0.0% |
| Broadband Home | 1,354 | 58.6% |
| Cellular Data Only | 470 | 20.3% |
| Satellite Internet | 242 | 10.5% |
| No Internet | 379 | 16.4% |
| Total | 2,311 | 100.0% |
Bolivar Summary
Bolivar, Tennessee is a small town located in Hardeman County, in the western part of the state. It is situated along the banks of the Hatchie River, and is the county seat of Hardeman County. The town was founded in 1825 and named after Simón Bolívar, a Venezuelan military and political leader who led the struggle for independence in much of South America. Bolivar is located approximately 60 miles east of Memphis, and is part of the Jackson, Tennessee metropolitan area.
History
The area that is now Bolivar was first settled in the early 1800s by settlers from North Carolina and Virginia. The town was officially founded in 1825 and named after Simón Bolívar. The town was incorporated in 1837 and was designated as the county seat of Hardeman County.
During the Civil War, Bolivar was the site of a major battle in 1862. The Battle of Bolivar was fought between Union and Confederate forces, and resulted in a Confederate victory. The town was occupied by Union forces for the remainder of the war.
In the late 19th century, Bolivar was a major center for the timber industry. The town was also home to several cotton mills, which provided employment for many of the town’s residents.
Geography
Bolivar is located in western Tennessee, in Hardeman County. The town is situated along the banks of the Hatchie River, and is approximately 60 miles east of Memphis. The town is part of the Jackson, Tennessee metropolitan area.
The climate in Bolivar is humid subtropical, with hot, humid summers and mild winters. The average annual temperature is around 64°F, and the average annual precipitation is around 45 inches.
Economy
The economy of Bolivar is largely based on agriculture and manufacturing. The town is home to several large agricultural operations, including poultry farms, cattle farms, and cotton farms. The town is also home to several manufacturing companies, including a furniture factory and a plastics factory.
The town is also home to several retail stores, restaurants, and other businesses. The town is served by the Hardeman County Airport, which provides air service to the surrounding area.
Demographics
As of the 2010 census, the population of Bolivar was 5,417. The racial makeup of the town was 79.3% White, 17.7% African American, 0.3% Native American, 0.3% Asian, 0.1% Pacific Islander, and 2.3% from other races. The median household income was $30,945, and the median family income was $37,917.
The town is served by the Hardeman County School District, which includes three elementary schools, one middle school, and one high school. The town is also home to several churches, including Baptist, Methodist, and Presbyterian.
Common Questions
What is Per Capita Income in Bolivar?
Per Capita income in Bolivar is $24,367.
What is the Median Family Income in Bolivar?
Median Family Income in Bolivar is $41,365.
What is the Median Household income in Bolivar?
Median Household Income in Bolivar is $36,348.
What is Income or Wage Gap in Bolivar?
Income or Wage Gap in Bolivar is 22.1%.
Women in Bolivar earn 77.9 cents for every dollar earned by a man.
What is Inequality or Gini Index in Bolivar?
Inequality or Gini Index in Bolivar is 0.45.
What is the Total Population of Bolivar?
Total Population of Bolivar is 5,197.
What is the Total Male Population of Bolivar?
Total Male Population of Bolivar is 2,814.
What is the Total Female Population of Bolivar?
Total Female Population of Bolivar is 2,383.
What is the Ratio of Males per 100 Females in Bolivar?
There are 118.09 Males per 100 Females in Bolivar.
What is the Ratio of Females per 100 Males in Bolivar?
There are 84.68 Females per 100 Males in Bolivar.
What is the Median Population Age in Bolivar?
Median Population Age in Bolivar is 39.9 Years.
What is the Average Family Size in Bolivar
Average Family Size in Bolivar is 3.1 People.
What is the Average Household Size in Bolivar
Average Household Size in Bolivar is 2.2 People.
How Large is the Labor Force in Bolivar?
There are 2,794 People in the Labor Forcein in Bolivar.
What is the Percentage of People in the Labor Force in Bolivar?
62.3% of People are in the Labor Force in Bolivar.
What is the Unemployment Rate in Bolivar?
Unemployment Rate in Bolivar is 21.9%.