Cities with the Most Immigrants from Middle Africa in Missouri
RELATED REPORTS & OPTIONS
Middle Africa
Missouri
Compare Cities
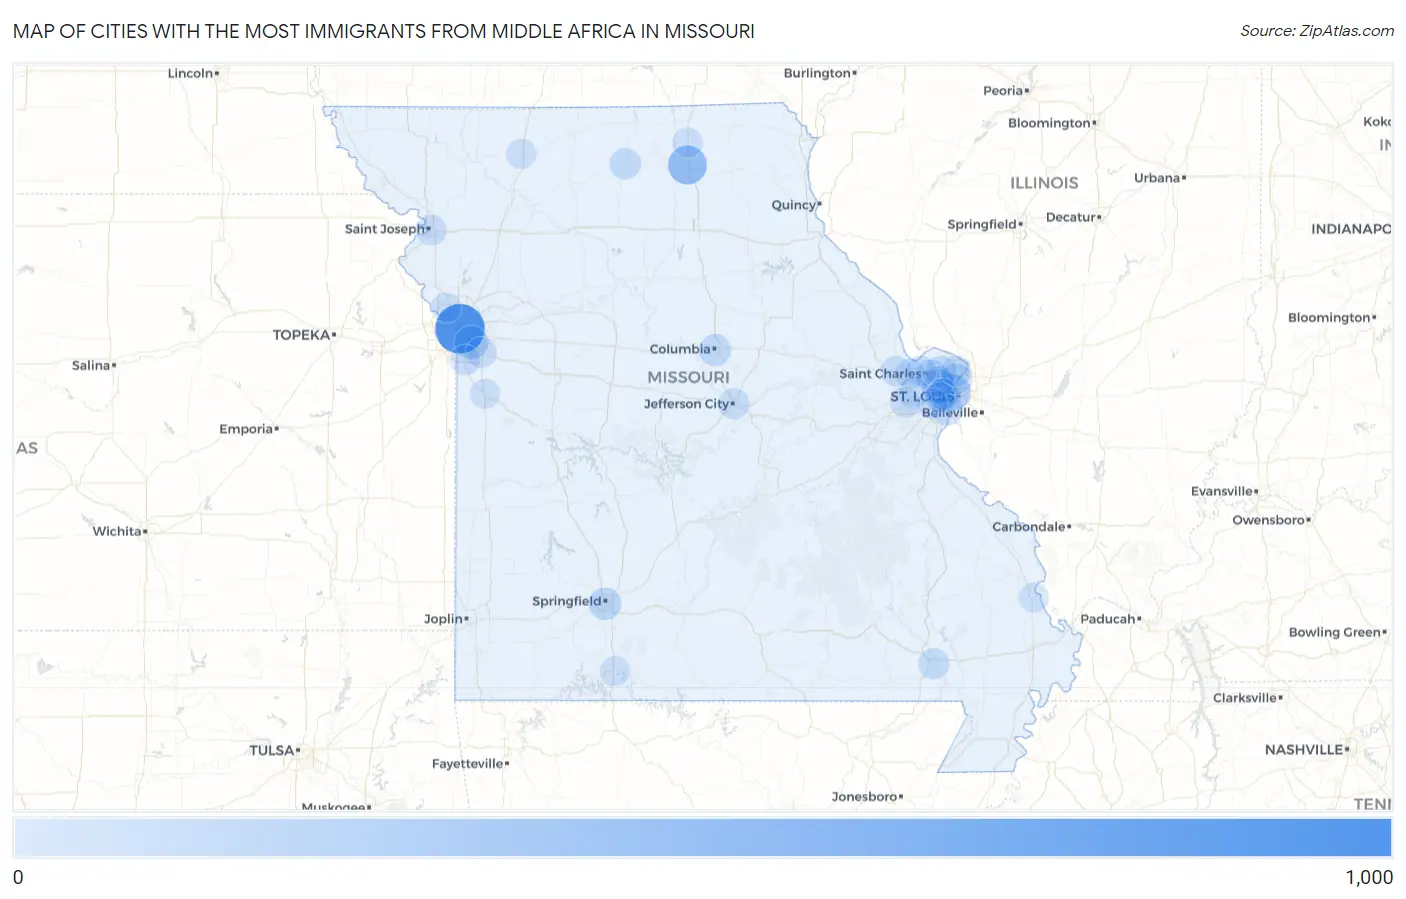
Map of Cities with the Most Immigrants from Middle Africa in Missouri
0
1,000
Cities with the Most Immigrants from Middle Africa in Missouri
| City | Middle Africa | vs State | vs National | |
| 1. | Kansas City | 860 | 2,836(30.32%)#1 | 193,874(0.44%)#37 |
| 2. | Kirksville | 377 | 2,836(13.29%)#2 | 193,874(0.19%)#101 |
| 3. | St Louis | 257 | 2,836(9.06%)#3 | 193,874(0.13%)#157 |
| 4. | Overland | 177 | 2,836(6.24%)#4 | 193,874(0.09%)#227 |
| 5. | Raytown | 149 | 2,836(5.25%)#5 | 193,874(0.08%)#258 |
| 6. | Springfield | 99 | 2,836(3.49%)#6 | 193,874(0.05%)#343 |
| 7. | Richmond Heights | 96 | 2,836(3.39%)#7 | 193,874(0.05%)#358 |
| 8. | Columbia | 73 | 2,836(2.57%)#8 | 193,874(0.04%)#436 |
| 9. | Milan | 58 | 2,836(2.05%)#9 | 193,874(0.03%)#523 |
| 10. | Bridgeton | 51 | 2,836(1.80%)#10 | 193,874(0.03%)#564 |
| 11. | Florissant | 48 | 2,836(1.69%)#11 | 193,874(0.02%)#586 |
| 12. | Riverview | 44 | 2,836(1.55%)#12 | 193,874(0.02%)#615 |
| 13. | Lemay | 40 | 2,836(1.41%)#13 | 193,874(0.02%)#652 |
| 14. | Woodson Terrace | 39 | 2,836(1.38%)#14 | 193,874(0.02%)#665 |
| 15. | Poplar Bluff | 37 | 2,836(1.30%)#15 | 193,874(0.02%)#678 |
| 16. | Jefferson City | 35 | 2,836(1.23%)#16 | 193,874(0.02%)#693 |
| 17. | Clayton | 34 | 2,836(1.20%)#17 | 193,874(0.02%)#705 |
| 18. | Lee S Summit | 30 | 2,836(1.06%)#18 | 193,874(0.02%)#742 |
| 19. | Spanish Lake | 29 | 2,836(1.02%)#19 | 193,874(0.01%)#762 |
| 20. | O Fallon | 24 | 2,836(0.85%)#20 | 193,874(0.01%)#815 |
| 21. | St Joseph | 23 | 2,836(0.81%)#21 | 193,874(0.01%)#825 |
| 22. | Grandview | 21 | 2,836(0.74%)#22 | 193,874(0.01%)#869 |
| 23. | St Charles | 16 | 2,836(0.56%)#23 | 193,874(0.01%)#957 |
| 24. | Chesterfield | 14 | 2,836(0.49%)#24 | 193,874(0.01%)#1,008 |
| 25. | Kirkwood | 12 | 2,836(0.42%)#25 | 193,874(0.01%)#1,066 |
| 26. | Brentwood | 11 | 2,836(0.39%)#26 | 193,874(0.01%)#1,111 |
| 27. | Wildwood | 10 | 2,836(0.35%)#27 | 193,874(0.01%)#1,131 |
| 28. | St Peters | 4 | 2,836(0.14%)#28 | 193,874(0.00%)#1,286 |
| 29. | Greentop | 4 | 2,836(0.14%)#29 | 193,874(0.00%)#1,303 |
| 30. | Harrisonville | 2 | 2,836(0.07%)#30 | 193,874(0.00%)#1,348 |
| 31. | Bethany | 2 | 2,836(0.07%)#31 | 193,874(0.00%)#1,350 |
| 32. | Weatherby Lake | 2 | 2,836(0.07%)#32 | 193,874(0.00%)#1,352 |
| 33. | Scott City | 1 | 2,836(0.04%)#33 | 193,874(0.00%)#1,386 |
| 34. | Bull Creek | 1 | 2,836(0.04%)#34 | 193,874(0.00%)#1,396 |
Common Questions
What are the Top 10 Cities with the Most Immigrants from Middle Africa in Missouri?
Top 10 Cities with the Most Immigrants from Middle Africa in Missouri are:
#1
860
#2
377
#3
257
#4
177
#5
149
#6
99
#7
96
#8
73
#9
58
#10
51
What city has the Most Immigrants from Middle Africa in Missouri?
Kansas City has the Most Immigrants from Middle Africa in Missouri with 860.
What is the Total Immigrants from Middle Africa in the State of Missouri?
Total Immigrants from Middle Africa in Missouri is 2,836.
What is the Total Immigrants from Middle Africa in the United States?
Total Immigrants from Middle Africa in the United States is 193,874.