Northampton, MA Map & Demographics
Northampton Map
Northampton Overview
$49,679
PER CAPITA INCOME
$123,871
AVG FAMILY INCOME
$80,981
AVG HOUSEHOLD INCOME
37.5%
WAGE / INCOME GAP [ % ]
62.5¢/ $1
WAGE / INCOME GAP [ $ ]
0.49
INEQUALITY / GINI INDEX
28,245
TOTAL POPULATION
12,038
MALE POPULATION
16,207
FEMALE POPULATION
74.28
MALES / 100 FEMALES
134.63
FEMALES / 100 MALES
42.5
MEDIAN AGE
2.6
AVG FAMILY SIZE
2.0
AVG HOUSEHOLD SIZE
15,156
LABOR FORCE [ PEOPLE ]
61.5%
PERCENT IN LABOR FORCE
5.6%
UNEMPLOYMENT RATE
Northampton Area Codes
Income in Northampton
Income Overview in Northampton
Per Capita Income in Northampton is $49,679, while median incomes of families and households are $123,871 and $80,981 respectively.
| Characteristic | Number | Measure |
| Per Capita Income | 28,245 | $49,679 |
| Median Family Income | 6,310 | $123,871 |
| Mean Family Income | 6,310 | $152,730 |
| Median Household Income | 12,345 | $80,981 |
| Mean Household Income | 12,345 | $113,815 |
| Income Deficit | 6,310 | $0 |
| Wage / Income Gap (%) | 28,245 | 37.45% |
| Wage / Income Gap ($) | 28,245 | 62.55¢ per $1 |
| Gini / Inequality Index | 28,245 | 0.49 |
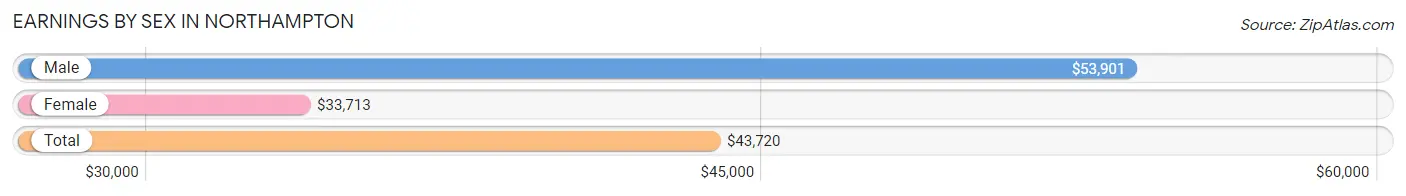
Earnings by Sex in Northampton
Average Earnings in Northampton are $43,720, $53,901 for men and $33,713 for women, a difference of 37.4%.
| Sex | Number | Average Earnings |
| Male | 7,202 (43.2%) | $53,901 |
| Female | 9,474 (56.8%) | $33,713 |
| Total | 16,676 (100.0%) | $43,720 |
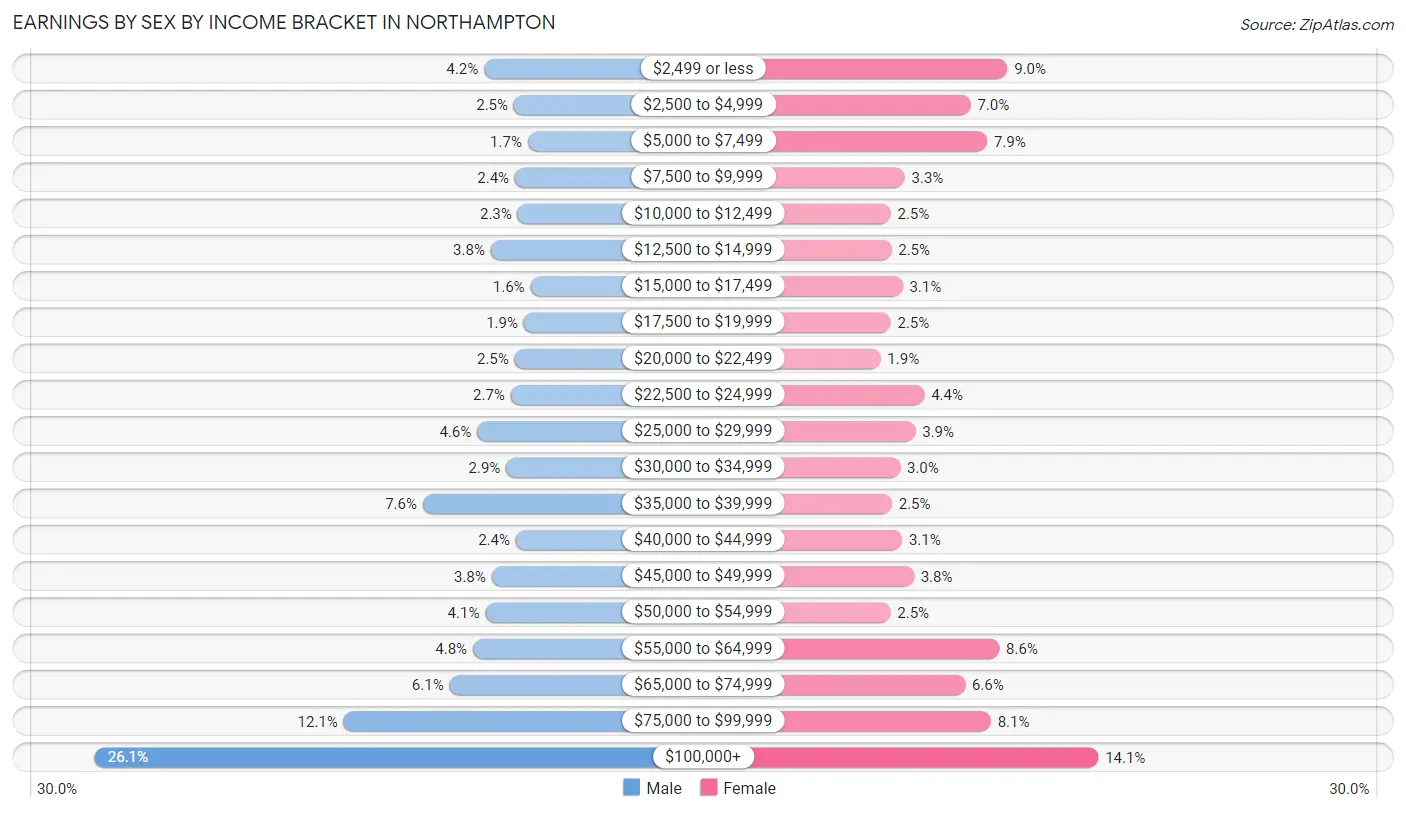
Earnings by Sex by Income Bracket in Northampton
The most common earnings brackets in Northampton are $100,000+ for men (1,876 | 26.1%) and $100,000+ for women (1,339 | 14.1%).
| Income | Male | Female |
| $2,499 or less | 301 (4.2%) | 855 (9.0%) |
| $2,500 to $4,999 | 180 (2.5%) | 658 (7.0%) |
| $5,000 to $7,499 | 124 (1.7%) | 747 (7.9%) |
| $7,500 to $9,999 | 176 (2.4%) | 308 (3.3%) |
| $10,000 to $12,499 | 165 (2.3%) | 233 (2.5%) |
| $12,500 to $14,999 | 274 (3.8%) | 237 (2.5%) |
| $15,000 to $17,499 | 113 (1.6%) | 297 (3.1%) |
| $17,500 to $19,999 | 140 (1.9%) | 233 (2.5%) |
| $20,000 to $22,499 | 177 (2.5%) | 179 (1.9%) |
| $22,500 to $24,999 | 193 (2.7%) | 412 (4.3%) |
| $25,000 to $29,999 | 329 (4.6%) | 365 (3.8%) |
| $30,000 to $34,999 | 211 (2.9%) | 283 (3.0%) |
| $35,000 to $39,999 | 549 (7.6%) | 240 (2.5%) |
| $40,000 to $44,999 | 172 (2.4%) | 294 (3.1%) |
| $45,000 to $49,999 | 270 (3.7%) | 356 (3.8%) |
| $50,000 to $54,999 | 296 (4.1%) | 232 (2.5%) |
| $55,000 to $64,999 | 346 (4.8%) | 811 (8.6%) |
| $65,000 to $74,999 | 441 (6.1%) | 629 (6.6%) |
| $75,000 to $99,999 | 869 (12.1%) | 766 (8.1%) |
| $100,000+ | 1,876 (26.1%) | 1,339 (14.1%) |
| Total | 7,202 (100.0%) | 9,474 (100.0%) |
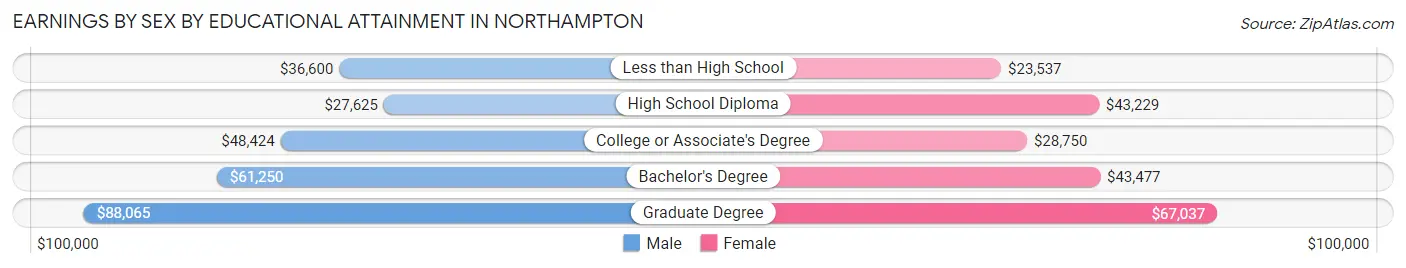
Earnings by Sex by Educational Attainment in Northampton
Average earnings in Northampton are $59,325 for men and $54,073 for women, a difference of 8.8%. Men with an educational attainment of graduate degree enjoy the highest average annual earnings of $88,065, while those with high school diploma education earn the least with $27,625. Women with an educational attainment of graduate degree earn the most with the average annual earnings of $67,037, while those with less than high school education have the smallest earnings of $23,537.
| Educational Attainment | Male Income | Female Income |
| Less than High School | $36,600 | $23,537 |
| High School Diploma | $27,625 | $43,229 |
| College or Associate's Degree | $48,424 | $28,750 |
| Bachelor's Degree | $61,250 | $43,477 |
| Graduate Degree | $88,065 | $67,037 |
| Total | $59,325 | $54,073 |
Family Income in Northampton
Family Income Brackets in Northampton
According to the Northampton family income data, there are 1,590 families falling into the $200,000+ income range, which is the most common income bracket and makes up 25.2% of all families. Conversely, the $10,000 to $14,999 income bracket is the least frequent group with only 57 families (0.9%) belonging to this category.
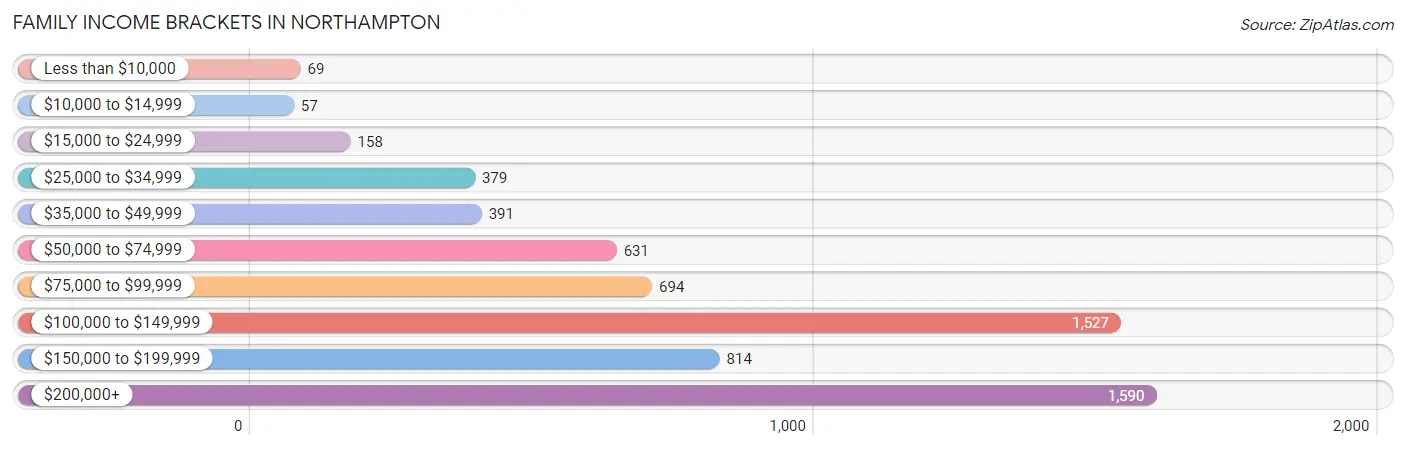
| Income Bracket | # Families | % Families |
| Less than $10,000 | 69 | 1.1% |
| $10,000 to $14,999 | 57 | 0.9% |
| $15,000 to $24,999 | 158 | 2.5% |
| $25,000 to $34,999 | 379 | 6.0% |
| $35,000 to $49,999 | 391 | 6.2% |
| $50,000 to $74,999 | 631 | 10.0% |
| $75,000 to $99,999 | 694 | 11.0% |
| $100,000 to $149,999 | 1,527 | 24.2% |
| $150,000 to $199,999 | 814 | 12.9% |
| $200,000+ | 1,590 | 25.2% |
Family Income by Famaliy Size in Northampton
5-person families (170 | 2.7%) account for the highest median family income in Northampton with $178,500 per family, while 2-person families (3,458 | 54.8%) have the highest median income of $57,180 per family member.
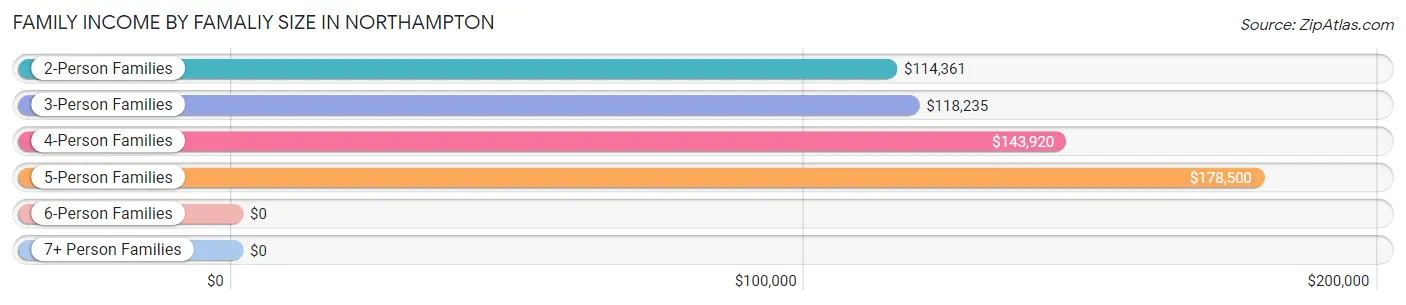
| Income Bracket | # Families | Median Income |
| 2-Person Families | 3,458 (54.8%) | $114,361 |
| 3-Person Families | 1,490 (23.6%) | $118,235 |
| 4-Person Families | 1,097 (17.4%) | $143,920 |
| 5-Person Families | 170 (2.7%) | $178,500 |
| 6-Person Families | 60 (0.9%) | $0 |
| 7+ Person Families | 35 (0.5%) | $0 |
| Total | 6,310 (100.0%) | $123,871 |
Family Income by Number of Earners in Northampton
The median family income in Northampton is $123,871, with families comprising 3+ earners (470) having the highest median family income of $166,591, while families with no earners (696) have the lowest median family income of $70,500, accounting for 7.4% and 11.0% of families, respectively.
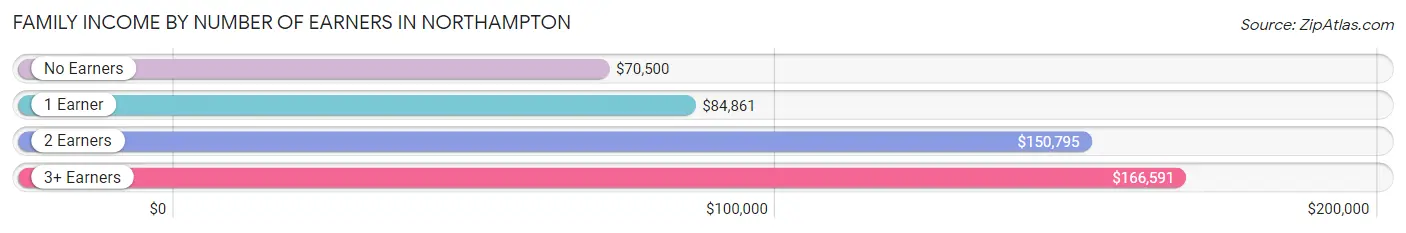
| Number of Earners | # Families | Median Income |
| No Earners | 696 (11.0%) | $70,500 |
| 1 Earner | 2,189 (34.7%) | $84,861 |
| 2 Earners | 2,955 (46.8%) | $150,795 |
| 3+ Earners | 470 (7.4%) | $166,591 |
| Total | 6,310 (100.0%) | $123,871 |
Household Income in Northampton
Household Income Brackets in Northampton
With 2,210 households falling in the category, the $100,000 to $149,999 income range is the most frequent in Northampton, accounting for 17.9% of all households. In contrast, only 518 households (4.2%) fall into the $10,000 to $14,999 income bracket, making it the least populous group.
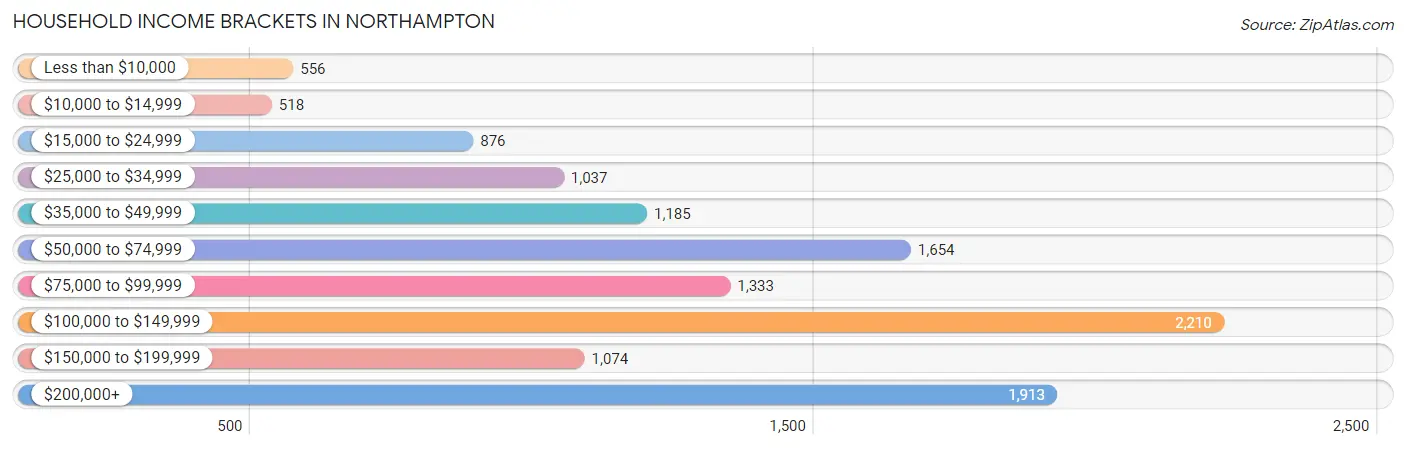
| Income Bracket | # Households | % Households |
| Less than $10,000 | 556 | 4.5% |
| $10,000 to $14,999 | 518 | 4.2% |
| $15,000 to $24,999 | 876 | 7.1% |
| $25,000 to $34,999 | 1,037 | 8.4% |
| $35,000 to $49,999 | 1,185 | 9.6% |
| $50,000 to $74,999 | 1,654 | 13.4% |
| $75,000 to $99,999 | 1,333 | 10.8% |
| $100,000 to $149,999 | 2,210 | 17.9% |
| $150,000 to $199,999 | 1,074 | 8.7% |
| $200,000+ | 1,913 | 15.5% |
Household Income by Householder Age in Northampton
The median household income in Northampton is $80,981, with the highest median household income of $100,368 found in the 45 to 64 years age bracket for the primary householder. A total of 4,466 households (36.2%) fall into this category. Meanwhile, the 15 to 24 years age bracket for the primary householder has the lowest median household income of $45,500, with 294 households (2.4%) in this group.
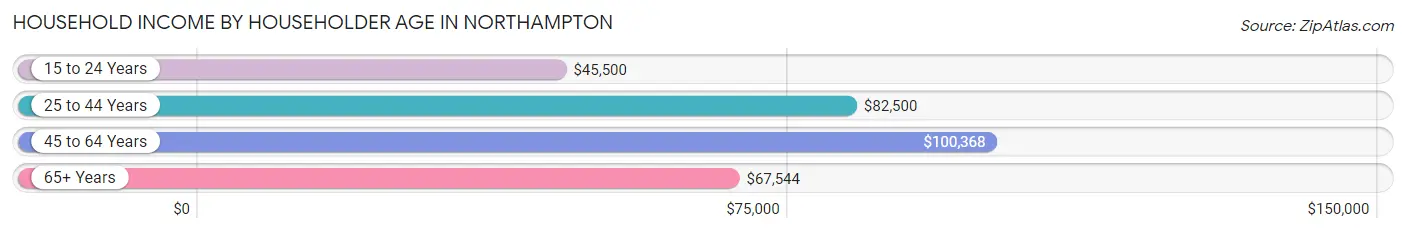
| Income Bracket | # Households | Median Income |
| 15 to 24 Years | 294 (2.4%) | $45,500 |
| 25 to 44 Years | 3,838 (31.1%) | $82,500 |
| 45 to 64 Years | 4,466 (36.2%) | $100,368 |
| 65+ Years | 3,747 (30.3%) | $67,544 |
| Total | 12,345 (100.0%) | $80,981 |
Poverty in Northampton
Income Below Poverty by Sex and Age in Northampton
With 10.4% poverty level for males and 12.0% for females among the residents of Northampton, 45 to 54 year old males and 6 to 11 year old females are the most vulnerable to poverty, with 331 males (18.9%) and 182 females (28.0%) in their respective age groups living below the poverty level.
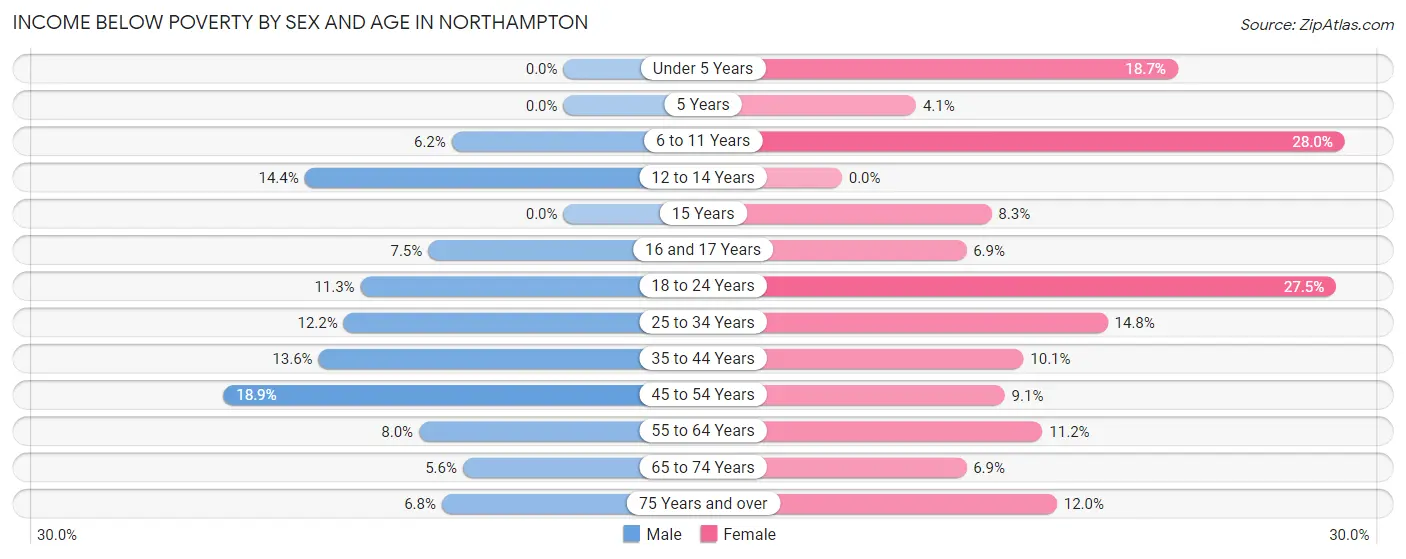
| Age Bracket | Male | Female |
| Under 5 Years | 0 (0.0%) | 69 (18.7%) |
| 5 Years | 0 (0.0%) | 5 (4.1%) |
| 6 to 11 Years | 40 (6.2%) | 182 (28.0%) |
| 12 to 14 Years | 68 (14.4%) | 0 (0.0%) |
| 15 Years | 0 (0.0%) | 8 (8.3%) |
| 16 and 17 Years | 25 (7.5%) | 23 (6.9%) |
| 18 to 24 Years | 61 (11.3%) | 199 (27.5%) |
| 25 to 34 Years | 189 (12.2%) | 290 (14.8%) |
| 35 to 44 Years | 216 (13.6%) | 183 (10.1%) |
| 45 to 54 Years | 331 (18.9%) | 155 (9.1%) |
| 55 to 64 Years | 134 (8.0%) | 232 (11.2%) |
| 65 to 74 Years | 84 (5.6%) | 144 (6.9%) |
| 75 Years and over | 50 (6.8%) | 136 (12.0%) |
| Total | 1,198 (10.4%) | 1,626 (12.0%) |
Income Above Poverty by Sex and Age in Northampton
According to the poverty statistics in Northampton, males aged under 5 years and females aged 12 to 14 years are the age groups that are most secure financially, with 100.0% of males and 100.0% of females in these age groups living above the poverty line.
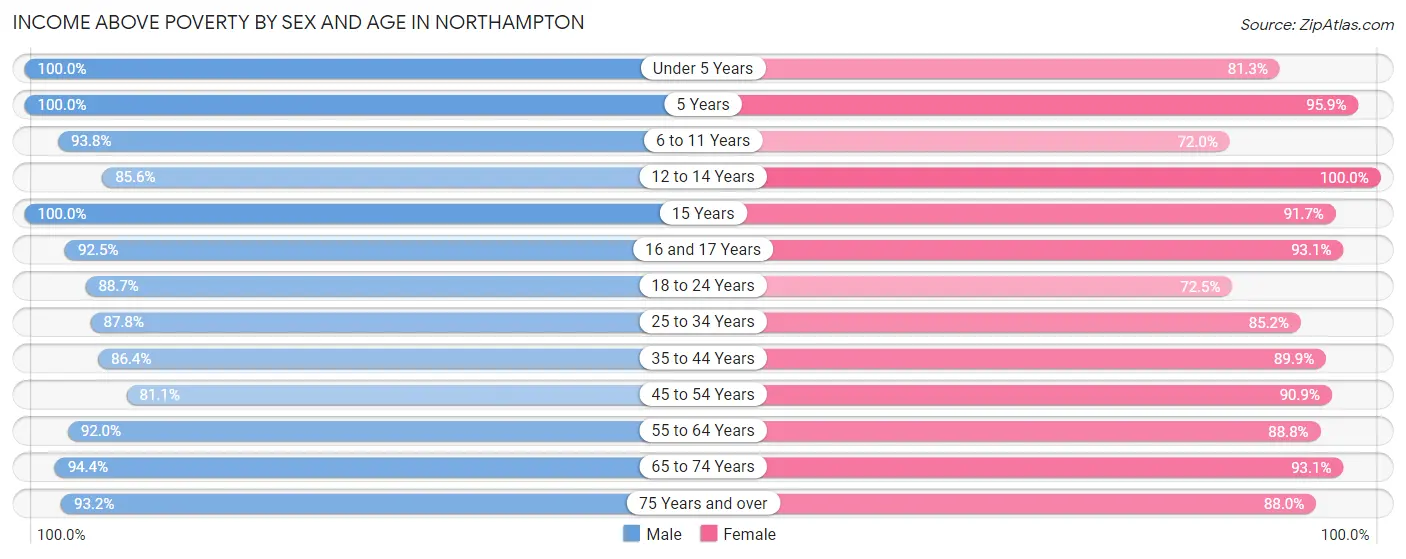
| Age Bracket | Male | Female |
| Under 5 Years | 497 (100.0%) | 300 (81.3%) |
| 5 Years | 88 (100.0%) | 116 (95.9%) |
| 6 to 11 Years | 603 (93.8%) | 468 (72.0%) |
| 12 to 14 Years | 404 (85.6%) | 472 (100.0%) |
| 15 Years | 122 (100.0%) | 88 (91.7%) |
| 16 and 17 Years | 307 (92.5%) | 309 (93.1%) |
| 18 to 24 Years | 479 (88.7%) | 524 (72.5%) |
| 25 to 34 Years | 1,355 (87.8%) | 1,670 (85.2%) |
| 35 to 44 Years | 1,367 (86.4%) | 1,627 (89.9%) |
| 45 to 54 Years | 1,418 (81.1%) | 1,553 (90.9%) |
| 55 to 64 Years | 1,533 (92.0%) | 1,845 (88.8%) |
| 65 to 74 Years | 1,417 (94.4%) | 1,934 (93.1%) |
| 75 Years and over | 689 (93.2%) | 1,000 (88.0%) |
| Total | 10,279 (89.6%) | 11,906 (88.0%) |
Income Below Poverty Among Married-Couple Families in Northampton
The poverty statistics for married-couple families in Northampton show that 3.5% or 164 of the total 4,749 families live below the poverty line. Families with 3 or 4 children have the highest poverty rate of 14.4%, comprising of 28 families. On the other hand, families with 1 or 2 children have the lowest poverty rate of 2.9%, which includes 47 families.
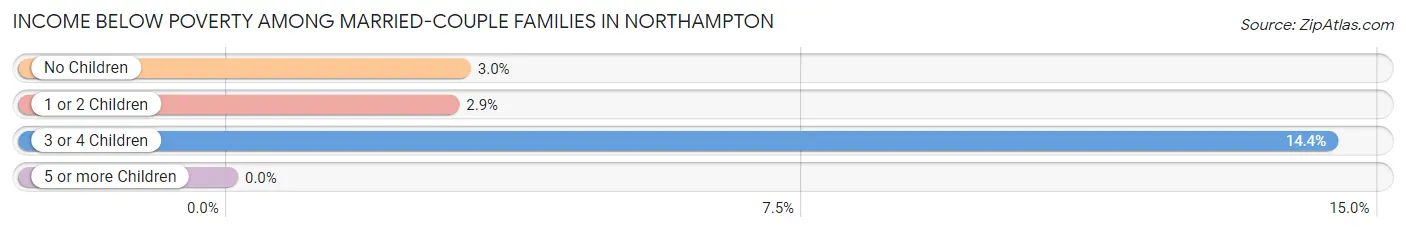
| Children | Above Poverty | Below Poverty |
| No Children | 2,840 (97.0%) | 89 (3.0%) |
| 1 or 2 Children | 1,578 (97.1%) | 47 (2.9%) |
| 3 or 4 Children | 167 (85.6%) | 28 (14.4%) |
| 5 or more Children | 0 (0.0%) | 0 (0.0%) |
| Total | 4,585 (96.6%) | 164 (3.5%) |
Income Below Poverty Among Single-Parent Households in Northampton
According to the poverty data in Northampton, 5.3% or 16 single-father households and 11.9% or 150 single-mother households are living below the poverty line. Among single-father households, those with 1 or 2 children have the highest poverty rate, with 16 households (9.6%) experiencing poverty. Likewise, among single-mother households, those with 1 or 2 children have the highest poverty rate, with 118 households (17.4%) falling below the poverty line.
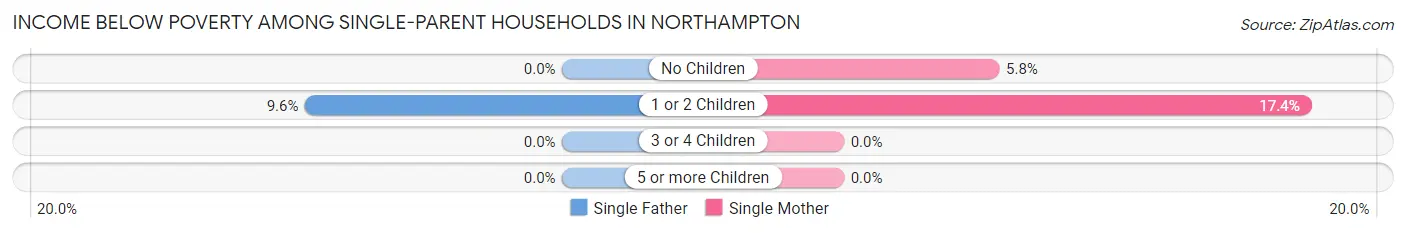
| Children | Single Father | Single Mother |
| No Children | 0 (0.0%) | 32 (5.8%) |
| 1 or 2 Children | 16 (9.6%) | 118 (17.4%) |
| 3 or 4 Children | 0 (0.0%) | 0 (0.0%) |
| 5 or more Children | 0 (0.0%) | 0 (0.0%) |
| Total | 16 (5.3%) | 150 (11.9%) |
Income Below Poverty Among Married-Couple vs Single-Parent Households in Northampton
The poverty data for Northampton shows that 164 of the married-couple family households (3.5%) and 166 of the single-parent households (10.6%) are living below the poverty level. Within the married-couple family households, those with 3 or 4 children have the highest poverty rate, with 28 households (14.4%) falling below the poverty line. Among the single-parent households, those with 1 or 2 children have the highest poverty rate, with 134 household (15.9%) living below poverty.
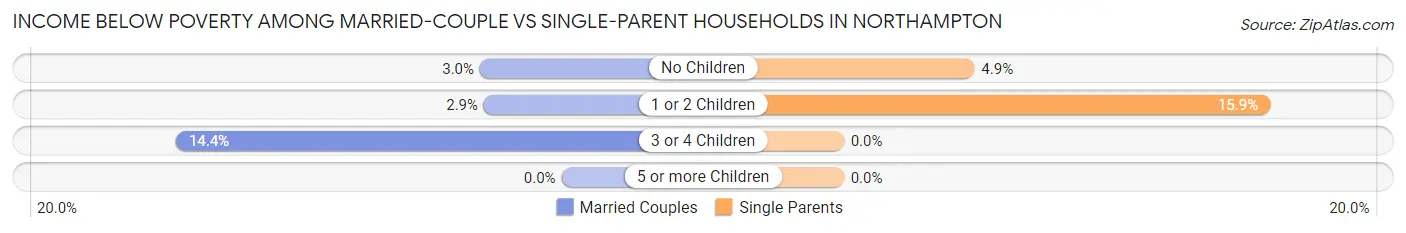
| Children | Married-Couple Families | Single-Parent Households |
| No Children | 89 (3.0%) | 32 (4.9%) |
| 1 or 2 Children | 47 (2.9%) | 134 (15.9%) |
| 3 or 4 Children | 28 (14.4%) | 0 (0.0%) |
| 5 or more Children | 0 (0.0%) | 0 (0.0%) |
| Total | 164 (3.5%) | 166 (10.6%) |
Race in Northampton
The most populous races in Northampton are White / Caucasian (24,117 | 85.4%), Hispanic or Latino (2,240 | 7.9%), and Two or more Races (1,413 | 5.0%).
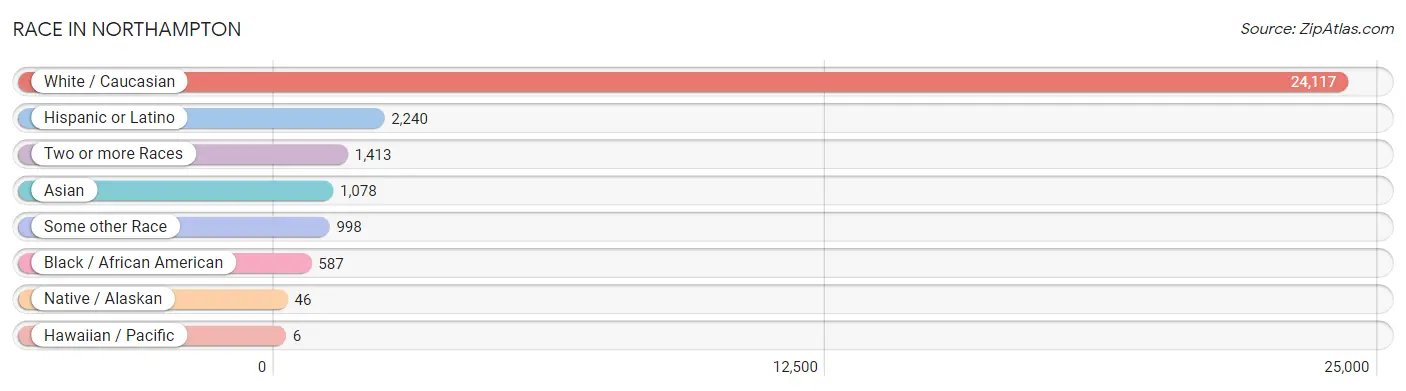
| Race | # Population | % Population |
| Asian | 1,078 | 3.8% |
| Black / African American | 587 | 2.1% |
| Hawaiian / Pacific | 6 | 0.0% |
| Hispanic or Latino | 2,240 | 7.9% |
| Native / Alaskan | 46 | 0.2% |
| White / Caucasian | 24,117 | 85.4% |
| Two or more Races | 1,413 | 5.0% |
| Some other Race | 998 | 3.5% |
| Total | 28,245 | 100.0% |
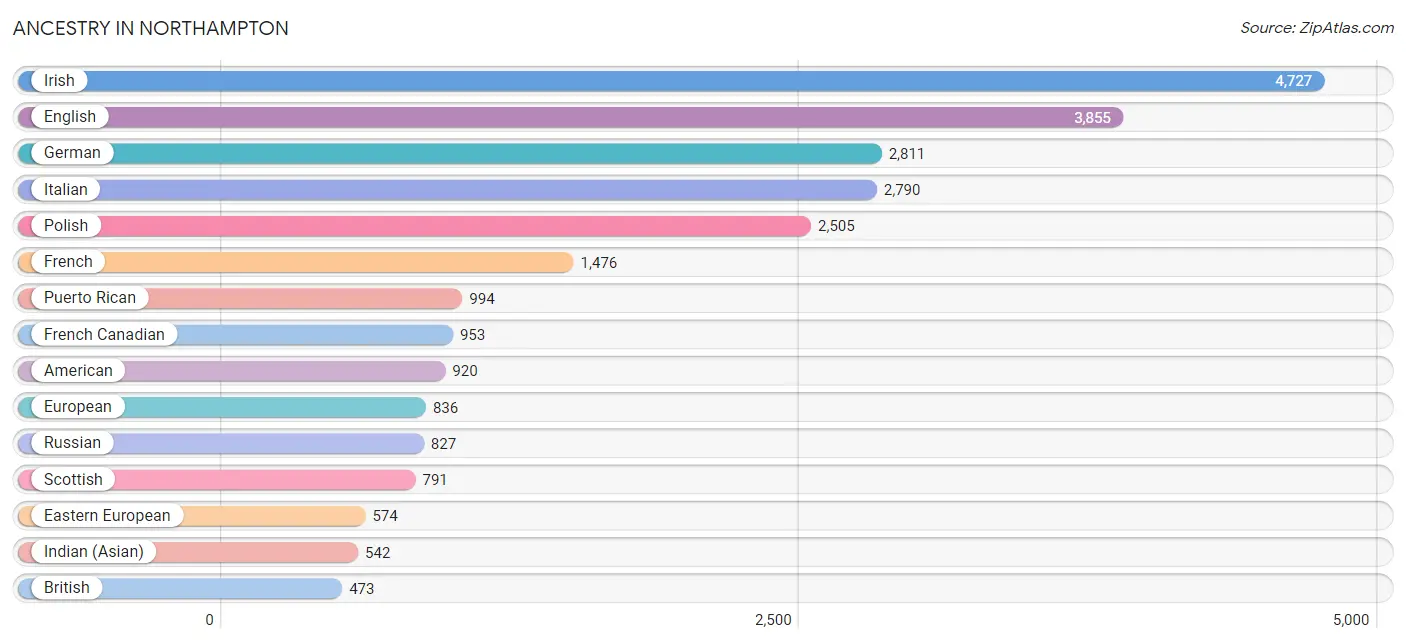
Ancestry in Northampton
The most populous ancestries reported in Northampton are Irish (4,727 | 16.7%), English (3,855 | 13.7%), German (2,811 | 10.0%), Italian (2,790 | 9.9%), and Polish (2,505 | 8.9%), together accounting for 59.1% of all Northampton residents.
| Ancestry | # Population | % Population |
| African | 23 | 0.1% |
| Albanian | 31 | 0.1% |
| American | 920 | 3.3% |
| Arab | 57 | 0.2% |
| Argentinean | 27 | 0.1% |
| Armenian | 104 | 0.4% |
| Austrian | 115 | 0.4% |
| Bahamian | 12 | 0.0% |
| Barbadian | 11 | 0.0% |
| Belgian | 93 | 0.3% |
| Bhutanese | 115 | 0.4% |
| Blackfeet | 7 | 0.0% |
| Brazilian | 183 | 0.6% |
| British | 473 | 1.7% |
| British West Indian | 10 | 0.0% |
| Burmese | 72 | 0.3% |
| Cajun | 13 | 0.1% |
| Canadian | 108 | 0.4% |
| Cape Verdean | 10 | 0.0% |
| Central American | 252 | 0.9% |
| Central American Indian | 5 | 0.0% |
| Cherokee | 23 | 0.1% |
| Chickasaw | 23 | 0.1% |
| Chilean | 7 | 0.0% |
| Colombian | 125 | 0.4% |
| Costa Rican | 8 | 0.0% |
| Croatian | 30 | 0.1% |
| Cuban | 13 | 0.1% |
| Czech | 109 | 0.4% |
| Czechoslovakian | 39 | 0.1% |
| Danish | 140 | 0.5% |
| Dominican | 57 | 0.2% |
| Dutch | 313 | 1.1% |
| Eastern European | 574 | 2.0% |
| Ecuadorian | 298 | 1.1% |
| English | 3,855 | 13.7% |
| Ethiopian | 2 | 0.0% |
| European | 836 | 3.0% |
| Filipino | 14 | 0.1% |
| Finnish | 93 | 0.3% |
| French | 1,476 | 5.2% |
| French Canadian | 953 | 3.4% |
| German | 2,811 | 10.0% |
| Ghanaian | 10 | 0.0% |
| Greek | 97 | 0.3% |
| Guamanian / Chamorro | 18 | 0.1% |
| Guatemalan | 43 | 0.2% |
| Haitian | 15 | 0.1% |
| Hungarian | 263 | 0.9% |
| Icelander | 24 | 0.1% |
| Indian (Asian) | 542 | 1.9% |
| Iranian | 25 | 0.1% |
| Irish | 4,727 | 16.7% |
| Iroquois | 16 | 0.1% |
| Israeli | 8 | 0.0% |
| Italian | 2,790 | 9.9% |
| Jamaican | 34 | 0.1% |
| Japanese | 21 | 0.1% |
| Kenyan | 8 | 0.0% |
| Korean | 101 | 0.4% |
| Latvian | 6 | 0.0% |
| Lebanese | 35 | 0.1% |
| Lithuanian | 360 | 1.3% |
| Macedonian | 31 | 0.1% |
| Mexican | 205 | 0.7% |
| Moroccan | 7 | 0.0% |
| Nigerian | 3 | 0.0% |
| Northern European | 71 | 0.3% |
| Norwegian | 280 | 1.0% |
| Pakistani | 32 | 0.1% |
| Pennsylvania German | 7 | 0.0% |
| Peruvian | 16 | 0.1% |
| Polish | 2,505 | 8.9% |
| Portuguese | 117 | 0.4% |
| Puerto Rican | 994 | 3.5% |
| Romanian | 35 | 0.1% |
| Russian | 827 | 2.9% |
| Salvadoran | 201 | 0.7% |
| Scandinavian | 111 | 0.4% |
| Scotch-Irish | 252 | 0.9% |
| Scottish | 791 | 2.8% |
| Senegalese | 10 | 0.0% |
| Sioux | 3 | 0.0% |
| Slavic | 22 | 0.1% |
| Slovak | 22 | 0.1% |
| Slovene | 10 | 0.0% |
| South African | 23 | 0.1% |
| South American | 473 | 1.7% |
| Spaniard | 86 | 0.3% |
| Spanish | 14 | 0.1% |
| Sri Lankan | 114 | 0.4% |
| Subsaharan African | 137 | 0.5% |
| Swedish | 331 | 1.2% |
| Swiss | 69 | 0.2% |
| Thai | 372 | 1.3% |
| Tongan | 14 | 0.1% |
| Trinidadian and Tobagonian | 51 | 0.2% |
| Turkish | 12 | 0.0% |
| Ukrainian | 198 | 0.7% |
| Welsh | 216 | 0.8% |
| West Indian | 14 | 0.1% | View All 101 Rows |
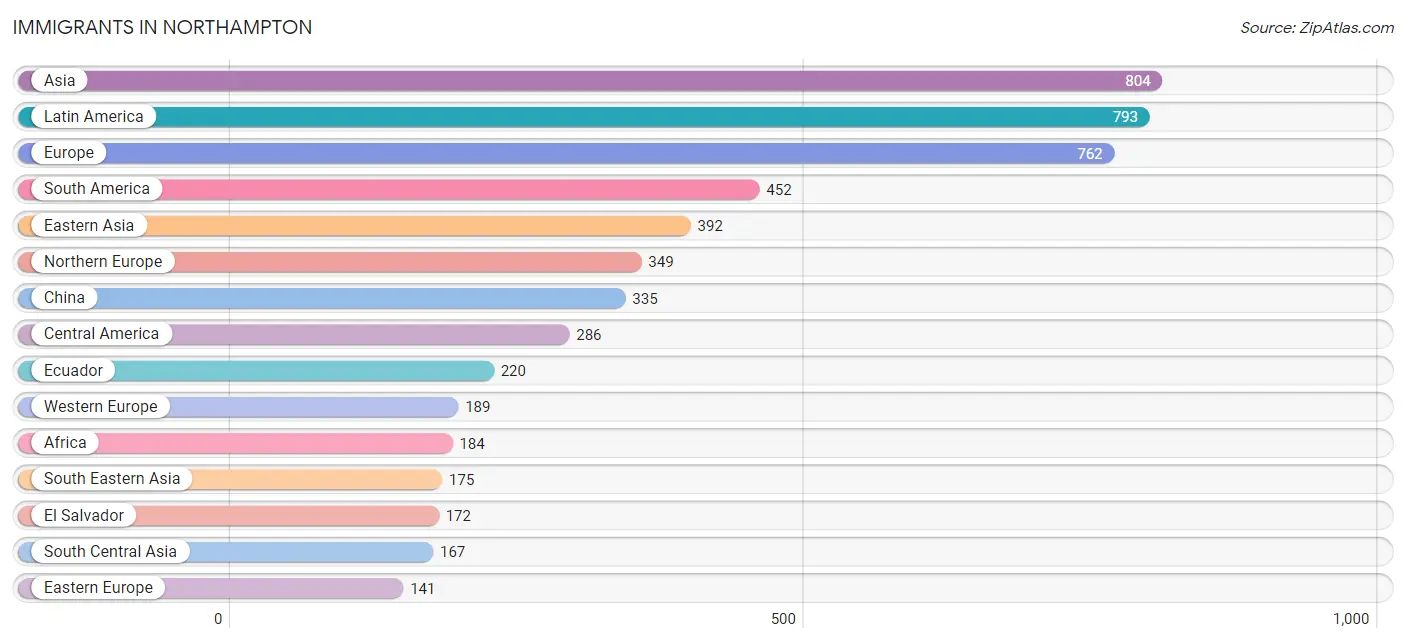
Immigrants in Northampton
The most numerous immigrant groups reported in Northampton came from Asia (804 | 2.9%), Latin America (793 | 2.8%), Europe (762 | 2.7%), South America (452 | 1.6%), and Eastern Asia (392 | 1.4%), together accounting for 11.3% of all Northampton residents.
| Immigration Origin | # Population | % Population |
| Africa | 184 | 0.6% |
| Albania | 3 | 0.0% |
| Argentina | 27 | 0.1% |
| Asia | 804 | 2.9% |
| Austria | 7 | 0.0% |
| Bahamas | 12 | 0.0% |
| Belarus | 12 | 0.0% |
| Brazil | 120 | 0.4% |
| Cambodia | 3 | 0.0% |
| Canada | 61 | 0.2% |
| Caribbean | 55 | 0.2% |
| Central America | 286 | 1.0% |
| China | 335 | 1.2% |
| Colombia | 77 | 0.3% |
| Congo | 48 | 0.2% |
| Cuba | 13 | 0.1% |
| Czechoslovakia | 4 | 0.0% |
| Dominican Republic | 10 | 0.0% |
| Eastern Africa | 10 | 0.0% |
| Eastern Asia | 392 | 1.4% |
| Eastern Europe | 141 | 0.5% |
| Ecuador | 220 | 0.8% |
| El Salvador | 172 | 0.6% |
| England | 136 | 0.5% |
| Ethiopia | 2 | 0.0% |
| Europe | 762 | 2.7% |
| France | 78 | 0.3% |
| Germany | 79 | 0.3% |
| Ghana | 4 | 0.0% |
| Greece | 28 | 0.1% |
| Guatemala | 57 | 0.2% |
| Haiti | 15 | 0.1% |
| Hong Kong | 17 | 0.1% |
| India | 124 | 0.4% |
| Iran | 25 | 0.1% |
| Ireland | 23 | 0.1% |
| Israel | 4 | 0.0% |
| Jamaica | 5 | 0.0% |
| Japan | 3 | 0.0% |
| Korea | 54 | 0.2% |
| Latin America | 793 | 2.8% |
| Mexico | 57 | 0.2% |
| Middle Africa | 88 | 0.3% |
| Morocco | 21 | 0.1% |
| Nepal | 2 | 0.0% |
| Netherlands | 2 | 0.0% |
| Northern Africa | 28 | 0.1% |
| Northern Europe | 349 | 1.2% |
| Pakistan | 7 | 0.0% |
| Peru | 8 | 0.0% |
| Philippines | 59 | 0.2% |
| Poland | 11 | 0.0% |
| Portugal | 26 | 0.1% |
| Russia | 65 | 0.2% |
| Scotland | 6 | 0.0% |
| Singapore | 40 | 0.1% |
| South Africa | 41 | 0.2% |
| South America | 452 | 1.6% |
| South Central Asia | 167 | 0.6% |
| South Eastern Asia | 175 | 0.6% |
| Southern Europe | 83 | 0.3% |
| Spain | 29 | 0.1% |
| Switzerland | 23 | 0.1% |
| Syria | 6 | 0.0% |
| Taiwan | 34 | 0.1% |
| Thailand | 26 | 0.1% |
| Turkey | 31 | 0.1% |
| Ukraine | 26 | 0.1% |
| Vietnam | 47 | 0.2% |
| Western Africa | 4 | 0.0% |
| Western Asia | 43 | 0.2% |
| Western Europe | 189 | 0.7% | View All 72 Rows |
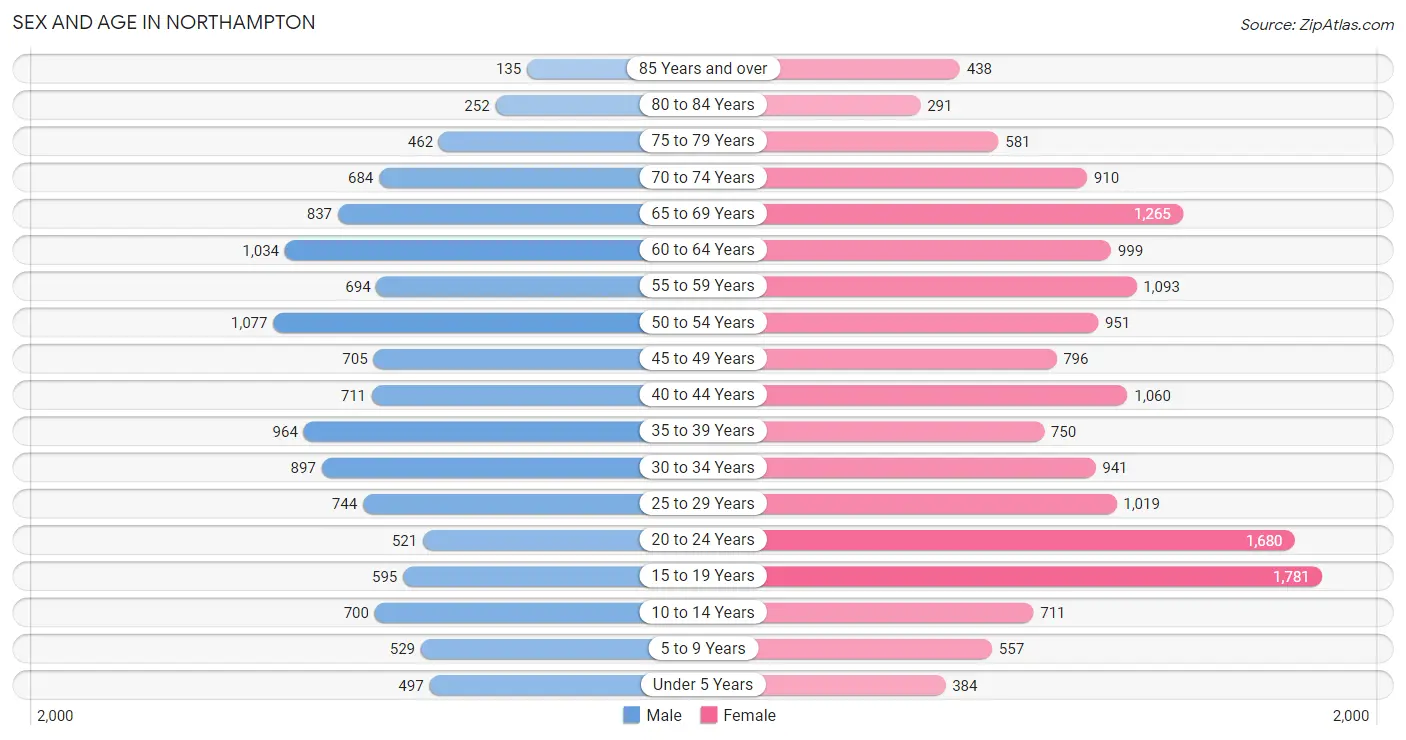
Sex and Age in Northampton
Sex and Age in Northampton
The most populous age groups in Northampton are 50 to 54 Years (1,077 | 8.9%) for men and 15 to 19 Years (1,781 | 11.0%) for women.
| Age Bracket | Male | Female |
| Under 5 Years | 497 (4.1%) | 384 (2.4%) |
| 5 to 9 Years | 529 (4.4%) | 557 (3.4%) |
| 10 to 14 Years | 700 (5.8%) | 711 (4.4%) |
| 15 to 19 Years | 595 (4.9%) | 1,781 (11.0%) |
| 20 to 24 Years | 521 (4.3%) | 1,680 (10.4%) |
| 25 to 29 Years | 744 (6.2%) | 1,019 (6.3%) |
| 30 to 34 Years | 897 (7.4%) | 941 (5.8%) |
| 35 to 39 Years | 964 (8.0%) | 750 (4.6%) |
| 40 to 44 Years | 711 (5.9%) | 1,060 (6.5%) |
| 45 to 49 Years | 705 (5.9%) | 796 (4.9%) |
| 50 to 54 Years | 1,077 (8.9%) | 951 (5.9%) |
| 55 to 59 Years | 694 (5.8%) | 1,093 (6.7%) |
| 60 to 64 Years | 1,034 (8.6%) | 999 (6.2%) |
| 65 to 69 Years | 837 (7.0%) | 1,265 (7.8%) |
| 70 to 74 Years | 684 (5.7%) | 910 (5.6%) |
| 75 to 79 Years | 462 (3.8%) | 581 (3.6%) |
| 80 to 84 Years | 252 (2.1%) | 291 (1.8%) |
| 85 Years and over | 135 (1.1%) | 438 (2.7%) |
| Total | 12,038 (100.0%) | 16,207 (100.0%) |
Families and Households in Northampton
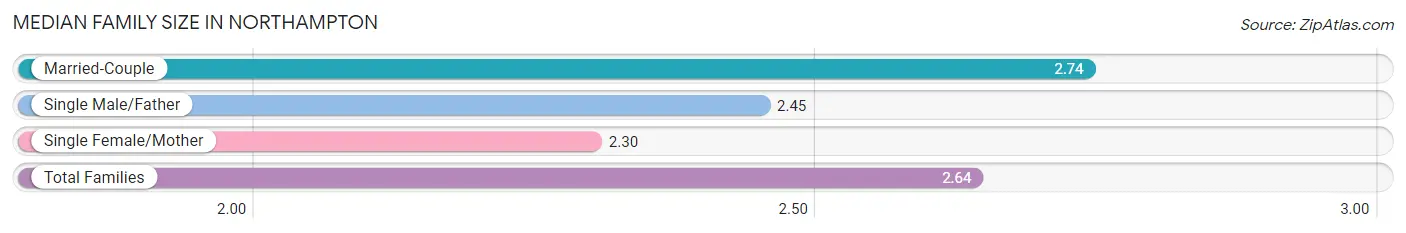
Median Family Size in Northampton
The median family size in Northampton is 2.64 persons per family, with married-couple families (4,749 | 75.3%) accounting for the largest median family size of 2.74 persons per family. On the other hand, single female/mother families (1,258 | 19.9%) represent the smallest median family size with 2.30 persons per family.
| Family Type | # Families | Family Size |
| Married-Couple | 4,749 (75.3%) | 2.74 |
| Single Male/Father | 303 (4.8%) | 2.45 |
| Single Female/Mother | 1,258 (19.9%) | 2.30 |
| Total Families | 6,310 (100.0%) | 2.64 |
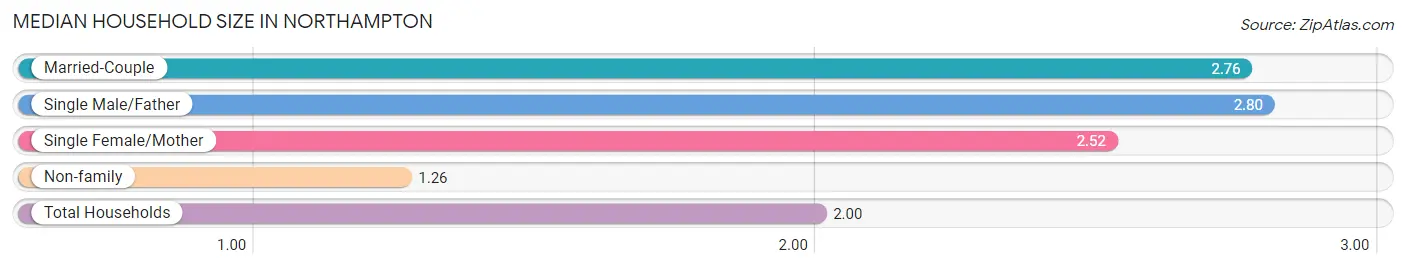
Median Household Size in Northampton
The median household size in Northampton is 2.00 persons per household, with single male/father households (303 | 2.5%) accounting for the largest median household size of 2.8 persons per household. non-family households (6,035 | 48.9%) represent the smallest median household size with 1.26 persons per household.
| Household Type | # Households | Household Size |
| Married-Couple | 4,749 (38.5%) | 2.76 |
| Single Male/Father | 303 (2.5%) | 2.80 |
| Single Female/Mother | 1,258 (10.2%) | 2.52 |
| Non-family | 6,035 (48.9%) | 1.26 |
| Total Households | 12,345 (100.0%) | 2.00 |
Household Size by Marriage Status in Northampton
Out of a total of 12,345 households in Northampton, 6,310 (51.1%) are family households, while 6,035 (48.9%) are nonfamily households. The most numerous type of family households are 2-person households, comprising 3,133, and the most common type of nonfamily households are 1-person households, comprising 4,504.
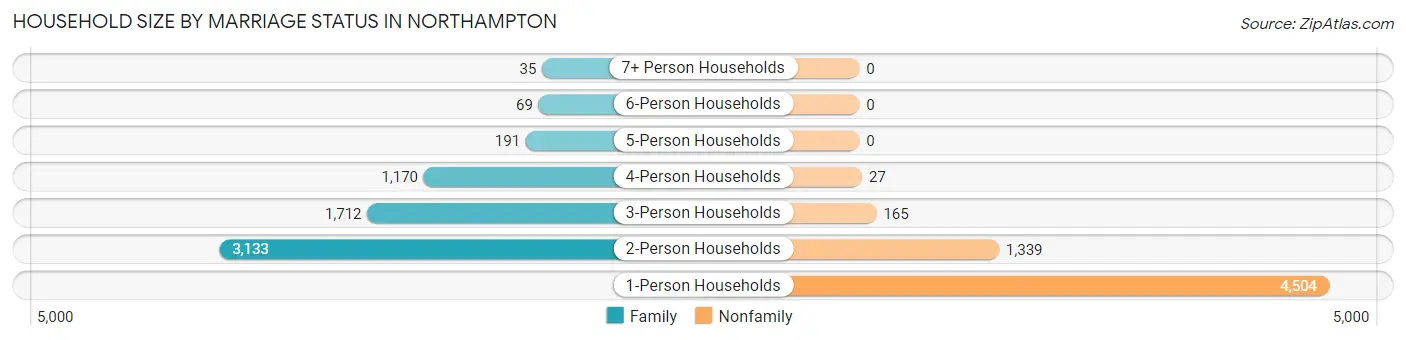
| Household Size | Family Households | Nonfamily Households |
| 1-Person Households | - | 4,504 (36.5%) |
| 2-Person Households | 3,133 (25.4%) | 1,339 (10.8%) |
| 3-Person Households | 1,712 (13.9%) | 165 (1.3%) |
| 4-Person Households | 1,170 (9.5%) | 27 (0.2%) |
| 5-Person Households | 191 (1.5%) | 0 (0.0%) |
| 6-Person Households | 69 (0.6%) | 0 (0.0%) |
| 7+ Person Households | 35 (0.3%) | 0 (0.0%) |
| Total | 6,310 (51.1%) | 6,035 (48.9%) |
Female Fertility in Northampton
Fertility by Age in Northampton
Average fertility rate in Northampton is 25.0 births per 1,000 women. Women in the age bracket of 35 to 50 years have the highest fertility rate with 42.0 births per 1,000 women. Women in the age bracket of 35 to 50 years acount for 59.5% of all women with births.
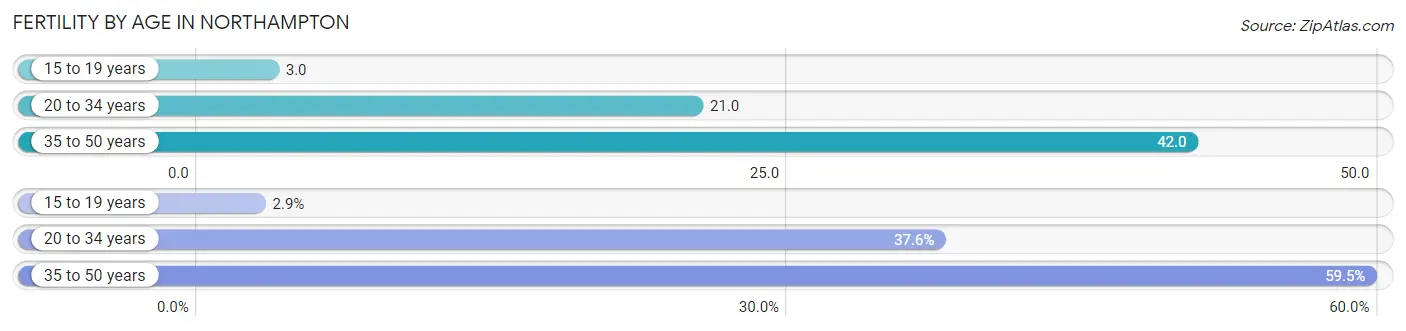
| Age Bracket | Women with Births | Births / 1,000 Women |
| 15 to 19 years | 6 (2.9%) | 3.0 |
| 20 to 34 years | 77 (37.6%) | 21.0 |
| 35 to 50 years | 122 (59.5%) | 42.0 |
| Total | 205 (100.0%) | 25.0 |
Fertility by Age by Marriage Status in Northampton
92.2% of women with births (205) in Northampton are married. The highest percentage of unmarried women with births falls into 15 to 19 years age bracket with 100.0% of them unmarried at the time of birth, while the lowest percentage of unmarried women with births belong to 20 to 34 years age bracket with 2.6% of them unmarried.
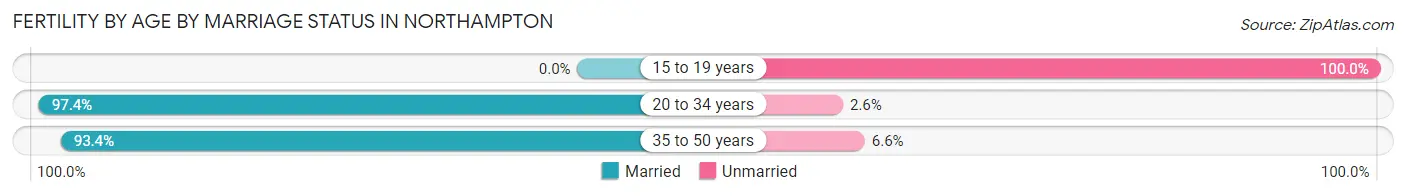
| Age Bracket | Married | Unmarried |
| 15 to 19 years | 0 (0.0%) | 6 (100.0%) |
| 20 to 34 years | 75 (97.4%) | 2 (2.6%) |
| 35 to 50 years | 114 (93.4%) | 8 (6.6%) |
| Total | 189 (92.2%) | 16 (7.8%) |
Fertility by Education in Northampton
Average fertility rate in Northampton is 25.0 births per 1,000 women. Women with the education attainment of graduate degree have the highest fertility rate of 60.0 births per 1,000 women, while women with the education attainment of less than high school have the lowest fertility at 3.0 births per 1,000 women. Women with the education attainment of graduate degree represent 64.4% of all women with births.
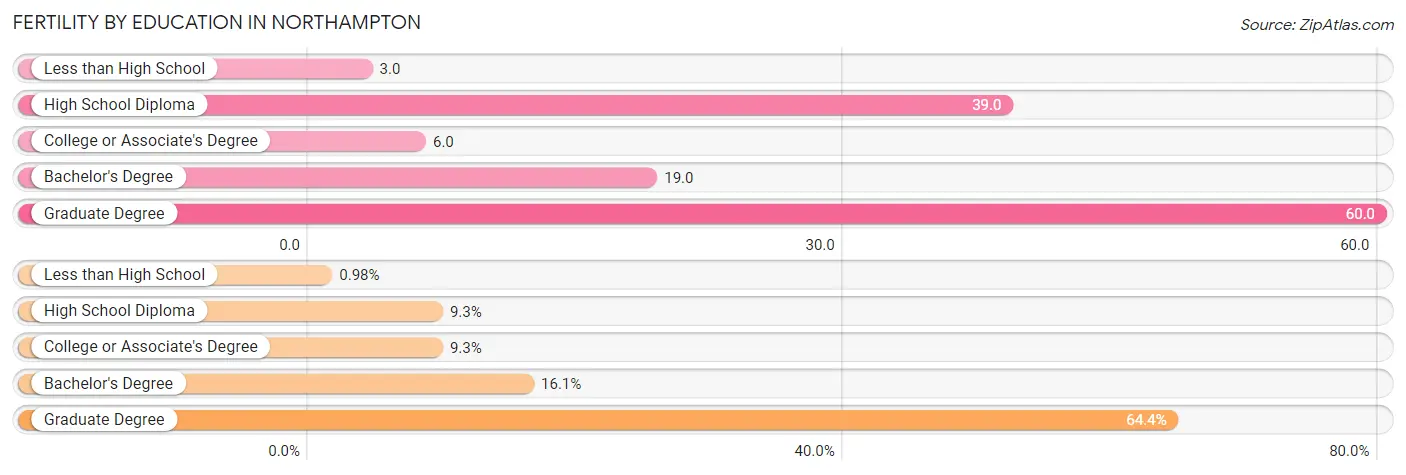
| Educational Attainment | Women with Births | Births / 1,000 Women |
| Less than High School | 2 (1.0%) | 3.0 |
| High School Diploma | 19 (9.3%) | 39.0 |
| College or Associate's Degree | 19 (9.3%) | 6.0 |
| Bachelor's Degree | 33 (16.1%) | 19.0 |
| Graduate Degree | 132 (64.4%) | 60.0 |
| Total | 205 (100.0%) | 25.0 |
Fertility by Education by Marriage Status in Northampton
7.8% of women with births in Northampton are unmarried. Women with the educational attainment of bachelor's degree are most likely to be married with 100.0% of them married at childbirth, while women with the educational attainment of less than high school are least likely to be married with 100.0% of them unmarried at childbirth.
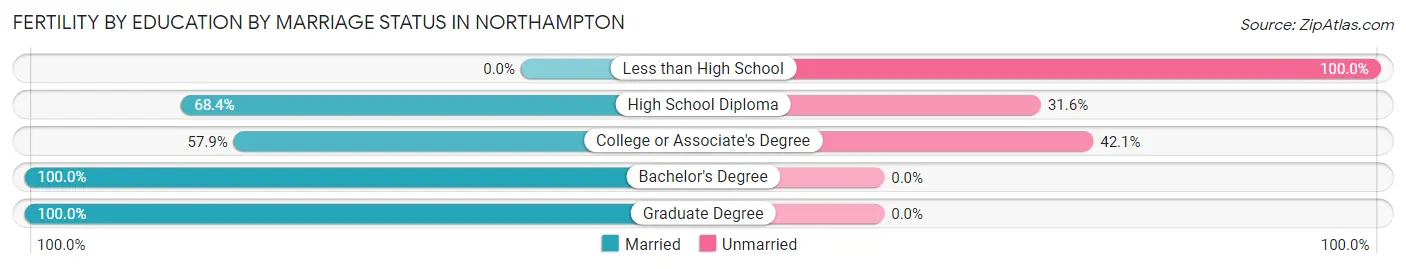
| Educational Attainment | Married | Unmarried |
| Less than High School | 0 (0.0%) | 2 (100.0%) |
| High School Diploma | 13 (68.4%) | 6 (31.6%) |
| College or Associate's Degree | 11 (57.9%) | 8 (42.1%) |
| Bachelor's Degree | 33 (100.0%) | 0 (0.0%) |
| Graduate Degree | 132 (100.0%) | 0 (0.0%) |
| Total | 189 (92.2%) | 16 (7.8%) |
Employment Characteristics in Northampton
Employment by Class of Employer in Northampton
Among the 13,961 employed individuals in Northampton, private company employees (6,316 | 45.2%), not-for-profit organizations (3,322 | 23.8%), and self-employed (not incorporated) (1,417 | 10.2%) make up the most common classes of employment.
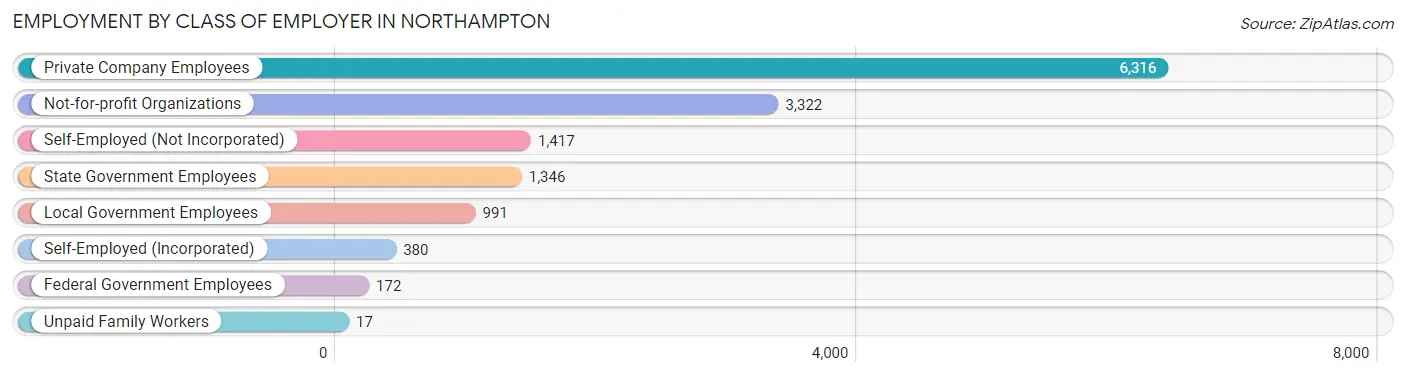
| Employer Class | # Employees | % Employees |
| Private Company Employees | 6,316 | 45.2% |
| Self-Employed (Incorporated) | 380 | 2.7% |
| Self-Employed (Not Incorporated) | 1,417 | 10.2% |
| Not-for-profit Organizations | 3,322 | 23.8% |
| Local Government Employees | 991 | 7.1% |
| State Government Employees | 1,346 | 9.6% |
| Federal Government Employees | 172 | 1.2% |
| Unpaid Family Workers | 17 | 0.1% |
| Total | 13,961 | 100.0% |
Employment Status by Age in Northampton
According to the labor force statistics for Northampton, out of the total population over 16 years of age (24,644), 61.5% or 15,156 individuals are in the labor force, with 5.6% or 849 of them unemployed. The age group with the highest labor force participation rate is 30 to 34 years, with 85.6% or 1,573 individuals in the labor force. Within the labor force, the 16 to 19 years age range has the highest percentage of unemployed individuals, with 18.0% or 147 of them being unemployed.
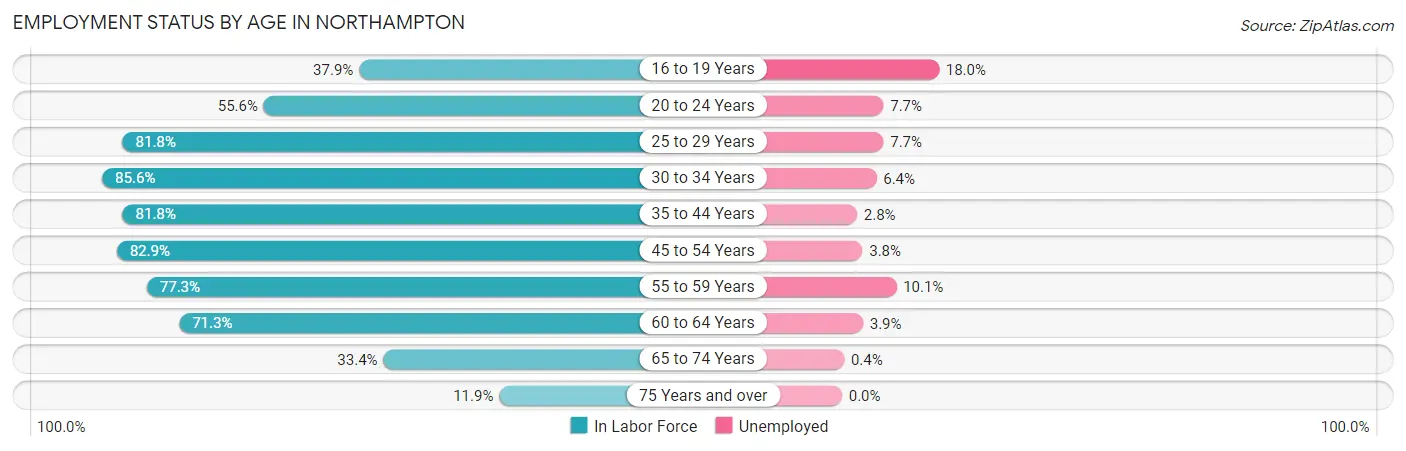
| Age Bracket | In Labor Force | Unemployed |
| 16 to 19 Years | 816 (37.9%) | 147 (18.0%) |
| 20 to 24 Years | 1,224 (55.6%) | 94 (7.7%) |
| 25 to 29 Years | 1,442 (81.8%) | 111 (7.7%) |
| 30 to 34 Years | 1,573 (85.6%) | 101 (6.4%) |
| 35 to 44 Years | 2,851 (81.8%) | 80 (2.8%) |
| 45 to 54 Years | 2,926 (82.9%) | 111 (3.8%) |
| 55 to 59 Years | 1,381 (77.3%) | 139 (10.1%) |
| 60 to 64 Years | 1,450 (71.3%) | 57 (3.9%) |
| 65 to 74 Years | 1,234 (33.4%) | 5 (0.4%) |
| 75 Years and over | 257 (11.9%) | 0 (0.0%) |
| Total | 15,156 (61.5%) | 849 (5.6%) |
Employment Status by Educational Attainment in Northampton
According to labor force statistics for Northampton, 80.5% of individuals (11,620) out of the total population between 25 and 64 years of age (14,435) are in the labor force, with 5.2% or 604 of them being unemployed. The group with the highest labor force participation rate are those with the educational attainment of bachelor's degree or higher, with 89.7% or 8,237 individuals in the labor force. Within the labor force, individuals with high school diploma education have the highest percentage of unemployment, with 11.8% or 129 of them being unemployed.
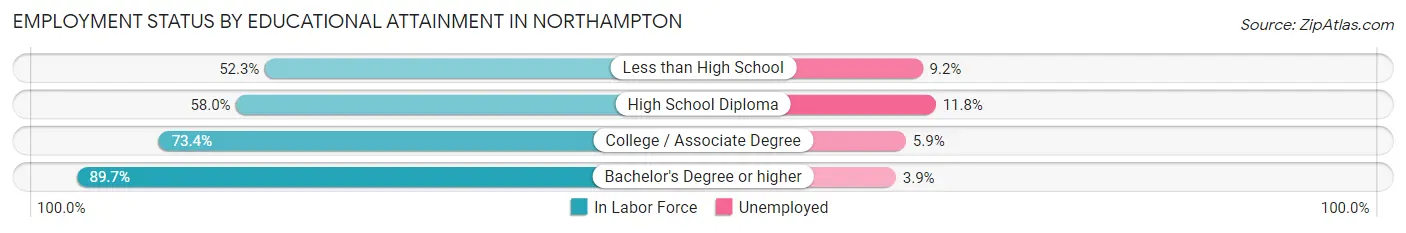
| Educational Attainment | In Labor Force | Unemployed |
| Less than High School | 448 (52.3%) | 79 (9.2%) |
| High School Diploma | 1,090 (58.0%) | 222 (11.8%) |
| College / Associate Degree | 1,847 (73.4%) | 148 (5.9%) |
| Bachelor's Degree or higher | 8,237 (89.7%) | 358 (3.9%) |
| Total | 11,620 (80.5%) | 751 (5.2%) |
Employment Occupations by Sex in Northampton
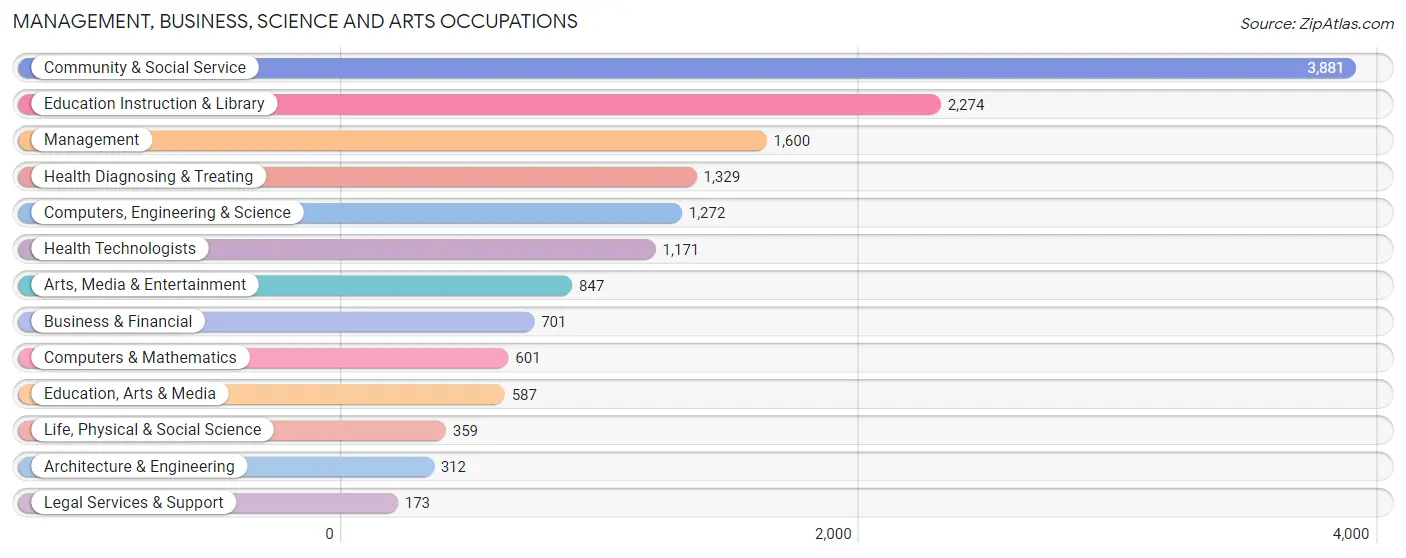
Management, Business, Science and Arts Occupations
The most common Management, Business, Science and Arts occupations in Northampton are Community & Social Service (3,881 | 27.1%), Education Instruction & Library (2,274 | 15.9%), Management (1,600 | 11.2%), Health Diagnosing & Treating (1,329 | 9.3%), and Computers, Engineering & Science (1,272 | 8.9%).
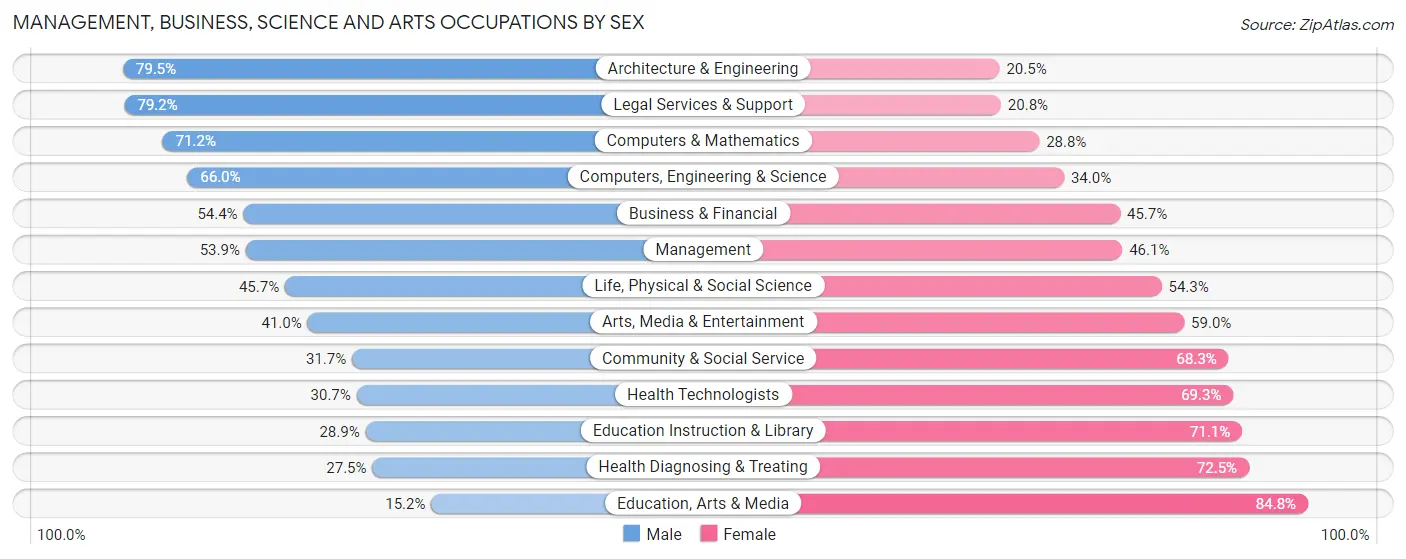
Management, Business, Science and Arts Occupations by Sex
Within the Management, Business, Science and Arts occupations in Northampton, the most male-oriented occupations are Architecture & Engineering (79.5%), Legal Services & Support (79.2%), and Computers & Mathematics (71.2%), while the most female-oriented occupations are Education, Arts & Media (84.8%), Health Diagnosing & Treating (72.5%), and Education Instruction & Library (71.1%).
| Occupation | Male | Female |
| Management | 862 (53.9%) | 738 (46.1%) |
| Business & Financial | 381 (54.3%) | 320 (45.7%) |
| Computers, Engineering & Science | 840 (66.0%) | 432 (34.0%) |
| Computers & Mathematics | 428 (71.2%) | 173 (28.8%) |
| Architecture & Engineering | 248 (79.5%) | 64 (20.5%) |
| Life, Physical & Social Science | 164 (45.7%) | 195 (54.3%) |
| Community & Social Service | 1,230 (31.7%) | 2,651 (68.3%) |
| Education, Arts & Media | 89 (15.2%) | 498 (84.8%) |
| Legal Services & Support | 137 (79.2%) | 36 (20.8%) |
| Education Instruction & Library | 657 (28.9%) | 1,617 (71.1%) |
| Arts, Media & Entertainment | 347 (41.0%) | 500 (59.0%) |
| Health Diagnosing & Treating | 365 (27.5%) | 964 (72.5%) |
| Health Technologists | 360 (30.7%) | 811 (69.3%) |
| Total (Category) | 3,678 (41.9%) | 5,105 (58.1%) |
| Total (Overall) | 6,378 (44.6%) | 7,926 (55.4%) |
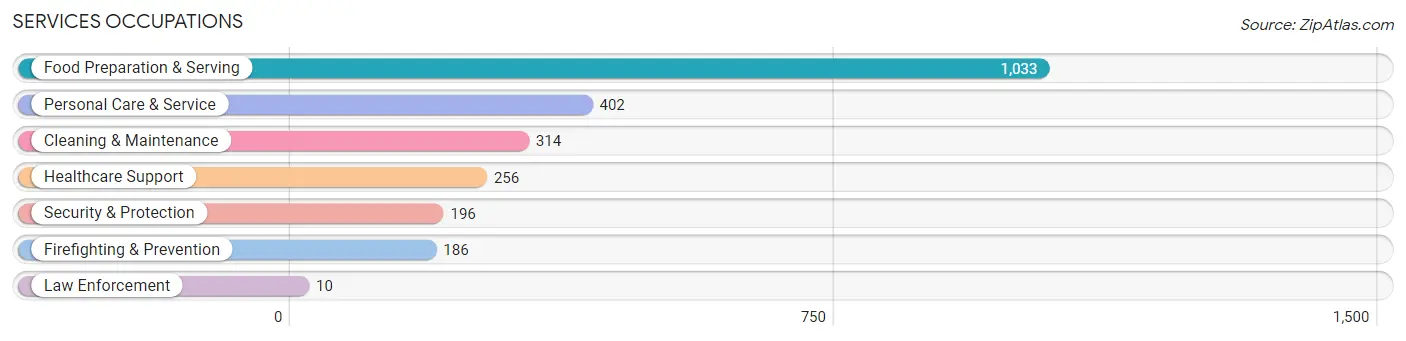
Services Occupations
The most common Services occupations in Northampton are Food Preparation & Serving (1,033 | 7.2%), Personal Care & Service (402 | 2.8%), Cleaning & Maintenance (314 | 2.2%), Healthcare Support (256 | 1.8%), and Security & Protection (196 | 1.4%).
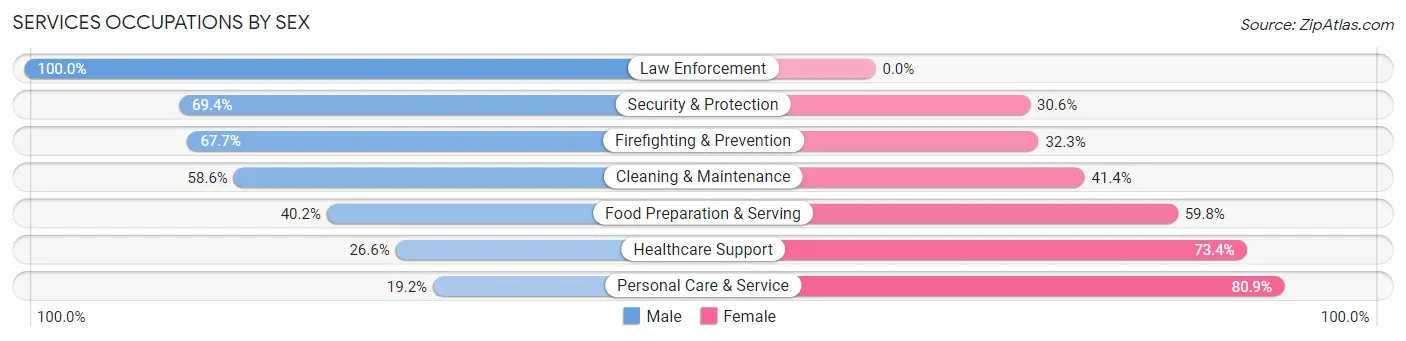
Services Occupations by Sex
Within the Services occupations in Northampton, the most male-oriented occupations are Law Enforcement (100.0%), Security & Protection (69.4%), and Firefighting & Prevention (67.7%), while the most female-oriented occupations are Personal Care & Service (80.8%), Healthcare Support (73.4%), and Food Preparation & Serving (59.8%).
| Occupation | Male | Female |
| Healthcare Support | 68 (26.6%) | 188 (73.4%) |
| Security & Protection | 136 (69.4%) | 60 (30.6%) |
| Firefighting & Prevention | 126 (67.7%) | 60 (32.3%) |
| Law Enforcement | 10 (100.0%) | 0 (0.0%) |
| Food Preparation & Serving | 415 (40.2%) | 618 (59.8%) |
| Cleaning & Maintenance | 184 (58.6%) | 130 (41.4%) |
| Personal Care & Service | 77 (19.2%) | 325 (80.8%) |
| Total (Category) | 880 (40.0%) | 1,321 (60.0%) |
| Total (Overall) | 6,378 (44.6%) | 7,926 (55.4%) |
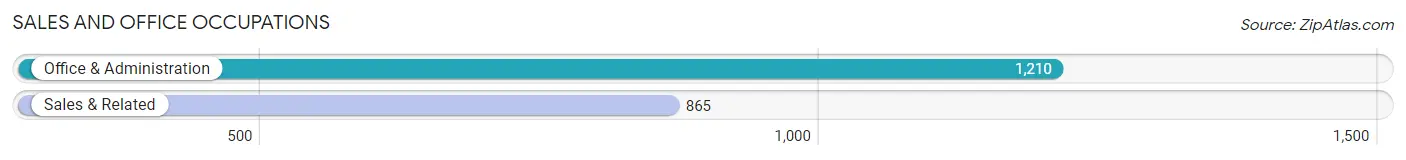
Sales and Office Occupations
The most common Sales and Office occupations in Northampton are Office & Administration (1,210 | 8.5%), and Sales & Related (865 | 6.0%).
Sales and Office Occupations by Sex
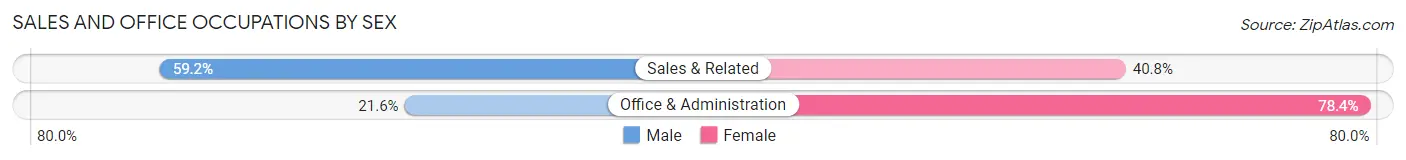
| Occupation | Male | Female |
| Sales & Related | 512 (59.2%) | 353 (40.8%) |
| Office & Administration | 261 (21.6%) | 949 (78.4%) |
| Total (Category) | 773 (37.2%) | 1,302 (62.7%) |
| Total (Overall) | 6,378 (44.6%) | 7,926 (55.4%) |
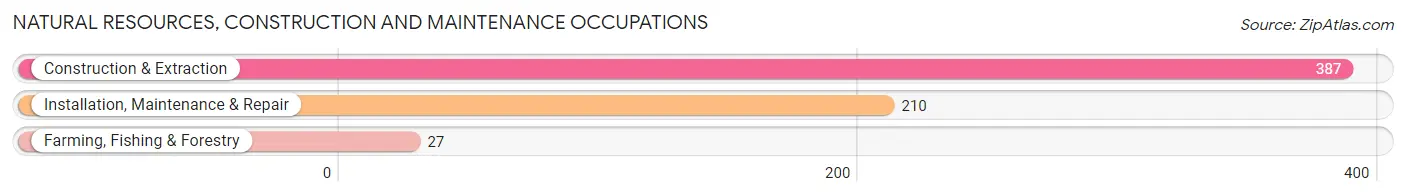
Natural Resources, Construction and Maintenance Occupations
The most common Natural Resources, Construction and Maintenance occupations in Northampton are Construction & Extraction (387 | 2.7%), Installation, Maintenance & Repair (210 | 1.5%), and Farming, Fishing & Forestry (27 | 0.2%).
Natural Resources, Construction and Maintenance Occupations by Sex
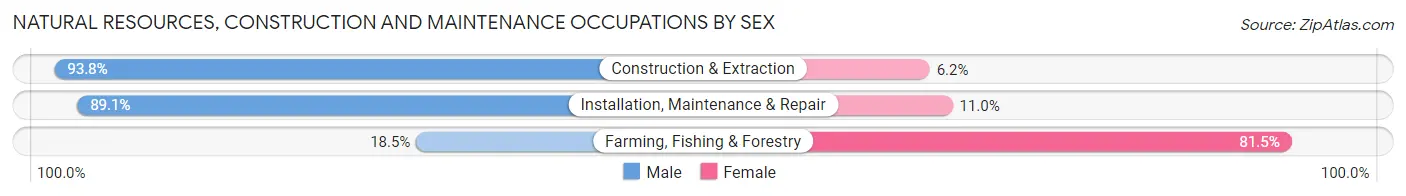
| Occupation | Male | Female |
| Farming, Fishing & Forestry | 5 (18.5%) | 22 (81.5%) |
| Construction & Extraction | 363 (93.8%) | 24 (6.2%) |
| Installation, Maintenance & Repair | 187 (89.0%) | 23 (11.0%) |
| Total (Category) | 555 (88.9%) | 69 (11.1%) |
| Total (Overall) | 6,378 (44.6%) | 7,926 (55.4%) |
Production, Transportation and Moving Occupations
The most common Production, Transportation and Moving occupations in Northampton are Production (325 | 2.3%), Transportation (160 | 1.1%), and Material Moving (136 | 0.9%).
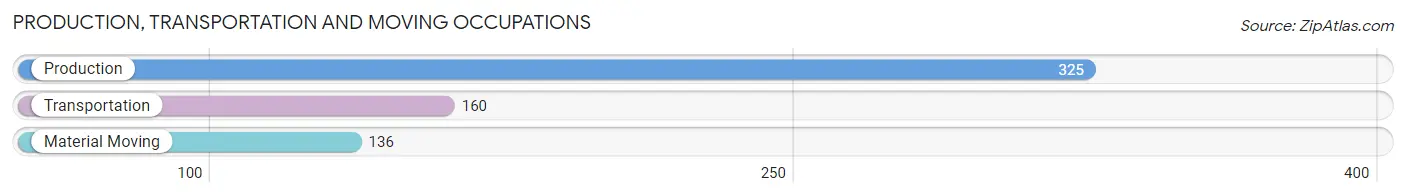
Production, Transportation and Moving Occupations by Sex
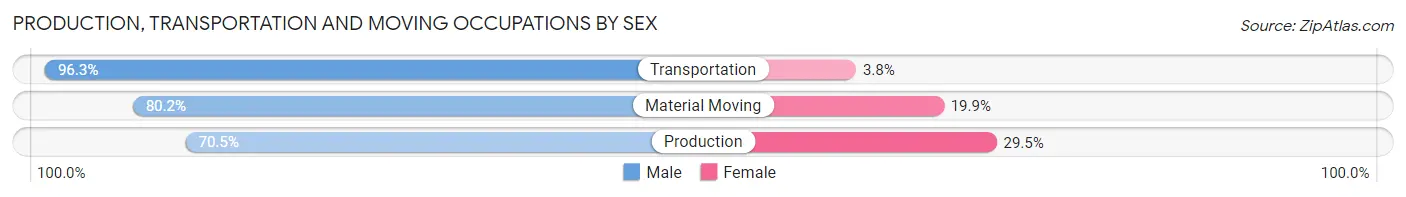
| Occupation | Male | Female |
| Production | 229 (70.5%) | 96 (29.5%) |
| Transportation | 154 (96.3%) | 6 (3.7%) |
| Material Moving | 109 (80.1%) | 27 (19.9%) |
| Total (Category) | 492 (79.2%) | 129 (20.8%) |
| Total (Overall) | 6,378 (44.6%) | 7,926 (55.4%) |
Employment Industries by Sex in Northampton
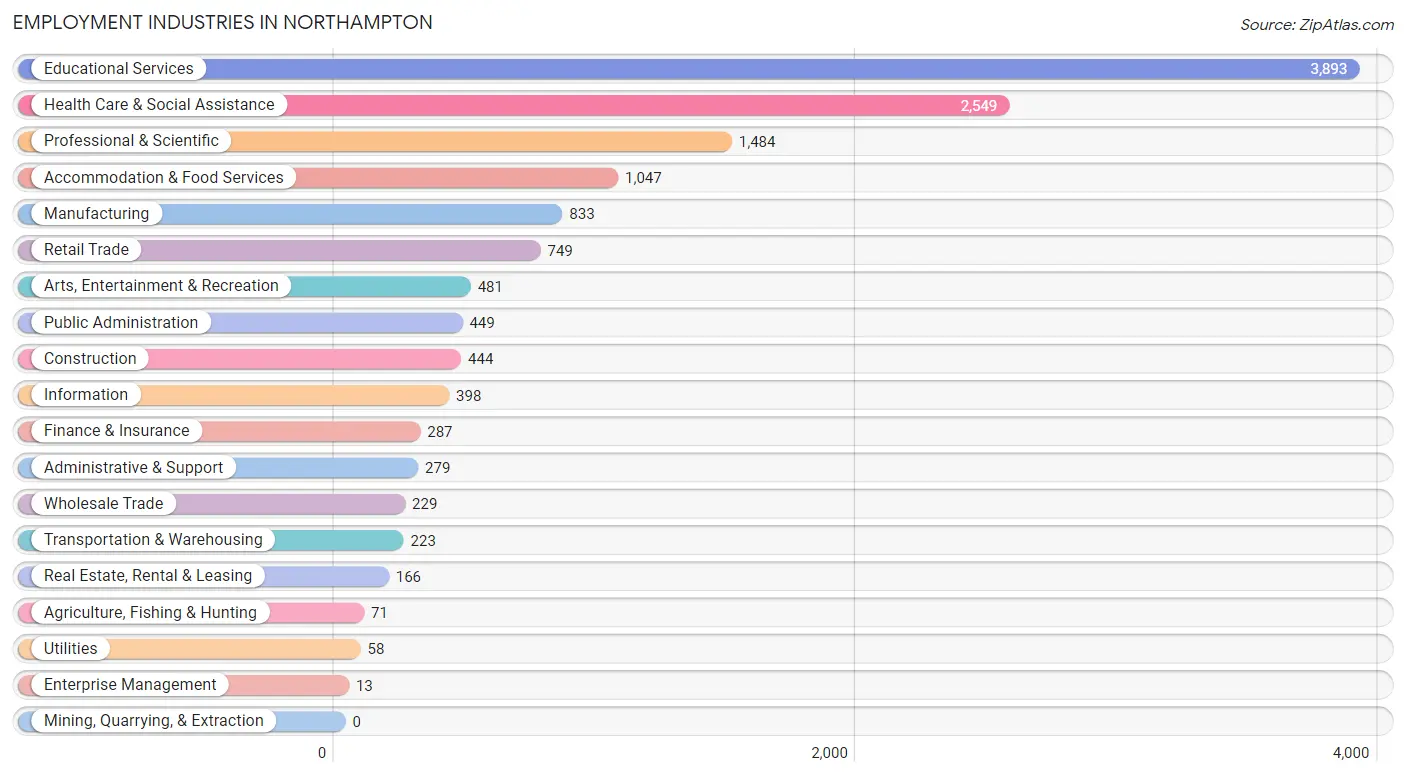
Employment Industries in Northampton
The major employment industries in Northampton include Educational Services (3,893 | 27.2%), Health Care & Social Assistance (2,549 | 17.8%), Professional & Scientific (1,484 | 10.4%), Accommodation & Food Services (1,047 | 7.3%), and Manufacturing (833 | 5.8%).
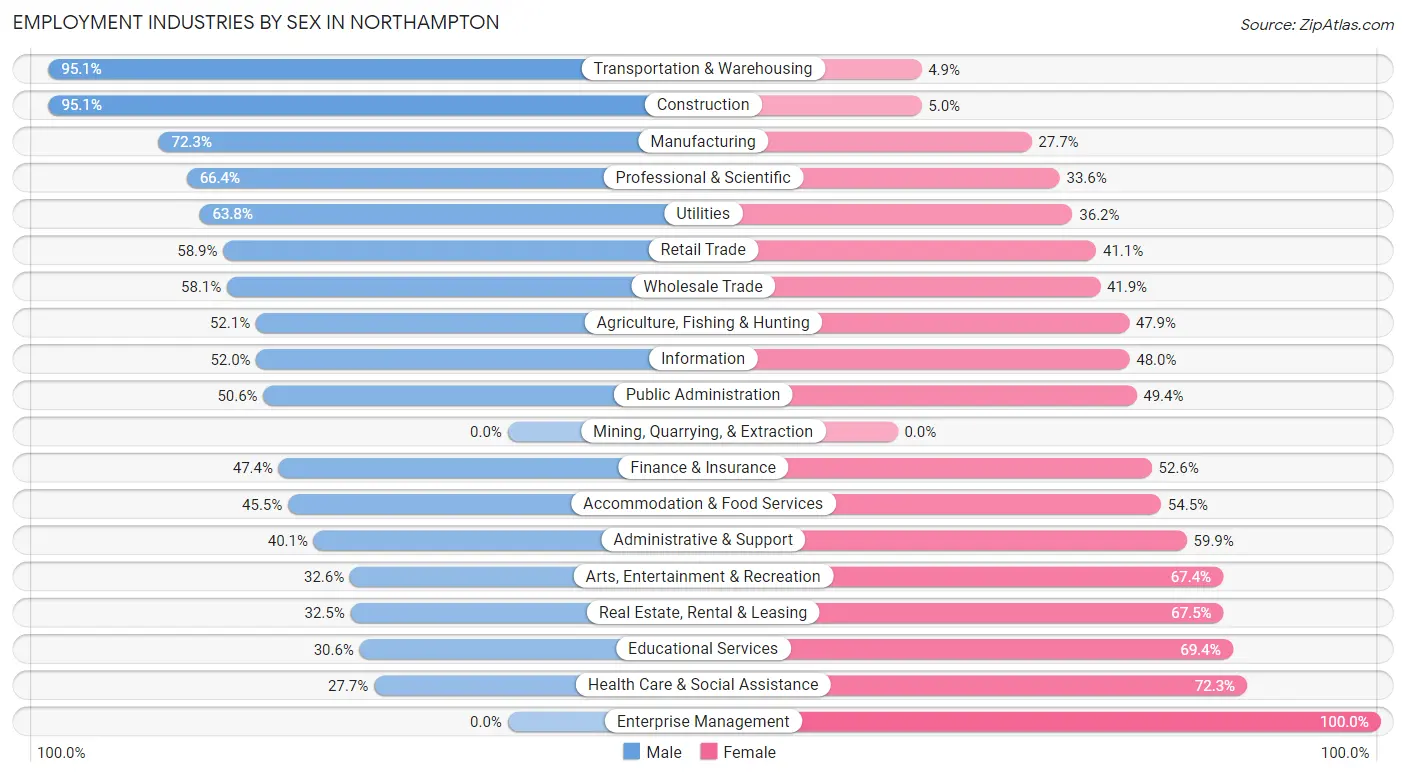
Employment Industries by Sex in Northampton
The Northampton industries that see more men than women are Transportation & Warehousing (95.1%), Construction (95.1%), and Manufacturing (72.3%), whereas the industries that tend to have a higher number of women are Enterprise Management (100.0%), Health Care & Social Assistance (72.3%), and Educational Services (69.4%).
| Industry | Male | Female |
| Agriculture, Fishing & Hunting | 37 (52.1%) | 34 (47.9%) |
| Mining, Quarrying, & Extraction | 0 (0.0%) | 0 (0.0%) |
| Construction | 422 (95.1%) | 22 (5.0%) |
| Manufacturing | 602 (72.3%) | 231 (27.7%) |
| Wholesale Trade | 133 (58.1%) | 96 (41.9%) |
| Retail Trade | 441 (58.9%) | 308 (41.1%) |
| Transportation & Warehousing | 212 (95.1%) | 11 (4.9%) |
| Utilities | 37 (63.8%) | 21 (36.2%) |
| Information | 207 (52.0%) | 191 (48.0%) |
| Finance & Insurance | 136 (47.4%) | 151 (52.6%) |
| Real Estate, Rental & Leasing | 54 (32.5%) | 112 (67.5%) |
| Professional & Scientific | 986 (66.4%) | 498 (33.6%) |
| Enterprise Management | 0 (0.0%) | 13 (100.0%) |
| Administrative & Support | 112 (40.1%) | 167 (59.9%) |
| Educational Services | 1,193 (30.6%) | 2,700 (69.4%) |
| Health Care & Social Assistance | 705 (27.7%) | 1,844 (72.3%) |
| Arts, Entertainment & Recreation | 157 (32.6%) | 324 (67.4%) |
| Accommodation & Food Services | 476 (45.5%) | 571 (54.5%) |
| Public Administration | 227 (50.6%) | 222 (49.4%) |
| Total | 6,378 (44.6%) | 7,926 (55.4%) |
Education in Northampton
School Enrollment in Northampton
The most common levels of schooling among the 7,892 students in Northampton are college / undergraduate (3,333 | 42.2%), middle school (1,143 | 14.5%), and high school (1,046 | 13.3%).
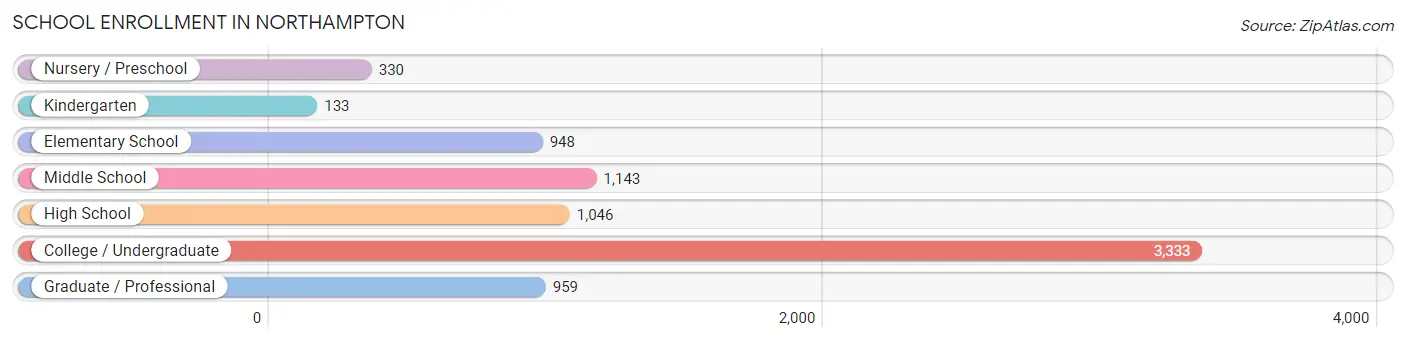
| School Level | # Students | % Students |
| Nursery / Preschool | 330 | 4.2% |
| Kindergarten | 133 | 1.7% |
| Elementary School | 948 | 12.0% |
| Middle School | 1,143 | 14.5% |
| High School | 1,046 | 13.3% |
| College / Undergraduate | 3,333 | 42.2% |
| Graduate / Professional | 959 | 12.1% |
| Total | 7,892 | 100.0% |
School Enrollment by Age by Funding Source in Northampton
Out of a total of 7,892 students who are enrolled in schools in Northampton, 3,078 (39.0%) attend a private institution, while the remaining 4,814 (61.0%) are enrolled in public schools. The age group of 3 to 4 year olds has the highest likelihood of being enrolled in private schools, with 185 (75.2% in the age bracket) enrolled. Conversely, the age group of 15 to 17 year olds has the lowest likelihood of being enrolled in a private school, with 845 (90.9% in the age bracket) attending a public institution.
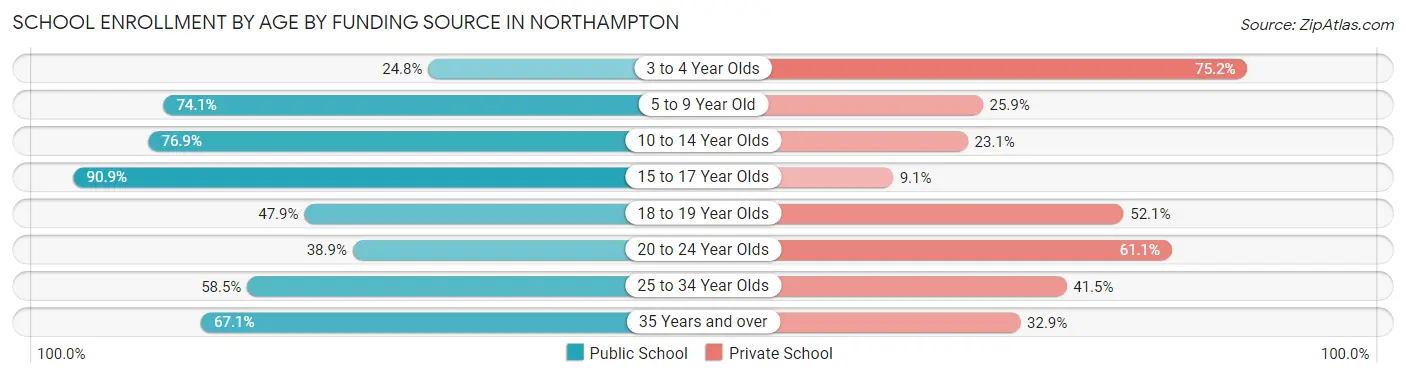
| Age Bracket | Public School | Private School |
| 3 to 4 Year Olds | 61 (24.8%) | 185 (75.2%) |
| 5 to 9 Year Old | 748 (74.1%) | 261 (25.9%) |
| 10 to 14 Year Olds | 1,066 (76.9%) | 320 (23.1%) |
| 15 to 17 Year Olds | 845 (90.9%) | 85 (9.1%) |
| 18 to 19 Year Olds | 642 (47.9%) | 698 (52.1%) |
| 20 to 24 Year Olds | 668 (38.9%) | 1,050 (61.1%) |
| 25 to 34 Year Olds | 449 (58.5%) | 318 (41.5%) |
| 35 Years and over | 333 (67.1%) | 163 (32.9%) |
| Total | 4,814 (61.0%) | 3,078 (39.0%) |
Educational Attainment by Field of Study in Northampton
Social sciences (2,182 | 15.1%), literature & languages (2,115 | 14.7%), liberal arts & history (1,456 | 10.1%), visual & performing arts (1,429 | 9.9%), and bio, nature & agricultural (1,009 | 7.0%) are the most common fields of study among 14,431 individuals in Northampton who have obtained a bachelor's degree or higher.
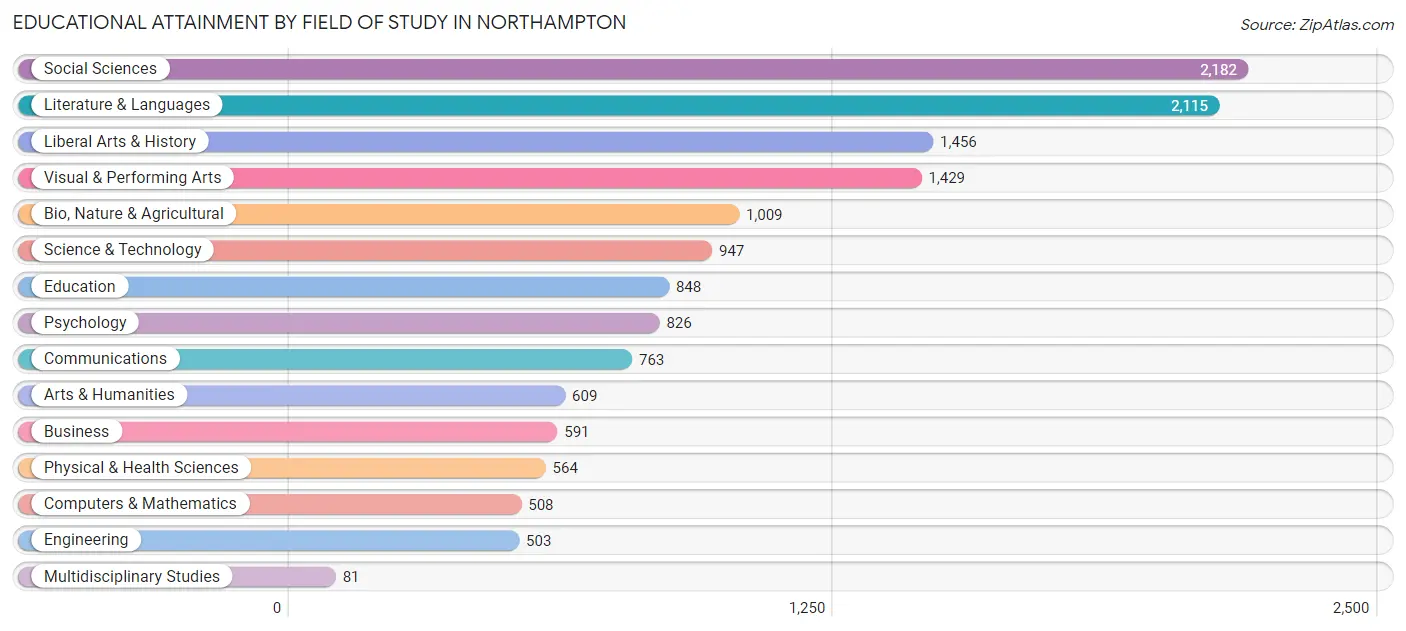
| Field of Study | # Graduates | % Graduates |
| Computers & Mathematics | 508 | 3.5% |
| Bio, Nature & Agricultural | 1,009 | 7.0% |
| Physical & Health Sciences | 564 | 3.9% |
| Psychology | 826 | 5.7% |
| Social Sciences | 2,182 | 15.1% |
| Engineering | 503 | 3.5% |
| Multidisciplinary Studies | 81 | 0.6% |
| Science & Technology | 947 | 6.6% |
| Business | 591 | 4.1% |
| Education | 848 | 5.9% |
| Literature & Languages | 2,115 | 14.7% |
| Liberal Arts & History | 1,456 | 10.1% |
| Visual & Performing Arts | 1,429 | 9.9% |
| Communications | 763 | 5.3% |
| Arts & Humanities | 609 | 4.2% |
| Total | 14,431 | 100.0% |
Transportation & Commute in Northampton
Vehicle Availability by Sex in Northampton
The most prevalent vehicle ownership categories in Northampton are males with 2 vehicles (3,075, accounting for 49.7%) and females with 2 vehicles (3,172, making up 45.0%).
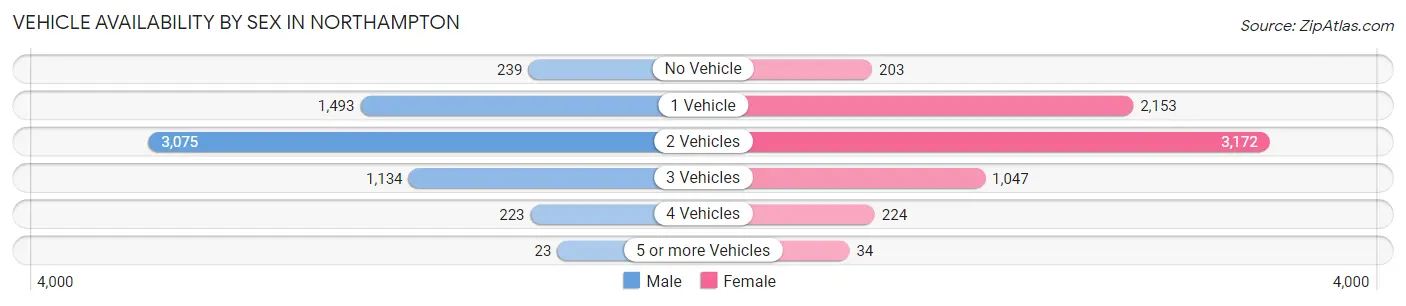
| Vehicles Available | Male | Female |
| No Vehicle | 239 (3.9%) | 203 (3.0%) |
| 1 Vehicle | 1,493 (24.1%) | 2,153 (31.5%) |
| 2 Vehicles | 3,075 (49.7%) | 3,172 (46.4%) |
| 3 Vehicles | 1,134 (18.3%) | 1,047 (15.3%) |
| 4 Vehicles | 223 (3.6%) | 224 (3.3%) |
| 5 or more Vehicles | 23 (0.4%) | 34 (0.5%) |
| Total | 6,187 (100.0%) | 6,833 (100.0%) |
Commute Time in Northampton
The most frequently occuring commute durations in Northampton are 10 to 14 minutes (1,809 commuters, 16.2%), 15 to 19 minutes (1,675 commuters, 15.0%), and 20 to 24 minutes (1,510 commuters, 13.5%).
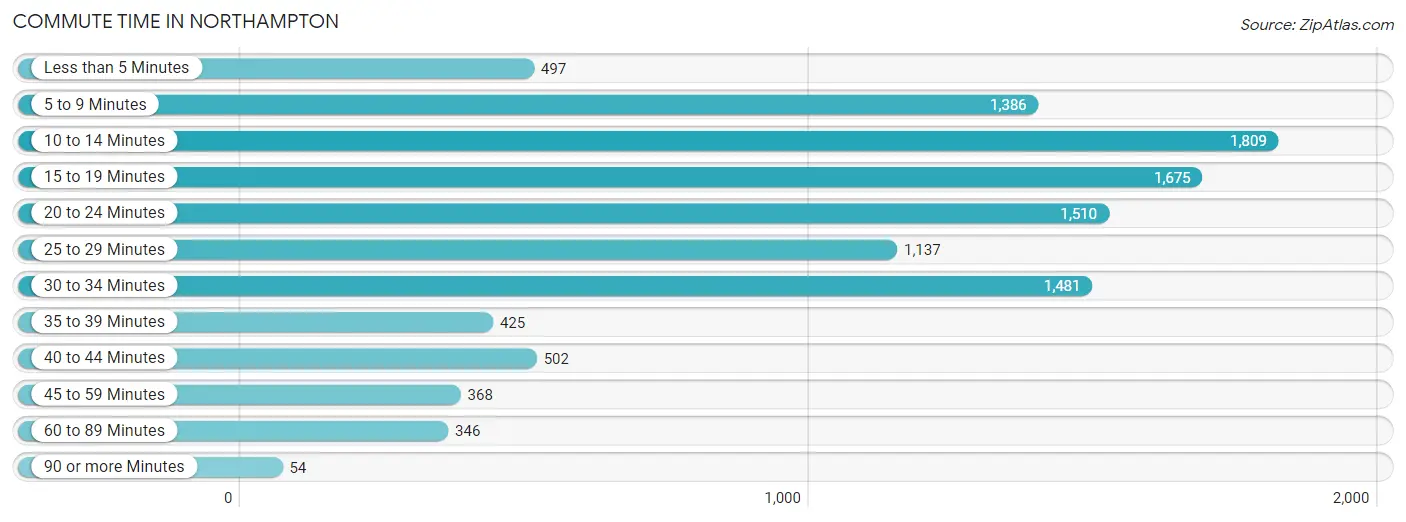
| Commute Time | # Commuters | % Commuters |
| Less than 5 Minutes | 497 | 4.4% |
| 5 to 9 Minutes | 1,386 | 12.4% |
| 10 to 14 Minutes | 1,809 | 16.2% |
| 15 to 19 Minutes | 1,675 | 15.0% |
| 20 to 24 Minutes | 1,510 | 13.5% |
| 25 to 29 Minutes | 1,137 | 10.2% |
| 30 to 34 Minutes | 1,481 | 13.2% |
| 35 to 39 Minutes | 425 | 3.8% |
| 40 to 44 Minutes | 502 | 4.5% |
| 45 to 59 Minutes | 368 | 3.3% |
| 60 to 89 Minutes | 346 | 3.1% |
| 90 or more Minutes | 54 | 0.5% |
Commute Time by Sex in Northampton
The most common commute times in Northampton are 10 to 14 minutes (799 commuters, 15.6%) for males and 15 to 19 minutes (1,098 commuters, 18.1%) for females.
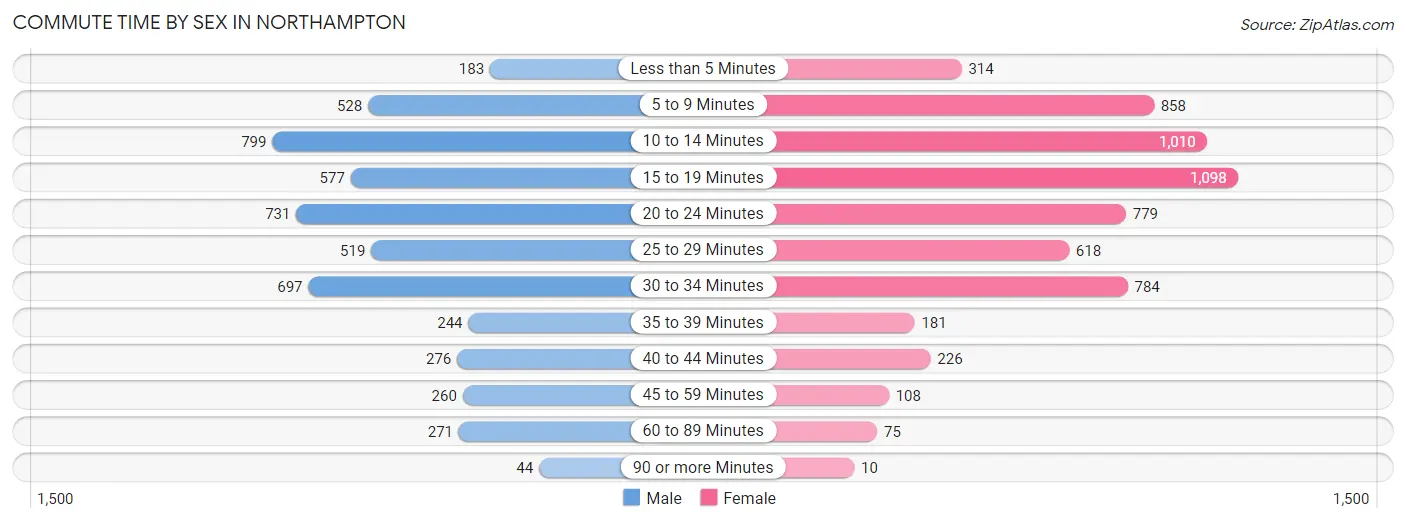
| Commute Time | Male | Female |
| Less than 5 Minutes | 183 (3.6%) | 314 (5.2%) |
| 5 to 9 Minutes | 528 (10.3%) | 858 (14.2%) |
| 10 to 14 Minutes | 799 (15.6%) | 1,010 (16.7%) |
| 15 to 19 Minutes | 577 (11.3%) | 1,098 (18.1%) |
| 20 to 24 Minutes | 731 (14.2%) | 779 (12.9%) |
| 25 to 29 Minutes | 519 (10.1%) | 618 (10.2%) |
| 30 to 34 Minutes | 697 (13.6%) | 784 (12.9%) |
| 35 to 39 Minutes | 244 (4.8%) | 181 (3.0%) |
| 40 to 44 Minutes | 276 (5.4%) | 226 (3.7%) |
| 45 to 59 Minutes | 260 (5.1%) | 108 (1.8%) |
| 60 to 89 Minutes | 271 (5.3%) | 75 (1.2%) |
| 90 or more Minutes | 44 (0.9%) | 10 (0.2%) |
Time of Departure to Work by Sex in Northampton
The most frequent times of departure to work in Northampton are 7:30 AM to 7:59 AM (866, 16.9%) for males and 8:00 AM to 8:29 AM (1,015, 16.8%) for females.
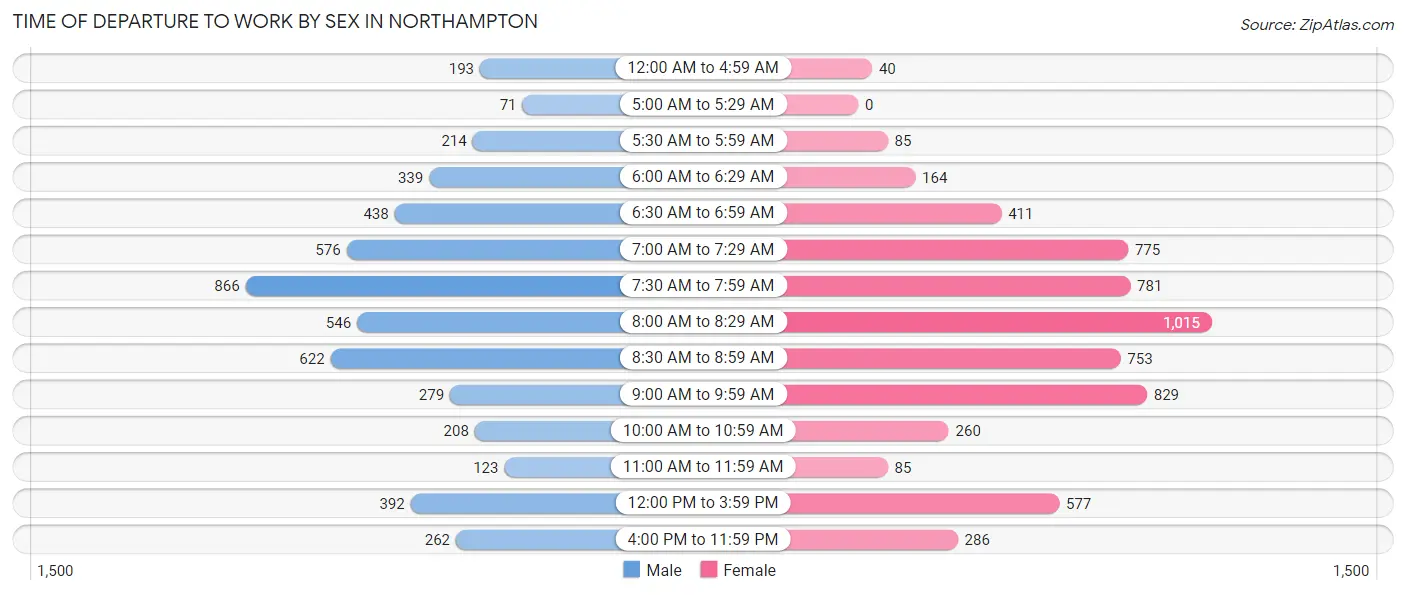
| Time of Departure | Male | Female |
| 12:00 AM to 4:59 AM | 193 (3.8%) | 40 (0.7%) |
| 5:00 AM to 5:29 AM | 71 (1.4%) | 0 (0.0%) |
| 5:30 AM to 5:59 AM | 214 (4.2%) | 85 (1.4%) |
| 6:00 AM to 6:29 AM | 339 (6.6%) | 164 (2.7%) |
| 6:30 AM to 6:59 AM | 438 (8.5%) | 411 (6.8%) |
| 7:00 AM to 7:29 AM | 576 (11.2%) | 775 (12.8%) |
| 7:30 AM to 7:59 AM | 866 (16.9%) | 781 (12.9%) |
| 8:00 AM to 8:29 AM | 546 (10.6%) | 1,015 (16.8%) |
| 8:30 AM to 8:59 AM | 622 (12.1%) | 753 (12.4%) |
| 9:00 AM to 9:59 AM | 279 (5.4%) | 829 (13.7%) |
| 10:00 AM to 10:59 AM | 208 (4.1%) | 260 (4.3%) |
| 11:00 AM to 11:59 AM | 123 (2.4%) | 85 (1.4%) |
| 12:00 PM to 3:59 PM | 392 (7.6%) | 577 (9.5%) |
| 4:00 PM to 11:59 PM | 262 (5.1%) | 286 (4.7%) |
| Total | 5,129 (100.0%) | 6,061 (100.0%) |
Housing Occupancy in Northampton
Occupancy by Ownership in Northampton
Of the total 12,345 dwellings in Northampton, owner-occupied units account for 7,205 (58.4%), while renter-occupied units make up 5,140 (41.6%).
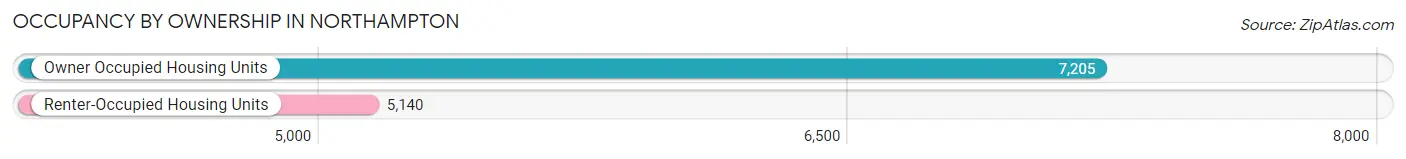
| Occupancy | # Housing Units | % Housing Units |
| Owner Occupied Housing Units | 7,205 | 58.4% |
| Renter-Occupied Housing Units | 5,140 | 41.6% |
| Total Occupied Housing Units | 12,345 | 100.0% |
Occupancy by Household Size in Northampton
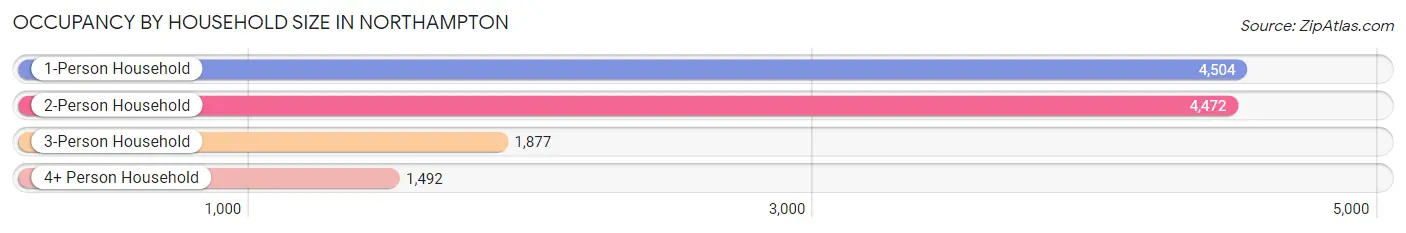
| Household Size | # Housing Units | % Housing Units |
| 1-Person Household | 4,504 | 36.5% |
| 2-Person Household | 4,472 | 36.2% |
| 3-Person Household | 1,877 | 15.2% |
| 4+ Person Household | 1,492 | 12.1% |
| Total Housing Units | 12,345 | 100.0% |
Occupancy by Ownership by Household Size in Northampton
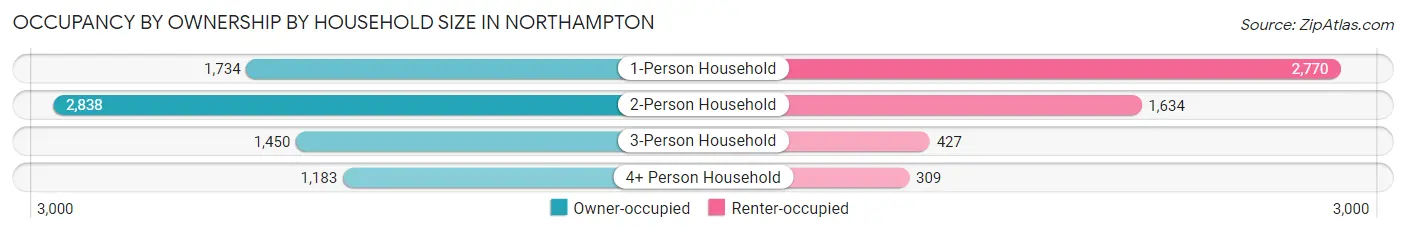
| Household Size | Owner-occupied | Renter-occupied |
| 1-Person Household | 1,734 (38.5%) | 2,770 (61.5%) |
| 2-Person Household | 2,838 (63.5%) | 1,634 (36.5%) |
| 3-Person Household | 1,450 (77.2%) | 427 (22.8%) |
| 4+ Person Household | 1,183 (79.3%) | 309 (20.7%) |
| Total Housing Units | 7,205 (58.4%) | 5,140 (41.6%) |
Occupancy by Educational Attainment in Northampton
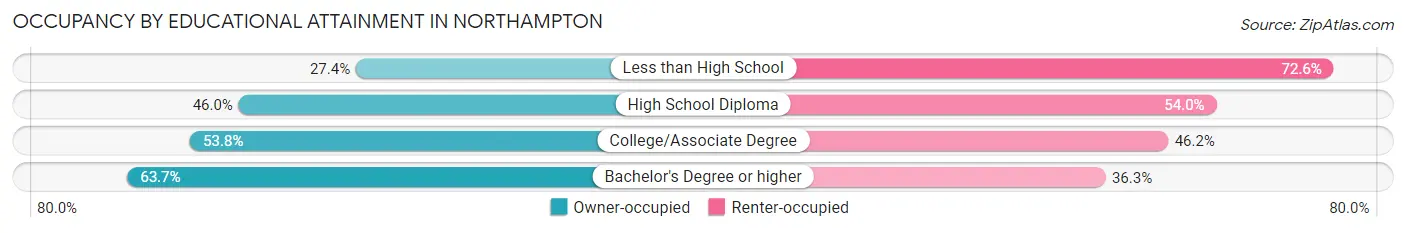
| Household Size | Owner-occupied | Renter-occupied |
| Less than High School | 149 (27.4%) | 394 (72.6%) |
| High School Diploma | 634 (46.0%) | 743 (54.0%) |
| College/Associate Degree | 1,186 (53.8%) | 1,020 (46.2%) |
| Bachelor's Degree or higher | 5,236 (63.7%) | 2,983 (36.3%) |
Occupancy by Age of Householder in Northampton
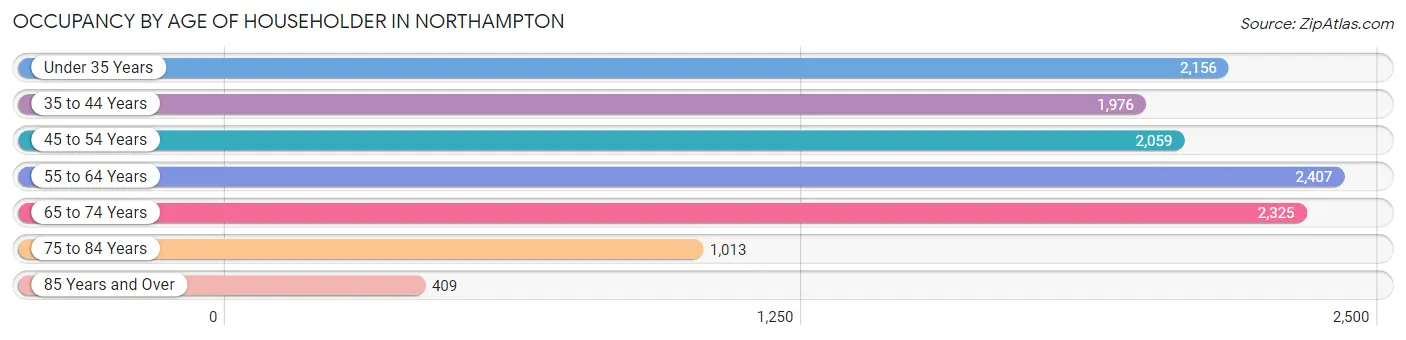
| Age Bracket | # Households | % Households |
| Under 35 Years | 2,156 | 17.5% |
| 35 to 44 Years | 1,976 | 16.0% |
| 45 to 54 Years | 2,059 | 16.7% |
| 55 to 64 Years | 2,407 | 19.5% |
| 65 to 74 Years | 2,325 | 18.8% |
| 75 to 84 Years | 1,013 | 8.2% |
| 85 Years and Over | 409 | 3.3% |
| Total | 12,345 | 100.0% |
Housing Finances in Northampton
Median Income by Occupancy in Northampton
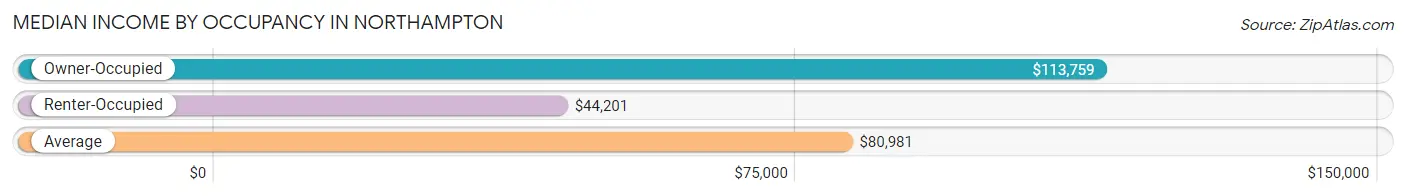
| Occupancy Type | # Households | Median Income |
| Owner-Occupied | 7,205 (58.4%) | $113,759 |
| Renter-Occupied | 5,140 (41.6%) | $44,201 |
| Average | 12,345 (100.0%) | $80,981 |
Occupancy by Householder Income Bracket in Northampton
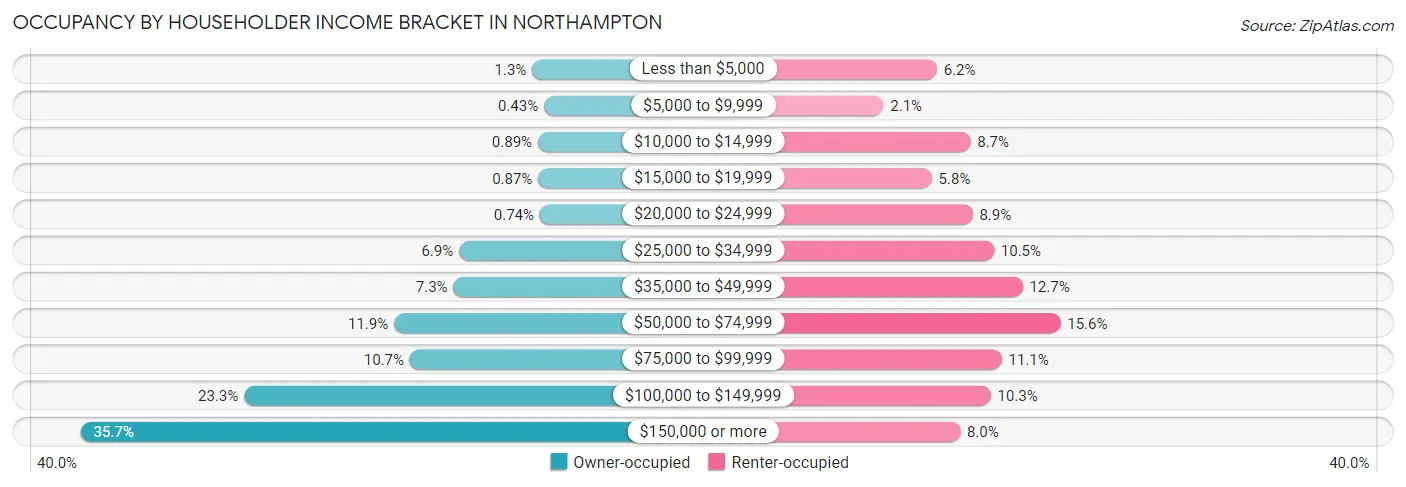
| Income Bracket | Owner-occupied | Renter-occupied |
| Less than $5,000 | 96 (1.3%) | 318 (6.2%) |
| $5,000 to $9,999 | 31 (0.4%) | 109 (2.1%) |
| $10,000 to $14,999 | 64 (0.9%) | 449 (8.7%) |
| $15,000 to $19,999 | 63 (0.9%) | 298 (5.8%) |
| $20,000 to $24,999 | 53 (0.7%) | 458 (8.9%) |
| $25,000 to $34,999 | 497 (6.9%) | 542 (10.5%) |
| $35,000 to $49,999 | 528 (7.3%) | 654 (12.7%) |
| $50,000 to $74,999 | 854 (11.8%) | 802 (15.6%) |
| $75,000 to $99,999 | 767 (10.6%) | 572 (11.1%) |
| $100,000 to $149,999 | 1,677 (23.3%) | 529 (10.3%) |
| $150,000 or more | 2,575 (35.7%) | 409 (8.0%) |
| Total | 7,205 (100.0%) | 5,140 (100.0%) |
Monthly Housing Cost Tiers in Northampton
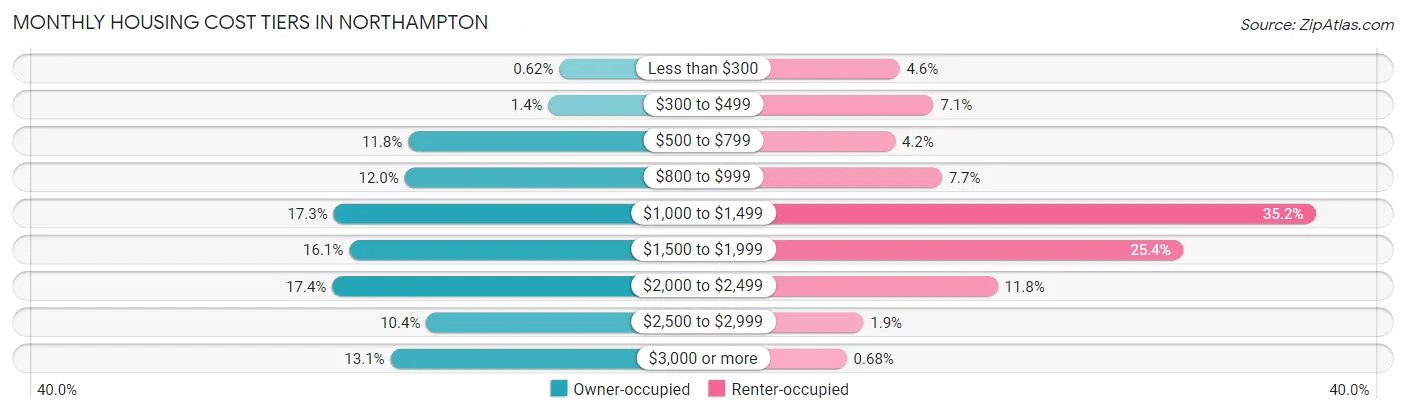
| Monthly Cost | Owner-occupied | Renter-occupied |
| Less than $300 | 45 (0.6%) | 235 (4.6%) |
| $300 to $499 | 102 (1.4%) | 364 (7.1%) |
| $500 to $799 | 847 (11.8%) | 218 (4.2%) |
| $800 to $999 | 866 (12.0%) | 395 (7.7%) |
| $1,000 to $1,499 | 1,243 (17.2%) | 1,808 (35.2%) |
| $1,500 to $1,999 | 1,160 (16.1%) | 1,306 (25.4%) |
| $2,000 to $2,499 | 1,250 (17.3%) | 606 (11.8%) |
| $2,500 to $2,999 | 751 (10.4%) | 98 (1.9%) |
| $3,000 or more | 941 (13.1%) | 35 (0.7%) |
| Total | 7,205 (100.0%) | 5,140 (100.0%) |
Physical Housing Characteristics in Northampton
Housing Structures in Northampton
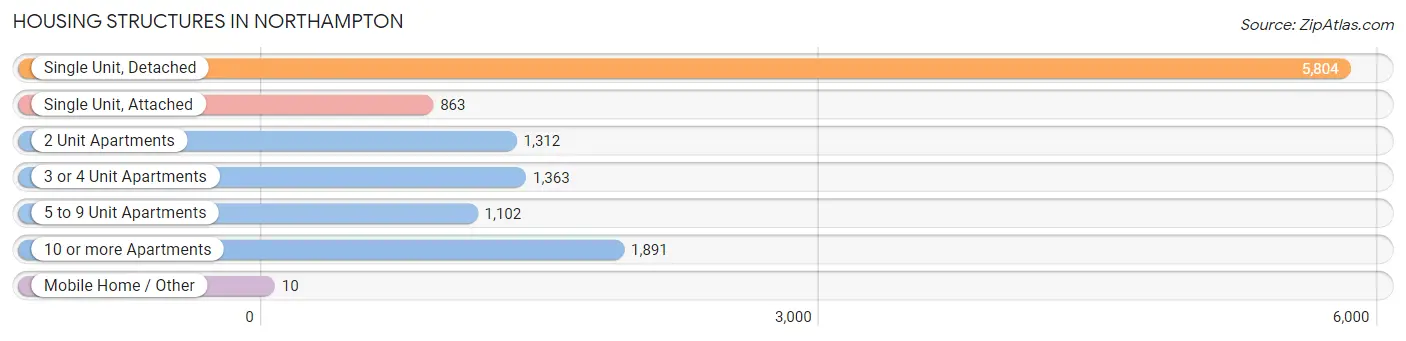
| Structure Type | # Housing Units | % Housing Units |
| Single Unit, Detached | 5,804 | 47.0% |
| Single Unit, Attached | 863 | 7.0% |
| 2 Unit Apartments | 1,312 | 10.6% |
| 3 or 4 Unit Apartments | 1,363 | 11.0% |
| 5 to 9 Unit Apartments | 1,102 | 8.9% |
| 10 or more Apartments | 1,891 | 15.3% |
| Mobile Home / Other | 10 | 0.1% |
| Total | 12,345 | 100.0% |
Housing Structures by Occupancy in Northampton
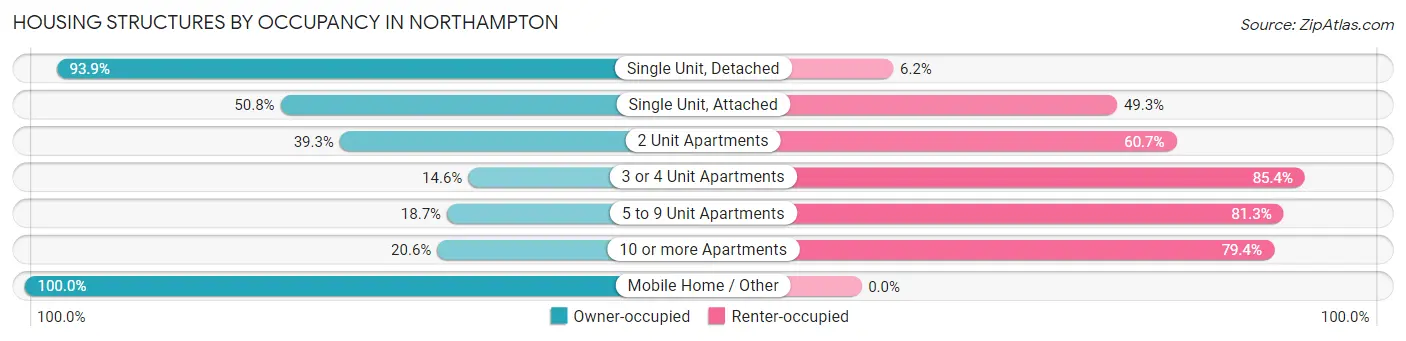
| Structure Type | Owner-occupied | Renter-occupied |
| Single Unit, Detached | 5,447 (93.9%) | 357 (6.1%) |
| Single Unit, Attached | 438 (50.7%) | 425 (49.2%) |
| 2 Unit Apartments | 516 (39.3%) | 796 (60.7%) |
| 3 or 4 Unit Apartments | 199 (14.6%) | 1,164 (85.4%) |
| 5 to 9 Unit Apartments | 206 (18.7%) | 896 (81.3%) |
| 10 or more Apartments | 389 (20.6%) | 1,502 (79.4%) |
| Mobile Home / Other | 10 (100.0%) | 0 (0.0%) |
| Total | 7,205 (58.4%) | 5,140 (41.6%) |
Housing Structures by Number of Rooms in Northampton
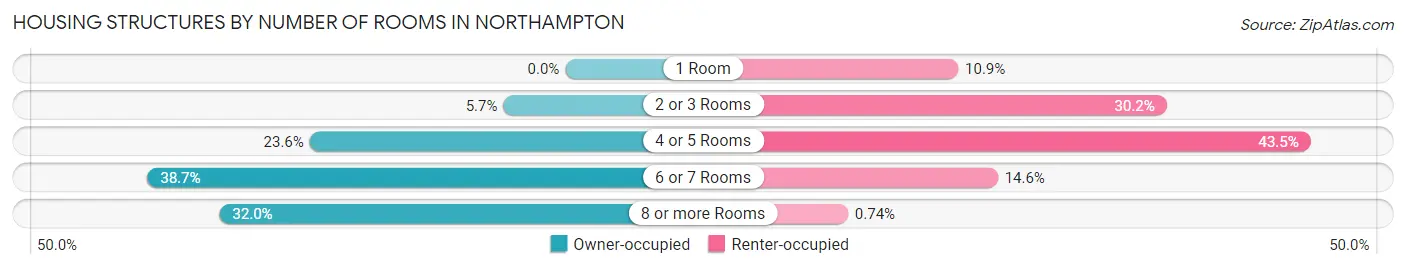
| Number of Rooms | Owner-occupied | Renter-occupied |
| 1 Room | 0 (0.0%) | 562 (10.9%) |
| 2 or 3 Rooms | 413 (5.7%) | 1,553 (30.2%) |
| 4 or 5 Rooms | 1,703 (23.6%) | 2,237 (43.5%) |
| 6 or 7 Rooms | 2,785 (38.7%) | 750 (14.6%) |
| 8 or more Rooms | 2,304 (32.0%) | 38 (0.7%) |
| Total | 7,205 (100.0%) | 5,140 (100.0%) |
Housing Structure by Heating Type in Northampton
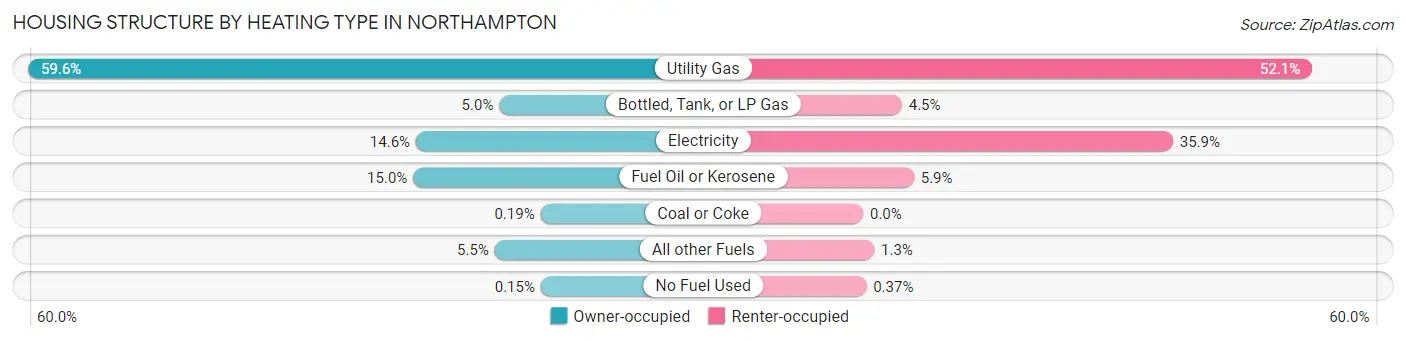
| Heating Type | Owner-occupied | Renter-occupied |
| Utility Gas | 4,295 (59.6%) | 2,676 (52.1%) |
| Bottled, Tank, or LP Gas | 358 (5.0%) | 231 (4.5%) |
| Electricity | 1,054 (14.6%) | 1,846 (35.9%) |
| Fuel Oil or Kerosene | 1,077 (14.9%) | 302 (5.9%) |
| Coal or Coke | 14 (0.2%) | 0 (0.0%) |
| All other Fuels | 396 (5.5%) | 66 (1.3%) |
| No Fuel Used | 11 (0.2%) | 19 (0.4%) |
| Total | 7,205 (100.0%) | 5,140 (100.0%) |
Household Vehicle Usage in Northampton
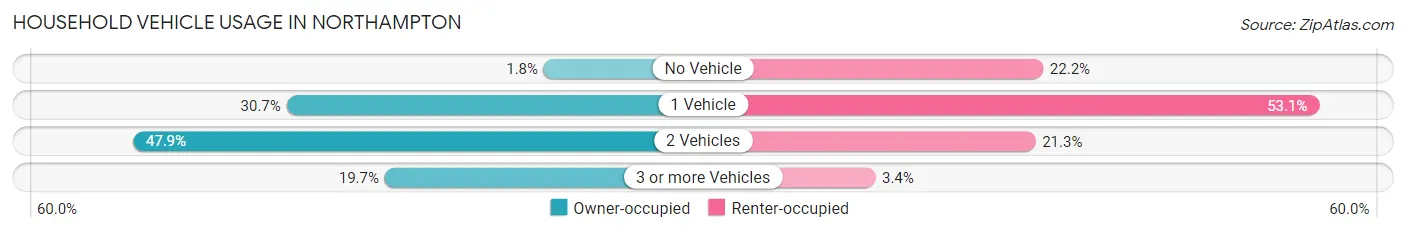
| Vehicles per Household | Owner-occupied | Renter-occupied |
| No Vehicle | 132 (1.8%) | 1,140 (22.2%) |
| 1 Vehicle | 2,208 (30.6%) | 2,731 (53.1%) |
| 2 Vehicles | 3,449 (47.9%) | 1,096 (21.3%) |
| 3 or more Vehicles | 1,416 (19.7%) | 173 (3.4%) |
| Total | 7,205 (100.0%) | 5,140 (100.0%) |
Real Estate & Mortgages in Northampton
Real Estate and Mortgage Overview in Northampton
| Characteristic | Without Mortgage | With Mortgage |
| Housing Units | 2,715 | 4,490 |
| Median Property Value | $378,100 | $392,600 |
| Median Household Income | $97,026 | $1,769 |
| Monthly Housing Costs | $898 | $934 |
| Real Estate Taxes | $5,444 | $8 |
Property Value by Mortgage Status in Northampton
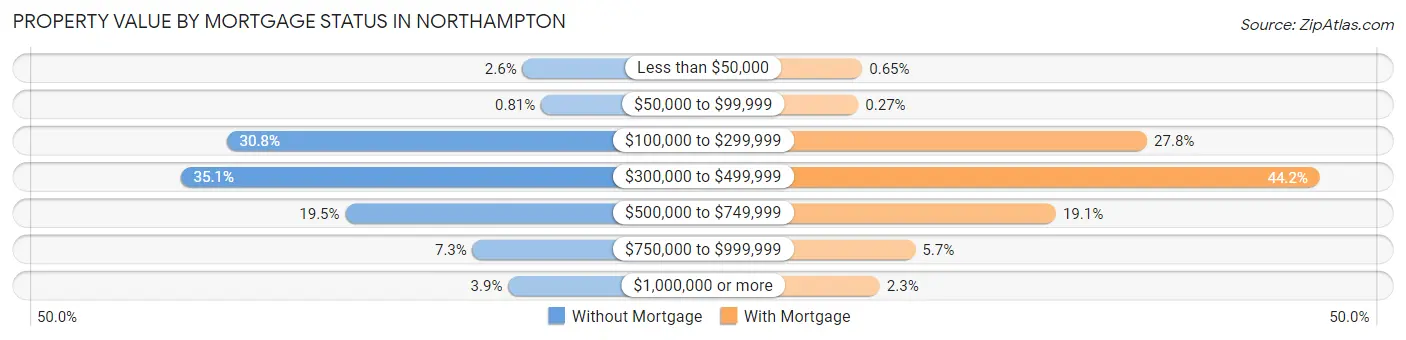
| Property Value | Without Mortgage | With Mortgage |
| Less than $50,000 | 70 (2.6%) | 29 (0.6%) |
| $50,000 to $99,999 | 22 (0.8%) | 12 (0.3%) |
| $100,000 to $299,999 | 835 (30.8%) | 1,247 (27.8%) |
| $300,000 to $499,999 | 954 (35.1%) | 1,985 (44.2%) |
| $500,000 to $749,999 | 528 (19.5%) | 857 (19.1%) |
| $750,000 to $999,999 | 199 (7.3%) | 256 (5.7%) |
| $1,000,000 or more | 107 (3.9%) | 104 (2.3%) |
| Total | 2,715 (100.0%) | 4,490 (100.0%) |
Household Income by Mortgage Status in Northampton
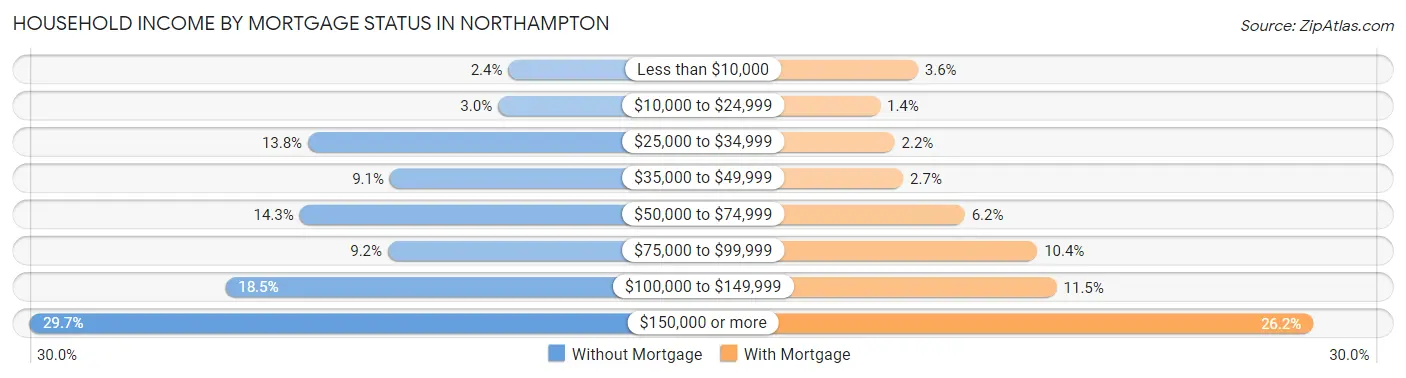
| Household Income | Without Mortgage | With Mortgage |
| Less than $10,000 | 64 (2.4%) | 160 (3.6%) |
| $10,000 to $24,999 | 80 (2.9%) | 63 (1.4%) |
| $25,000 to $34,999 | 375 (13.8%) | 100 (2.2%) |
| $35,000 to $49,999 | 248 (9.1%) | 122 (2.7%) |
| $50,000 to $74,999 | 388 (14.3%) | 280 (6.2%) |
| $75,000 to $99,999 | 251 (9.2%) | 466 (10.4%) |
| $100,000 to $149,999 | 503 (18.5%) | 516 (11.5%) |
| $150,000 or more | 806 (29.7%) | 1,174 (26.2%) |
| Total | 2,715 (100.0%) | 4,490 (100.0%) |
Property Value to Household Income Ratio in Northampton
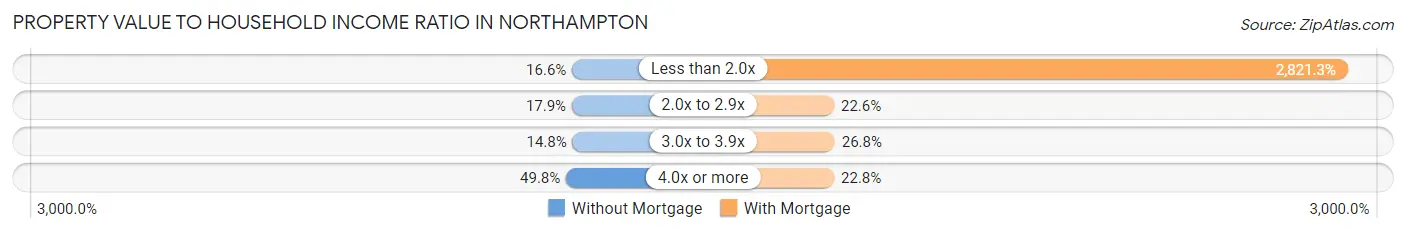
| Value-to-Income Ratio | Without Mortgage | With Mortgage |
| Less than 2.0x | 451 (16.6%) | 126,674 (2,821.2%) |
| 2.0x to 2.9x | 485 (17.9%) | 1,015 (22.6%) |
| 3.0x to 3.9x | 401 (14.8%) | 1,203 (26.8%) |
| 4.0x or more | 1,352 (49.8%) | 1,025 (22.8%) |
| Total | 2,715 (100.0%) | 4,490 (100.0%) |
Real Estate Taxes by Mortgage Status in Northampton
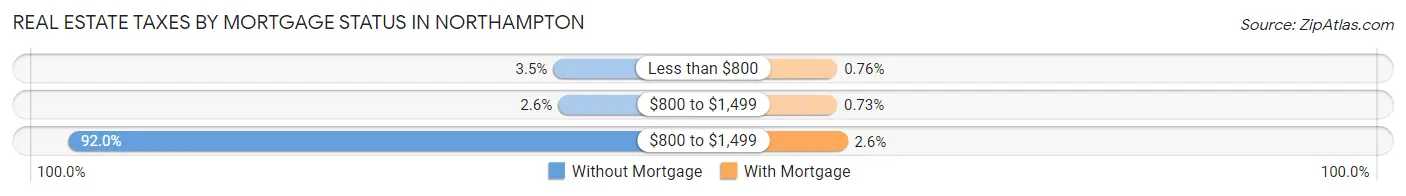
| Property Taxes | Without Mortgage | With Mortgage |
| Less than $800 | 94 (3.5%) | 34 (0.8%) |
| $800 to $1,499 | 70 (2.6%) | 33 (0.7%) |
| $800 to $1,499 | 2,499 (92.0%) | 118 (2.6%) |
| Total | 2,715 (100.0%) | 4,490 (100.0%) |
Health & Disability in Northampton
Health Insurance Coverage by Age in Northampton
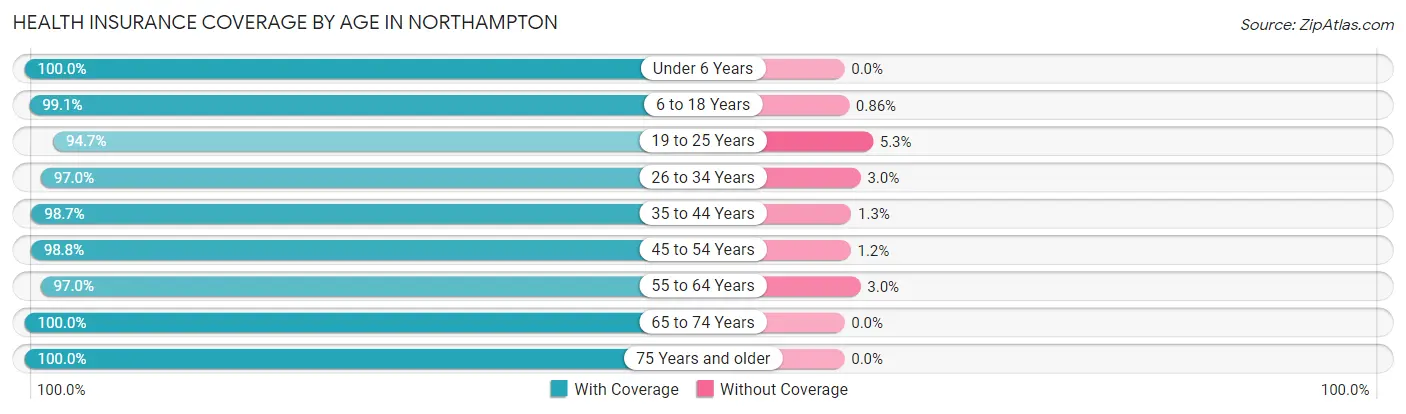
| Age Bracket | With Coverage | Without Coverage |
| Under 6 Years | 1,090 (100.0%) | 0 (0.0%) |
| 6 to 18 Years | 3,785 (99.1%) | 33 (0.9%) |
| 19 to 25 Years | 3,033 (94.7%) | 170 (5.3%) |
| 26 to 34 Years | 3,183 (97.0%) | 99 (3.0%) |
| 35 to 44 Years | 3,350 (98.7%) | 43 (1.3%) |
| 45 to 54 Years | 3,417 (98.8%) | 40 (1.2%) |
| 55 to 64 Years | 3,632 (97.0%) | 112 (3.0%) |
| 65 to 74 Years | 3,579 (100.0%) | 0 (0.0%) |
| 75 Years and older | 1,875 (100.0%) | 0 (0.0%) |
| Total | 26,944 (98.2%) | 497 (1.8%) |
Health Insurance Coverage by Citizenship Status in Northampton
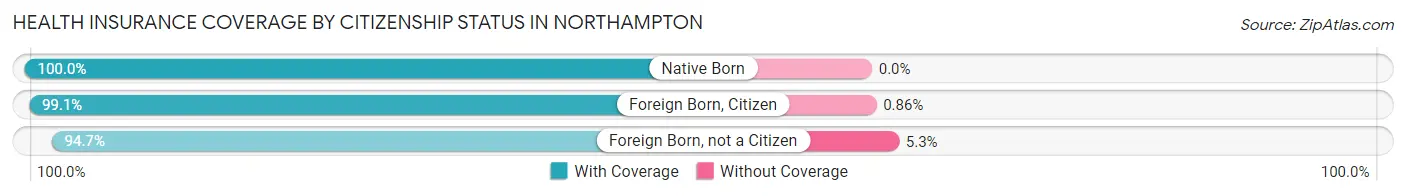
| Citizenship Status | With Coverage | Without Coverage |
| Native Born | 1,090 (100.0%) | 0 (0.0%) |
| Foreign Born, Citizen | 3,785 (99.1%) | 33 (0.9%) |
| Foreign Born, not a Citizen | 3,033 (94.7%) | 170 (5.3%) |
Health Insurance Coverage by Household Income in Northampton
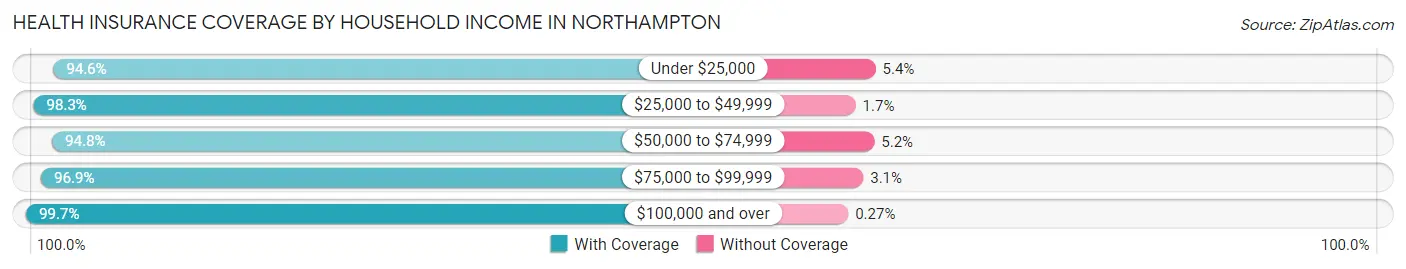
| Household Income | With Coverage | Without Coverage |
| Under $25,000 | 2,348 (94.6%) | 134 (5.4%) |
| $25,000 to $49,999 | 3,624 (98.3%) | 61 (1.7%) |
| $50,000 to $74,999 | 2,662 (94.8%) | 145 (5.2%) |
| $75,000 to $99,999 | 2,700 (96.9%) | 86 (3.1%) |
| $100,000 and over | 12,918 (99.7%) | 35 (0.3%) |
Public vs Private Health Insurance Coverage by Age in Northampton
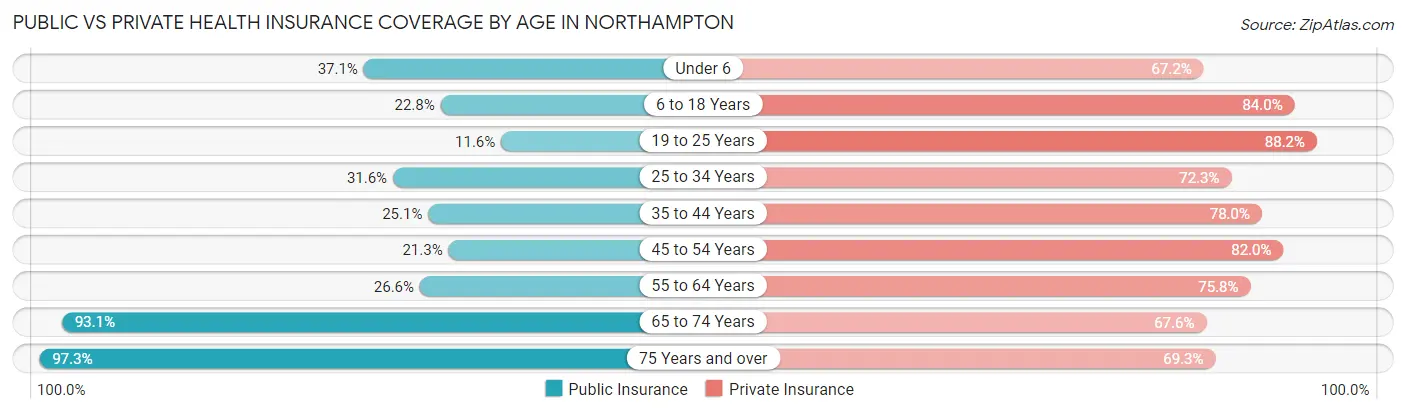
| Age Bracket | Public Insurance | Private Insurance |
| Under 6 | 404 (37.1%) | 732 (67.2%) |
| 6 to 18 Years | 870 (22.8%) | 3,208 (84.0%) |
| 19 to 25 Years | 370 (11.6%) | 2,824 (88.2%) |
| 25 to 34 Years | 1,038 (31.6%) | 2,373 (72.3%) |
| 35 to 44 Years | 851 (25.1%) | 2,645 (77.9%) |
| 45 to 54 Years | 737 (21.3%) | 2,833 (82.0%) |
| 55 to 64 Years | 997 (26.6%) | 2,839 (75.8%) |
| 65 to 74 Years | 3,332 (93.1%) | 2,421 (67.6%) |
| 75 Years and over | 1,824 (97.3%) | 1,300 (69.3%) |
| Total | 10,423 (38.0%) | 21,175 (77.2%) |
Disability Status by Sex by Age in Northampton
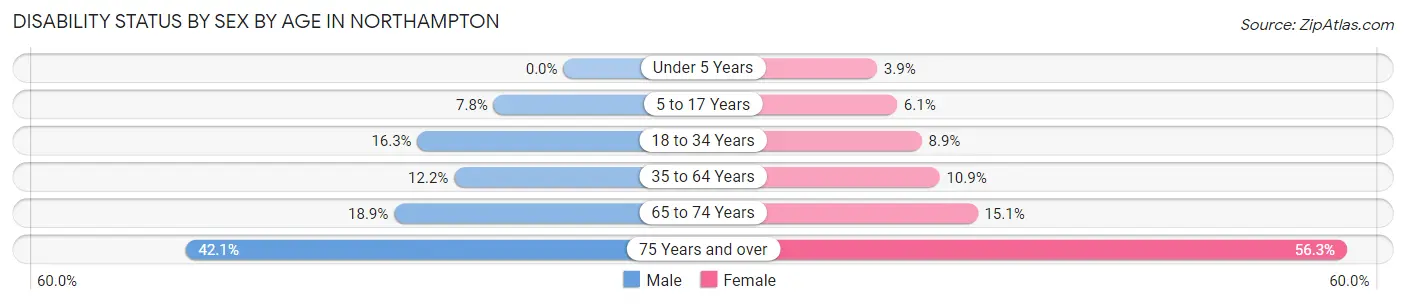
| Age Bracket | Male | Female |
| Under 5 Years | 0 (0.0%) | 15 (3.9%) |
| 5 to 17 Years | 130 (7.8%) | 107 (6.1%) |
| 18 to 34 Years | 350 (16.3%) | 439 (8.9%) |
| 35 to 64 Years | 608 (12.2%) | 609 (10.9%) |
| 65 to 74 Years | 283 (18.9%) | 314 (15.1%) |
| 75 Years and over | 311 (42.1%) | 639 (56.2%) |
Disability Class by Sex by Age in Northampton
Disability Class: Hearing Difficulty
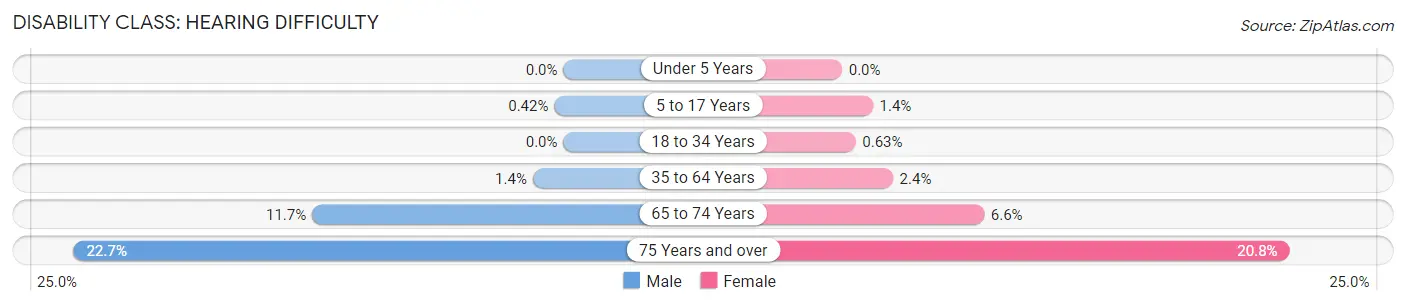
| Age Bracket | Male | Female |
| Under 5 Years | 0 (0.0%) | 0 (0.0%) |
| 5 to 17 Years | 7 (0.4%) | 25 (1.4%) |
| 18 to 34 Years | 0 (0.0%) | 31 (0.6%) |
| 35 to 64 Years | 71 (1.4%) | 132 (2.4%) |
| 65 to 74 Years | 175 (11.7%) | 137 (6.6%) |
| 75 Years and over | 168 (22.7%) | 236 (20.8%) |
Disability Class: Vision Difficulty
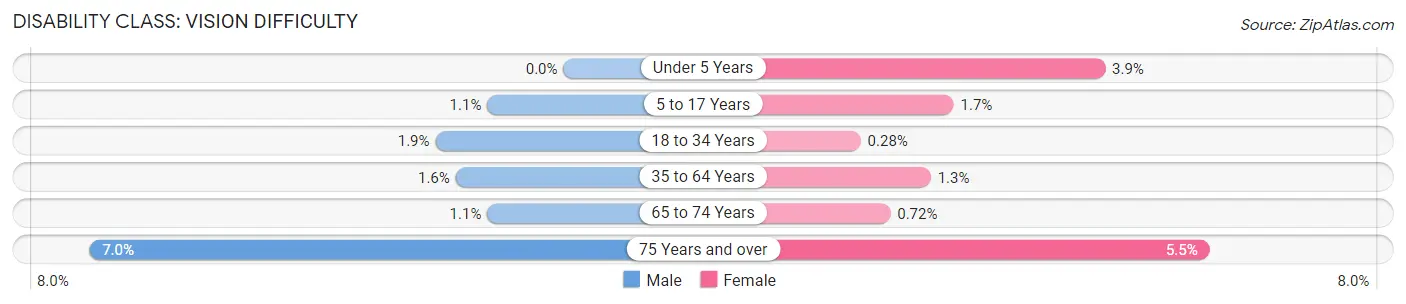
| Age Bracket | Male | Female |
| Under 5 Years | 0 (0.0%) | 15 (3.9%) |
| 5 to 17 Years | 19 (1.1%) | 29 (1.7%) |
| 18 to 34 Years | 41 (1.9%) | 14 (0.3%) |
| 35 to 64 Years | 80 (1.6%) | 74 (1.3%) |
| 65 to 74 Years | 17 (1.1%) | 15 (0.7%) |
| 75 Years and over | 52 (7.0%) | 62 (5.5%) |
Disability Class: Cognitive Difficulty
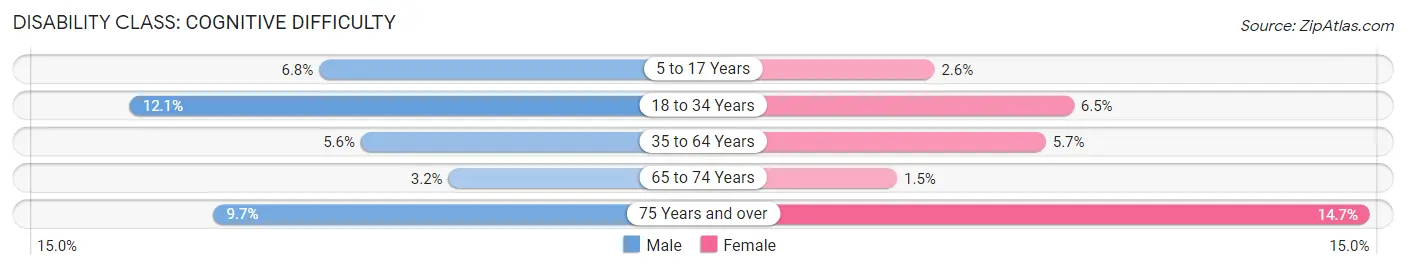
| Age Bracket | Male | Female |
| 5 to 17 Years | 114 (6.8%) | 45 (2.6%) |
| 18 to 34 Years | 260 (12.1%) | 319 (6.5%) |
| 35 to 64 Years | 282 (5.6%) | 318 (5.7%) |
| 65 to 74 Years | 48 (3.2%) | 32 (1.5%) |
| 75 Years and over | 72 (9.7%) | 167 (14.7%) |
Disability Class: Ambulatory Difficulty
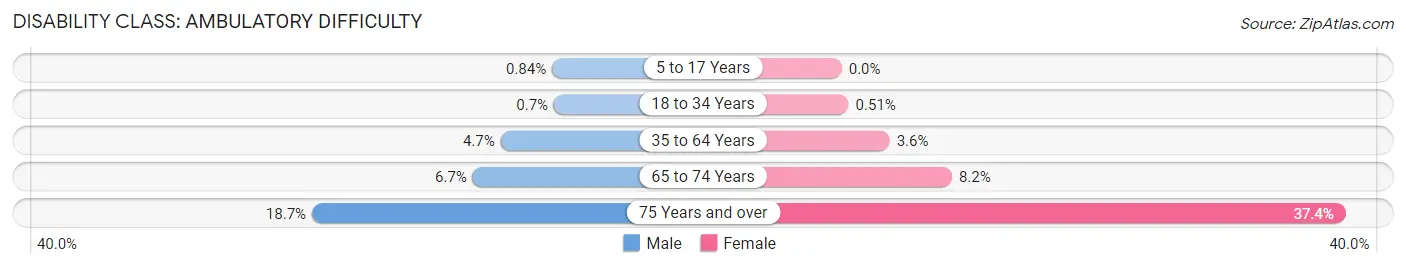
| Age Bracket | Male | Female |
| 5 to 17 Years | 14 (0.8%) | 0 (0.0%) |
| 18 to 34 Years | 15 (0.7%) | 25 (0.5%) |
| 35 to 64 Years | 233 (4.7%) | 199 (3.6%) |
| 65 to 74 Years | 101 (6.7%) | 170 (8.2%) |
| 75 Years and over | 138 (18.7%) | 425 (37.4%) |
Disability Class: Self-Care Difficulty
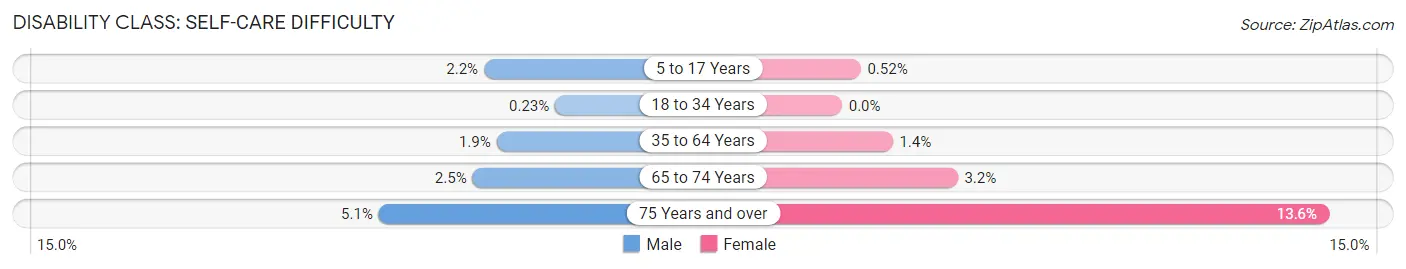
| Age Bracket | Male | Female |
| 5 to 17 Years | 37 (2.2%) | 9 (0.5%) |
| 18 to 34 Years | 5 (0.2%) | 0 (0.0%) |
| 35 to 64 Years | 93 (1.9%) | 79 (1.4%) |
| 65 to 74 Years | 38 (2.5%) | 67 (3.2%) |
| 75 Years and over | 38 (5.1%) | 154 (13.6%) |
Technology Access in Northampton
Computing Device Access in Northampton
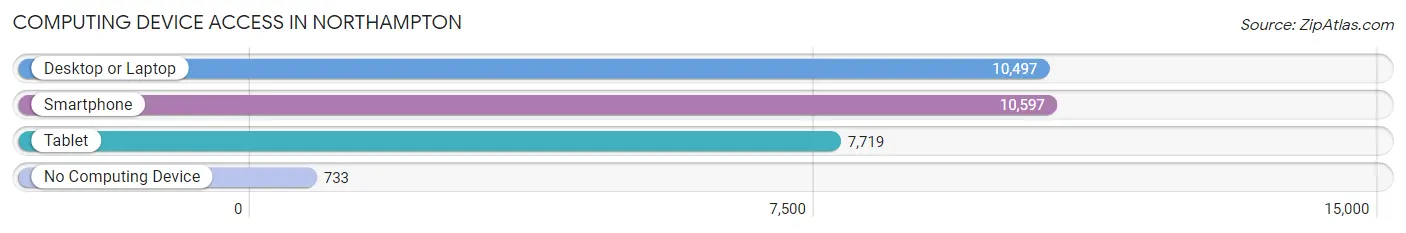
| Device Type | # Households | % Households |
| Desktop or Laptop | 10,497 | 85.0% |
| Smartphone | 10,597 | 85.8% |
| Tablet | 7,719 | 62.5% |
| No Computing Device | 733 | 5.9% |
| Total | 12,345 | 100.0% |
Internet Access in Northampton
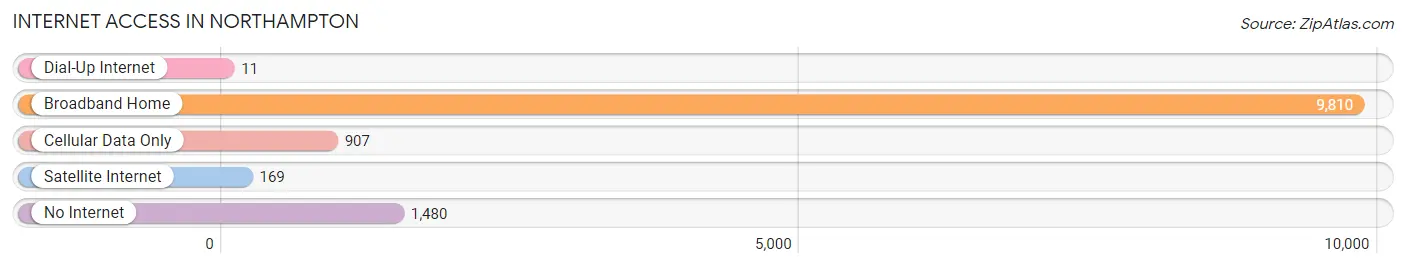
| Internet Type | # Households | % Households |
| Dial-Up Internet | 11 | 0.1% |
| Broadband Home | 9,810 | 79.5% |
| Cellular Data Only | 907 | 7.3% |
| Satellite Internet | 169 | 1.4% |
| No Internet | 1,480 | 12.0% |
| Total | 12,345 | 100.0% |
Northampton Summary
Northampton, Massachusetts is a city located in the Pioneer Valley of western Massachusetts. It is the county seat of Hampshire County and is part of the Springfield, Massachusetts Metropolitan Statistical Area. The city has a population of 28,549 as of the 2010 census, making it the third-largest city in the state. Northampton is known for its vibrant arts and music scene, as well as its progressive politics.
History
Northampton was first settled in 1654 by a group of English Puritans led by William Pynchon. The settlement was originally called Nonotuck, meaning “the place between the hills” in the language of the local Native American tribe, the Pocumtuc. The settlement was later renamed Northampton in 1664, after the town of Northampton in England.
In the 18th century, Northampton became an important center for trade and industry. The city was home to a number of mills, including a paper mill, a grist mill, and a sawmill. The city was also home to a number of tanneries, which produced leather goods for the region.
In the 19th century, Northampton became a center for education. Smith College, the first women’s college in the United States, was founded in Northampton in 1871. The city was also home to the Clarke School for the Deaf, the first school for the deaf in the United States.
Geography
Northampton is located in the Pioneer Valley of western Massachusetts. The city is situated on the banks of the Connecticut River, which forms the border between Massachusetts and Connecticut. The city is located in the foothills of the Berkshires, a range of mountains in western Massachusetts.
The city has a total area of 16.3 square miles, of which 16.2 square miles is land and 0.1 square miles is water. The city is located at an elevation of approximately 500 feet above sea level.
Economy
Northampton’s economy is largely driven by education, healthcare, and tourism. Smith College is the largest employer in the city, with over 2,000 employees. Other major employers include Cooley Dickinson Hospital, the Northampton Public Schools, and the City of Northampton.
The city is also home to a number of small businesses, including restaurants, retail stores, and art galleries. The city is also home to a number of technology companies, including the software company, Apprenda.
Demographics
As of the 2010 census, Northampton had a population of 28,549. The racial makeup of the city was 87.3% White, 4.2% African American, 0.3% Native American, 4.2% Asian, 0.1% Pacific Islander, 1.7% from other races, and 2.3% from two or more races. Hispanic or Latino of any race were 5.2% of the population.
The median household income in Northampton was $50,867, and the median family income was $63,945. The per capita income for the city was $27,837. About 11.3% of the population was below the poverty line.
Northampton is a diverse city, with a large LGBT population. The city is home to a number of LGBT-friendly businesses and organizations, including the Northampton Pride Parade and Festival.
Conclusion
Northampton, Massachusetts is a vibrant city located in the Pioneer Valley of western Massachusetts. The city has a rich history, and is known for its progressive politics and vibrant arts and music scene. The city’s economy is largely driven by education, healthcare, and tourism, and the city is home to a diverse population. Northampton is an attractive destination for visitors and residents alike.
Common Questions
What is Per Capita Income in Northampton?
Per Capita income in Northampton is $49,679.
What is the Median Family Income in Northampton?
Median Family Income in Northampton is $123,871.
What is the Median Household income in Northampton?
Median Household Income in Northampton is $80,981.
What is Income or Wage Gap in Northampton?
Income or Wage Gap in Northampton is 37.5%.
Women in Northampton earn 62.5 cents for every dollar earned by a man.
What is Inequality or Gini Index in Northampton?
Inequality or Gini Index in Northampton is 0.49.
What is the Total Population of Northampton?
Total Population of Northampton is 28,245.
What is the Total Male Population of Northampton?
Total Male Population of Northampton is 12,038.
What is the Total Female Population of Northampton?
Total Female Population of Northampton is 16,207.
What is the Ratio of Males per 100 Females in Northampton?
There are 74.28 Males per 100 Females in Northampton.
What is the Ratio of Females per 100 Males in Northampton?
There are 134.63 Females per 100 Males in Northampton.
What is the Median Population Age in Northampton?
Median Population Age in Northampton is 42.5 Years.
What is the Average Family Size in Northampton
Average Family Size in Northampton is 2.6 People.
What is the Average Household Size in Northampton
Average Household Size in Northampton is 2.0 People.
How Large is the Labor Force in Northampton?
There are 15,156 People in the Labor Forcein in Northampton.
What is the Percentage of People in the Labor Force in Northampton?
61.5% of People are in the Labor Force in Northampton.
What is the Unemployment Rate in Northampton?
Unemployment Rate in Northampton is 5.6%.