Marblehead, MA Map & Demographics
Marblehead Map
Marblehead Overview
$90,921
PER CAPITA INCOME
$200,000
AVG FAMILY INCOME
$164,104
AVG HOUSEHOLD INCOME
40.9%
WAGE / INCOME GAP [ % ]
59.1¢/ $1
WAGE / INCOME GAP [ $ ]
0.48
INEQUALITY / GINI INDEX
20,350
TOTAL POPULATION
9,740
MALE POPULATION
10,610
FEMALE POPULATION
91.80
MALES / 100 FEMALES
108.93
FEMALES / 100 MALES
49.6
MEDIAN AGE
3.0
AVG FAMILY SIZE
2.5
AVG HOUSEHOLD SIZE
11,153
LABOR FORCE [ PEOPLE ]
66.0%
PERCENT IN LABOR FORCE
3.3%
UNEMPLOYMENT RATE
Marblehead Zip Codes
Marblehead Area Codes
Income in Marblehead
Income Overview in Marblehead
Per Capita Income in Marblehead is $90,921, while median incomes of families and households are $200,000 and $164,104 respectively.
| Characteristic | Number | Measure |
| Per Capita Income | 20,350 | $90,921 |
| Median Family Income | 6,006 | $200,000 |
| Mean Family Income | 6,006 | $261,608 |
| Median Household Income | 8,172 | $164,104 |
| Mean Household Income | 8,172 | $226,566 |
| Income Deficit | 6,006 | $0 |
| Wage / Income Gap (%) | 20,350 | 40.93% |
| Wage / Income Gap ($) | 20,350 | 59.07¢ per $1 |
| Gini / Inequality Index | 20,350 | 0.48 |
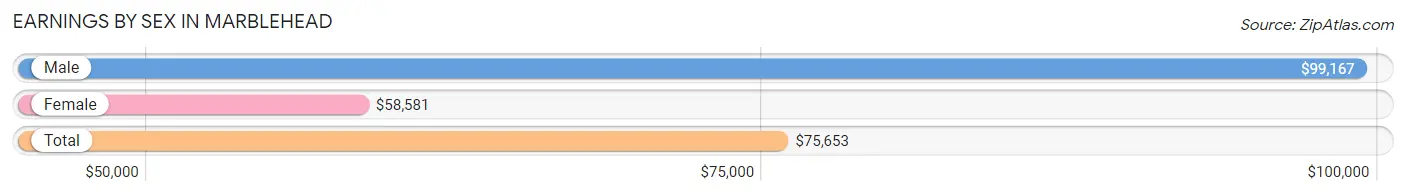
Earnings by Sex in Marblehead
Average Earnings in Marblehead are $75,653, $99,167 for men and $58,581 for women, a difference of 40.9%.
| Sex | Number | Average Earnings |
| Male | 6,364 (52.9%) | $99,167 |
| Female | 5,666 (47.1%) | $58,581 |
| Total | 12,030 (100.0%) | $75,653 |
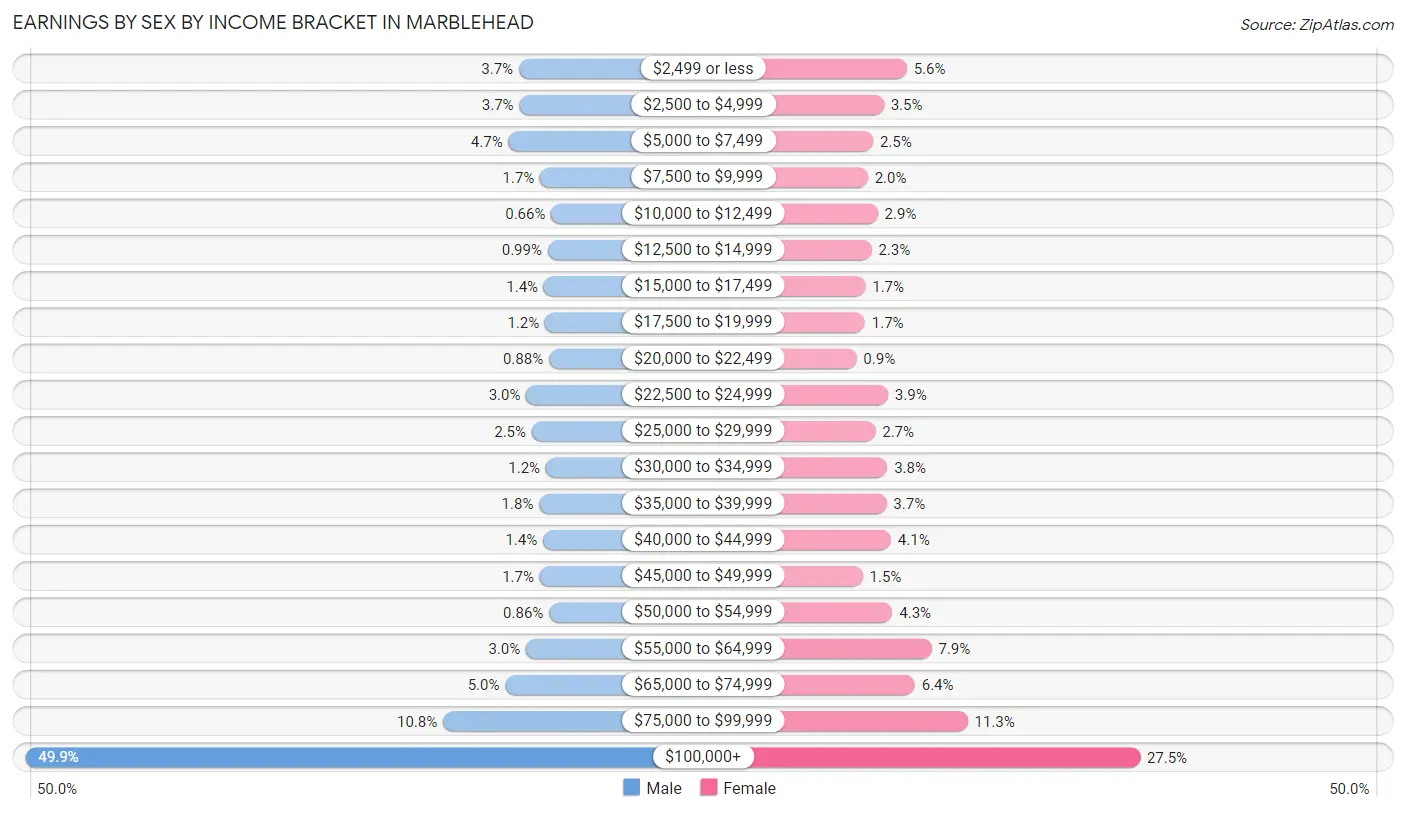
Earnings by Sex by Income Bracket in Marblehead
The most common earnings brackets in Marblehead are $100,000+ for men (3,177 | 49.9%) and $100,000+ for women (1,556 | 27.5%).
| Income | Male | Female |
| $2,499 or less | 235 (3.7%) | 318 (5.6%) |
| $2,500 to $4,999 | 232 (3.6%) | 196 (3.5%) |
| $5,000 to $7,499 | 297 (4.7%) | 139 (2.5%) |
| $7,500 to $9,999 | 108 (1.7%) | 111 (2.0%) |
| $10,000 to $12,499 | 42 (0.7%) | 164 (2.9%) |
| $12,500 to $14,999 | 63 (1.0%) | 131 (2.3%) |
| $15,000 to $17,499 | 86 (1.3%) | 98 (1.7%) |
| $17,500 to $19,999 | 79 (1.2%) | 96 (1.7%) |
| $20,000 to $22,499 | 56 (0.9%) | 51 (0.9%) |
| $22,500 to $24,999 | 191 (3.0%) | 218 (3.8%) |
| $25,000 to $29,999 | 158 (2.5%) | 151 (2.7%) |
| $30,000 to $34,999 | 74 (1.2%) | 215 (3.8%) |
| $35,000 to $39,999 | 114 (1.8%) | 210 (3.7%) |
| $40,000 to $44,999 | 91 (1.4%) | 234 (4.1%) |
| $45,000 to $49,999 | 111 (1.7%) | 84 (1.5%) |
| $50,000 to $54,999 | 55 (0.9%) | 242 (4.3%) |
| $55,000 to $64,999 | 192 (3.0%) | 450 (7.9%) |
| $65,000 to $74,999 | 316 (5.0%) | 361 (6.4%) |
| $75,000 to $99,999 | 687 (10.8%) | 641 (11.3%) |
| $100,000+ | 3,177 (49.9%) | 1,556 (27.5%) |
| Total | 6,364 (100.0%) | 5,666 (100.0%) |
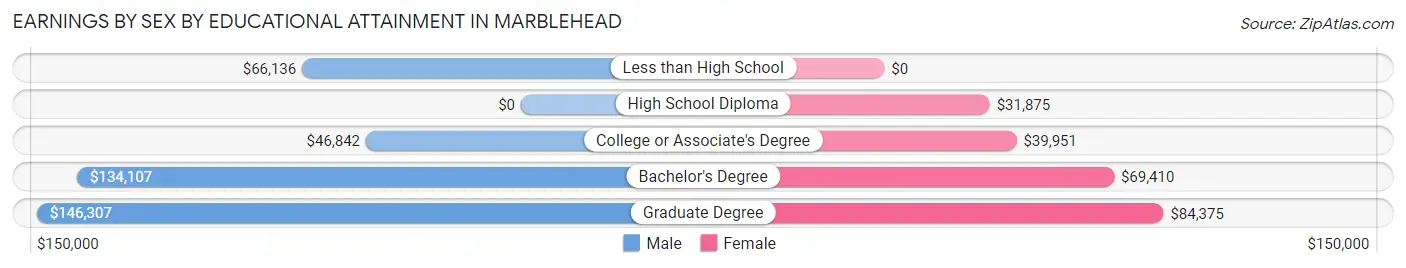
Earnings by Sex by Educational Attainment in Marblehead
Average earnings in Marblehead are $121,797 for men and $65,612 for women, a difference of 46.1%. Men with an educational attainment of graduate degree enjoy the highest average annual earnings of $146,307, while those with college or associate's degree education earn the least with $46,842. Women with an educational attainment of graduate degree earn the most with the average annual earnings of $84,375, while those with high school diploma education have the smallest earnings of $31,875.
| Educational Attainment | Male Income | Female Income |
| Less than High School | $66,136 | $0 |
| High School Diploma | - | - |
| College or Associate's Degree | $46,842 | $39,951 |
| Bachelor's Degree | $134,107 | $69,410 |
| Graduate Degree | $146,307 | $84,375 |
| Total | $121,797 | $65,612 |
Family Income in Marblehead
Family Income Brackets in Marblehead
According to the Marblehead family income data, there are 3,003 families falling into the $200,000+ income range, which is the most common income bracket and makes up 50.0% of all families. Conversely, the less than $10,000 income bracket is the least frequent group with only 12 families (0.2%) belonging to this category.
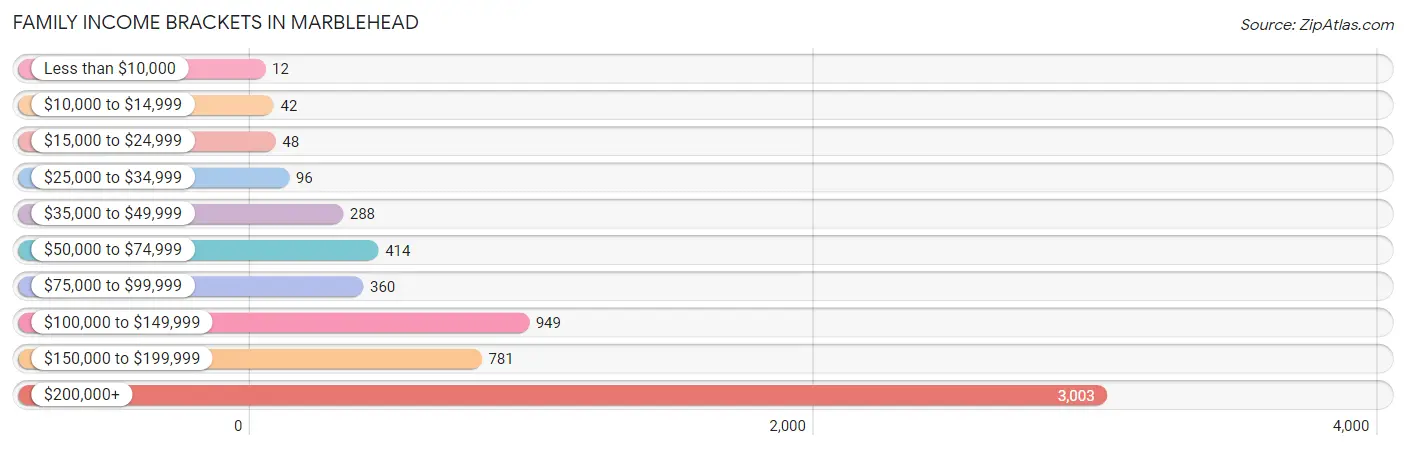
| Income Bracket | # Families | % Families |
| Less than $10,000 | 12 | 0.2% |
| $10,000 to $14,999 | 42 | 0.7% |
| $15,000 to $24,999 | 48 | 0.8% |
| $25,000 to $34,999 | 96 | 1.6% |
| $35,000 to $49,999 | 288 | 4.8% |
| $50,000 to $74,999 | 414 | 6.9% |
| $75,000 to $99,999 | 360 | 6.0% |
| $100,000 to $149,999 | 949 | 15.8% |
| $150,000 to $199,999 | 781 | 13.0% |
| $200,000+ | 3,003 | 50.0% |
Family Income by Famaliy Size in Marblehead
4-person families (1,399 | 23.3%) account for the highest median family income in Marblehead with $238,229 per family, while 2-person families (2,903 | 48.3%) have the highest median income of $85,503 per family member.
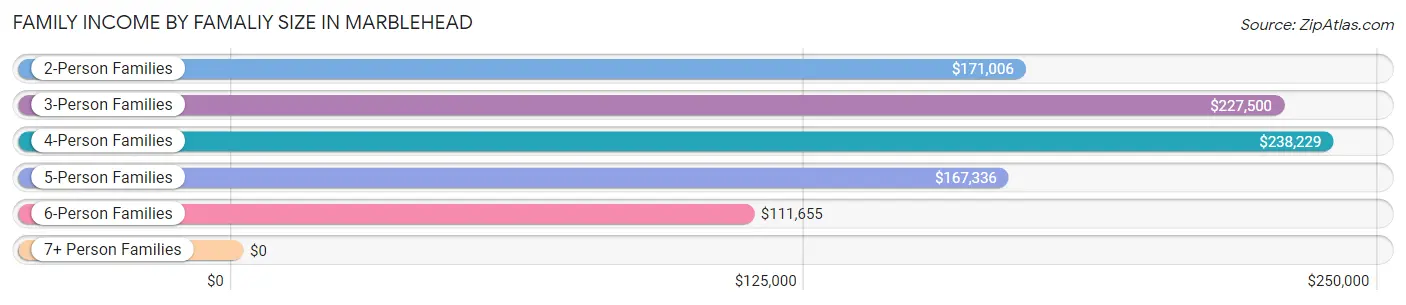
| Income Bracket | # Families | Median Income |
| 2-Person Families | 2,903 (48.3%) | $171,006 |
| 3-Person Families | 1,196 (19.9%) | $227,500 |
| 4-Person Families | 1,399 (23.3%) | $238,229 |
| 5-Person Families | 415 (6.9%) | $167,336 |
| 6-Person Families | 93 (1.5%) | $111,655 |
| 7+ Person Families | 0 (0.0%) | $0 |
| Total | 6,006 (100.0%) | $200,000 |
Family Income by Number of Earners in Marblehead
The median family income in Marblehead is $200,000, with families comprising 2 earners (2,793) having the highest median family income of $243,882, while families with no earners (652) have the lowest median family income of $84,219, accounting for 46.5% and 10.9% of families, respectively.
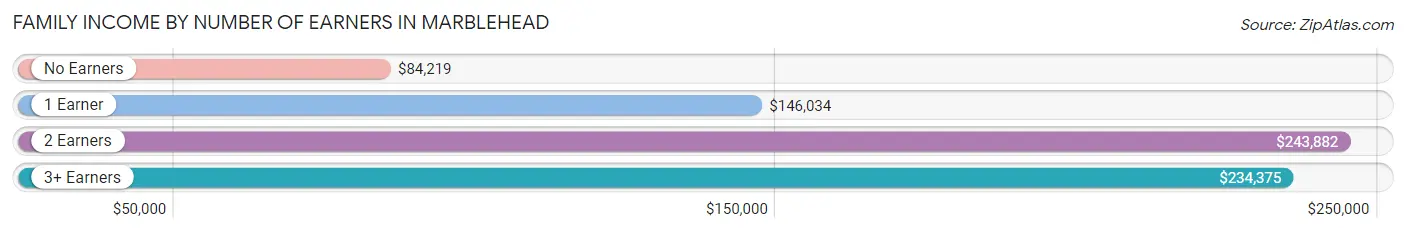
| Number of Earners | # Families | Median Income |
| No Earners | 652 (10.9%) | $84,219 |
| 1 Earner | 1,588 (26.4%) | $146,034 |
| 2 Earners | 2,793 (46.5%) | $243,882 |
| 3+ Earners | 973 (16.2%) | $234,375 |
| Total | 6,006 (100.0%) | $200,000 |
Household Income in Marblehead
Household Income Brackets in Marblehead
With 3,400 households falling in the category, the $200,000+ income range is the most frequent in Marblehead, accounting for 41.6% of all households. In contrast, only 139 households (1.7%) fall into the $10,000 to $14,999 income bracket, making it the least populous group.
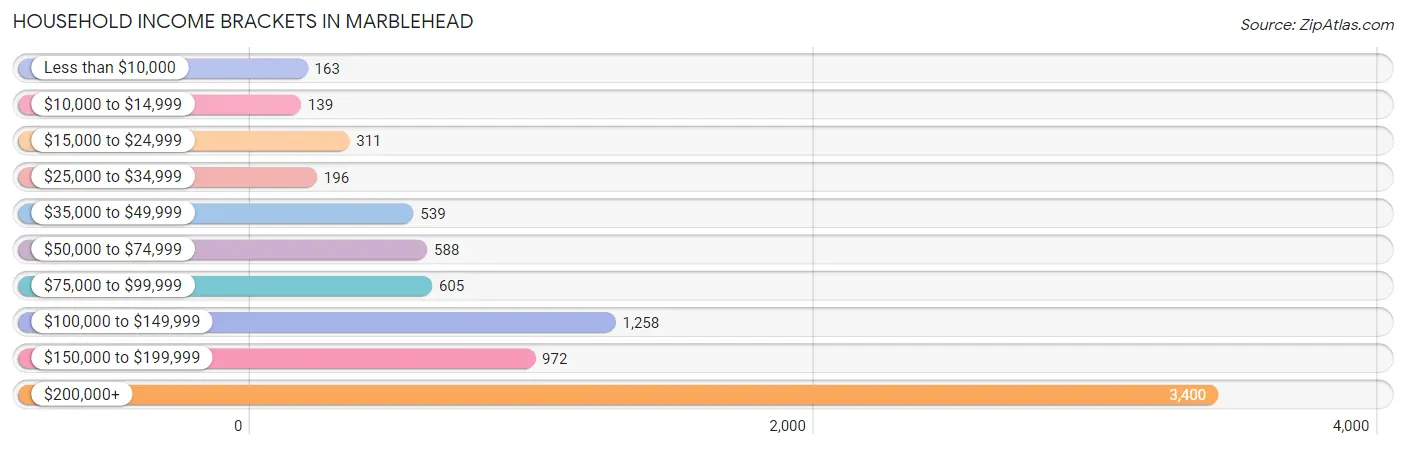
| Income Bracket | # Households | % Households |
| Less than $10,000 | 163 | 2.0% |
| $10,000 to $14,999 | 139 | 1.7% |
| $15,000 to $24,999 | 311 | 3.8% |
| $25,000 to $34,999 | 196 | 2.4% |
| $35,000 to $49,999 | 539 | 6.6% |
| $50,000 to $74,999 | 588 | 7.2% |
| $75,000 to $99,999 | 605 | 7.4% |
| $100,000 to $149,999 | 1,258 | 15.4% |
| $150,000 to $199,999 | 972 | 11.9% |
| $200,000+ | 3,400 | 41.6% |
Household Income by Householder Age in Marblehead
The median household income in Marblehead is $164,104, with the highest median household income of $211,891 found in the 45 to 64 years age bracket for the primary householder. A total of 3,971 households (48.6%) fall into this category. Meanwhile, the 65+ years age bracket for the primary householder has the lowest median household income of $98,875, with 2,761 households (33.8%) in this group.
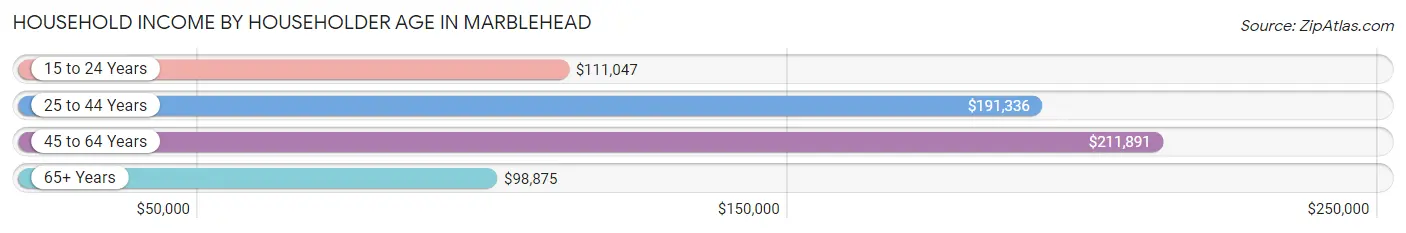
| Income Bracket | # Households | Median Income |
| 15 to 24 Years | 71 (0.9%) | $111,047 |
| 25 to 44 Years | 1,369 (16.8%) | $191,336 |
| 45 to 64 Years | 3,971 (48.6%) | $211,891 |
| 65+ Years | 2,761 (33.8%) | $98,875 |
| Total | 8,172 (100.0%) | $164,104 |
Poverty in Marblehead
Income Below Poverty by Sex and Age in Marblehead
With 2.2% poverty level for males and 3.7% for females among the residents of Marblehead, 65 to 74 year old males and 15 year old females are the most vulnerable to poverty, with 60 males (4.8%) and 23 females (12.7%) in their respective age groups living below the poverty level.
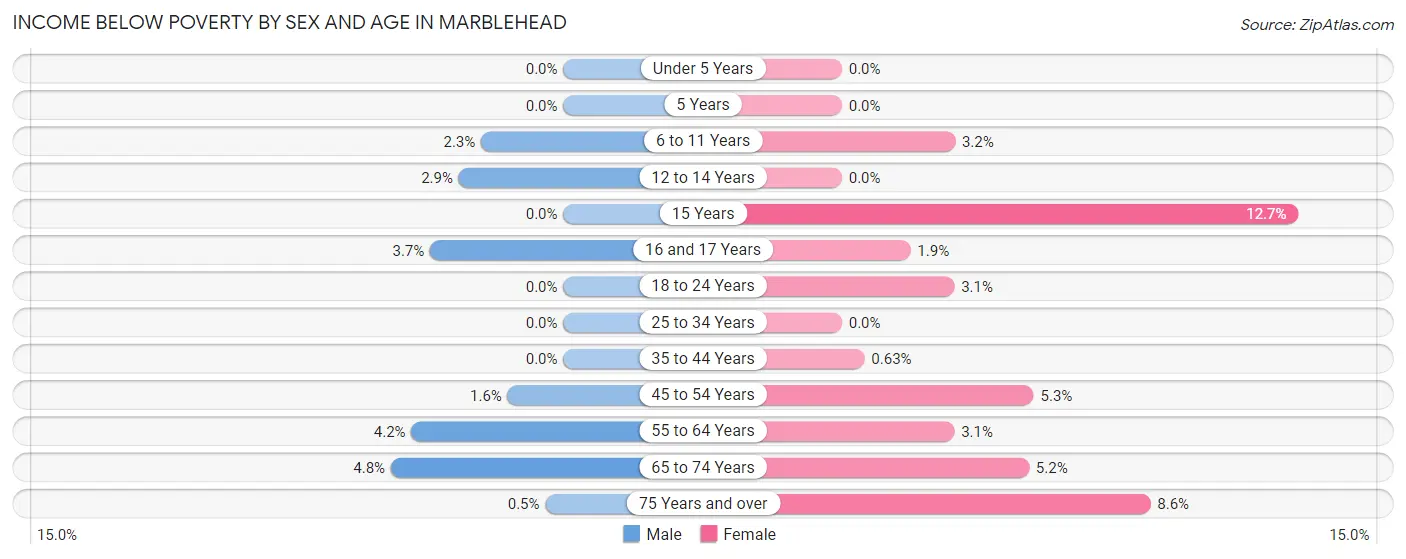
| Age Bracket | Male | Female |
| Under 5 Years | 0 (0.0%) | 0 (0.0%) |
| 5 Years | 0 (0.0%) | 0 (0.0%) |
| 6 to 11 Years | 13 (2.3%) | 24 (3.2%) |
| 12 to 14 Years | 18 (2.9%) | 0 (0.0%) |
| 15 Years | 0 (0.0%) | 23 (12.7%) |
| 16 and 17 Years | 21 (3.7%) | 7 (1.9%) |
| 18 to 24 Years | 0 (0.0%) | 18 (3.1%) |
| 25 to 34 Years | 0 (0.0%) | 0 (0.0%) |
| 35 to 44 Years | 0 (0.0%) | 7 (0.6%) |
| 45 to 54 Years | 25 (1.5%) | 88 (5.3%) |
| 55 to 64 Years | 73 (4.2%) | 61 (3.1%) |
| 65 to 74 Years | 60 (4.8%) | 67 (5.2%) |
| 75 Years and over | 4 (0.5%) | 93 (8.6%) |
| Total | 214 (2.2%) | 388 (3.7%) |
Income Above Poverty by Sex and Age in Marblehead
According to the poverty statistics in Marblehead, males aged under 5 years and females aged under 5 years are the age groups that are most secure financially, with 100.0% of males and 100.0% of females in these age groups living above the poverty line.
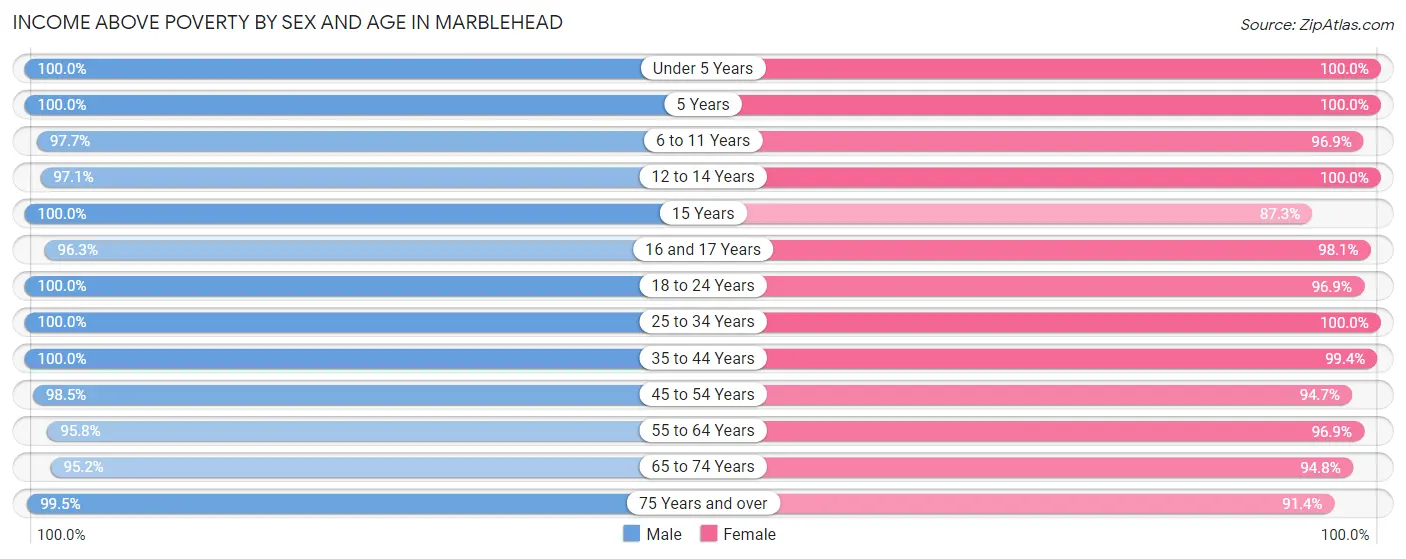
| Age Bracket | Male | Female |
| Under 5 Years | 223 (100.0%) | 337 (100.0%) |
| 5 Years | 50 (100.0%) | 101 (100.0%) |
| 6 to 11 Years | 555 (97.7%) | 739 (96.9%) |
| 12 to 14 Years | 600 (97.1%) | 479 (100.0%) |
| 15 Years | 131 (100.0%) | 158 (87.3%) |
| 16 and 17 Years | 545 (96.3%) | 359 (98.1%) |
| 18 to 24 Years | 734 (100.0%) | 557 (96.9%) |
| 25 to 34 Years | 653 (100.0%) | 641 (100.0%) |
| 35 to 44 Years | 788 (100.0%) | 1,100 (99.4%) |
| 45 to 54 Years | 1,588 (98.5%) | 1,561 (94.7%) |
| 55 to 64 Years | 1,652 (95.8%) | 1,887 (96.9%) |
| 65 to 74 Years | 1,191 (95.2%) | 1,219 (94.8%) |
| 75 Years and over | 804 (99.5%) | 990 (91.4%) |
| Total | 9,514 (97.8%) | 10,128 (96.3%) |
Income Below Poverty Among Married-Couple Families in Marblehead
The poverty statistics for married-couple families in Marblehead show that 0.4% or 21 of the total 5,135 families live below the poverty line. Families with 3 or 4 children have the highest poverty rate of 2.1%, comprising of 7 families. On the other hand, families with 1 or 2 children have the lowest poverty rate of 0.0%, which includes 0 families.
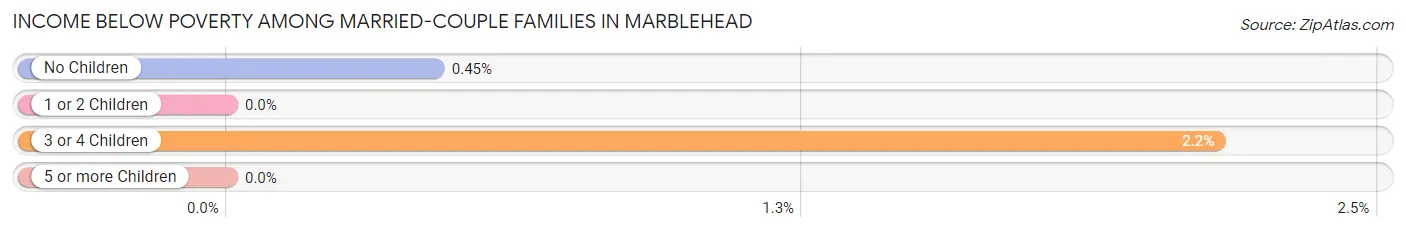
| Children | Above Poverty | Below Poverty |
| No Children | 3,072 (99.6%) | 14 (0.4%) |
| 1 or 2 Children | 1,723 (100.0%) | 0 (0.0%) |
| 3 or 4 Children | 319 (97.9%) | 7 (2.1%) |
| 5 or more Children | 0 (0.0%) | 0 (0.0%) |
| Total | 5,114 (99.6%) | 21 (0.4%) |
Income Below Poverty Among Single-Parent Households in Marblehead
According to the poverty data in Marblehead, 7.2% or 16 single-father households and 8.9% or 58 single-mother households are living below the poverty line. Among single-father households, those with no children have the highest poverty rate, with 16 households (14.3%) experiencing poverty. Likewise, among single-mother households, those with 3 or 4 children have the highest poverty rate, with 13 households (19.7%) falling below the poverty line.
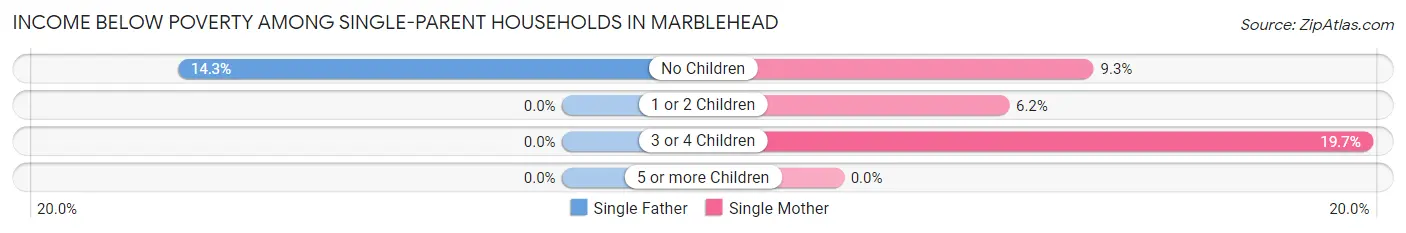
| Children | Single Father | Single Mother |
| No Children | 16 (14.3%) | 27 (9.3%) |
| 1 or 2 Children | 0 (0.0%) | 18 (6.2%) |
| 3 or 4 Children | 0 (0.0%) | 13 (19.7%) |
| 5 or more Children | 0 (0.0%) | 0 (0.0%) |
| Total | 16 (7.2%) | 58 (8.9%) |
Income Below Poverty Among Married-Couple vs Single-Parent Households in Marblehead
The poverty data for Marblehead shows that 21 of the married-couple family households (0.4%) and 74 of the single-parent households (8.5%) are living below the poverty level. Within the married-couple family households, those with 3 or 4 children have the highest poverty rate, with 7 households (2.1%) falling below the poverty line. Among the single-parent households, those with 3 or 4 children have the highest poverty rate, with 13 household (19.7%) living below poverty.
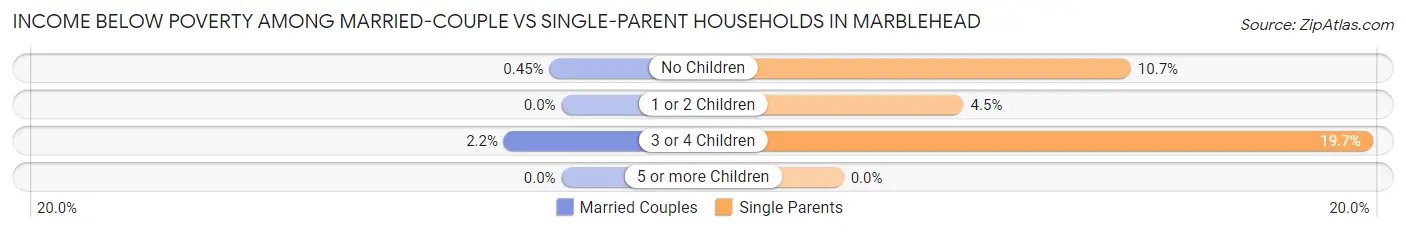
| Children | Married-Couple Families | Single-Parent Households |
| No Children | 14 (0.4%) | 43 (10.7%) |
| 1 or 2 Children | 0 (0.0%) | 18 (4.5%) |
| 3 or 4 Children | 7 (2.1%) | 13 (19.7%) |
| 5 or more Children | 0 (0.0%) | 0 (0.0%) |
| Total | 21 (0.4%) | 74 (8.5%) |
Race in Marblehead
The most populous races in Marblehead are White / Caucasian (19,414 | 95.4%), Hispanic or Latino (705 | 3.5%), and Two or more Races (305 | 1.5%).
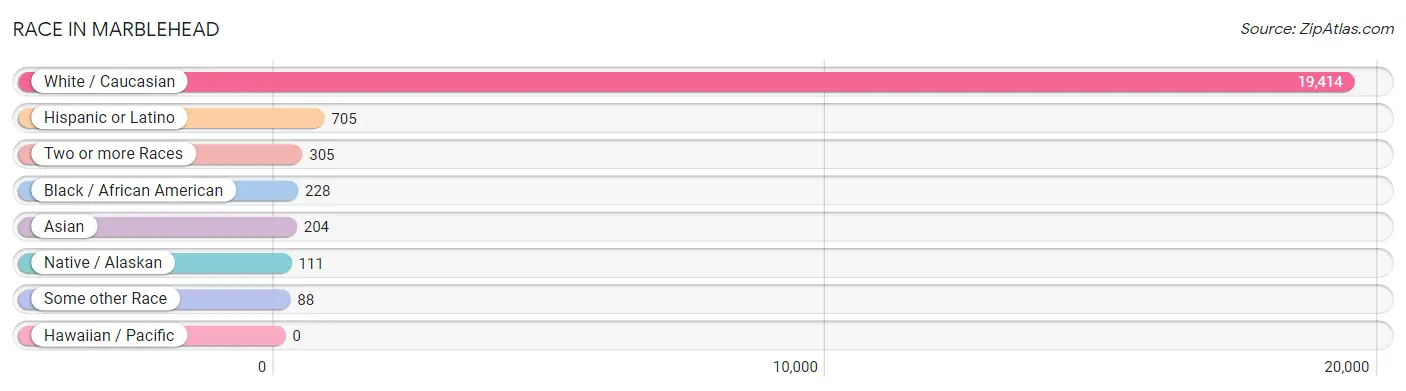
| Race | # Population | % Population |
| Asian | 204 | 1.0% |
| Black / African American | 228 | 1.1% |
| Hawaiian / Pacific | 0 | 0.0% |
| Hispanic or Latino | 705 | 3.5% |
| Native / Alaskan | 111 | 0.5% |
| White / Caucasian | 19,414 | 95.4% |
| Two or more Races | 305 | 1.5% |
| Some other Race | 88 | 0.4% |
| Total | 20,350 | 100.0% |
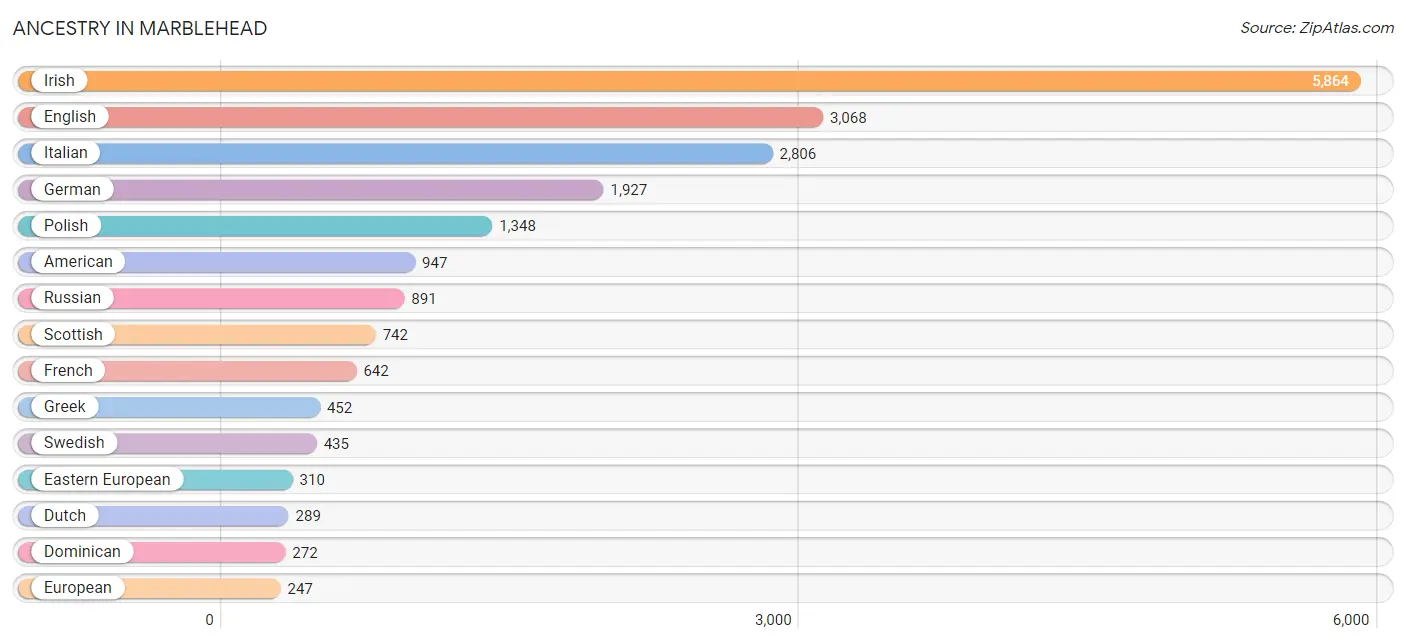
Ancestry in Marblehead
The most populous ancestries reported in Marblehead are Irish (5,864 | 28.8%), English (3,068 | 15.1%), Italian (2,806 | 13.8%), German (1,927 | 9.5%), and Polish (1,348 | 6.6%), together accounting for 73.8% of all Marblehead residents.
| Ancestry | # Population | % Population |
| African | 162 | 0.8% |
| Alaska Native | 13 | 0.1% |
| American | 947 | 4.6% |
| Arab | 123 | 0.6% |
| Argentinean | 29 | 0.1% |
| Armenian | 25 | 0.1% |
| Austrian | 114 | 0.6% |
| Basque | 15 | 0.1% |
| Belgian | 14 | 0.1% |
| Bhutanese | 40 | 0.2% |
| Brazilian | 114 | 0.6% |
| British | 115 | 0.6% |
| Bulgarian | 40 | 0.2% |
| Burmese | 37 | 0.2% |
| Canadian | 77 | 0.4% |
| Celtic | 9 | 0.0% |
| Central American | 49 | 0.2% |
| Central American Indian | 15 | 0.1% |
| Colombian | 15 | 0.1% |
| Costa Rican | 29 | 0.1% |
| Cuban | 38 | 0.2% |
| Czech | 78 | 0.4% |
| Danish | 90 | 0.4% |
| Dominican | 272 | 1.3% |
| Dutch | 289 | 1.4% |
| Eastern European | 310 | 1.5% |
| English | 3,068 | 15.1% |
| European | 247 | 1.2% |
| Finnish | 43 | 0.2% |
| French | 642 | 3.2% |
| French Canadian | 239 | 1.2% |
| German | 1,927 | 9.5% |
| Greek | 452 | 2.2% |
| Guatemalan | 20 | 0.1% |
| Hungarian | 68 | 0.3% |
| Indian (Asian) | 108 | 0.5% |
| Iranian | 24 | 0.1% |
| Irish | 5,864 | 28.8% |
| Italian | 2,806 | 13.8% |
| Japanese | 23 | 0.1% |
| Korean | 58 | 0.3% |
| Laotian | 22 | 0.1% |
| Latvian | 108 | 0.5% |
| Lebanese | 33 | 0.2% |
| Lithuanian | 170 | 0.8% |
| Mexican | 8 | 0.0% |
| Moroccan | 75 | 0.4% |
| Northern European | 33 | 0.2% |
| Norwegian | 139 | 0.7% |
| Peruvian | 16 | 0.1% |
| Polish | 1,348 | 6.6% |
| Portuguese | 218 | 1.1% |
| Puerto Rican | 111 | 0.5% |
| Romanian | 14 | 0.1% |
| Russian | 891 | 4.4% |
| Scandinavian | 35 | 0.2% |
| Scotch-Irish | 126 | 0.6% |
| Scottish | 742 | 3.6% |
| Serbian | 27 | 0.1% |
| Slavic | 15 | 0.1% |
| Slovak | 18 | 0.1% |
| South American | 60 | 0.3% |
| South American Indian | 16 | 0.1% |
| Spaniard | 71 | 0.4% |
| Spanish | 51 | 0.3% |
| Sri Lankan | 26 | 0.1% |
| Subsaharan African | 162 | 0.8% |
| Swedish | 435 | 2.1% |
| Swiss | 114 | 0.6% |
| Thai | 33 | 0.2% |
| Ukrainian | 117 | 0.6% |
| Welsh | 80 | 0.4% | View All 72 Rows |
Immigrants in Marblehead
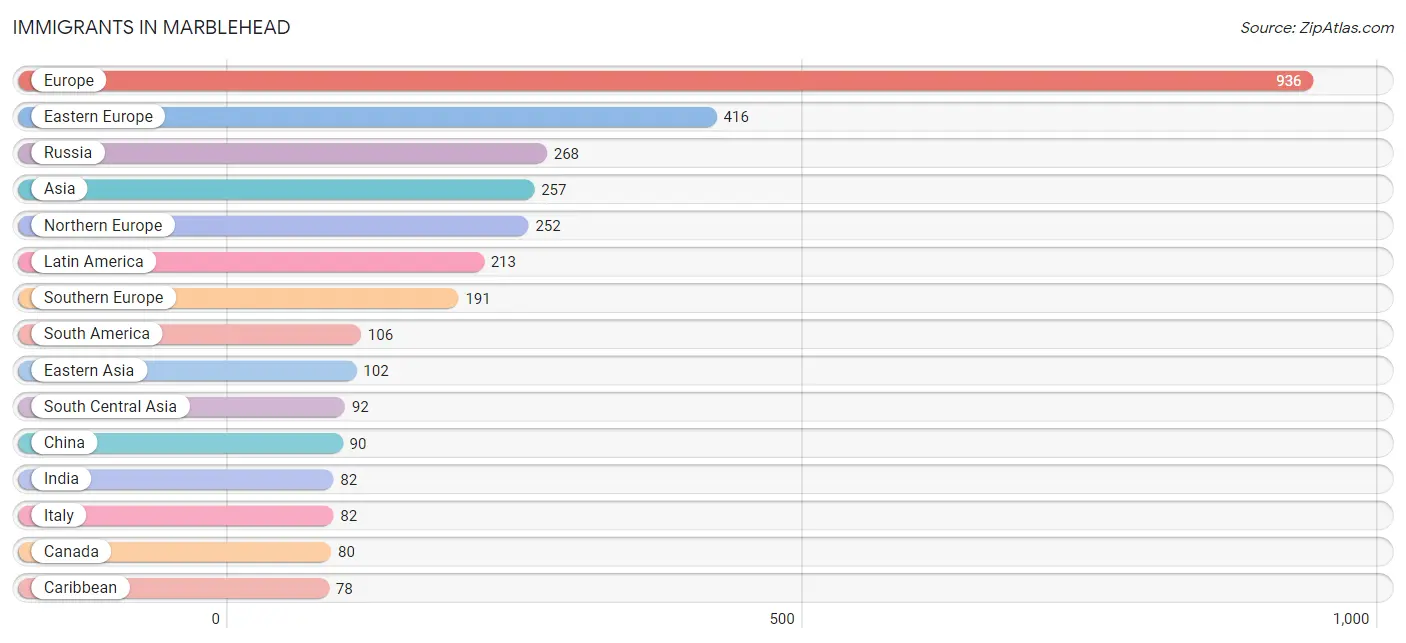
The most numerous immigrant groups reported in Marblehead came from Europe (936 | 4.6%), Eastern Europe (416 | 2.0%), Russia (268 | 1.3%), Asia (257 | 1.3%), and Northern Europe (252 | 1.2%), together accounting for 10.5% of all Marblehead residents.
| Immigration Origin | # Population | % Population |
| Africa | 64 | 0.3% |
| Argentina | 42 | 0.2% |
| Asia | 257 | 1.3% |
| Brazil | 33 | 0.2% |
| Bulgaria | 39 | 0.2% |
| Canada | 80 | 0.4% |
| Caribbean | 78 | 0.4% |
| Central America | 29 | 0.1% |
| China | 90 | 0.4% |
| Colombia | 15 | 0.1% |
| Costa Rica | 29 | 0.1% |
| Dominican Republic | 78 | 0.4% |
| Eastern Asia | 102 | 0.5% |
| Eastern Europe | 416 | 2.0% |
| England | 74 | 0.4% |
| Europe | 936 | 4.6% |
| Germany | 22 | 0.1% |
| Greece | 76 | 0.4% |
| India | 82 | 0.4% |
| Indonesia | 18 | 0.1% |
| Iran | 10 | 0.1% |
| Ireland | 40 | 0.2% |
| Italy | 82 | 0.4% |
| Japan | 12 | 0.1% |
| Latin America | 213 | 1.1% |
| Netherlands | 35 | 0.2% |
| Northern Africa | 13 | 0.1% |
| Northern Europe | 252 | 1.2% |
| Norway | 9 | 0.0% |
| Peru | 16 | 0.1% |
| Philippines | 15 | 0.1% |
| Poland | 9 | 0.0% |
| Russia | 268 | 1.3% |
| South America | 106 | 0.5% |
| South Central Asia | 92 | 0.4% |
| South Eastern Asia | 52 | 0.3% |
| Southern Europe | 191 | 0.9% |
| Spain | 33 | 0.2% |
| Sweden | 33 | 0.2% |
| Switzerland | 20 | 0.1% |
| Thailand | 6 | 0.0% |
| Turkey | 11 | 0.1% |
| Ukraine | 73 | 0.4% |
| Vietnam | 13 | 0.1% |
| Western Asia | 11 | 0.1% |
| Western Europe | 77 | 0.4% | View All 46 Rows |
Sex and Age in Marblehead
Sex and Age in Marblehead
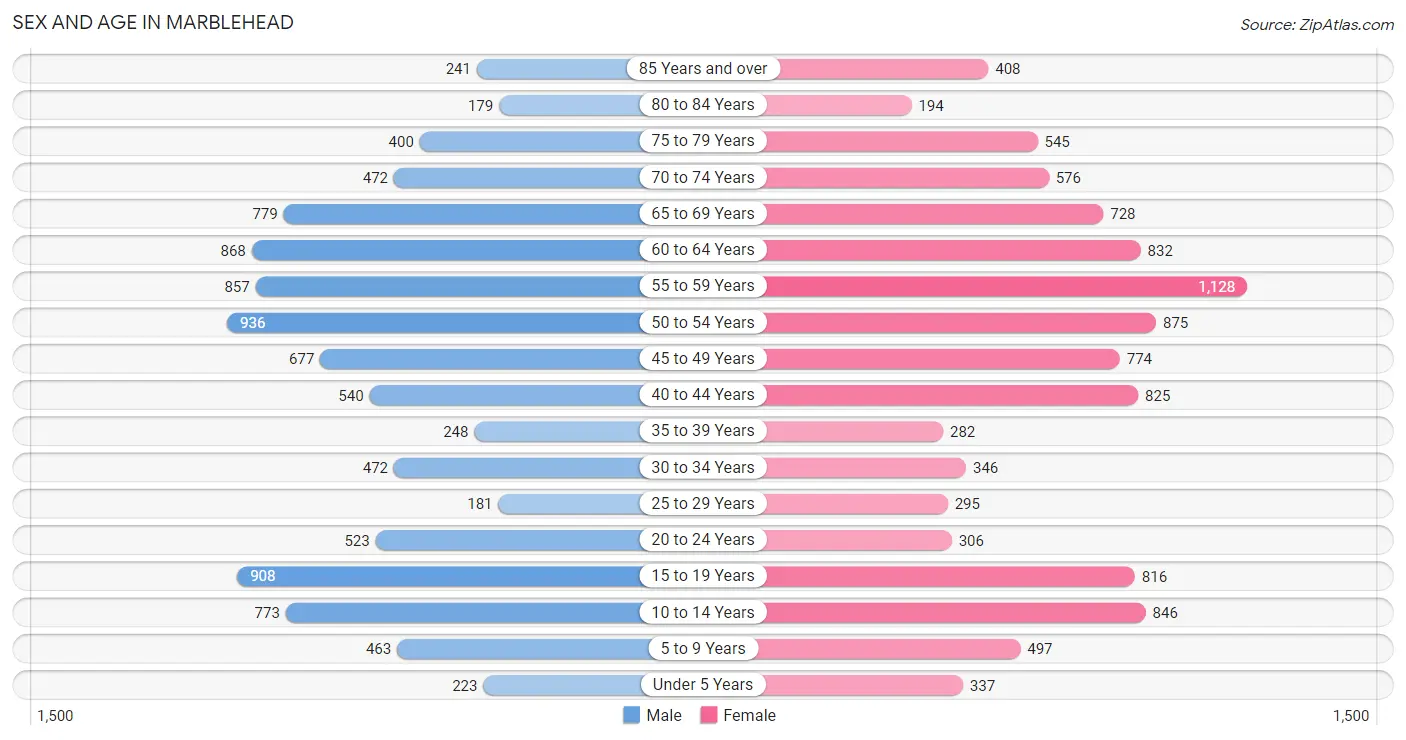
The most populous age groups in Marblehead are 50 to 54 Years (936 | 9.6%) for men and 55 to 59 Years (1,128 | 10.6%) for women.
| Age Bracket | Male | Female |
| Under 5 Years | 223 (2.3%) | 337 (3.2%) |
| 5 to 9 Years | 463 (4.8%) | 497 (4.7%) |
| 10 to 14 Years | 773 (7.9%) | 846 (8.0%) |
| 15 to 19 Years | 908 (9.3%) | 816 (7.7%) |
| 20 to 24 Years | 523 (5.4%) | 306 (2.9%) |
| 25 to 29 Years | 181 (1.9%) | 295 (2.8%) |
| 30 to 34 Years | 472 (4.9%) | 346 (3.3%) |
| 35 to 39 Years | 248 (2.5%) | 282 (2.7%) |
| 40 to 44 Years | 540 (5.5%) | 825 (7.8%) |
| 45 to 49 Years | 677 (7.0%) | 774 (7.3%) |
| 50 to 54 Years | 936 (9.6%) | 875 (8.3%) |
| 55 to 59 Years | 857 (8.8%) | 1,128 (10.6%) |
| 60 to 64 Years | 868 (8.9%) | 832 (7.8%) |
| 65 to 69 Years | 779 (8.0%) | 728 (6.9%) |
| 70 to 74 Years | 472 (4.9%) | 576 (5.4%) |
| 75 to 79 Years | 400 (4.1%) | 545 (5.1%) |
| 80 to 84 Years | 179 (1.8%) | 194 (1.8%) |
| 85 Years and over | 241 (2.5%) | 408 (3.8%) |
| Total | 9,740 (100.0%) | 10,610 (100.0%) |
Families and Households in Marblehead
Median Family Size in Marblehead
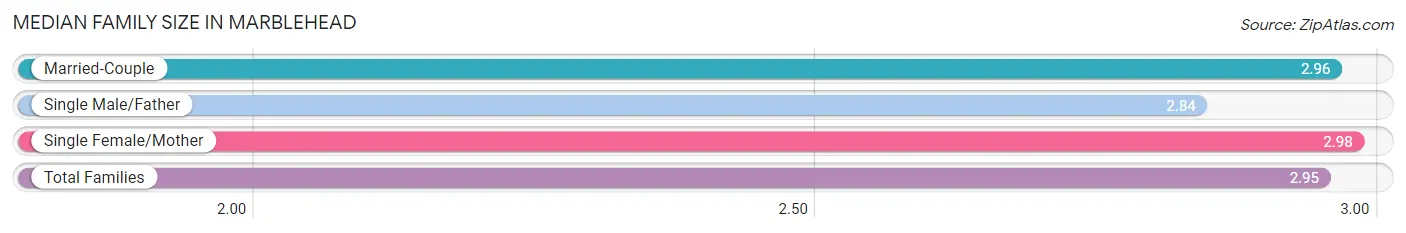
The median family size in Marblehead is 2.95 persons per family, with single female/mother families (648 | 10.8%) accounting for the largest median family size of 2.98 persons per family. On the other hand, single male/father families (223 | 3.7%) represent the smallest median family size with 2.84 persons per family.
| Family Type | # Families | Family Size |
| Married-Couple | 5,135 (85.5%) | 2.96 |
| Single Male/Father | 223 (3.7%) | 2.84 |
| Single Female/Mother | 648 (10.8%) | 2.98 |
| Total Families | 6,006 (100.0%) | 2.95 |
Median Household Size in Marblehead
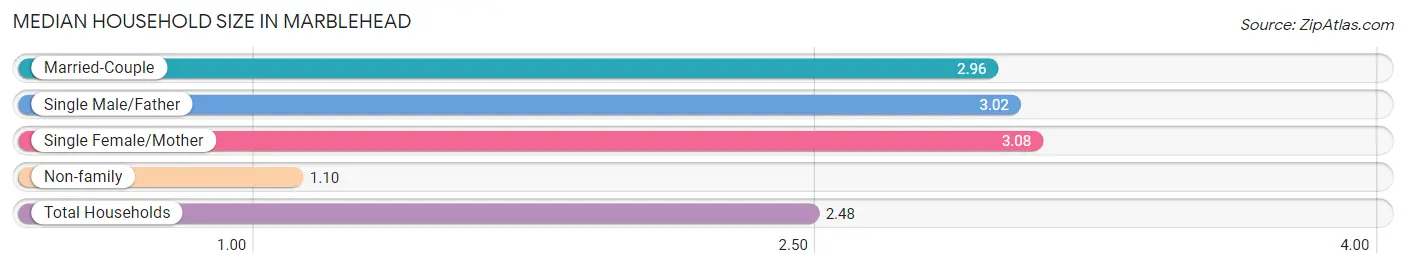
The median household size in Marblehead is 2.48 persons per household, with single female/mother households (648 | 7.9%) accounting for the largest median household size of 3.08 persons per household. non-family households (2,166 | 26.5%) represent the smallest median household size with 1.10 persons per household.
| Household Type | # Households | Household Size |
| Married-Couple | 5,135 (62.8%) | 2.96 |
| Single Male/Father | 223 (2.7%) | 3.02 |
| Single Female/Mother | 648 (7.9%) | 3.08 |
| Non-family | 2,166 (26.5%) | 1.10 |
| Total Households | 8,172 (100.0%) | 2.48 |
Household Size by Marriage Status in Marblehead
Out of a total of 8,172 households in Marblehead, 6,006 (73.5%) are family households, while 2,166 (26.5%) are nonfamily households. The most numerous type of family households are 2-person households, comprising 2,828, and the most common type of nonfamily households are 1-person households, comprising 1,959.
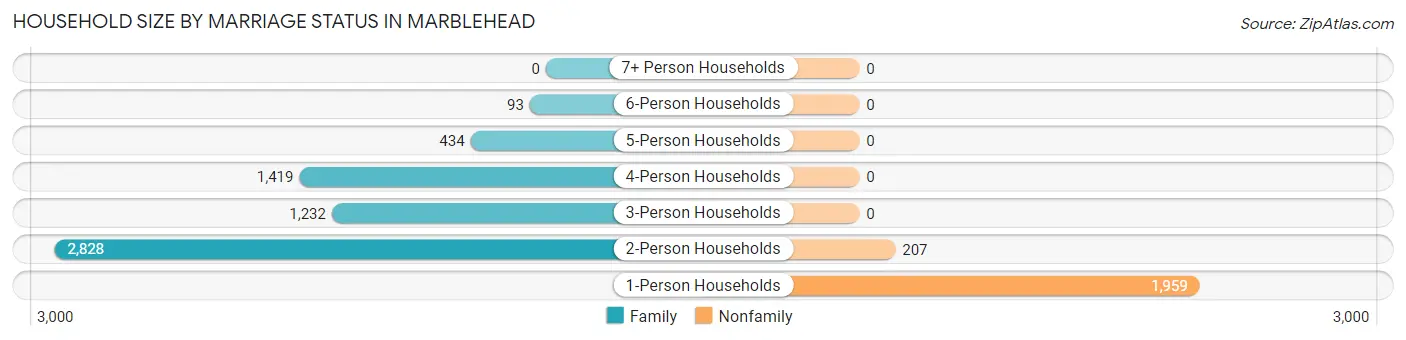
| Household Size | Family Households | Nonfamily Households |
| 1-Person Households | - | 1,959 (24.0%) |
| 2-Person Households | 2,828 (34.6%) | 207 (2.5%) |
| 3-Person Households | 1,232 (15.1%) | 0 (0.0%) |
| 4-Person Households | 1,419 (17.4%) | 0 (0.0%) |
| 5-Person Households | 434 (5.3%) | 0 (0.0%) |
| 6-Person Households | 93 (1.1%) | 0 (0.0%) |
| 7+ Person Households | 0 (0.0%) | 0 (0.0%) |
| Total | 6,006 (73.5%) | 2,166 (26.5%) |
Female Fertility in Marblehead
Fertility by Age in Marblehead
Average fertility rate in Marblehead is 25.0 births per 1,000 women. Women in the age bracket of 20 to 34 years have the highest fertility rate with 46.0 births per 1,000 women. Women in the age bracket of 35 to 50 years acount for 53.7% of all women with births.
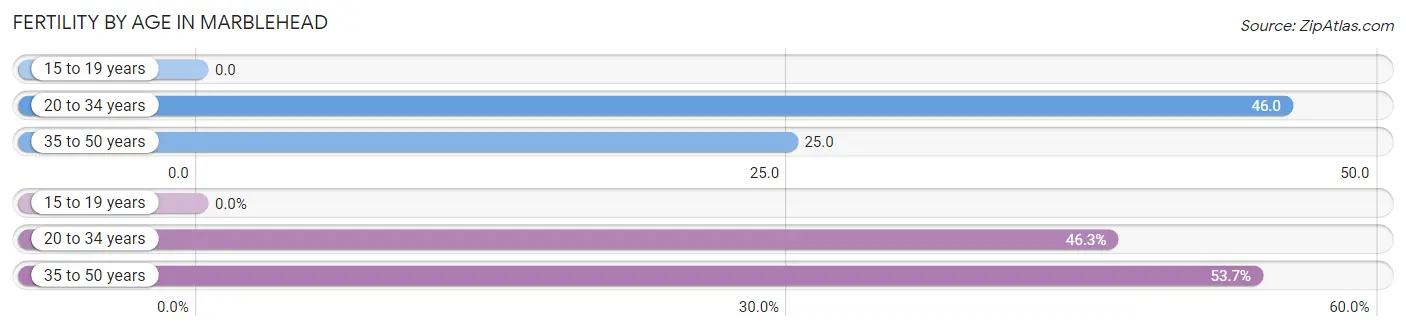
| Age Bracket | Women with Births | Births / 1,000 Women |
| 15 to 19 years | 0 (0.0%) | 0.0 |
| 20 to 34 years | 44 (46.3%) | 46.0 |
| 35 to 50 years | 51 (53.7%) | 25.0 |
| Total | 95 (100.0%) | 25.0 |
Fertility by Age by Marriage Status in Marblehead
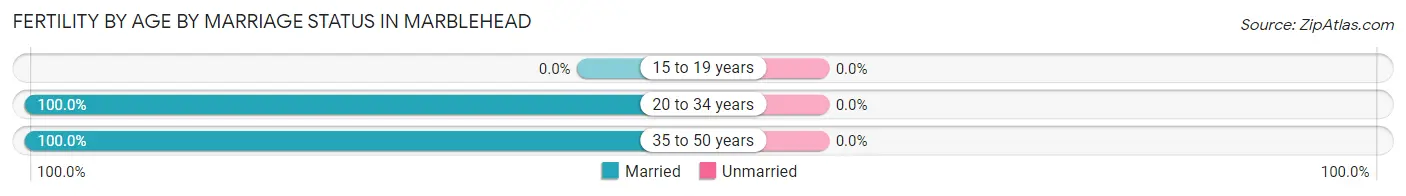
| Age Bracket | Married | Unmarried |
| 15 to 19 years | 0 (0.0%) | 0 (0.0%) |
| 20 to 34 years | 44 (100.0%) | 0 (0.0%) |
| 35 to 50 years | 51 (100.0%) | 0 (0.0%) |
| Total | 95 (100.0%) | 0 (0.0%) |
Fertility by Education in Marblehead
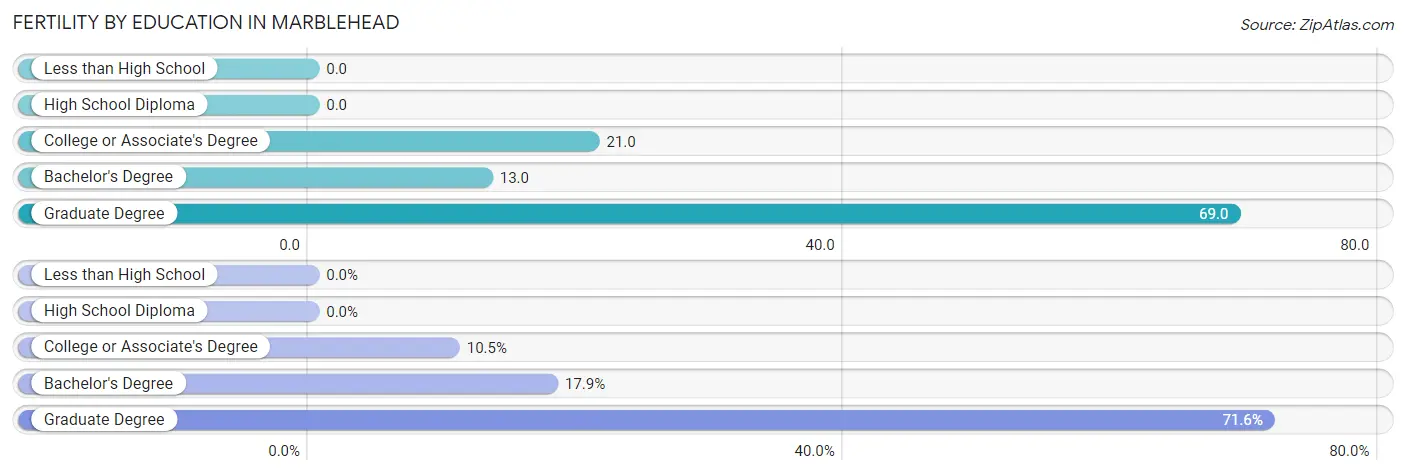
| Educational Attainment | Women with Births | Births / 1,000 Women |
| Less than High School | 0 (0.0%) | 0.0 |
| High School Diploma | 0 (0.0%) | 0.0 |
| College or Associate's Degree | 10 (10.5%) | 21.0 |
| Bachelor's Degree | 17 (17.9%) | 13.0 |
| Graduate Degree | 68 (71.6%) | 69.0 |
| Total | 95 (100.0%) | 25.0 |
Fertility by Education by Marriage Status in Marblehead
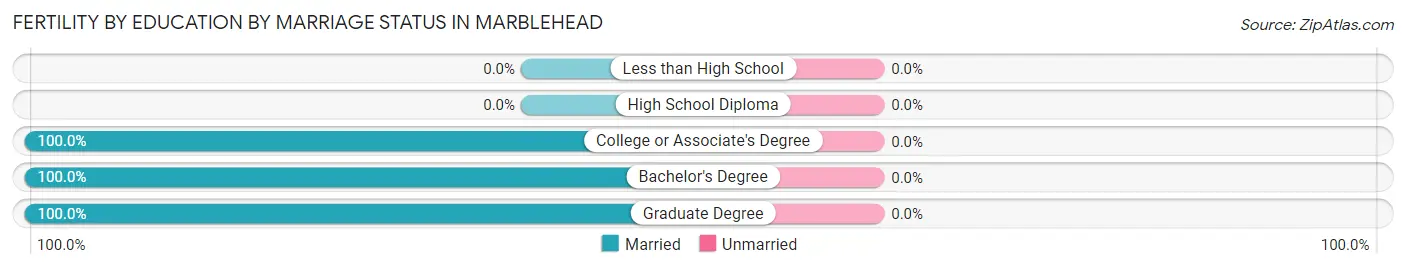
| Educational Attainment | Married | Unmarried |
| Less than High School | 0 (0.0%) | 0 (0.0%) |
| High School Diploma | 0 (0.0%) | 0 (0.0%) |
| College or Associate's Degree | 10 (100.0%) | 0 (0.0%) |
| Bachelor's Degree | 17 (100.0%) | 0 (0.0%) |
| Graduate Degree | 68 (100.0%) | 0 (0.0%) |
| Total | 95 (100.0%) | 0 (0.0%) |
Employment Characteristics in Marblehead
Employment by Class of Employer in Marblehead
Among the 10,306 employed individuals in Marblehead, private company employees (6,263 | 60.8%), not-for-profit organizations (1,234 | 12.0%), and self-employed (not incorporated) (1,049 | 10.2%) make up the most common classes of employment.
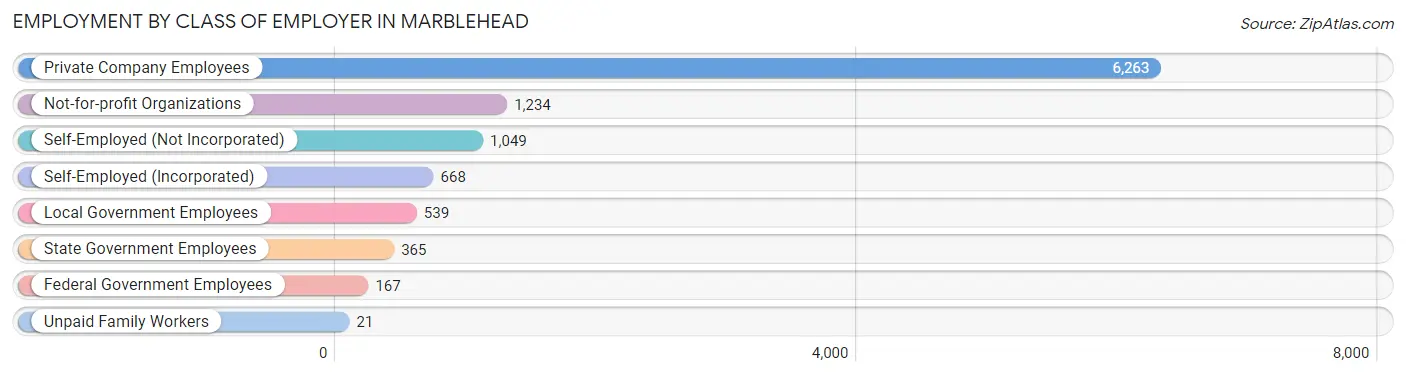
| Employer Class | # Employees | % Employees |
| Private Company Employees | 6,263 | 60.8% |
| Self-Employed (Incorporated) | 668 | 6.5% |
| Self-Employed (Not Incorporated) | 1,049 | 10.2% |
| Not-for-profit Organizations | 1,234 | 12.0% |
| Local Government Employees | 539 | 5.2% |
| State Government Employees | 365 | 3.5% |
| Federal Government Employees | 167 | 1.6% |
| Unpaid Family Workers | 21 | 0.2% |
| Total | 10,306 | 100.0% |
Employment Status by Age in Marblehead
According to the labor force statistics for Marblehead, out of the total population over 16 years of age (16,899), 66.0% or 11,153 individuals are in the labor force, with 3.3% or 368 of them unemployed. The age group with the highest labor force participation rate is 30 to 34 years, with 96.3% or 788 individuals in the labor force. Within the labor force, the 20 to 24 years age range has the highest percentage of unemployed individuals, with 21.9% or 141 of them being unemployed.
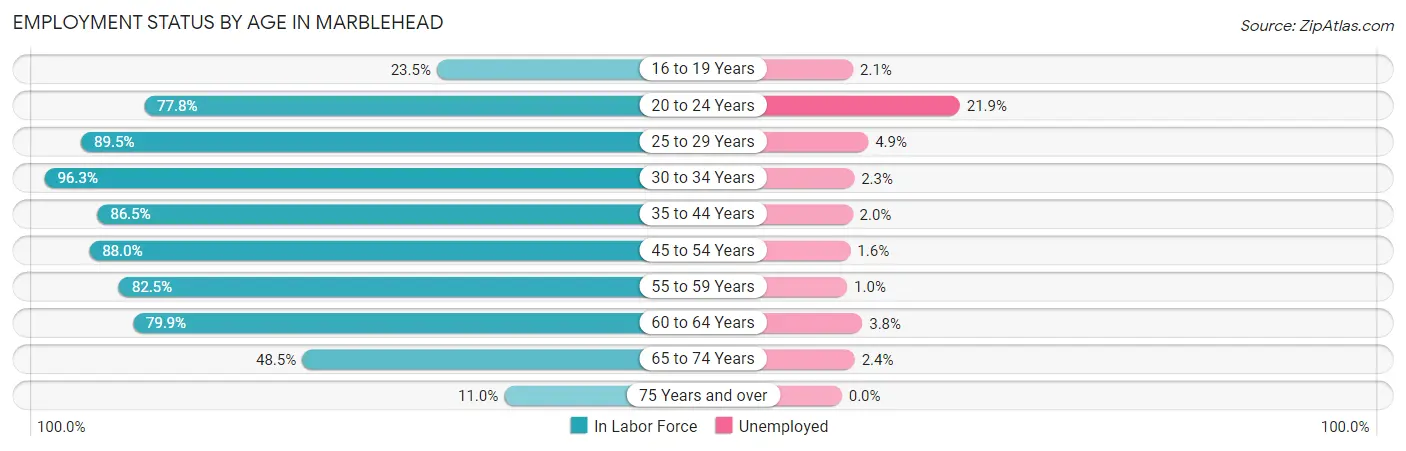
| Age Bracket | In Labor Force | Unemployed |
| 16 to 19 Years | 332 (23.5%) | 7 (2.1%) |
| 20 to 24 Years | 645 (77.8%) | 141 (21.9%) |
| 25 to 29 Years | 426 (89.5%) | 21 (4.9%) |
| 30 to 34 Years | 788 (96.3%) | 18 (2.3%) |
| 35 to 44 Years | 1,639 (86.5%) | 33 (2.0%) |
| 45 to 54 Years | 2,871 (88.0%) | 46 (1.6%) |
| 55 to 59 Years | 1,638 (82.5%) | 16 (1.0%) |
| 60 to 64 Years | 1,358 (79.9%) | 52 (3.8%) |
| 65 to 74 Years | 1,239 (48.5%) | 30 (2.4%) |
| 75 Years and over | 216 (11.0%) | 0 (0.0%) |
| Total | 11,153 (66.0%) | 368 (3.3%) |
Employment Status by Educational Attainment in Marblehead
According to labor force statistics for Marblehead, 86.0% of individuals (8,717) out of the total population between 25 and 64 years of age (10,136) are in the labor force, with 2.1% or 183 of them being unemployed. The group with the highest labor force participation rate are those with the educational attainment of less than high school, with 89.3% or 67 individuals in the labor force. Within the labor force, individuals with bachelor's degree or higher education have the highest percentage of unemployment, with 2.4% or 172 of them being unemployed.
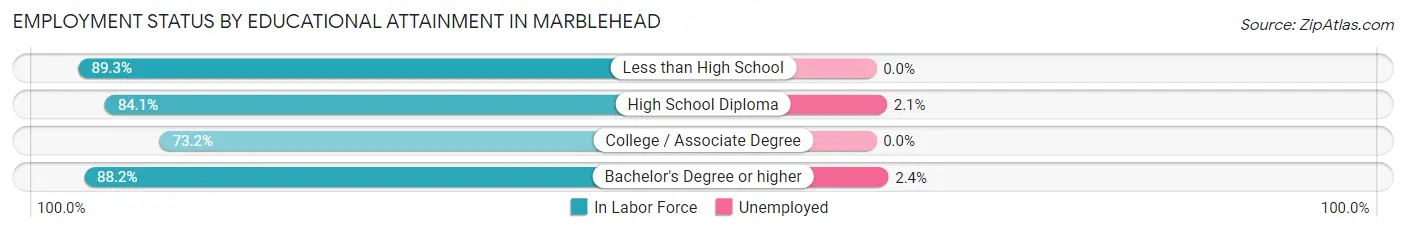
| Educational Attainment | In Labor Force | Unemployed |
| Less than High School | 67 (89.3%) | 0 (0.0%) |
| High School Diploma | 533 (84.1%) | 13 (2.1%) |
| College / Associate Degree | 964 (73.2%) | 0 (0.0%) |
| Bachelor's Degree or higher | 7,153 (88.2%) | 195 (2.4%) |
| Total | 8,717 (86.0%) | 213 (2.1%) |
Employment Occupations by Sex in Marblehead
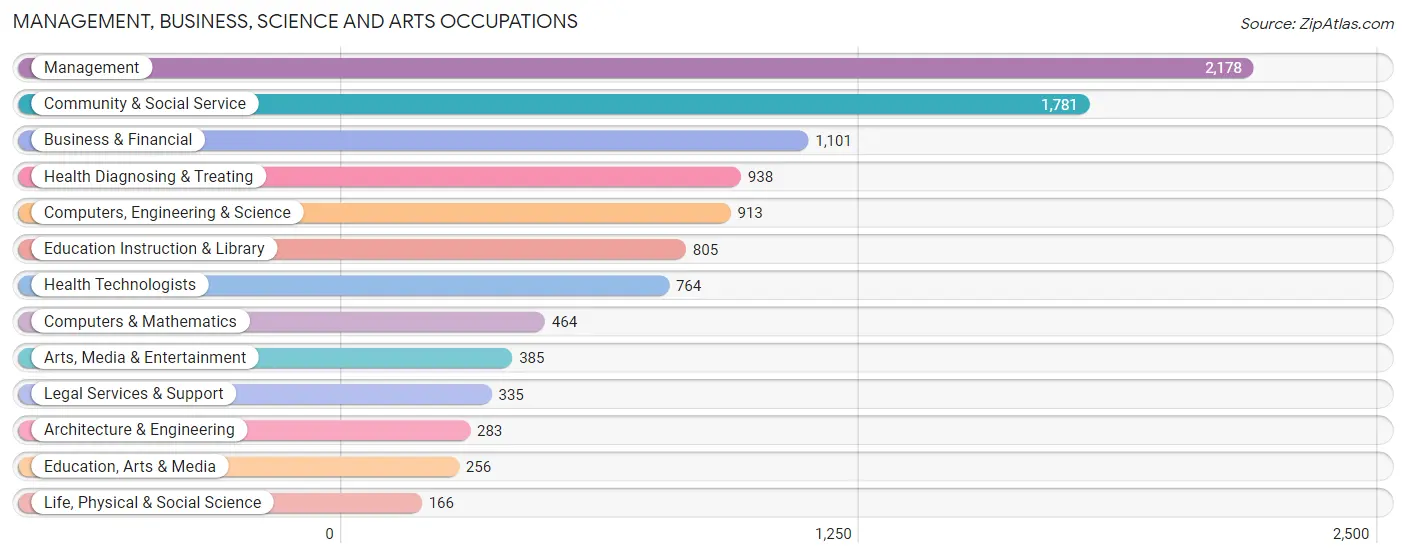
Management, Business, Science and Arts Occupations
The most common Management, Business, Science and Arts occupations in Marblehead are Management (2,178 | 20.2%), Community & Social Service (1,781 | 16.5%), Business & Financial (1,101 | 10.2%), Health Diagnosing & Treating (938 | 8.7%), and Computers, Engineering & Science (913 | 8.5%).
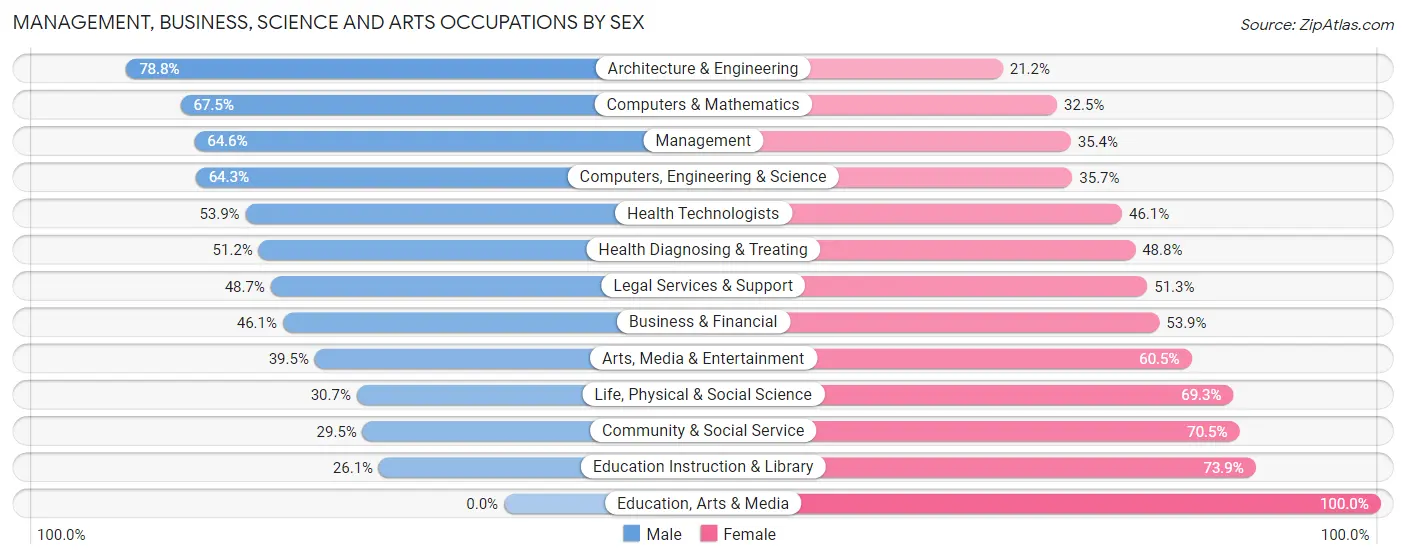
Management, Business, Science and Arts Occupations by Sex
Within the Management, Business, Science and Arts occupations in Marblehead, the most male-oriented occupations are Architecture & Engineering (78.8%), Computers & Mathematics (67.5%), and Management (64.6%), while the most female-oriented occupations are Education, Arts & Media (100.0%), Education Instruction & Library (73.9%), and Community & Social Service (70.5%).
| Occupation | Male | Female |
| Management | 1,407 (64.6%) | 771 (35.4%) |
| Business & Financial | 508 (46.1%) | 593 (53.9%) |
| Computers, Engineering & Science | 587 (64.3%) | 326 (35.7%) |
| Computers & Mathematics | 313 (67.5%) | 151 (32.5%) |
| Architecture & Engineering | 223 (78.8%) | 60 (21.2%) |
| Life, Physical & Social Science | 51 (30.7%) | 115 (69.3%) |
| Community & Social Service | 525 (29.5%) | 1,256 (70.5%) |
| Education, Arts & Media | 0 (0.0%) | 256 (100.0%) |
| Legal Services & Support | 163 (48.7%) | 172 (51.3%) |
| Education Instruction & Library | 210 (26.1%) | 595 (73.9%) |
| Arts, Media & Entertainment | 152 (39.5%) | 233 (60.5%) |
| Health Diagnosing & Treating | 480 (51.2%) | 458 (48.8%) |
| Health Technologists | 412 (53.9%) | 352 (46.1%) |
| Total (Category) | 3,507 (50.7%) | 3,404 (49.2%) |
| Total (Overall) | 5,648 (52.4%) | 5,139 (47.6%) |
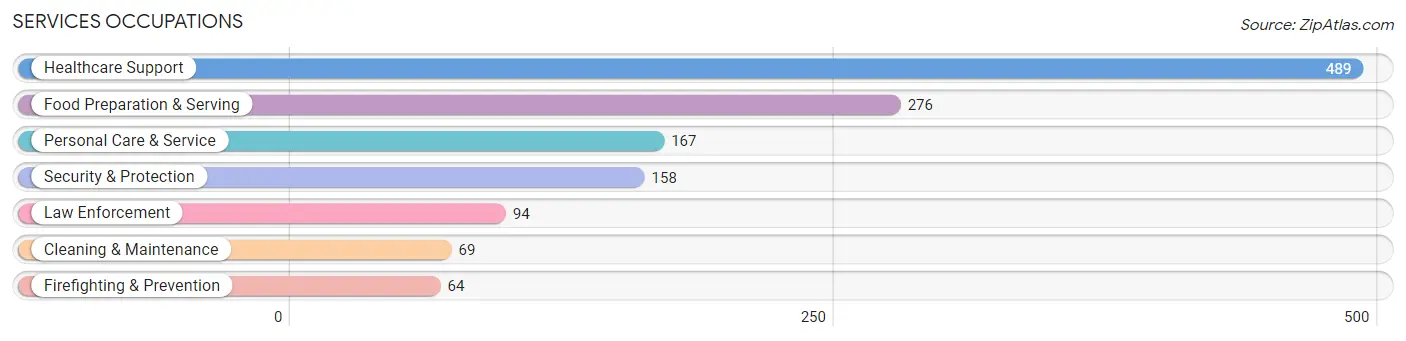
Services Occupations
The most common Services occupations in Marblehead are Healthcare Support (489 | 4.5%), Food Preparation & Serving (276 | 2.6%), Personal Care & Service (167 | 1.5%), Security & Protection (158 | 1.5%), and Law Enforcement (94 | 0.9%).
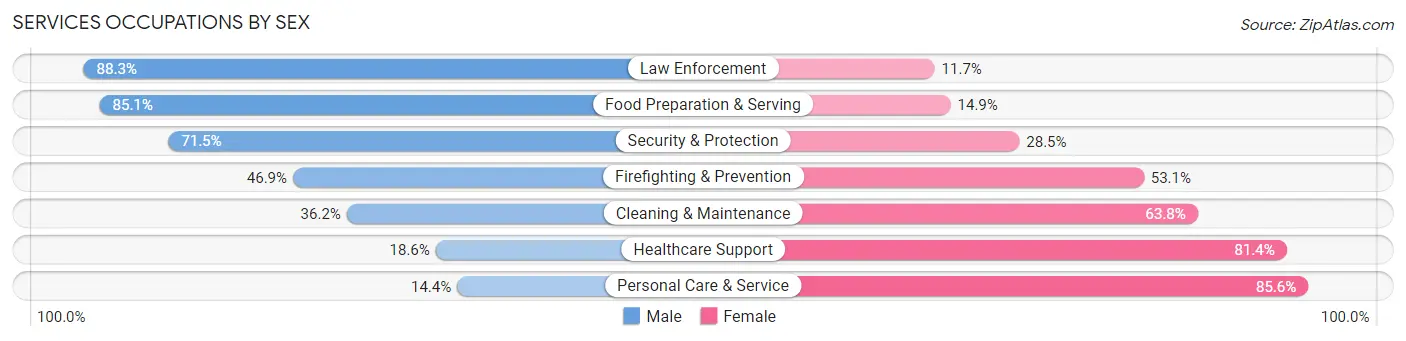
Services Occupations by Sex
Within the Services occupations in Marblehead, the most male-oriented occupations are Law Enforcement (88.3%), Food Preparation & Serving (85.1%), and Security & Protection (71.5%), while the most female-oriented occupations are Personal Care & Service (85.6%), Healthcare Support (81.4%), and Cleaning & Maintenance (63.8%).
| Occupation | Male | Female |
| Healthcare Support | 91 (18.6%) | 398 (81.4%) |
| Security & Protection | 113 (71.5%) | 45 (28.5%) |
| Firefighting & Prevention | 30 (46.9%) | 34 (53.1%) |
| Law Enforcement | 83 (88.3%) | 11 (11.7%) |
| Food Preparation & Serving | 235 (85.1%) | 41 (14.9%) |
| Cleaning & Maintenance | 25 (36.2%) | 44 (63.8%) |
| Personal Care & Service | 24 (14.4%) | 143 (85.6%) |
| Total (Category) | 488 (42.1%) | 671 (57.9%) |
| Total (Overall) | 5,648 (52.4%) | 5,139 (47.6%) |
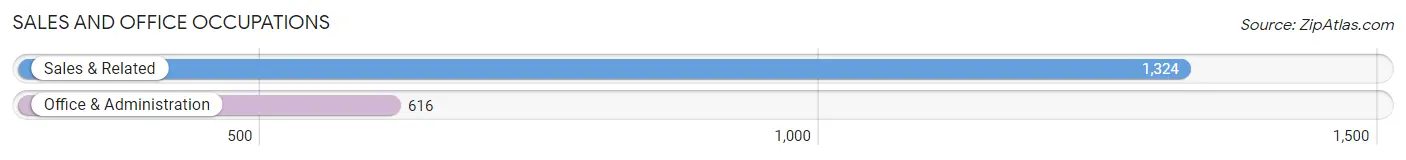
Sales and Office Occupations
The most common Sales and Office occupations in Marblehead are Sales & Related (1,324 | 12.3%), and Office & Administration (616 | 5.7%).
Sales and Office Occupations by Sex
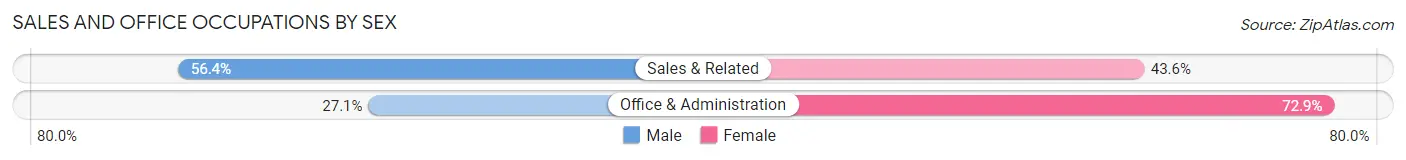
| Occupation | Male | Female |
| Sales & Related | 747 (56.4%) | 577 (43.6%) |
| Office & Administration | 167 (27.1%) | 449 (72.9%) |
| Total (Category) | 914 (47.1%) | 1,026 (52.9%) |
| Total (Overall) | 5,648 (52.4%) | 5,139 (47.6%) |
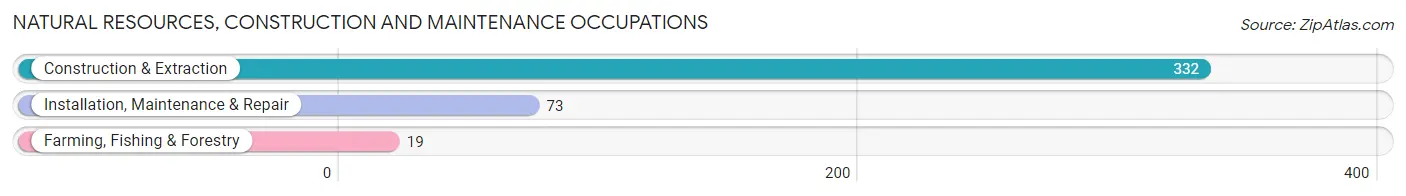
Natural Resources, Construction and Maintenance Occupations
The most common Natural Resources, Construction and Maintenance occupations in Marblehead are Construction & Extraction (332 | 3.1%), Installation, Maintenance & Repair (73 | 0.7%), and Farming, Fishing & Forestry (19 | 0.2%).
Natural Resources, Construction and Maintenance Occupations by Sex
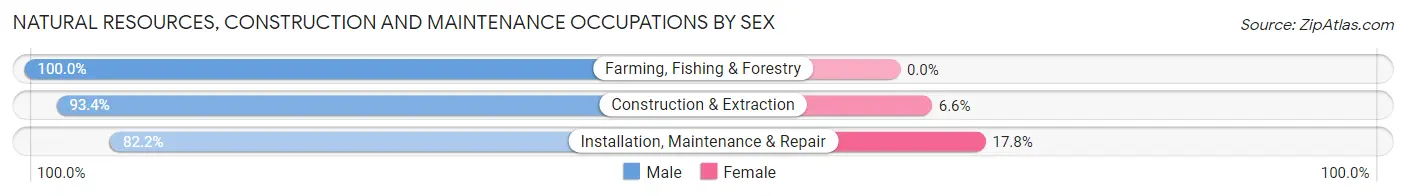
| Occupation | Male | Female |
| Farming, Fishing & Forestry | 19 (100.0%) | 0 (0.0%) |
| Construction & Extraction | 310 (93.4%) | 22 (6.6%) |
| Installation, Maintenance & Repair | 60 (82.2%) | 13 (17.8%) |
| Total (Category) | 389 (91.7%) | 35 (8.3%) |
| Total (Overall) | 5,648 (52.4%) | 5,139 (47.6%) |
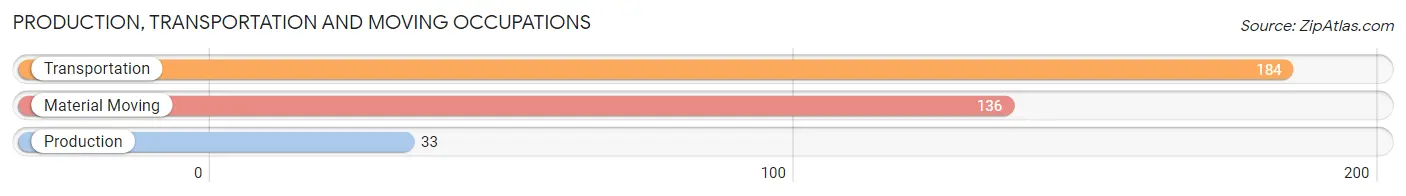
Production, Transportation and Moving Occupations
The most common Production, Transportation and Moving occupations in Marblehead are Transportation (184 | 1.7%), Material Moving (136 | 1.3%), and Production (33 | 0.3%).
Production, Transportation and Moving Occupations by Sex
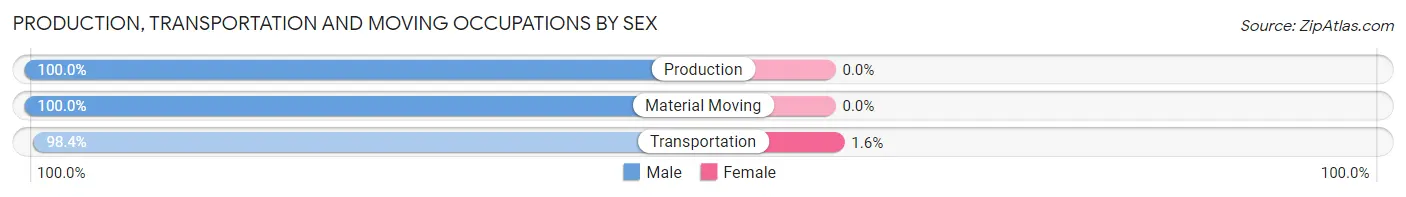
| Occupation | Male | Female |
| Production | 33 (100.0%) | 0 (0.0%) |
| Transportation | 181 (98.4%) | 3 (1.6%) |
| Material Moving | 136 (100.0%) | 0 (0.0%) |
| Total (Category) | 350 (99.2%) | 3 (0.9%) |
| Total (Overall) | 5,648 (52.4%) | 5,139 (47.6%) |
Employment Industries by Sex in Marblehead
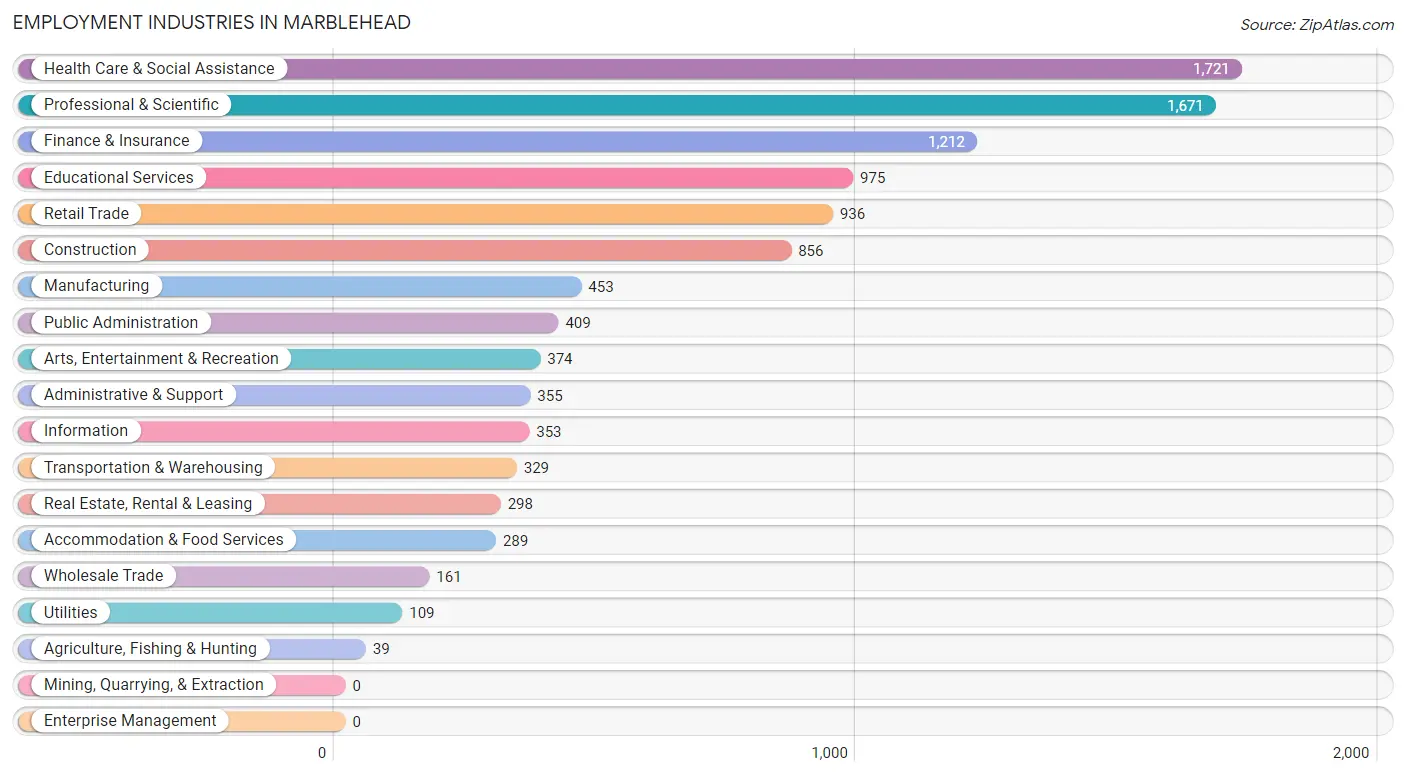
Employment Industries in Marblehead
The major employment industries in Marblehead include Health Care & Social Assistance (1,721 | 16.0%), Professional & Scientific (1,671 | 15.5%), Finance & Insurance (1,212 | 11.2%), Educational Services (975 | 9.0%), and Retail Trade (936 | 8.7%).
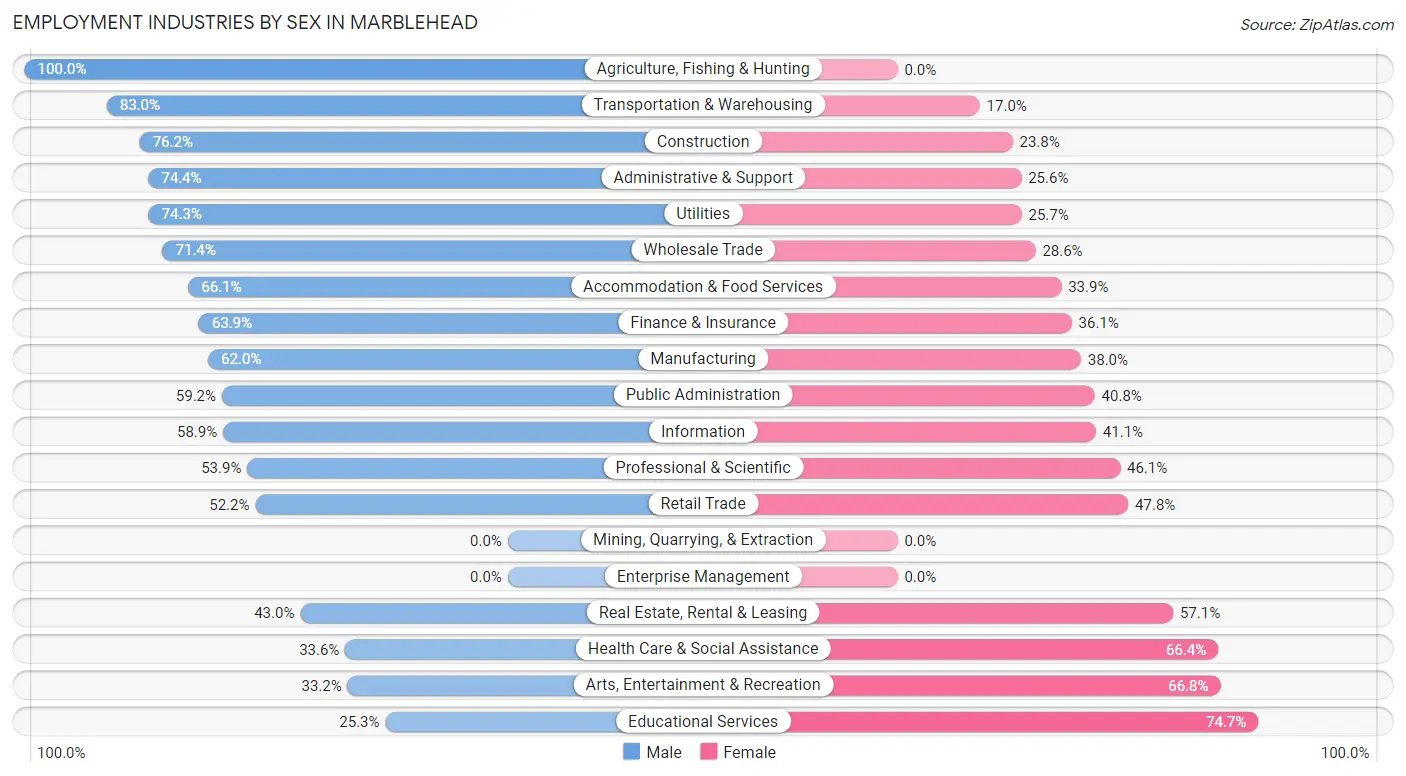
Employment Industries by Sex in Marblehead
The Marblehead industries that see more men than women are Agriculture, Fishing & Hunting (100.0%), Transportation & Warehousing (83.0%), and Construction (76.2%), whereas the industries that tend to have a higher number of women are Educational Services (74.7%), Arts, Entertainment & Recreation (66.8%), and Health Care & Social Assistance (66.4%).
| Industry | Male | Female |
| Agriculture, Fishing & Hunting | 39 (100.0%) | 0 (0.0%) |
| Mining, Quarrying, & Extraction | 0 (0.0%) | 0 (0.0%) |
| Construction | 652 (76.2%) | 204 (23.8%) |
| Manufacturing | 281 (62.0%) | 172 (38.0%) |
| Wholesale Trade | 115 (71.4%) | 46 (28.6%) |
| Retail Trade | 489 (52.2%) | 447 (47.8%) |
| Transportation & Warehousing | 273 (83.0%) | 56 (17.0%) |
| Utilities | 81 (74.3%) | 28 (25.7%) |
| Information | 208 (58.9%) | 145 (41.1%) |
| Finance & Insurance | 775 (63.9%) | 437 (36.1%) |
| Real Estate, Rental & Leasing | 128 (42.9%) | 170 (57.1%) |
| Professional & Scientific | 901 (53.9%) | 770 (46.1%) |
| Enterprise Management | 0 (0.0%) | 0 (0.0%) |
| Administrative & Support | 264 (74.4%) | 91 (25.6%) |
| Educational Services | 247 (25.3%) | 728 (74.7%) |
| Health Care & Social Assistance | 579 (33.6%) | 1,142 (66.4%) |
| Arts, Entertainment & Recreation | 124 (33.2%) | 250 (66.8%) |
| Accommodation & Food Services | 191 (66.1%) | 98 (33.9%) |
| Public Administration | 242 (59.2%) | 167 (40.8%) |
| Total | 5,648 (52.4%) | 5,139 (47.6%) |
Education in Marblehead
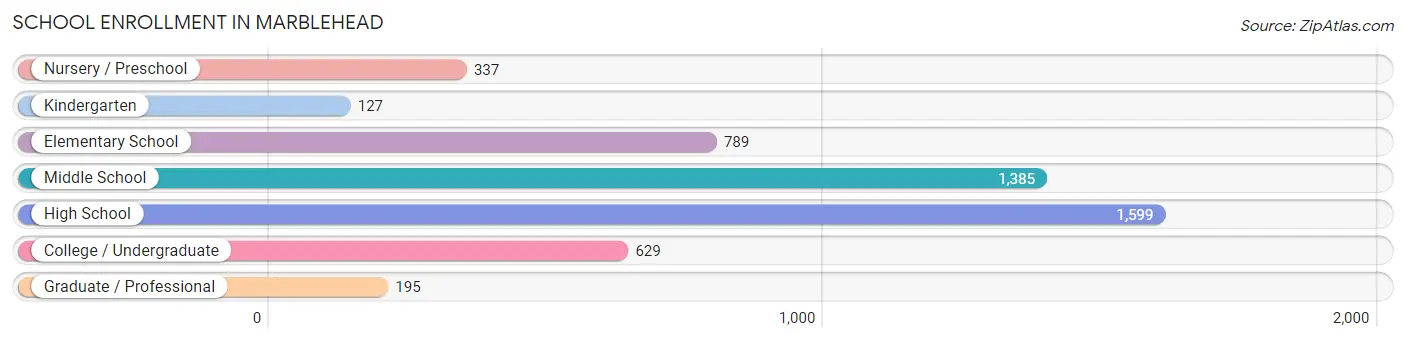
School Enrollment in Marblehead
The most common levels of schooling among the 5,061 students in Marblehead are high school (1,599 | 31.6%), middle school (1,385 | 27.4%), and elementary school (789 | 15.6%).
| School Level | # Students | % Students |
| Nursery / Preschool | 337 | 6.7% |
| Kindergarten | 127 | 2.5% |
| Elementary School | 789 | 15.6% |
| Middle School | 1,385 | 27.4% |
| High School | 1,599 | 31.6% |
| College / Undergraduate | 629 | 12.4% |
| Graduate / Professional | 195 | 3.8% |
| Total | 5,061 | 100.0% |
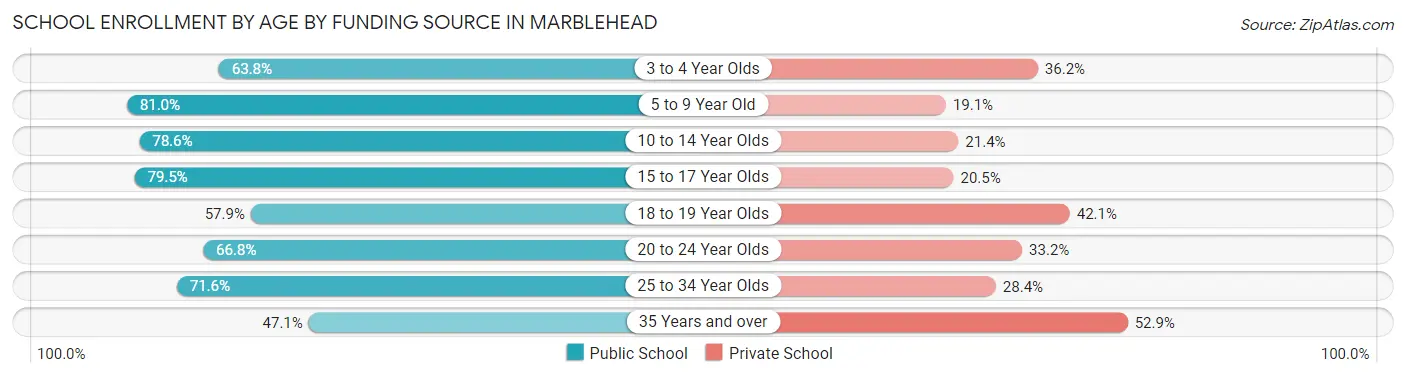
School Enrollment by Age by Funding Source in Marblehead
Out of a total of 5,061 students who are enrolled in schools in Marblehead, 1,291 (25.5%) attend a private institution, while the remaining 3,770 (74.5%) are enrolled in public schools. The age group of 35 years and over has the highest likelihood of being enrolled in private schools, with 137 (52.9% in the age bracket) enrolled. Conversely, the age group of 5 to 9 year old has the lowest likelihood of being enrolled in a private school, with 752 (80.9% in the age bracket) attending a public institution.
| Age Bracket | Public School | Private School |
| 3 to 4 Year Olds | 127 (63.8%) | 72 (36.2%) |
| 5 to 9 Year Old | 752 (80.9%) | 177 (19.1%) |
| 10 to 14 Year Olds | 1,273 (78.6%) | 346 (21.4%) |
| 15 to 17 Year Olds | 983 (79.5%) | 253 (20.5%) |
| 18 to 19 Year Olds | 235 (57.9%) | 171 (42.1%) |
| 20 to 24 Year Olds | 231 (66.8%) | 115 (33.2%) |
| 25 to 34 Year Olds | 48 (71.6%) | 19 (28.4%) |
| 35 Years and over | 122 (47.1%) | 137 (52.9%) |
| Total | 3,770 (74.5%) | 1,291 (25.5%) |
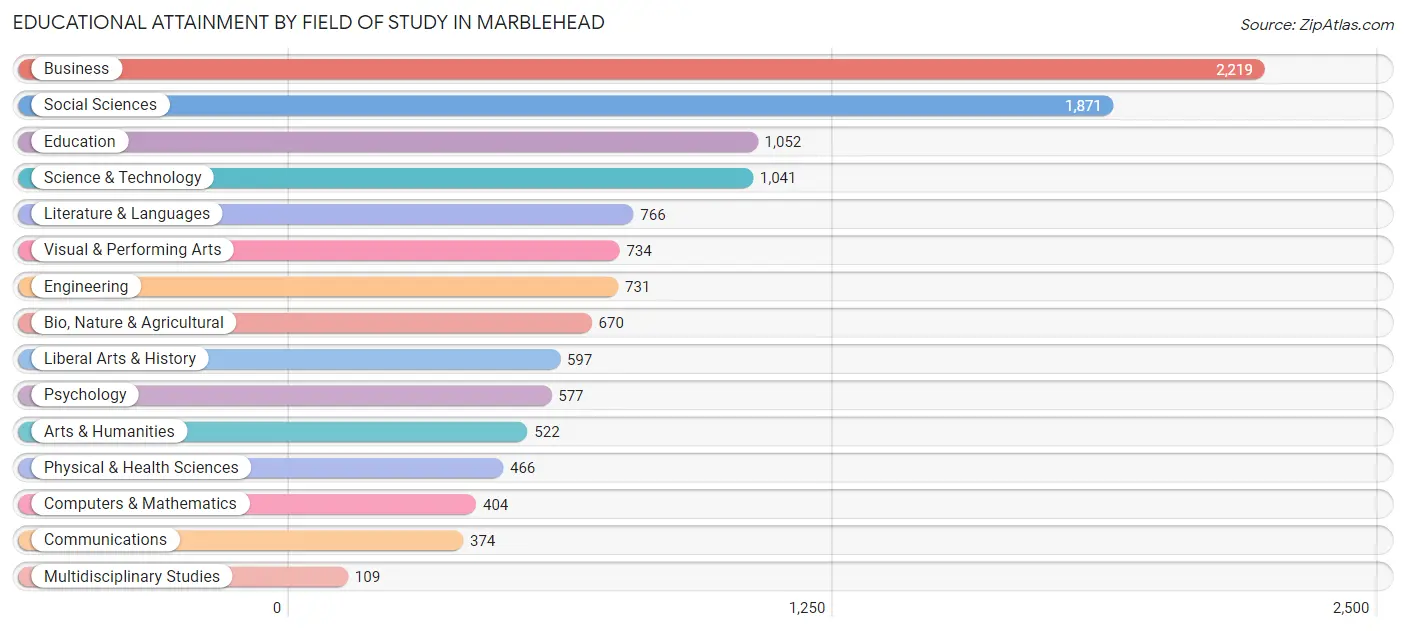
Educational Attainment by Field of Study in Marblehead
Business (2,219 | 18.3%), social sciences (1,871 | 15.4%), education (1,052 | 8.7%), science & technology (1,041 | 8.6%), and literature & languages (766 | 6.3%) are the most common fields of study among 12,133 individuals in Marblehead who have obtained a bachelor's degree or higher.
| Field of Study | # Graduates | % Graduates |
| Computers & Mathematics | 404 | 3.3% |
| Bio, Nature & Agricultural | 670 | 5.5% |
| Physical & Health Sciences | 466 | 3.8% |
| Psychology | 577 | 4.8% |
| Social Sciences | 1,871 | 15.4% |
| Engineering | 731 | 6.0% |
| Multidisciplinary Studies | 109 | 0.9% |
| Science & Technology | 1,041 | 8.6% |
| Business | 2,219 | 18.3% |
| Education | 1,052 | 8.7% |
| Literature & Languages | 766 | 6.3% |
| Liberal Arts & History | 597 | 4.9% |
| Visual & Performing Arts | 734 | 6.0% |
| Communications | 374 | 3.1% |
| Arts & Humanities | 522 | 4.3% |
| Total | 12,133 | 100.0% |
Transportation & Commute in Marblehead
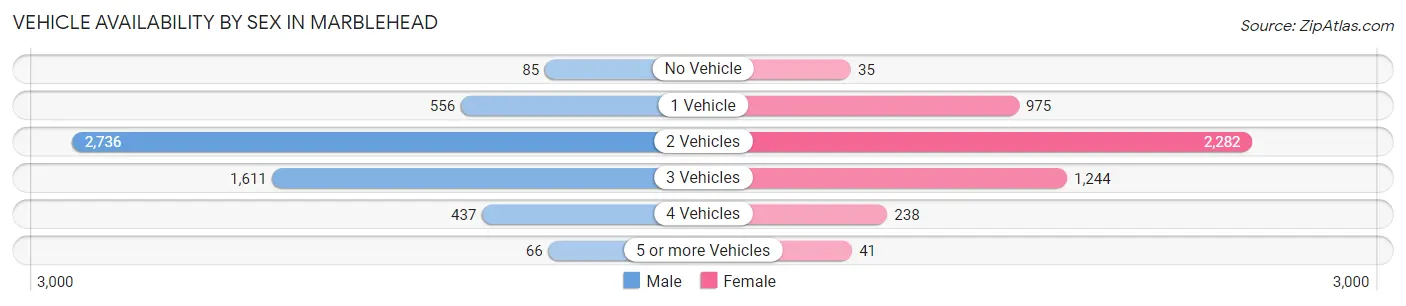
Vehicle Availability by Sex in Marblehead
The most prevalent vehicle ownership categories in Marblehead are males with 2 vehicles (2,736, accounting for 49.8%) and females with 2 vehicles (2,282, making up 56.8%).
| Vehicles Available | Male | Female |
| No Vehicle | 85 (1.5%) | 35 (0.7%) |
| 1 Vehicle | 556 (10.1%) | 975 (20.3%) |
| 2 Vehicles | 2,736 (49.8%) | 2,282 (47.4%) |
| 3 Vehicles | 1,611 (29.3%) | 1,244 (25.8%) |
| 4 Vehicles | 437 (8.0%) | 238 (4.9%) |
| 5 or more Vehicles | 66 (1.2%) | 41 (0.9%) |
| Total | 5,491 (100.0%) | 4,815 (100.0%) |
Commute Time in Marblehead
The most frequently occuring commute durations in Marblehead are 60 to 89 minutes (1,423 commuters, 19.0%), 5 to 9 minutes (1,023 commuters, 13.7%), and 10 to 14 minutes (1,002 commuters, 13.4%).
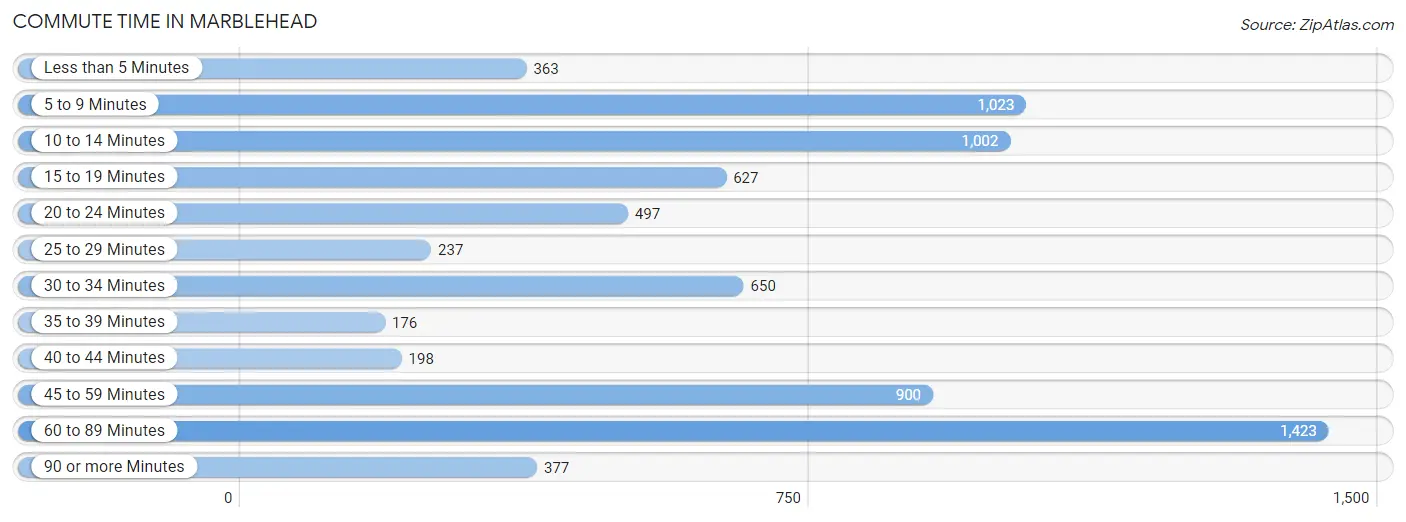
| Commute Time | # Commuters | % Commuters |
| Less than 5 Minutes | 363 | 4.9% |
| 5 to 9 Minutes | 1,023 | 13.7% |
| 10 to 14 Minutes | 1,002 | 13.4% |
| 15 to 19 Minutes | 627 | 8.4% |
| 20 to 24 Minutes | 497 | 6.7% |
| 25 to 29 Minutes | 237 | 3.2% |
| 30 to 34 Minutes | 650 | 8.7% |
| 35 to 39 Minutes | 176 | 2.4% |
| 40 to 44 Minutes | 198 | 2.6% |
| 45 to 59 Minutes | 900 | 12.0% |
| 60 to 89 Minutes | 1,423 | 19.0% |
| 90 or more Minutes | 377 | 5.0% |
Commute Time by Sex in Marblehead
The most common commute times in Marblehead are 60 to 89 minutes (850 commuters, 21.2%) for males and 60 to 89 minutes (573 commuters, 16.6%) for females.
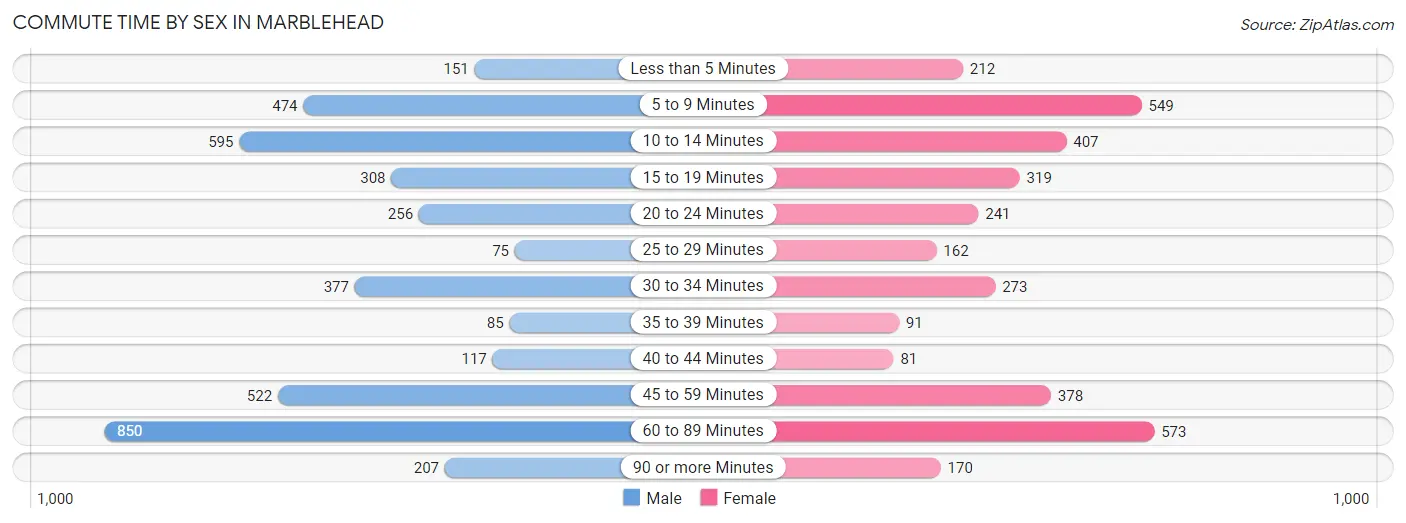
| Commute Time | Male | Female |
| Less than 5 Minutes | 151 (3.8%) | 212 (6.1%) |
| 5 to 9 Minutes | 474 (11.8%) | 549 (15.9%) |
| 10 to 14 Minutes | 595 (14.8%) | 407 (11.8%) |
| 15 to 19 Minutes | 308 (7.7%) | 319 (9.2%) |
| 20 to 24 Minutes | 256 (6.4%) | 241 (7.0%) |
| 25 to 29 Minutes | 75 (1.9%) | 162 (4.7%) |
| 30 to 34 Minutes | 377 (9.4%) | 273 (7.9%) |
| 35 to 39 Minutes | 85 (2.1%) | 91 (2.6%) |
| 40 to 44 Minutes | 117 (2.9%) | 81 (2.3%) |
| 45 to 59 Minutes | 522 (13.0%) | 378 (10.9%) |
| 60 to 89 Minutes | 850 (21.2%) | 573 (16.6%) |
| 90 or more Minutes | 207 (5.1%) | 170 (4.9%) |
Time of Departure to Work by Sex in Marblehead
The most frequent times of departure to work in Marblehead are 7:00 AM to 7:29 AM (977, 24.3%) for males and 7:30 AM to 7:59 AM (592, 17.1%) for females.
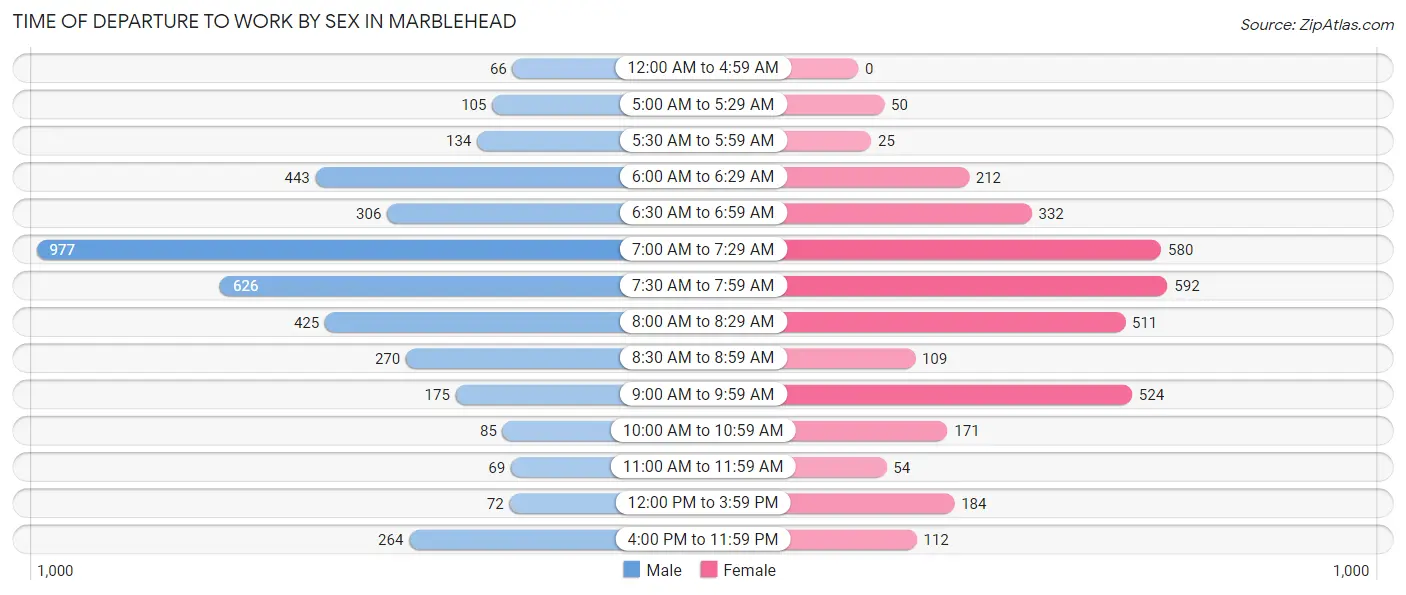
| Time of Departure | Male | Female |
| 12:00 AM to 4:59 AM | 66 (1.6%) | 0 (0.0%) |
| 5:00 AM to 5:29 AM | 105 (2.6%) | 50 (1.5%) |
| 5:30 AM to 5:59 AM | 134 (3.3%) | 25 (0.7%) |
| 6:00 AM to 6:29 AM | 443 (11.0%) | 212 (6.1%) |
| 6:30 AM to 6:59 AM | 306 (7.6%) | 332 (9.6%) |
| 7:00 AM to 7:29 AM | 977 (24.3%) | 580 (16.8%) |
| 7:30 AM to 7:59 AM | 626 (15.6%) | 592 (17.1%) |
| 8:00 AM to 8:29 AM | 425 (10.6%) | 511 (14.8%) |
| 8:30 AM to 8:59 AM | 270 (6.7%) | 109 (3.2%) |
| 9:00 AM to 9:59 AM | 175 (4.4%) | 524 (15.2%) |
| 10:00 AM to 10:59 AM | 85 (2.1%) | 171 (5.0%) |
| 11:00 AM to 11:59 AM | 69 (1.7%) | 54 (1.6%) |
| 12:00 PM to 3:59 PM | 72 (1.8%) | 184 (5.3%) |
| 4:00 PM to 11:59 PM | 264 (6.6%) | 112 (3.2%) |
| Total | 4,017 (100.0%) | 3,456 (100.0%) |
Housing Occupancy in Marblehead
Occupancy by Ownership in Marblehead
Of the total 8,172 dwellings in Marblehead, owner-occupied units account for 6,657 (81.5%), while renter-occupied units make up 1,515 (18.5%).
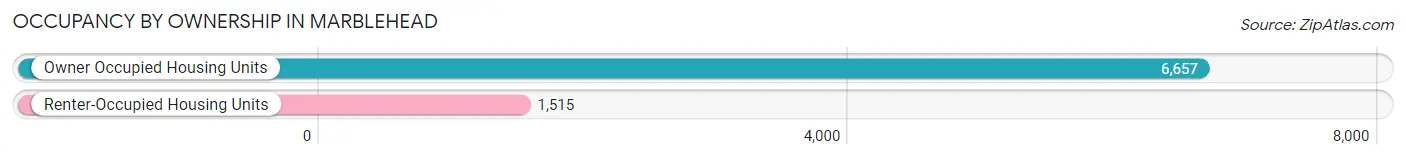
| Occupancy | # Housing Units | % Housing Units |
| Owner Occupied Housing Units | 6,657 | 81.5% |
| Renter-Occupied Housing Units | 1,515 | 18.5% |
| Total Occupied Housing Units | 8,172 | 100.0% |
Occupancy by Household Size in Marblehead
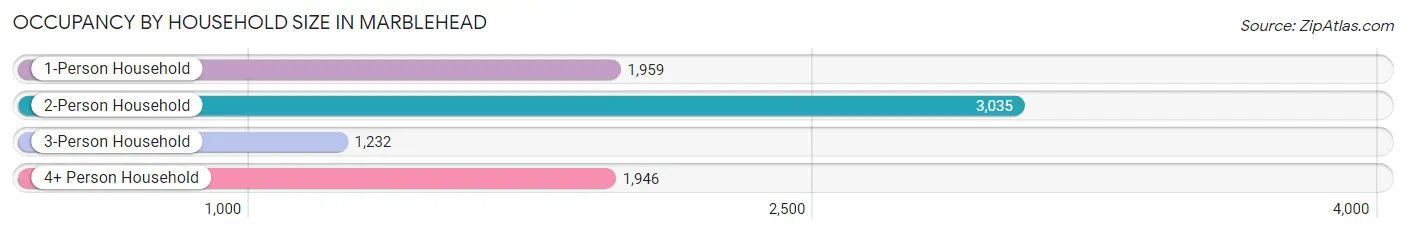
| Household Size | # Housing Units | % Housing Units |
| 1-Person Household | 1,959 | 24.0% |
| 2-Person Household | 3,035 | 37.1% |
| 3-Person Household | 1,232 | 15.1% |
| 4+ Person Household | 1,946 | 23.8% |
| Total Housing Units | 8,172 | 100.0% |
Occupancy by Ownership by Household Size in Marblehead
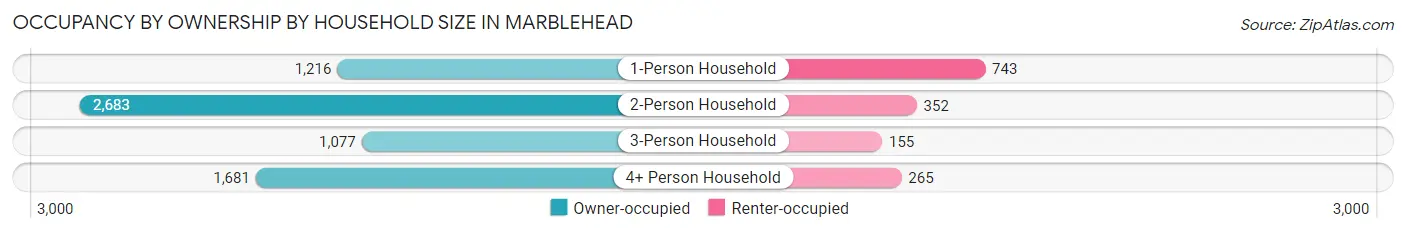
| Household Size | Owner-occupied | Renter-occupied |
| 1-Person Household | 1,216 (62.1%) | 743 (37.9%) |
| 2-Person Household | 2,683 (88.4%) | 352 (11.6%) |
| 3-Person Household | 1,077 (87.4%) | 155 (12.6%) |
| 4+ Person Household | 1,681 (86.4%) | 265 (13.6%) |
| Total Housing Units | 6,657 (81.5%) | 1,515 (18.5%) |
Occupancy by Educational Attainment in Marblehead
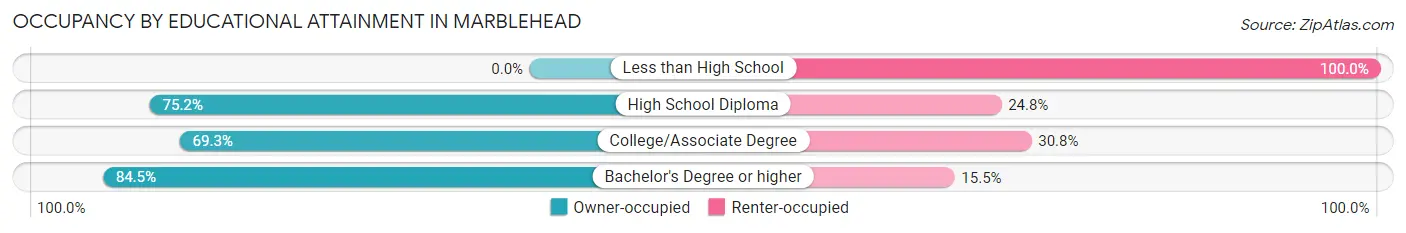
| Household Size | Owner-occupied | Renter-occupied |
| Less than High School | 0 (0.0%) | 7 (100.0%) |
| High School Diploma | 458 (75.2%) | 151 (24.8%) |
| College/Associate Degree | 840 (69.3%) | 373 (30.7%) |
| Bachelor's Degree or higher | 5,359 (84.5%) | 984 (15.5%) |
Occupancy by Age of Householder in Marblehead
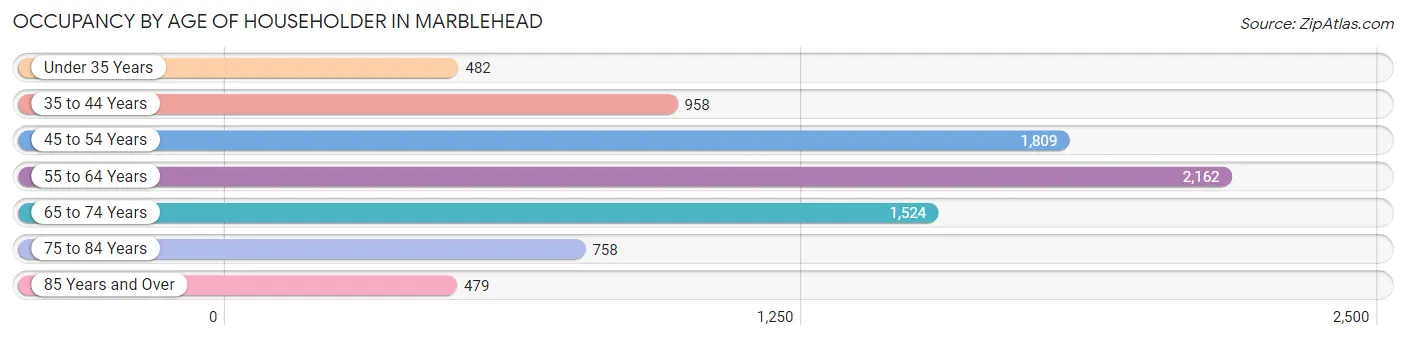
| Age Bracket | # Households | % Households |
| Under 35 Years | 482 | 5.9% |
| 35 to 44 Years | 958 | 11.7% |
| 45 to 54 Years | 1,809 | 22.1% |
| 55 to 64 Years | 2,162 | 26.5% |
| 65 to 74 Years | 1,524 | 18.6% |
| 75 to 84 Years | 758 | 9.3% |
| 85 Years and Over | 479 | 5.9% |
| Total | 8,172 | 100.0% |
Housing Finances in Marblehead
Median Income by Occupancy in Marblehead
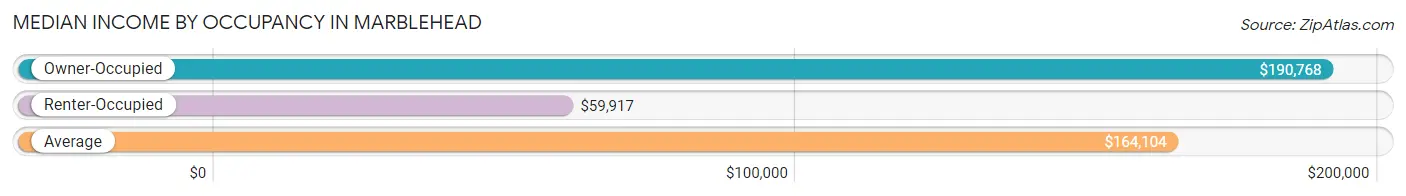
| Occupancy Type | # Households | Median Income |
| Owner-Occupied | 6,657 (81.5%) | $190,768 |
| Renter-Occupied | 1,515 (18.5%) | $59,917 |
| Average | 8,172 (100.0%) | $164,104 |
Occupancy by Householder Income Bracket in Marblehead
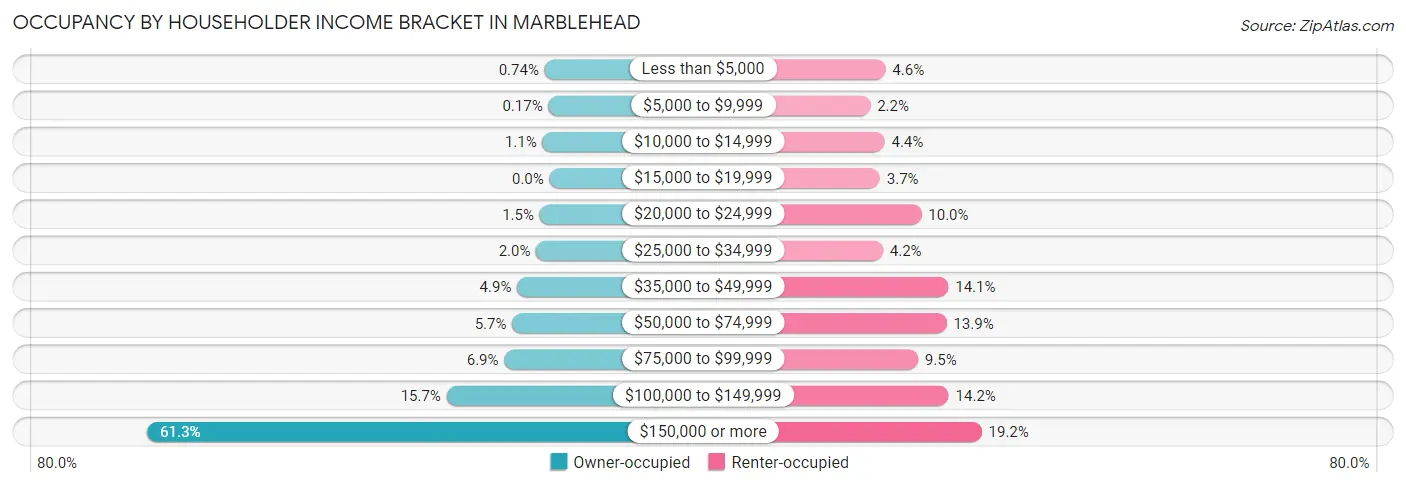
| Income Bracket | Owner-occupied | Renter-occupied |
| Less than $5,000 | 49 (0.7%) | 69 (4.5%) |
| $5,000 to $9,999 | 11 (0.2%) | 34 (2.2%) |
| $10,000 to $14,999 | 72 (1.1%) | 67 (4.4%) |
| $15,000 to $19,999 | 0 (0.0%) | 56 (3.7%) |
| $20,000 to $24,999 | 99 (1.5%) | 152 (10.0%) |
| $25,000 to $34,999 | 135 (2.0%) | 63 (4.2%) |
| $35,000 to $49,999 | 328 (4.9%) | 214 (14.1%) |
| $50,000 to $74,999 | 378 (5.7%) | 210 (13.9%) |
| $75,000 to $99,999 | 459 (6.9%) | 144 (9.5%) |
| $100,000 to $149,999 | 1,044 (15.7%) | 215 (14.2%) |
| $150,000 or more | 4,082 (61.3%) | 291 (19.2%) |
| Total | 6,657 (100.0%) | 1,515 (100.0%) |
Monthly Housing Cost Tiers in Marblehead
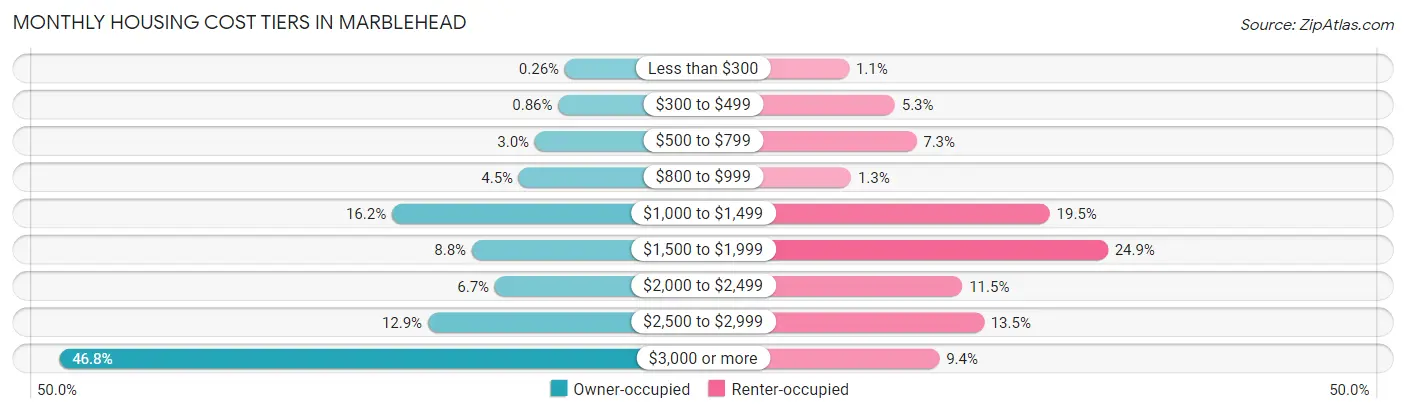
| Monthly Cost | Owner-occupied | Renter-occupied |
| Less than $300 | 17 (0.3%) | 16 (1.1%) |
| $300 to $499 | 57 (0.9%) | 80 (5.3%) |
| $500 to $799 | 201 (3.0%) | 110 (7.3%) |
| $800 to $999 | 299 (4.5%) | 19 (1.3%) |
| $1,000 to $1,499 | 1,077 (16.2%) | 296 (19.5%) |
| $1,500 to $1,999 | 587 (8.8%) | 377 (24.9%) |
| $2,000 to $2,499 | 446 (6.7%) | 174 (11.5%) |
| $2,500 to $2,999 | 857 (12.9%) | 204 (13.5%) |
| $3,000 or more | 3,116 (46.8%) | 142 (9.4%) |
| Total | 6,657 (100.0%) | 1,515 (100.0%) |
Physical Housing Characteristics in Marblehead
Housing Structures in Marblehead
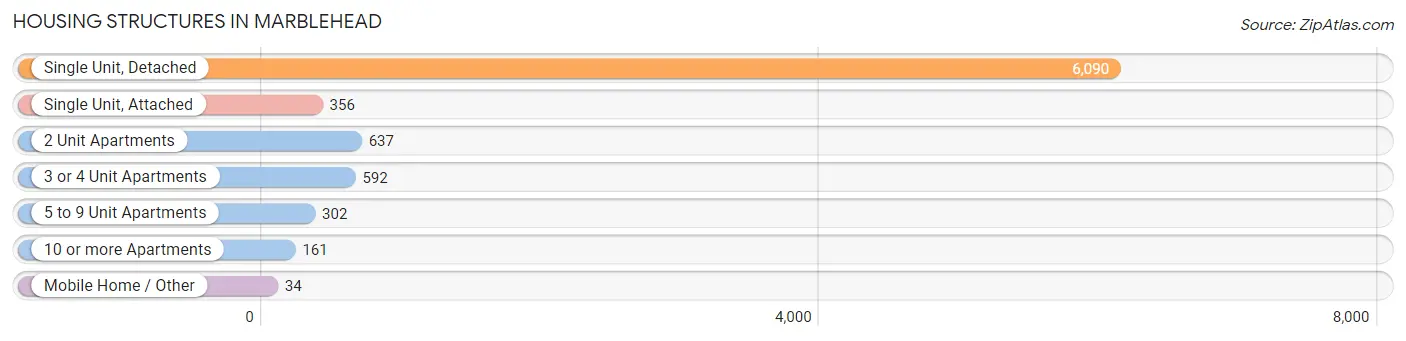
| Structure Type | # Housing Units | % Housing Units |
| Single Unit, Detached | 6,090 | 74.5% |
| Single Unit, Attached | 356 | 4.4% |
| 2 Unit Apartments | 637 | 7.8% |
| 3 or 4 Unit Apartments | 592 | 7.2% |
| 5 to 9 Unit Apartments | 302 | 3.7% |
| 10 or more Apartments | 161 | 2.0% |
| Mobile Home / Other | 34 | 0.4% |
| Total | 8,172 | 100.0% |
Housing Structures by Occupancy in Marblehead
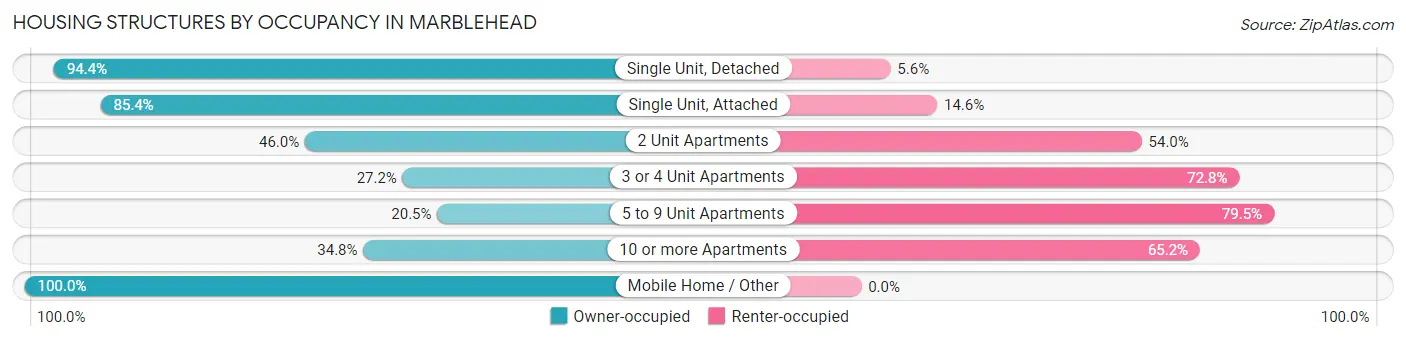
| Structure Type | Owner-occupied | Renter-occupied |
| Single Unit, Detached | 5,747 (94.4%) | 343 (5.6%) |
| Single Unit, Attached | 304 (85.4%) | 52 (14.6%) |
| 2 Unit Apartments | 293 (46.0%) | 344 (54.0%) |
| 3 or 4 Unit Apartments | 161 (27.2%) | 431 (72.8%) |
| 5 to 9 Unit Apartments | 62 (20.5%) | 240 (79.5%) |
| 10 or more Apartments | 56 (34.8%) | 105 (65.2%) |
| Mobile Home / Other | 34 (100.0%) | 0 (0.0%) |
| Total | 6,657 (81.5%) | 1,515 (18.5%) |
Housing Structures by Number of Rooms in Marblehead
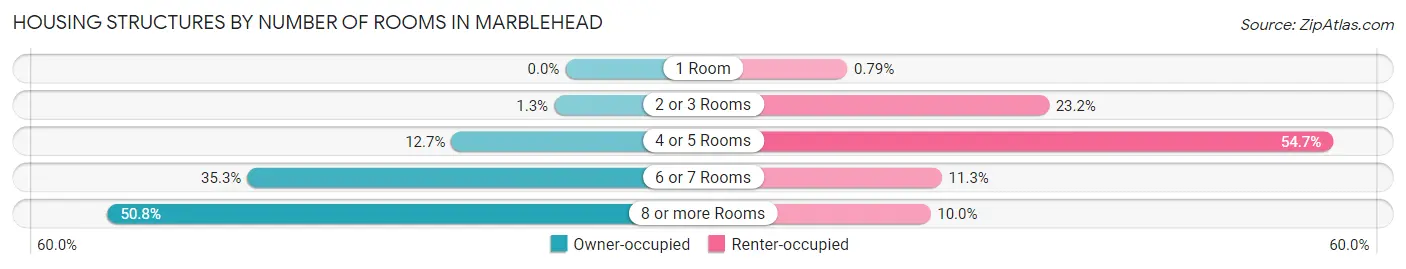
| Number of Rooms | Owner-occupied | Renter-occupied |
| 1 Room | 0 (0.0%) | 12 (0.8%) |
| 2 or 3 Rooms | 83 (1.3%) | 351 (23.2%) |
| 4 or 5 Rooms | 842 (12.7%) | 829 (54.7%) |
| 6 or 7 Rooms | 2,350 (35.3%) | 171 (11.3%) |
| 8 or more Rooms | 3,382 (50.8%) | 152 (10.0%) |
| Total | 6,657 (100.0%) | 1,515 (100.0%) |
Housing Structure by Heating Type in Marblehead
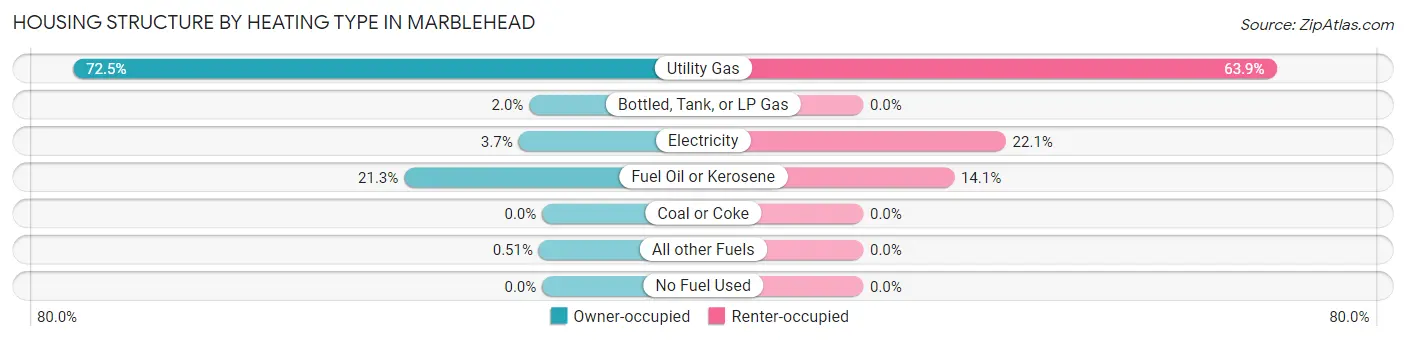
| Heating Type | Owner-occupied | Renter-occupied |
| Utility Gas | 4,827 (72.5%) | 968 (63.9%) |
| Bottled, Tank, or LP Gas | 133 (2.0%) | 0 (0.0%) |
| Electricity | 243 (3.6%) | 334 (22.1%) |
| Fuel Oil or Kerosene | 1,420 (21.3%) | 213 (14.1%) |
| Coal or Coke | 0 (0.0%) | 0 (0.0%) |
| All other Fuels | 34 (0.5%) | 0 (0.0%) |
| No Fuel Used | 0 (0.0%) | 0 (0.0%) |
| Total | 6,657 (100.0%) | 1,515 (100.0%) |
Household Vehicle Usage in Marblehead
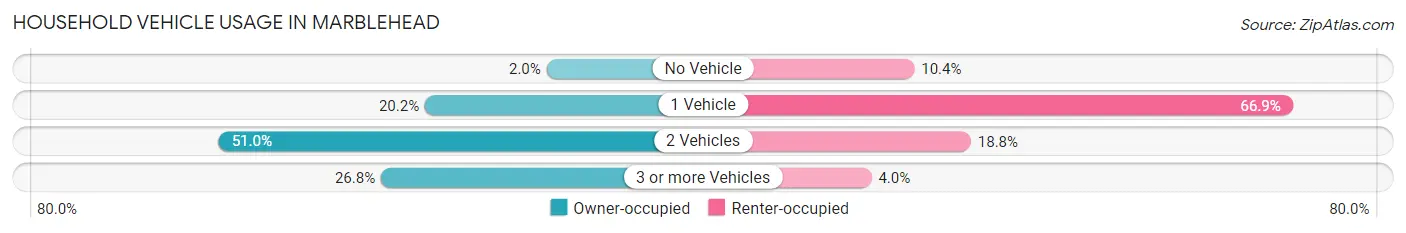
| Vehicles per Household | Owner-occupied | Renter-occupied |
| No Vehicle | 135 (2.0%) | 157 (10.4%) |
| 1 Vehicle | 1,345 (20.2%) | 1,013 (66.9%) |
| 2 Vehicles | 3,395 (51.0%) | 285 (18.8%) |
| 3 or more Vehicles | 1,782 (26.8%) | 60 (4.0%) |
| Total | 6,657 (100.0%) | 1,515 (100.0%) |
Real Estate & Mortgages in Marblehead
Real Estate and Mortgage Overview in Marblehead
| Characteristic | Without Mortgage | With Mortgage |
| Housing Units | 2,094 | 4,563 |
| Median Property Value | $843,400 | $864,400 |
| Median Household Income | $125,278 | $3,227 |
| Monthly Housing Costs | $1,257 | $3,016 |
| Real Estate Taxes | $7,339 | $9 |
Property Value by Mortgage Status in Marblehead
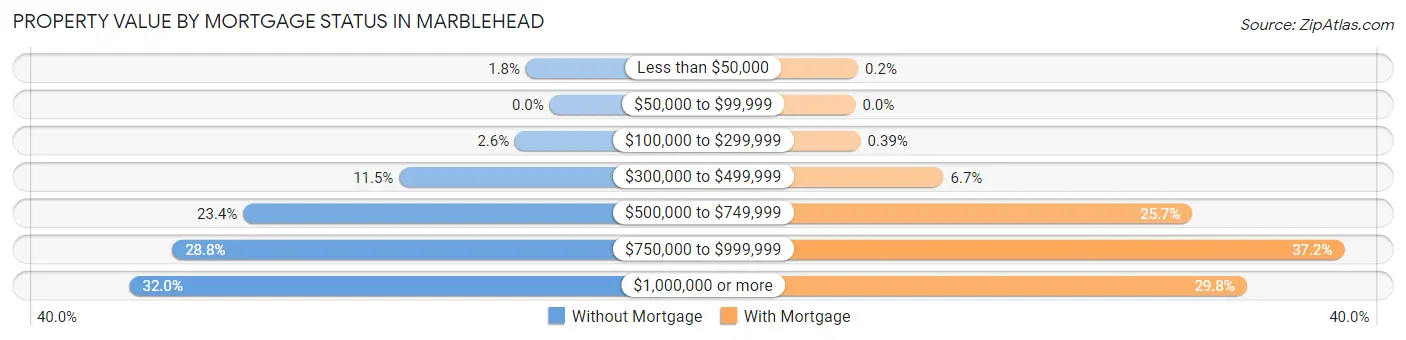
| Property Value | Without Mortgage | With Mortgage |
| Less than $50,000 | 38 (1.8%) | 9 (0.2%) |
| $50,000 to $99,999 | 0 (0.0%) | 0 (0.0%) |
| $100,000 to $299,999 | 55 (2.6%) | 18 (0.4%) |
| $300,000 to $499,999 | 240 (11.5%) | 306 (6.7%) |
| $500,000 to $749,999 | 489 (23.4%) | 1,171 (25.7%) |
| $750,000 to $999,999 | 602 (28.7%) | 1,699 (37.2%) |
| $1,000,000 or more | 670 (32.0%) | 1,360 (29.8%) |
| Total | 2,094 (100.0%) | 4,563 (100.0%) |
Household Income by Mortgage Status in Marblehead
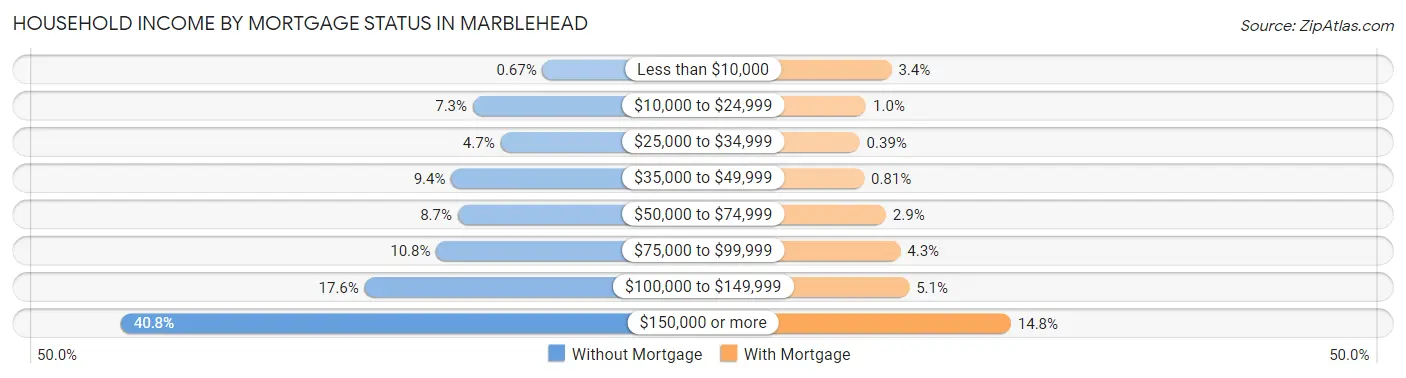
| Household Income | Without Mortgage | With Mortgage |
| Less than $10,000 | 14 (0.7%) | 156 (3.4%) |
| $10,000 to $24,999 | 153 (7.3%) | 46 (1.0%) |
| $25,000 to $34,999 | 98 (4.7%) | 18 (0.4%) |
| $35,000 to $49,999 | 196 (9.4%) | 37 (0.8%) |
| $50,000 to $74,999 | 183 (8.7%) | 132 (2.9%) |
| $75,000 to $99,999 | 226 (10.8%) | 195 (4.3%) |
| $100,000 to $149,999 | 369 (17.6%) | 233 (5.1%) |
| $150,000 or more | 855 (40.8%) | 675 (14.8%) |
| Total | 2,094 (100.0%) | 4,563 (100.0%) |
Property Value to Household Income Ratio in Marblehead
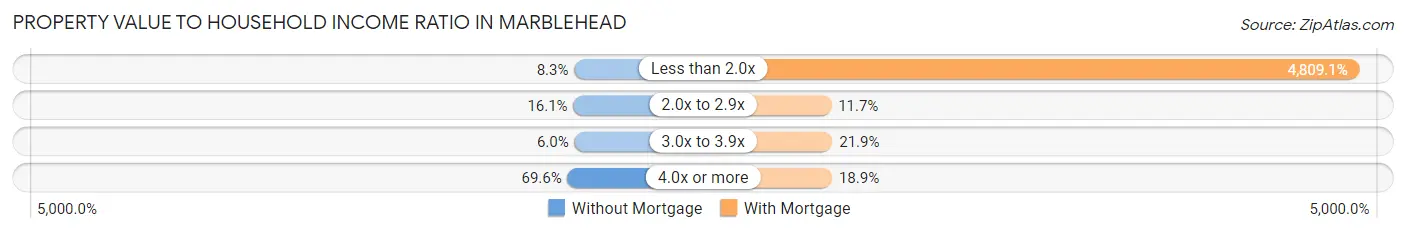
| Value-to-Income Ratio | Without Mortgage | With Mortgage |
| Less than 2.0x | 173 (8.3%) | 219,438 (4,809.1%) |
| 2.0x to 2.9x | 338 (16.1%) | 533 (11.7%) |
| 3.0x to 3.9x | 125 (6.0%) | 998 (21.9%) |
| 4.0x or more | 1,458 (69.6%) | 860 (18.9%) |
| Total | 2,094 (100.0%) | 4,563 (100.0%) |
Real Estate Taxes by Mortgage Status in Marblehead
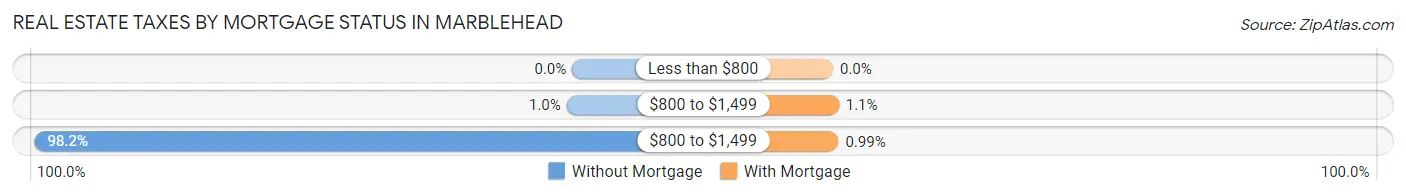
| Property Taxes | Without Mortgage | With Mortgage |
| Less than $800 | 0 (0.0%) | 0 (0.0%) |
| $800 to $1,499 | 21 (1.0%) | 48 (1.1%) |
| $800 to $1,499 | 2,056 (98.2%) | 45 (1.0%) |
| Total | 2,094 (100.0%) | 4,563 (100.0%) |
Health & Disability in Marblehead
Health Insurance Coverage by Age in Marblehead
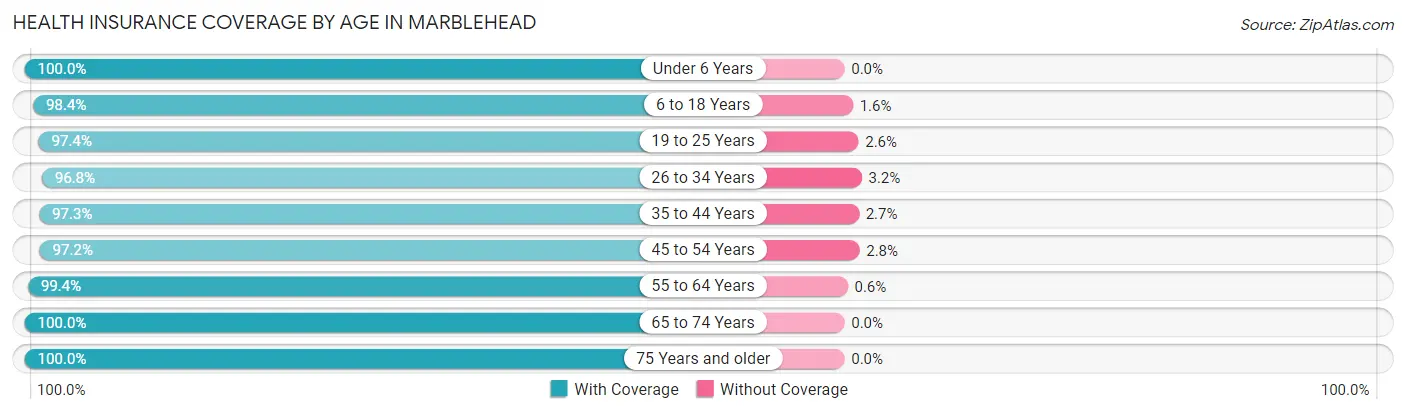
| Age Bracket | With Coverage | Without Coverage |
| Under 6 Years | 711 (100.0%) | 0 (0.0%) |
| 6 to 18 Years | 3,896 (98.4%) | 62 (1.6%) |
| 19 to 25 Years | 1,044 (97.4%) | 28 (2.6%) |
| 26 to 34 Years | 1,205 (96.8%) | 40 (3.2%) |
| 35 to 44 Years | 1,844 (97.3%) | 51 (2.7%) |
| 45 to 54 Years | 3,171 (97.2%) | 91 (2.8%) |
| 55 to 64 Years | 3,651 (99.4%) | 22 (0.6%) |
| 65 to 74 Years | 2,537 (100.0%) | 0 (0.0%) |
| 75 Years and older | 1,891 (100.0%) | 0 (0.0%) |
| Total | 19,950 (98.6%) | 294 (1.5%) |
Health Insurance Coverage by Citizenship Status in Marblehead
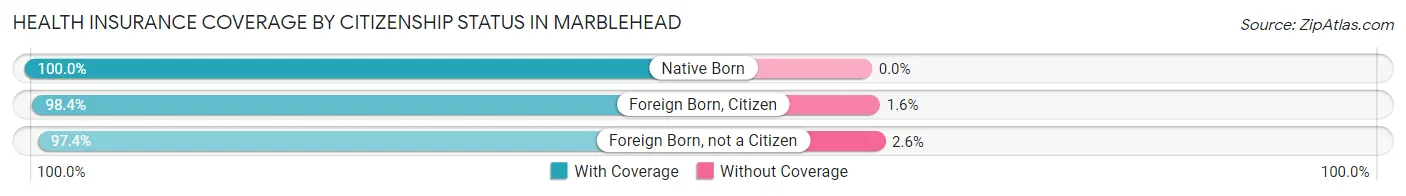
| Citizenship Status | With Coverage | Without Coverage |
| Native Born | 711 (100.0%) | 0 (0.0%) |
| Foreign Born, Citizen | 3,896 (98.4%) | 62 (1.6%) |
| Foreign Born, not a Citizen | 1,044 (97.4%) | 28 (2.6%) |
Health Insurance Coverage by Household Income in Marblehead
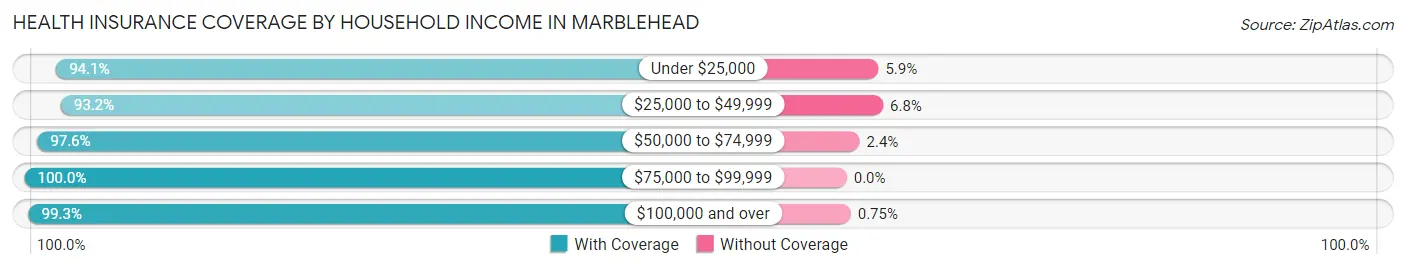
| Household Income | With Coverage | Without Coverage |
| Under $25,000 | 746 (94.1%) | 47 (5.9%) |
| $25,000 to $49,999 | 1,371 (93.2%) | 100 (6.8%) |
| $50,000 to $74,999 | 1,220 (97.6%) | 30 (2.4%) |
| $75,000 to $99,999 | 1,165 (100.0%) | 0 (0.0%) |
| $100,000 and over | 15,448 (99.3%) | 117 (0.7%) |
Public vs Private Health Insurance Coverage by Age in Marblehead
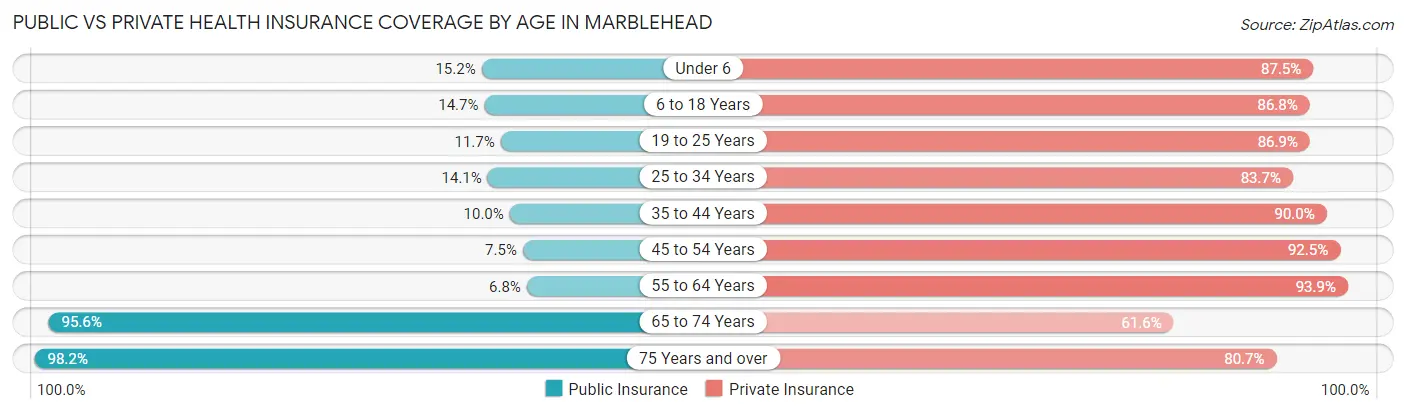
| Age Bracket | Public Insurance | Private Insurance |
| Under 6 | 108 (15.2%) | 622 (87.5%) |
| 6 to 18 Years | 581 (14.7%) | 3,436 (86.8%) |
| 19 to 25 Years | 125 (11.7%) | 931 (86.9%) |
| 25 to 34 Years | 175 (14.1%) | 1,042 (83.7%) |
| 35 to 44 Years | 189 (10.0%) | 1,705 (90.0%) |
| 45 to 54 Years | 246 (7.5%) | 3,016 (92.5%) |
| 55 to 64 Years | 250 (6.8%) | 3,449 (93.9%) |
| 65 to 74 Years | 2,424 (95.6%) | 1,562 (61.6%) |
| 75 Years and over | 1,856 (98.2%) | 1,525 (80.6%) |
| Total | 5,954 (29.4%) | 17,288 (85.4%) |
Disability Status by Sex by Age in Marblehead
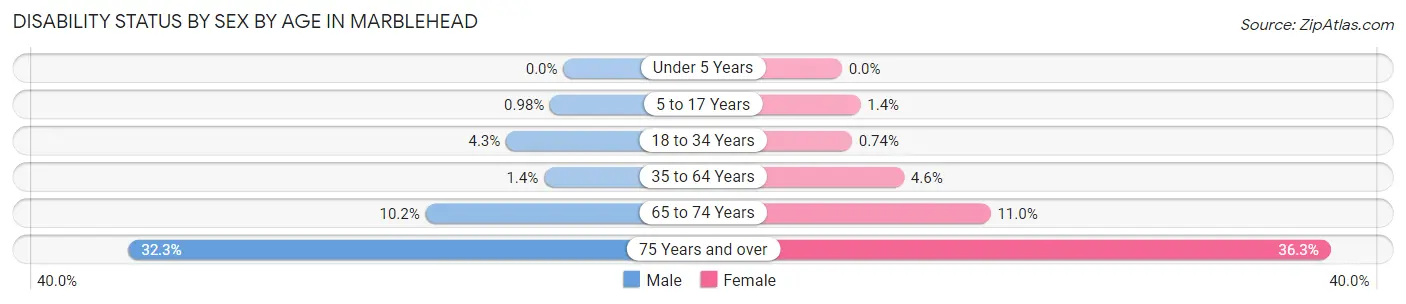
| Age Bracket | Male | Female |
| Under 5 Years | 0 (0.0%) | 0 (0.0%) |
| 5 to 17 Years | 19 (1.0%) | 26 (1.4%) |
| 18 to 34 Years | 59 (4.3%) | 9 (0.7%) |
| 35 to 64 Years | 59 (1.4%) | 217 (4.6%) |
| 65 to 74 Years | 128 (10.2%) | 142 (11.0%) |
| 75 Years and over | 261 (32.3%) | 393 (36.3%) |
Disability Class by Sex by Age in Marblehead
Disability Class: Hearing Difficulty
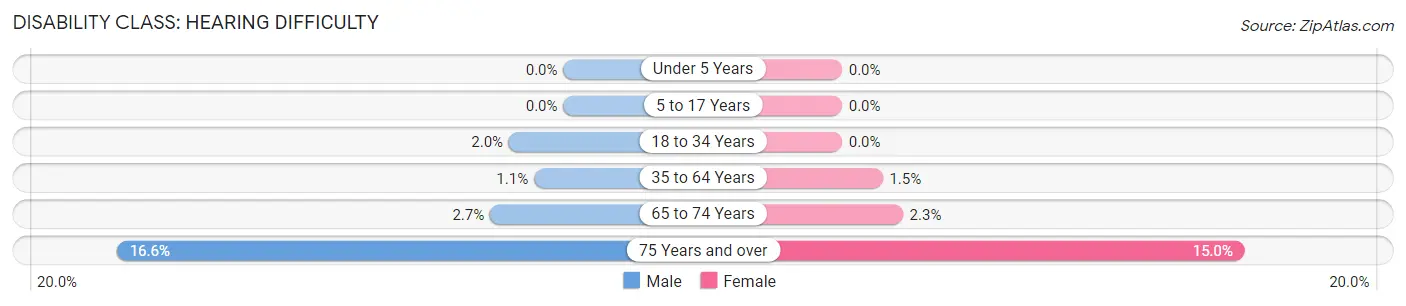
| Age Bracket | Male | Female |
| Under 5 Years | 0 (0.0%) | 0 (0.0%) |
| 5 to 17 Years | 0 (0.0%) | 0 (0.0%) |
| 18 to 34 Years | 28 (2.0%) | 0 (0.0%) |
| 35 to 64 Years | 45 (1.1%) | 71 (1.5%) |
| 65 to 74 Years | 34 (2.7%) | 29 (2.3%) |
| 75 Years and over | 134 (16.6%) | 162 (15.0%) |
Disability Class: Vision Difficulty
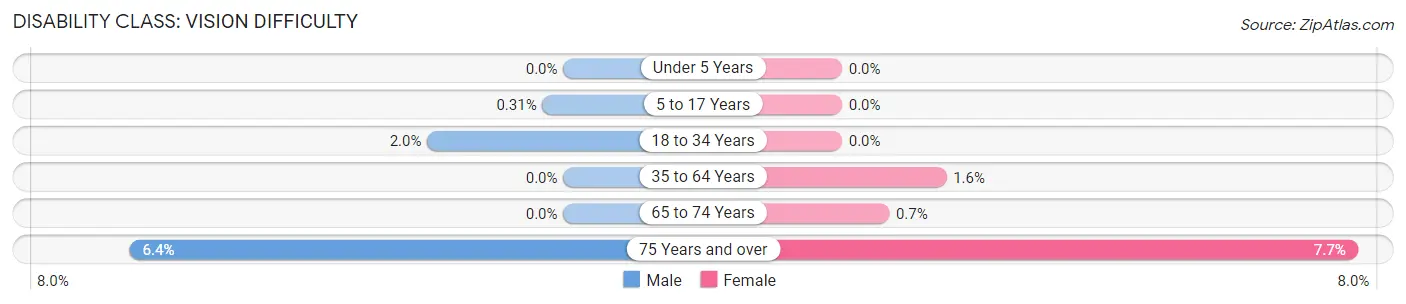
| Age Bracket | Male | Female |
| Under 5 Years | 0 (0.0%) | 0 (0.0%) |
| 5 to 17 Years | 6 (0.3%) | 0 (0.0%) |
| 18 to 34 Years | 28 (2.0%) | 0 (0.0%) |
| 35 to 64 Years | 0 (0.0%) | 73 (1.5%) |
| 65 to 74 Years | 0 (0.0%) | 9 (0.7%) |
| 75 Years and over | 52 (6.4%) | 83 (7.7%) |
Disability Class: Cognitive Difficulty
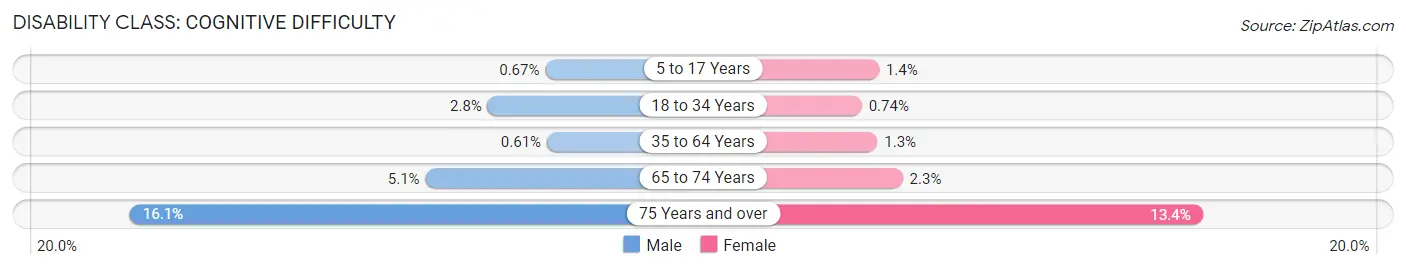
| Age Bracket | Male | Female |
| 5 to 17 Years | 13 (0.7%) | 26 (1.4%) |
| 18 to 34 Years | 39 (2.8%) | 9 (0.7%) |
| 35 to 64 Years | 25 (0.6%) | 62 (1.3%) |
| 65 to 74 Years | 64 (5.1%) | 29 (2.3%) |
| 75 Years and over | 130 (16.1%) | 145 (13.4%) |
Disability Class: Ambulatory Difficulty
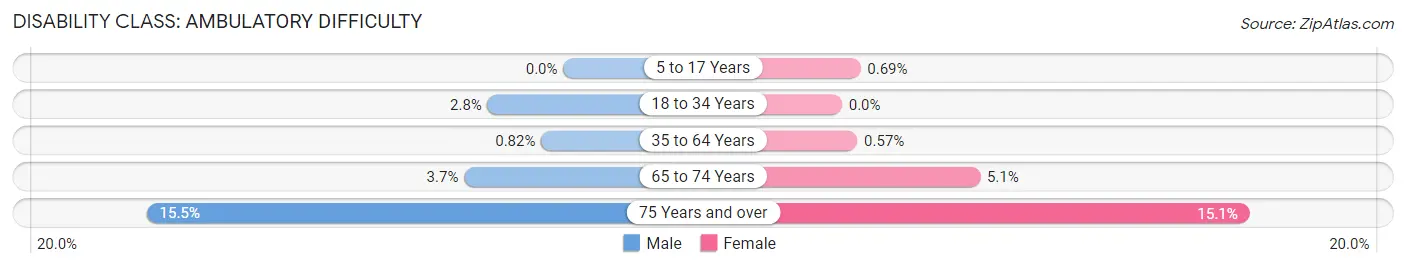
| Age Bracket | Male | Female |
| 5 to 17 Years | 0 (0.0%) | 13 (0.7%) |
| 18 to 34 Years | 39 (2.8%) | 0 (0.0%) |
| 35 to 64 Years | 34 (0.8%) | 27 (0.6%) |
| 65 to 74 Years | 46 (3.7%) | 66 (5.1%) |
| 75 Years and over | 125 (15.5%) | 164 (15.1%) |
Disability Class: Self-Care Difficulty
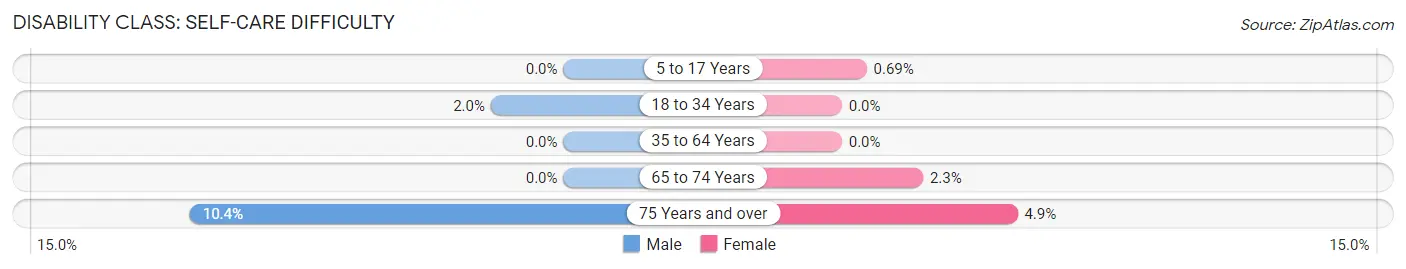
| Age Bracket | Male | Female |
| 5 to 17 Years | 0 (0.0%) | 13 (0.7%) |
| 18 to 34 Years | 28 (2.0%) | 0 (0.0%) |
| 35 to 64 Years | 0 (0.0%) | 0 (0.0%) |
| 65 to 74 Years | 0 (0.0%) | 29 (2.3%) |
| 75 Years and over | 84 (10.4%) | 53 (4.9%) |
Technology Access in Marblehead
Computing Device Access in Marblehead
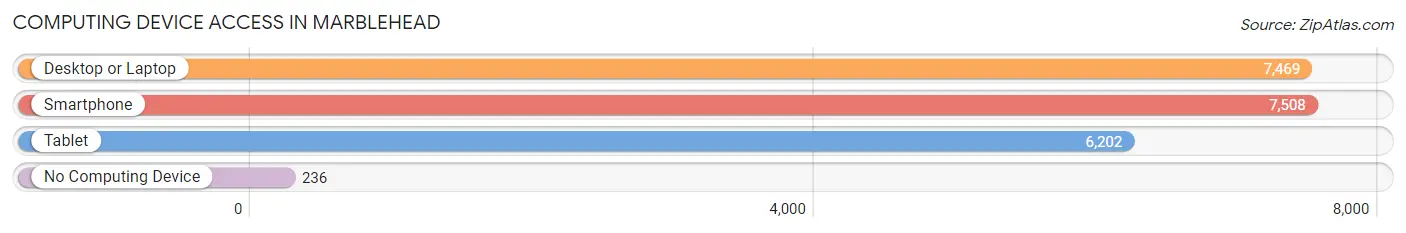
| Device Type | # Households | % Households |
| Desktop or Laptop | 7,469 | 91.4% |
| Smartphone | 7,508 | 91.9% |
| Tablet | 6,202 | 75.9% |
| No Computing Device | 236 | 2.9% |
| Total | 8,172 | 100.0% |
Internet Access in Marblehead
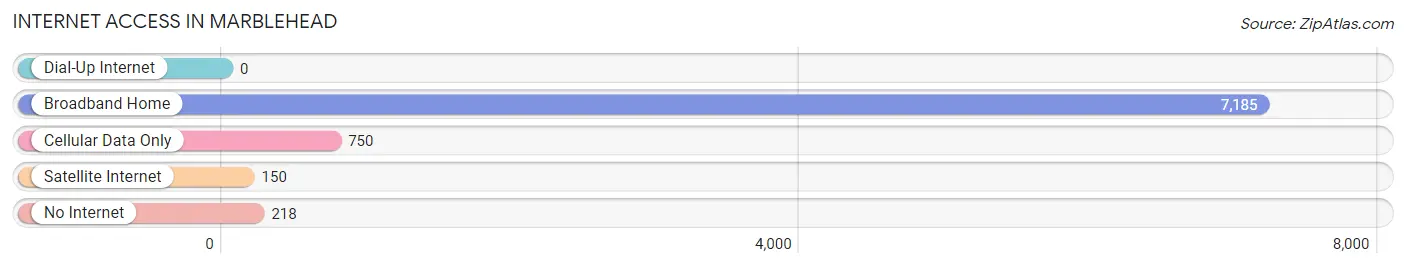
| Internet Type | # Households | % Households |
| Dial-Up Internet | 0 | 0.0% |
| Broadband Home | 7,185 | 87.9% |
| Cellular Data Only | 750 | 9.2% |
| Satellite Internet | 150 | 1.8% |
| No Internet | 218 | 2.7% |
| Total | 8,172 | 100.0% |
Marblehead Summary
Marblehead, Massachusetts is a coastal town located in Essex County, approximately 15 miles northeast of Boston. It is a popular summer destination for tourists and locals alike, and is known for its picturesque harbor, historic architecture, and vibrant culture.
History
Marblehead was first settled in 1629 by a group of English colonists led by John Endecott. The town was originally called “Marvell Head” after the abundance of marble found in the area. The town was officially incorporated in 1649 and was an important fishing and trading port throughout the colonial period. During the Revolutionary War, Marblehead was a major center of privateering and smuggling, and was home to the first naval battle of the war.
In the 19th century, Marblehead became a popular summer destination for wealthy Bostonians, and many of the town’s grand Victorian homes were built during this period. The town was also home to a thriving fishing industry, and the Marblehead Fisherman’s Association was founded in 1884.
Geography
Marblehead is located on the Atlantic coast of Massachusetts, approximately 15 miles northeast of Boston. The town is situated on a peninsula, with the Atlantic Ocean to the east and Massachusetts Bay to the west. Marblehead Neck, a narrow strip of land that separates the two bodies of water, is home to the town’s picturesque harbor. The town is bordered by Salem to the north, Swampscott to the south, and Lynn to the west.
The town has a total area of 8.3 square miles, of which 6.2 square miles is land and 2.1 square miles is water. The highest point in Marblehead is the summit of Crocker Hill, which rises to an elevation of 140 feet above sea level.
Economy
Marblehead’s economy is largely driven by tourism and the service industry. The town is home to a number of restaurants, shops, and hotels, as well as a variety of attractions such as the Marblehead Lighthouse and the Marblehead Museum. The town is also home to a number of technology companies, including the software company Autodesk and the medical device company Boston Scientific.
Demographics
As of the 2010 census, Marblehead had a population of 19,808. The median household income was $90,837, and the median family income was $106,837. The town’s population is predominantly white (93.3%), with small percentages of African American (2.2%), Asian (2.1%), and Hispanic or Latino (1.7%) residents.
Marblehead is a popular summer destination for tourists and locals alike, and is known for its picturesque harbor, historic architecture, and vibrant culture. The town’s economy is largely driven by tourism and the service industry, and its population is predominantly white. Marblehead is a beautiful and unique town with a rich history and a bright future.
Common Questions
What is Per Capita Income in Marblehead?
Per Capita income in Marblehead is $90,921.
What is the Median Family Income in Marblehead?
Median Family Income in Marblehead is $200,000.
What is the Median Household income in Marblehead?
Median Household Income in Marblehead is $164,104.
What is Income or Wage Gap in Marblehead?
Income or Wage Gap in Marblehead is 40.9%.
Women in Marblehead earn 59.1 cents for every dollar earned by a man.
What is Inequality or Gini Index in Marblehead?
Inequality or Gini Index in Marblehead is 0.48.
What is the Total Population of Marblehead?
Total Population of Marblehead is 20,350.
What is the Total Male Population of Marblehead?
Total Male Population of Marblehead is 9,740.
What is the Total Female Population of Marblehead?
Total Female Population of Marblehead is 10,610.
What is the Ratio of Males per 100 Females in Marblehead?
There are 91.80 Males per 100 Females in Marblehead.
What is the Ratio of Females per 100 Males in Marblehead?
There are 108.93 Females per 100 Males in Marblehead.
What is the Median Population Age in Marblehead?
Median Population Age in Marblehead is 49.6 Years.
What is the Average Family Size in Marblehead
Average Family Size in Marblehead is 3.0 People.
What is the Average Household Size in Marblehead
Average Household Size in Marblehead is 2.5 People.
How Large is the Labor Force in Marblehead?
There are 11,153 People in the Labor Forcein in Marblehead.
What is the Percentage of People in the Labor Force in Marblehead?
66.0% of People are in the Labor Force in Marblehead.
What is the Unemployment Rate in Marblehead?
Unemployment Rate in Marblehead is 3.3%.