Westborough, MA Map & Demographics
Westborough Map
Westborough Overview
$58,215
PER CAPITA INCOME
$150,083
AVG FAMILY INCOME
$87,411
AVG HOUSEHOLD INCOME
13.3%
WAGE / INCOME GAP [ % ]
86.7¢/ $1
WAGE / INCOME GAP [ $ ]
$15,667
FAMILY INCOME DEFICIT
0.45
INEQUALITY / GINI INDEX
4,381
TOTAL POPULATION
2,217
MALE POPULATION
2,164
FEMALE POPULATION
102.45
MALES / 100 FEMALES
97.61
FEMALES / 100 MALES
43.1
MEDIAN AGE
3.2
AVG FAMILY SIZE
2.1
AVG HOUSEHOLD SIZE
2,616
LABOR FORCE [ PEOPLE ]
70.7%
PERCENT IN LABOR FORCE
2.3%
UNEMPLOYMENT RATE
Westborough Zip Codes
Income in Westborough
Income Overview in Westborough
Per Capita Income in Westborough is $58,215, while median incomes of families and households are $150,083 and $87,411 respectively.
| Characteristic | Number | Measure |
| Per Capita Income | 4,381 | $58,215 |
| Median Family Income | 885 | $150,083 |
| Mean Family Income | 885 | $179,653 |
| Median Household Income | 1,992 | $87,411 |
| Mean Household Income | 1,992 | $126,603 |
| Income Deficit | 885 | $15,667 |
| Wage / Income Gap (%) | 4,381 | 13.34% |
| Wage / Income Gap ($) | 4,381 | 86.66¢ per $1 |
| Gini / Inequality Index | 4,381 | 0.45 |
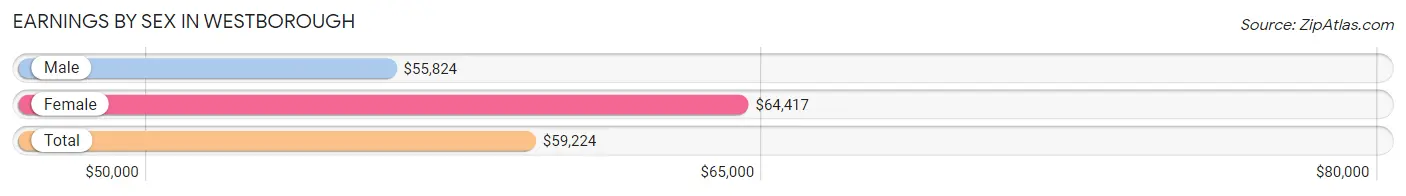
Earnings by Sex in Westborough
Average Earnings in Westborough are $59,224, $55,824 for men and $64,417 for women, a difference of 13.3%.
| Sex | Number | Average Earnings |
| Male | 1,455 (55.0%) | $55,824 |
| Female | 1,191 (45.0%) | $64,417 |
| Total | 2,646 (100.0%) | $59,224 |
Earnings by Sex by Income Bracket in Westborough
The most common earnings brackets in Westborough are $100,000+ for men (405 | 27.8%) and $100,000+ for women (382 | 32.1%).
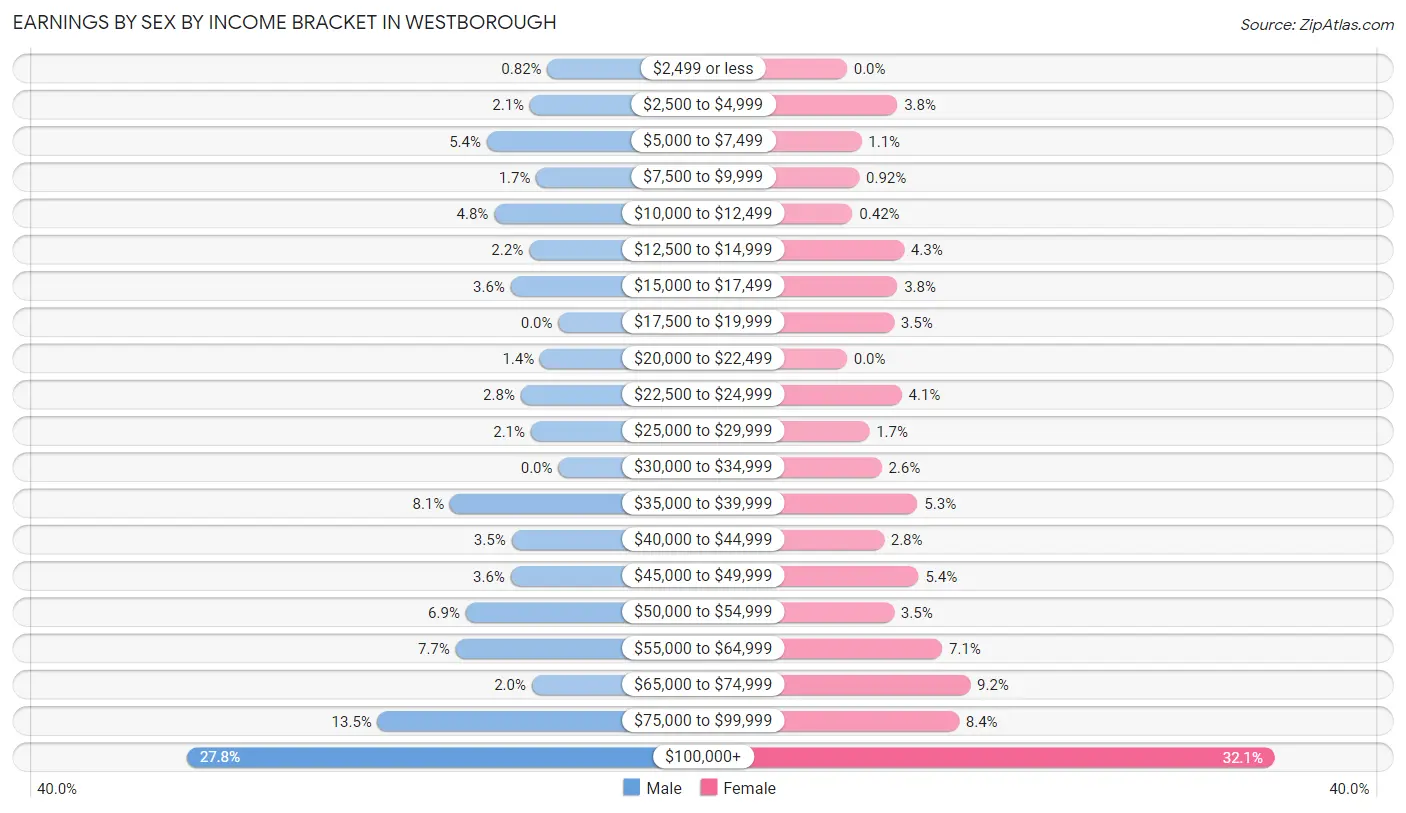
| Income | Male | Female |
| $2,499 or less | 12 (0.8%) | 0 (0.0%) |
| $2,500 to $4,999 | 31 (2.1%) | 45 (3.8%) |
| $5,000 to $7,499 | 78 (5.4%) | 13 (1.1%) |
| $7,500 to $9,999 | 24 (1.7%) | 11 (0.9%) |
| $10,000 to $12,499 | 70 (4.8%) | 5 (0.4%) |
| $12,500 to $14,999 | 32 (2.2%) | 51 (4.3%) |
| $15,000 to $17,499 | 52 (3.6%) | 45 (3.8%) |
| $17,500 to $19,999 | 0 (0.0%) | 42 (3.5%) |
| $20,000 to $22,499 | 20 (1.4%) | 0 (0.0%) |
| $22,500 to $24,999 | 41 (2.8%) | 49 (4.1%) |
| $25,000 to $29,999 | 30 (2.1%) | 20 (1.7%) |
| $30,000 to $34,999 | 0 (0.0%) | 31 (2.6%) |
| $35,000 to $39,999 | 118 (8.1%) | 63 (5.3%) |
| $40,000 to $44,999 | 51 (3.5%) | 33 (2.8%) |
| $45,000 to $49,999 | 52 (3.6%) | 64 (5.4%) |
| $50,000 to $54,999 | 101 (6.9%) | 42 (3.5%) |
| $55,000 to $64,999 | 112 (7.7%) | 85 (7.1%) |
| $65,000 to $74,999 | 29 (2.0%) | 110 (9.2%) |
| $75,000 to $99,999 | 197 (13.5%) | 100 (8.4%) |
| $100,000+ | 405 (27.8%) | 382 (32.1%) |
| Total | 1,455 (100.0%) | 1,191 (100.0%) |
Earnings by Sex by Educational Attainment in Westborough
Average earnings in Westborough are $67,976 for men and $70,041 for women, a difference of 2.9%. Men with an educational attainment of bachelor's degree enjoy the highest average annual earnings of $84,917, while those with college or associate's degree education earn the least with $39,432. Women with an educational attainment of graduate degree earn the most with the average annual earnings of $116,250, while those with high school diploma education have the smallest earnings of $45,114.
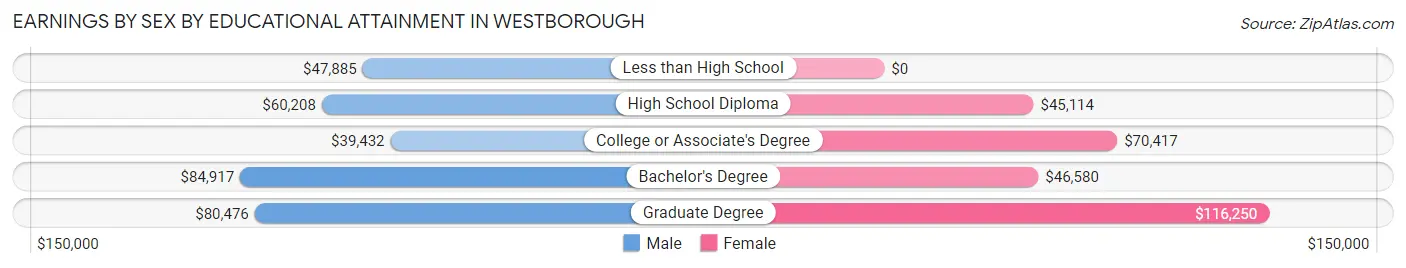
| Educational Attainment | Male Income | Female Income |
| Less than High School | $47,885 | $0 |
| High School Diploma | $60,208 | $45,114 |
| College or Associate's Degree | $39,432 | $70,417 |
| Bachelor's Degree | $84,917 | $46,580 |
| Graduate Degree | $80,476 | $116,250 |
| Total | $67,976 | $70,041 |
Family Income in Westborough
Family Income Brackets in Westborough
According to the Westborough family income data, there are 314 families falling into the $200,000+ income range, which is the most common income bracket and makes up 35.5% of all families.
| Income Bracket | # Families | % Families |
| Less than $10,000 | 31 | 3.5% |
| $10,000 to $14,999 | 0 | 0.0% |
| $15,000 to $24,999 | 41 | 4.6% |
| $25,000 to $34,999 | 49 | 5.5% |
| $35,000 to $49,999 | 21 | 2.4% |
| $50,000 to $74,999 | 91 | 10.3% |
| $75,000 to $99,999 | 61 | 6.9% |
| $100,000 to $149,999 | 148 | 16.7% |
| $150,000 to $199,999 | 129 | 14.6% |
| $200,000+ | 314 | 35.5% |
Family Income by Famaliy Size in Westborough
6-person families (39 | 4.4%) account for the highest median family income in Westborough with $250,001 per family, while 3-person families (170 | 19.2%) have the highest median income of $58,611 per family member.
| Income Bracket | # Families | Median Income |
| 2-Person Families | 413 (46.7%) | $102,132 |
| 3-Person Families | 170 (19.2%) | $175,833 |
| 4-Person Families | 157 (17.7%) | $198,021 |
| 5-Person Families | 80 (9.0%) | $150,500 |
| 6-Person Families | 39 (4.4%) | $250,001 |
| 7+ Person Families | 26 (2.9%) | $250,001 |
| Total | 885 (100.0%) | $150,083 |
Family Income by Number of Earners in Westborough
| Number of Earners | # Families | Median Income |
| No Earners | 111 (12.5%) | $0 |
| 1 Earner | 264 (29.8%) | $84,032 |
| 2 Earners | 339 (38.3%) | $203,563 |
| 3+ Earners | 171 (19.3%) | $199,063 |
| Total | 885 (100.0%) | $150,083 |
Household Income in Westborough
Household Income Brackets in Westborough
With 464 households falling in the category, the $100,000 to $149,999 income range is the most frequent in Westborough, accounting for 23.3% of all households. In contrast, only 12 households (0.6%) fall into the $10,000 to $14,999 income bracket, making it the least populous group.
| Income Bracket | # Households | % Households |
| Less than $10,000 | 60 | 3.0% |
| $10,000 to $14,999 | 12 | 0.6% |
| $15,000 to $24,999 | 171 | 8.6% |
| $25,000 to $34,999 | 112 | 5.6% |
| $35,000 to $49,999 | 84 | 4.2% |
| $50,000 to $74,999 | 376 | 18.9% |
| $75,000 to $99,999 | 205 | 10.3% |
| $100,000 to $149,999 | 464 | 23.3% |
| $150,000 to $199,999 | 169 | 8.5% |
| $200,000+ | 339 | 17.0% |
Household Income by Householder Age in Westborough
The median household income in Westborough is $87,411, with the highest median household income of $130,521 found in the 45 to 64 years age bracket for the primary householder. A total of 902 households (45.3%) fall into this category. Meanwhile, the 15 to 24 years age bracket for the primary householder has the lowest median household income of $64,196, with 67 households (3.4%) in this group.
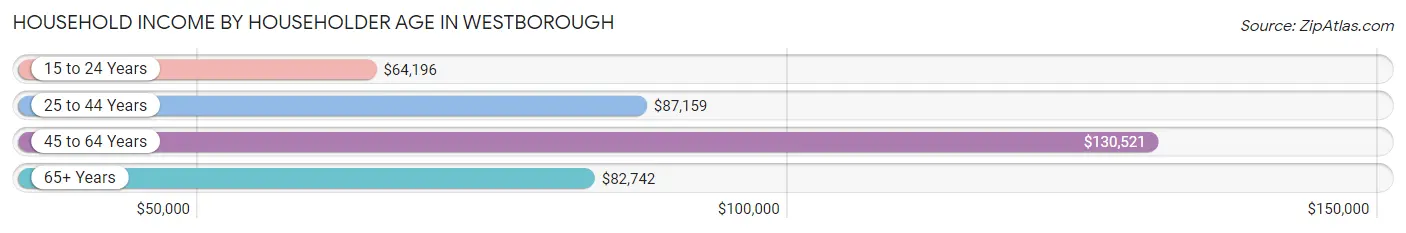
| Income Bracket | # Households | Median Income |
| 15 to 24 Years | 67 (3.4%) | $64,196 |
| 25 to 44 Years | 605 (30.4%) | $87,159 |
| 45 to 64 Years | 902 (45.3%) | $130,521 |
| 65+ Years | 418 (21.0%) | $82,742 |
| Total | 1,992 (100.0%) | $87,411 |
Poverty in Westborough
Income Below Poverty by Sex and Age in Westborough
With 4.2% poverty level for males and 9.6% for females among the residents of Westborough, 55 to 64 year old males and 25 to 34 year old females are the most vulnerable to poverty, with 37 males (12.9%) and 63 females (18.4%) in their respective age groups living below the poverty level.
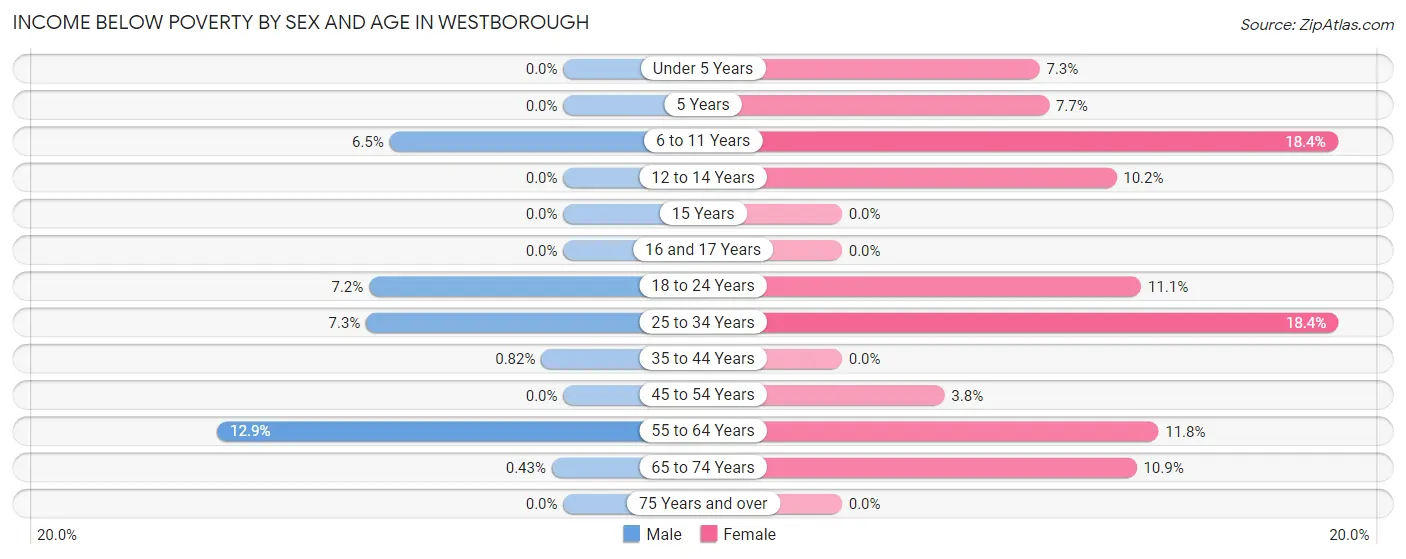
| Age Bracket | Male | Female |
| Under 5 Years | 0 (0.0%) | 8 (7.3%) |
| 5 Years | 0 (0.0%) | 1 (7.7%) |
| 6 to 11 Years | 6 (6.5%) | 23 (18.4%) |
| 12 to 14 Years | 0 (0.0%) | 11 (10.2%) |
| 15 Years | 0 (0.0%) | 0 (0.0%) |
| 16 and 17 Years | 0 (0.0%) | 0 (0.0%) |
| 18 to 24 Years | 16 (7.2%) | 13 (11.1%) |
| 25 to 34 Years | 27 (7.3%) | 63 (18.4%) |
| 35 to 44 Years | 2 (0.8%) | 0 (0.0%) |
| 45 to 54 Years | 0 (0.0%) | 11 (3.8%) |
| 55 to 64 Years | 37 (12.9%) | 53 (11.7%) |
| 65 to 74 Years | 1 (0.4%) | 21 (10.9%) |
| 75 Years and over | 0 (0.0%) | 0 (0.0%) |
| Total | 89 (4.2%) | 204 (9.6%) |
Income Above Poverty by Sex and Age in Westborough
According to the poverty statistics in Westborough, males aged under 5 years and females aged 16 and 17 years are the age groups that are most secure financially, with 100.0% of males and 100.0% of females in these age groups living above the poverty line.
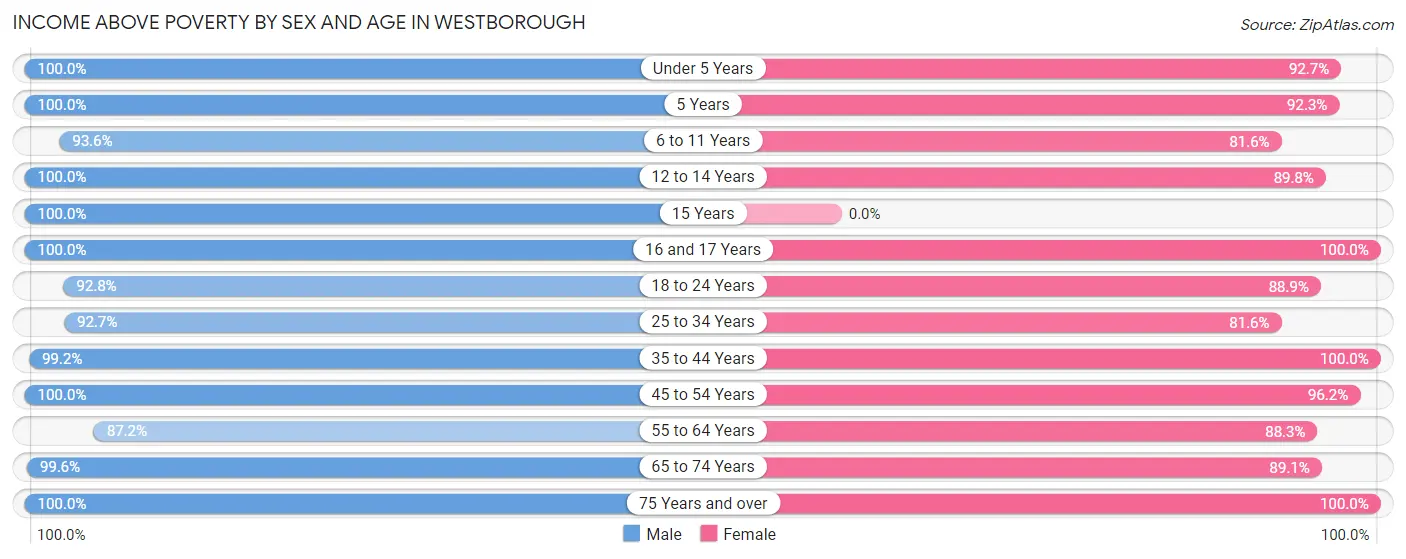
| Age Bracket | Male | Female |
| Under 5 Years | 65 (100.0%) | 101 (92.7%) |
| 5 Years | 8 (100.0%) | 12 (92.3%) |
| 6 to 11 Years | 87 (93.5%) | 102 (81.6%) |
| 12 to 14 Years | 103 (100.0%) | 97 (89.8%) |
| 15 Years | 16 (100.0%) | 0 (0.0%) |
| 16 and 17 Years | 57 (100.0%) | 31 (100.0%) |
| 18 to 24 Years | 206 (92.8%) | 104 (88.9%) |
| 25 to 34 Years | 342 (92.7%) | 279 (81.6%) |
| 35 to 44 Years | 243 (99.2%) | 233 (100.0%) |
| 45 to 54 Years | 317 (100.0%) | 278 (96.2%) |
| 55 to 64 Years | 251 (87.2%) | 398 (88.2%) |
| 65 to 74 Years | 232 (99.6%) | 171 (89.1%) |
| 75 Years and over | 91 (100.0%) | 111 (100.0%) |
| Total | 2,018 (95.8%) | 1,917 (90.4%) |
Income Below Poverty Among Married-Couple Families in Westborough
The poverty statistics for married-couple families in Westborough show that 7.1% or 49 of the total 687 families live below the poverty line. Families with 1 or 2 children have the highest poverty rate of 12.9%, comprising of 30 families. On the other hand, families with no children have the lowest poverty rate of 3.3%, which includes 12 families.
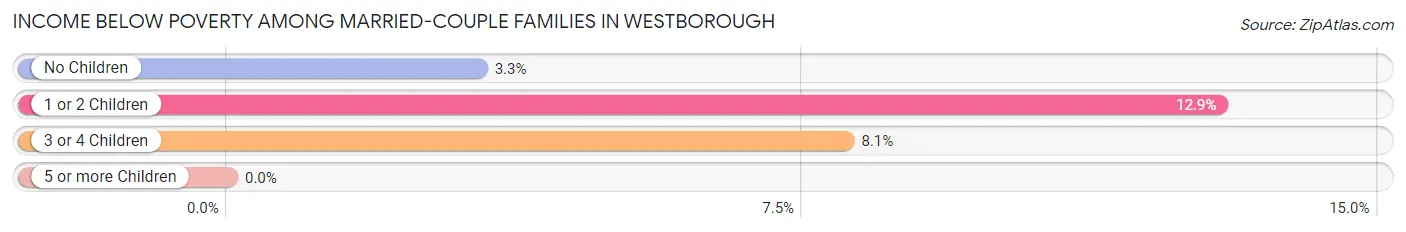
| Children | Above Poverty | Below Poverty |
| No Children | 356 (96.7%) | 12 (3.3%) |
| 1 or 2 Children | 202 (87.1%) | 30 (12.9%) |
| 3 or 4 Children | 80 (91.9%) | 7 (8.1%) |
| 5 or more Children | 0 (0.0%) | 0 (0.0%) |
| Total | 638 (92.9%) | 49 (7.1%) |
Income Below Poverty Among Single-Parent Households in Westborough
| Children | Single Father | Single Mother |
| No Children | 0 (0.0%) | 0 (0.0%) |
| 1 or 2 Children | 0 (0.0%) | 0 (0.0%) |
| 3 or 4 Children | 0 (0.0%) | 0 (0.0%) |
| 5 or more Children | 0 (0.0%) | 0 (0.0%) |
| Total | 0 (0.0%) | 0 (0.0%) |
Income Below Poverty Among Married-Couple vs Single-Parent Households in Westborough
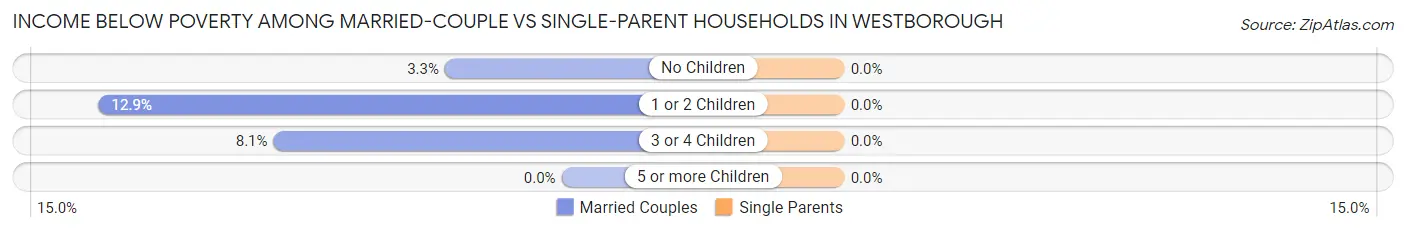
| Children | Married-Couple Families | Single-Parent Households |
| No Children | 12 (3.3%) | 0 (0.0%) |
| 1 or 2 Children | 30 (12.9%) | 0 (0.0%) |
| 3 or 4 Children | 7 (8.1%) | 0 (0.0%) |
| 5 or more Children | 0 (0.0%) | 0 (0.0%) |
| Total | 49 (7.1%) | 0 (0.0%) |
Race in Westborough
The most populous races in Westborough are White / Caucasian (3,612 | 82.5%), Asian (357 | 8.2%), and Hispanic or Latino (319 | 7.3%).
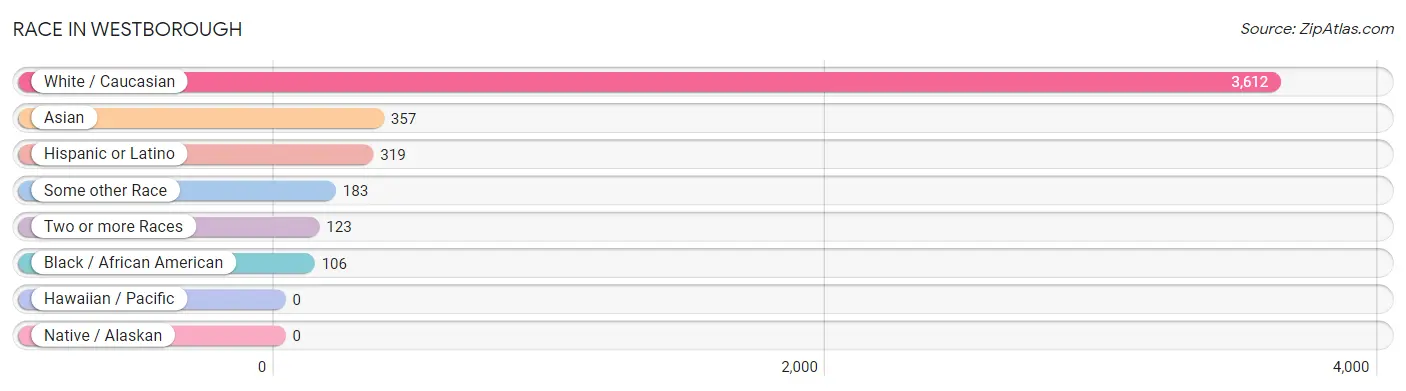
| Race | # Population | % Population |
| Asian | 357 | 8.2% |
| Black / African American | 106 | 2.4% |
| Hawaiian / Pacific | 0 | 0.0% |
| Hispanic or Latino | 319 | 7.3% |
| Native / Alaskan | 0 | 0.0% |
| White / Caucasian | 3,612 | 82.5% |
| Two or more Races | 123 | 2.8% |
| Some other Race | 183 | 4.2% |
| Total | 4,381 | 100.0% |
Ancestry in Westborough
The most populous ancestries reported in Westborough are Irish (860 | 19.6%), Italian (680 | 15.5%), English (493 | 11.3%), French (273 | 6.2%), and German (258 | 5.9%), together accounting for 58.5% of all Westborough residents.
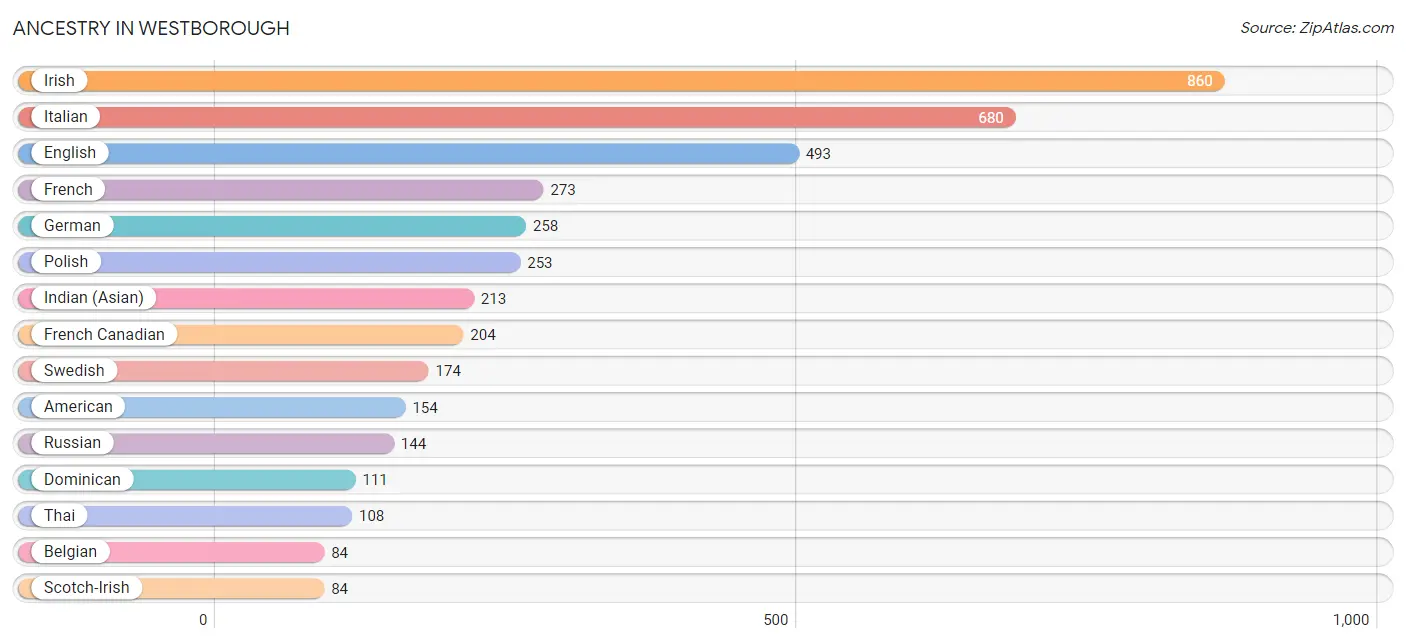
| Ancestry | # Population | % Population |
| African | 18 | 0.4% |
| American | 154 | 3.5% |
| Arab | 32 | 0.7% |
| Australian | 11 | 0.3% |
| Austrian | 15 | 0.3% |
| Belgian | 84 | 1.9% |
| Bhutanese | 24 | 0.5% |
| Brazilian | 48 | 1.1% |
| British | 31 | 0.7% |
| Canadian | 30 | 0.7% |
| Central American | 41 | 0.9% |
| Cherokee | 11 | 0.3% |
| Colombian | 52 | 1.2% |
| Czech | 16 | 0.4% |
| Dominican | 111 | 2.5% |
| Dutch | 67 | 1.5% |
| Eastern European | 12 | 0.3% |
| Egyptian | 11 | 0.3% |
| English | 493 | 11.3% |
| Ethiopian | 15 | 0.3% |
| European | 39 | 0.9% |
| Finnish | 66 | 1.5% |
| French | 273 | 6.2% |
| French Canadian | 204 | 4.7% |
| German | 258 | 5.9% |
| Greek | 38 | 0.9% |
| Guatemalan | 41 | 0.9% |
| Haitian | 2 | 0.1% |
| Hungarian | 34 | 0.8% |
| Indian (Asian) | 213 | 4.9% |
| Iranian | 60 | 1.4% |
| Irish | 860 | 19.6% |
| Italian | 680 | 15.5% |
| Jamaican | 8 | 0.2% |
| Korean | 50 | 1.1% |
| Lebanese | 16 | 0.4% |
| Lithuanian | 9 | 0.2% |
| Mexican | 28 | 0.6% |
| Northern European | 9 | 0.2% |
| Polish | 253 | 5.8% |
| Portuguese | 13 | 0.3% |
| Puerto Rican | 75 | 1.7% |
| Russian | 144 | 3.3% |
| Scandinavian | 62 | 1.4% |
| Scotch-Irish | 84 | 1.9% |
| Scottish | 79 | 1.8% |
| Slovak | 9 | 0.2% |
| South American | 52 | 1.2% |
| Spanish | 11 | 0.3% |
| Subsaharan African | 33 | 0.7% |
| Swedish | 174 | 4.0% |
| Swiss | 7 | 0.2% |
| Syrian | 5 | 0.1% |
| Thai | 108 | 2.5% |
| Turkish | 42 | 1.0% |
| Welsh | 31 | 0.7% |
| Yugoslavian | 13 | 0.3% | View All 57 Rows |
Immigrants in Westborough
The most numerous immigrant groups reported in Westborough came from Asia (272 | 6.2%), Latin America (144 | 3.3%), Europe (142 | 3.2%), South Central Asia (139 | 3.2%), and South America (126 | 2.9%), together accounting for 18.8% of all Westborough residents.
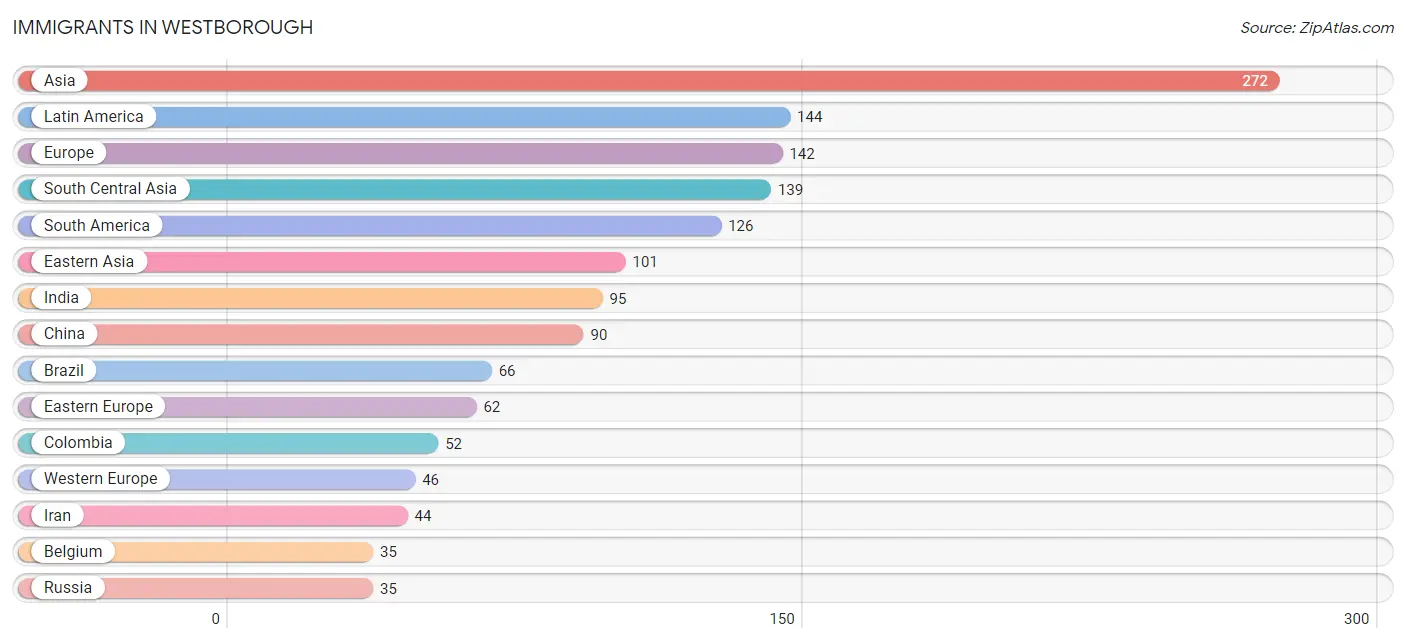
| Immigration Origin | # Population | % Population |
| Africa | 26 | 0.6% |
| Asia | 272 | 6.2% |
| Australia | 14 | 0.3% |
| Austria | 11 | 0.3% |
| Belgium | 35 | 0.8% |
| Brazil | 66 | 1.5% |
| Canada | 31 | 0.7% |
| Caribbean | 2 | 0.1% |
| Central America | 16 | 0.4% |
| China | 90 | 2.1% |
| Colombia | 52 | 1.2% |
| Eastern Africa | 15 | 0.3% |
| Eastern Asia | 101 | 2.3% |
| Eastern Europe | 62 | 1.4% |
| Egypt | 11 | 0.3% |
| England | 8 | 0.2% |
| Ethiopia | 15 | 0.3% |
| Europe | 142 | 3.2% |
| Haiti | 2 | 0.1% |
| India | 95 | 2.2% |
| Iran | 44 | 1.0% |
| Italy | 6 | 0.1% |
| Japan | 11 | 0.3% |
| Latin America | 144 | 3.3% |
| Mexico | 16 | 0.4% |
| Northern Africa | 11 | 0.3% |
| Northern Europe | 17 | 0.4% |
| Oceania | 14 | 0.3% |
| Philippines | 17 | 0.4% |
| Poland | 27 | 0.6% |
| Russia | 35 | 0.8% |
| South America | 126 | 2.9% |
| South Central Asia | 139 | 3.2% |
| South Eastern Asia | 17 | 0.4% |
| Southern Europe | 17 | 0.4% |
| Spain | 11 | 0.3% |
| Sweden | 9 | 0.2% |
| Turkey | 15 | 0.3% |
| Venezuela | 8 | 0.2% |
| Western Asia | 15 | 0.3% |
| Western Europe | 46 | 1.1% | View All 41 Rows |
Sex and Age in Westborough
Sex and Age in Westborough
The most populous age groups in Westborough are 30 to 34 Years (244 | 11.0%) for men and 60 to 64 Years (282 | 13.0%) for women.
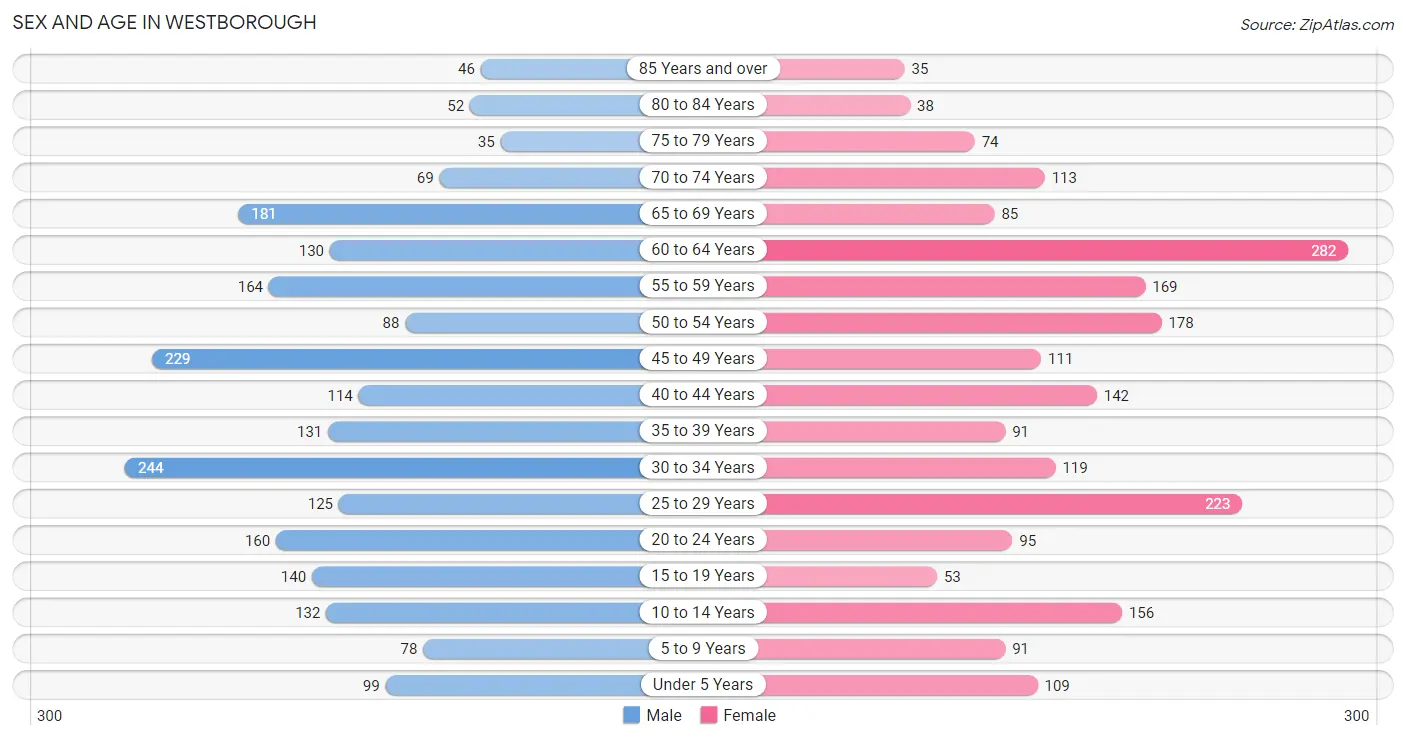
| Age Bracket | Male | Female |
| Under 5 Years | 99 (4.5%) | 109 (5.0%) |
| 5 to 9 Years | 78 (3.5%) | 91 (4.2%) |
| 10 to 14 Years | 132 (5.9%) | 156 (7.2%) |
| 15 to 19 Years | 140 (6.3%) | 53 (2.5%) |
| 20 to 24 Years | 160 (7.2%) | 95 (4.4%) |
| 25 to 29 Years | 125 (5.6%) | 223 (10.3%) |
| 30 to 34 Years | 244 (11.0%) | 119 (5.5%) |
| 35 to 39 Years | 131 (5.9%) | 91 (4.2%) |
| 40 to 44 Years | 114 (5.1%) | 142 (6.6%) |
| 45 to 49 Years | 229 (10.3%) | 111 (5.1%) |
| 50 to 54 Years | 88 (4.0%) | 178 (8.2%) |
| 55 to 59 Years | 164 (7.4%) | 169 (7.8%) |
| 60 to 64 Years | 130 (5.9%) | 282 (13.0%) |
| 65 to 69 Years | 181 (8.2%) | 85 (3.9%) |
| 70 to 74 Years | 69 (3.1%) | 113 (5.2%) |
| 75 to 79 Years | 35 (1.6%) | 74 (3.4%) |
| 80 to 84 Years | 52 (2.4%) | 38 (1.8%) |
| 85 Years and over | 46 (2.1%) | 35 (1.6%) |
| Total | 2,217 (100.0%) | 2,164 (100.0%) |
Families and Households in Westborough
Median Family Size in Westborough
The median family size in Westborough is 3.20 persons per family, with married-couple families (687 | 77.6%) accounting for the largest median family size of 3.46 persons per family. On the other hand, single male/father families (52 | 5.9%) represent the smallest median family size with 2.06 persons per family.
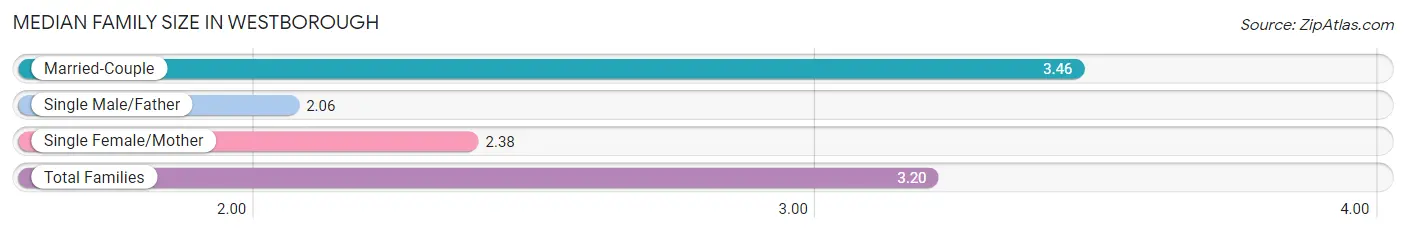
| Family Type | # Families | Family Size |
| Married-Couple | 687 (77.6%) | 3.46 |
| Single Male/Father | 52 (5.9%) | 2.06 |
| Single Female/Mother | 146 (16.5%) | 2.38 |
| Total Families | 885 (100.0%) | 3.20 |
Median Household Size in Westborough
The median household size in Westborough is 2.13 persons per household, with married-couple households (687 | 34.5%) accounting for the largest median household size of 3.51 persons per household. non-family households (1,107 | 55.6%) represent the smallest median household size with 1.23 persons per household.
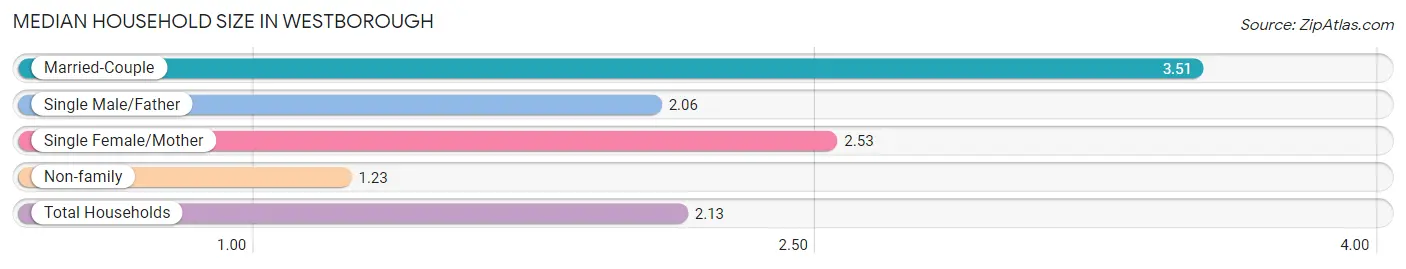
| Household Type | # Households | Household Size |
| Married-Couple | 687 (34.5%) | 3.51 |
| Single Male/Father | 52 (2.6%) | 2.06 |
| Single Female/Mother | 146 (7.3%) | 2.53 |
| Non-family | 1,107 (55.6%) | 1.23 |
| Total Households | 1,992 (100.0%) | 2.13 |
Household Size by Marriage Status in Westborough
Out of a total of 1,992 households in Westborough, 885 (44.4%) are family households, while 1,107 (55.6%) are nonfamily households. The most numerous type of family households are 2-person households, comprising 413, and the most common type of nonfamily households are 1-person households, comprising 862.
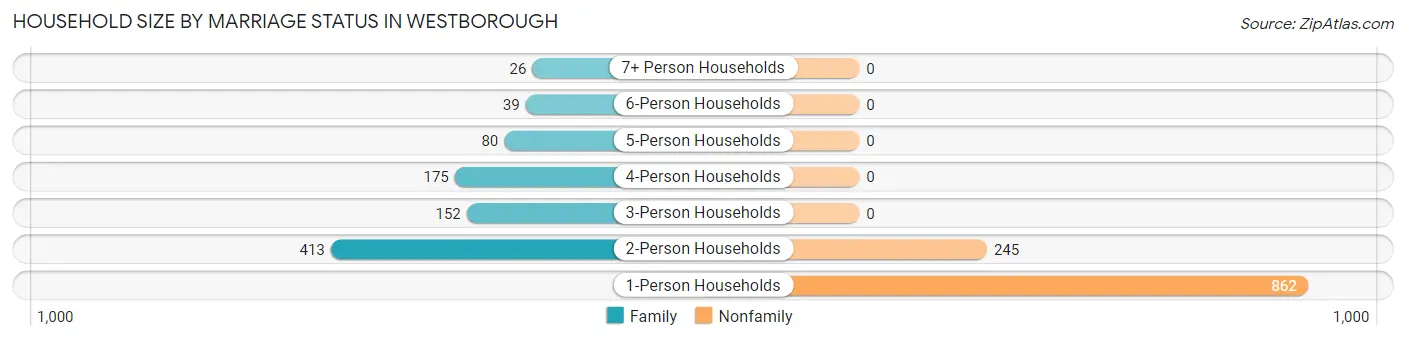
| Household Size | Family Households | Nonfamily Households |
| 1-Person Households | - | 862 (43.3%) |
| 2-Person Households | 413 (20.7%) | 245 (12.3%) |
| 3-Person Households | 152 (7.6%) | 0 (0.0%) |
| 4-Person Households | 175 (8.8%) | 0 (0.0%) |
| 5-Person Households | 80 (4.0%) | 0 (0.0%) |
| 6-Person Households | 39 (2.0%) | 0 (0.0%) |
| 7+ Person Households | 26 (1.3%) | 0 (0.0%) |
| Total | 885 (44.4%) | 1,107 (55.6%) |
Female Fertility in Westborough
Fertility by Age in Westborough
Average fertility rate in Westborough is 68.0 births per 1,000 women. Women in the age bracket of 35 to 50 years have the highest fertility rate with 99.0 births per 1,000 women. Women in the age bracket of 35 to 50 years acount for 59.7% of all women with births.
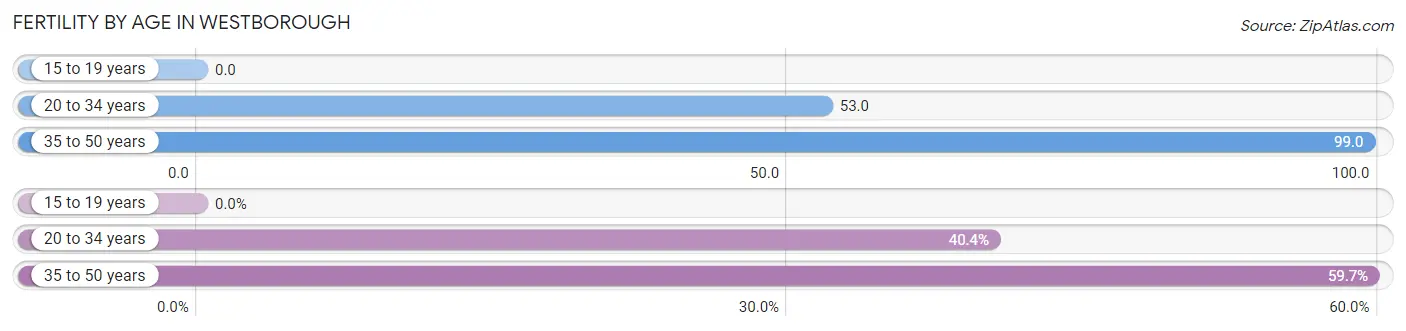
| Age Bracket | Women with Births | Births / 1,000 Women |
| 15 to 19 years | 0 (0.0%) | 0.0 |
| 20 to 34 years | 23 (40.4%) | 53.0 |
| 35 to 50 years | 34 (59.7%) | 99.0 |
| Total | 57 (100.0%) | 68.0 |
Fertility by Age by Marriage Status in Westborough
68.4% of women with births (57) in Westborough are married. The highest percentage of unmarried women with births falls into 20 to 34 years age bracket with 47.8% of them unmarried at the time of birth, while the lowest percentage of unmarried women with births belong to 35 to 50 years age bracket with 20.6% of them unmarried.
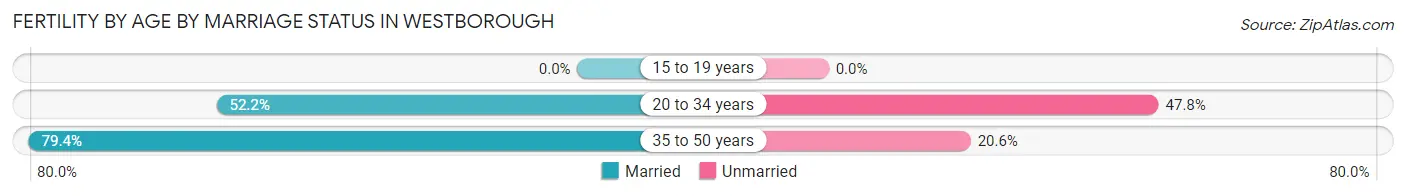
| Age Bracket | Married | Unmarried |
| 15 to 19 years | 0 (0.0%) | 0 (0.0%) |
| 20 to 34 years | 12 (52.2%) | 11 (47.8%) |
| 35 to 50 years | 27 (79.4%) | 7 (20.6%) |
| Total | 39 (68.4%) | 18 (31.6%) |
Fertility by Education in Westborough
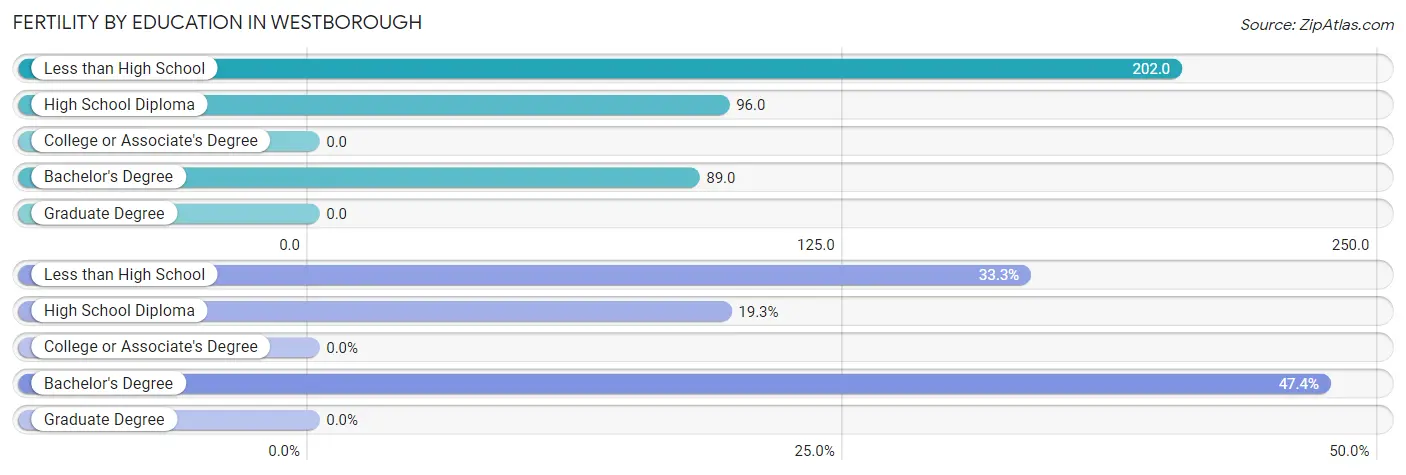
| Educational Attainment | Women with Births | Births / 1,000 Women |
| Less than High School | 19 (33.3%) | 202.0 |
| High School Diploma | 11 (19.3%) | 96.0 |
| College or Associate's Degree | 0 (0.0%) | 0.0 |
| Bachelor's Degree | 27 (47.4%) | 89.0 |
| Graduate Degree | 0 (0.0%) | 0.0 |
| Total | 57 (100.0%) | 68.0 |
Fertility by Education by Marriage Status in Westborough
31.6% of women with births in Westborough are unmarried. Women with the educational attainment of less than high school are most likely to be married with 100.0% of them married at childbirth, while women with the educational attainment of high school diploma are least likely to be married with 100.0% of them unmarried at childbirth.
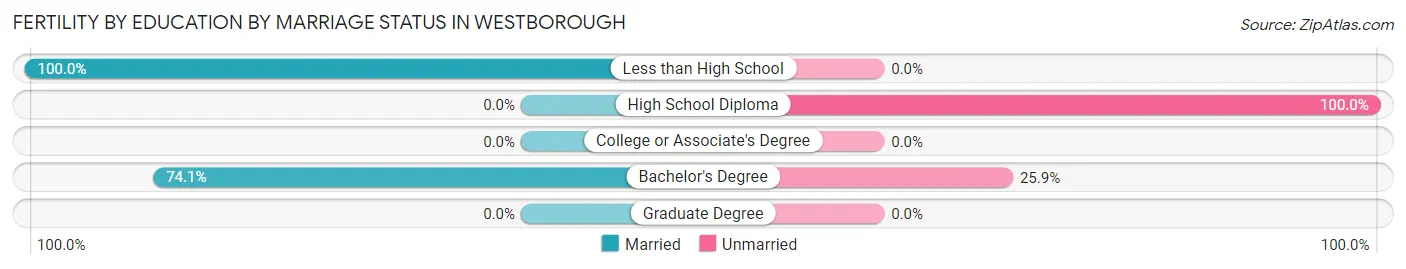
| Educational Attainment | Married | Unmarried |
| Less than High School | 19 (100.0%) | 0 (0.0%) |
| High School Diploma | 0 (0.0%) | 11 (100.0%) |
| College or Associate's Degree | 0 (0.0%) | 0 (0.0%) |
| Bachelor's Degree | 20 (74.1%) | 7 (25.9%) |
| Graduate Degree | 0 (0.0%) | 0 (0.0%) |
| Total | 39 (68.4%) | 18 (31.6%) |
Employment Characteristics in Westborough
Employment by Class of Employer in Westborough
Among the 2,463 employed individuals in Westborough, private company employees (1,678 | 68.1%), not-for-profit organizations (381 | 15.5%), and self-employed (not incorporated) (114 | 4.6%) make up the most common classes of employment.
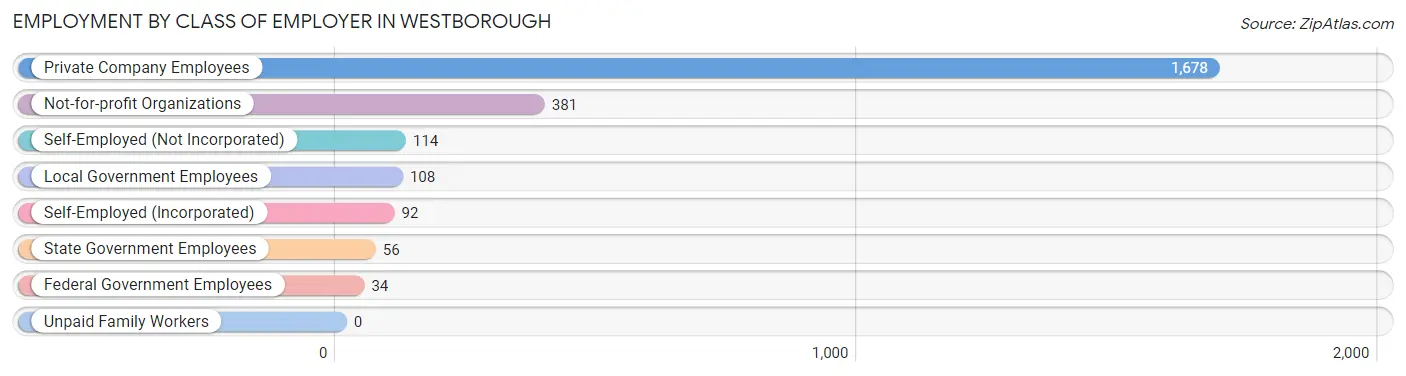
| Employer Class | # Employees | % Employees |
| Private Company Employees | 1,678 | 68.1% |
| Self-Employed (Incorporated) | 92 | 3.7% |
| Self-Employed (Not Incorporated) | 114 | 4.6% |
| Not-for-profit Organizations | 381 | 15.5% |
| Local Government Employees | 108 | 4.4% |
| State Government Employees | 56 | 2.3% |
| Federal Government Employees | 34 | 1.4% |
| Unpaid Family Workers | 0 | 0.0% |
| Total | 2,463 | 100.0% |
Employment Status by Age in Westborough
According to the labor force statistics for Westborough, out of the total population over 16 years of age (3,700), 70.7% or 2,616 individuals are in the labor force, with 2.3% or 60 of them unemployed. The age group with the highest labor force participation rate is 25 to 29 years, with 91.1% or 317 individuals in the labor force. Within the labor force, the 45 to 54 years age range has the highest percentage of unemployed individuals, with 7.5% or 41 of them being unemployed.
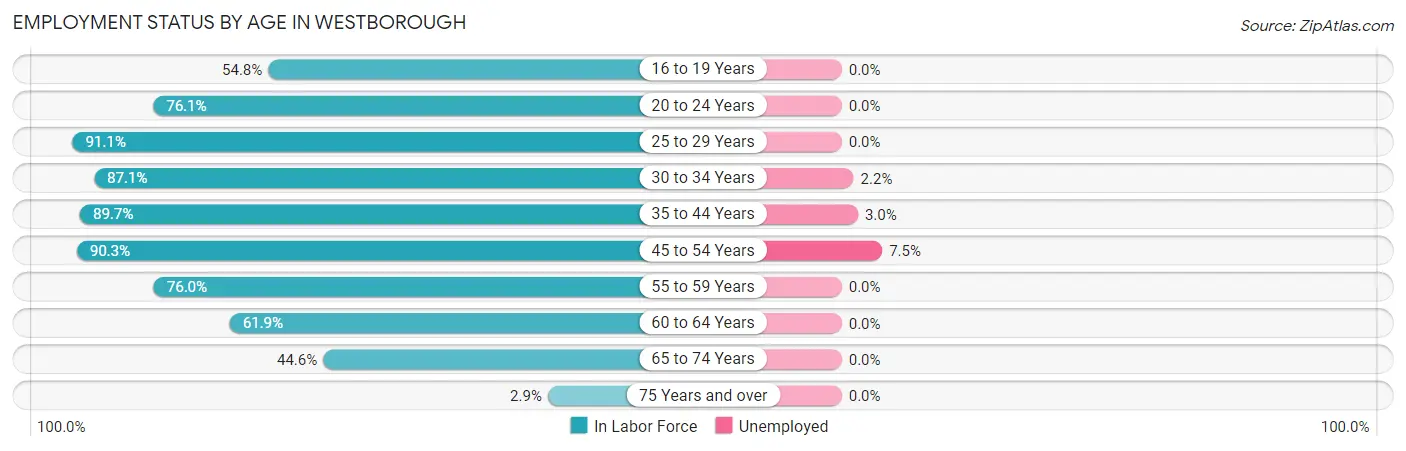
| Age Bracket | In Labor Force | Unemployed |
| 16 to 19 Years | 97 (54.8%) | 0 (0.0%) |
| 20 to 24 Years | 194 (76.1%) | 0 (0.0%) |
| 25 to 29 Years | 317 (91.1%) | 0 (0.0%) |
| 30 to 34 Years | 316 (87.1%) | 7 (2.2%) |
| 35 to 44 Years | 429 (89.7%) | 13 (3.0%) |
| 45 to 54 Years | 547 (90.3%) | 41 (7.5%) |
| 55 to 59 Years | 253 (76.0%) | 0 (0.0%) |
| 60 to 64 Years | 255 (61.9%) | 0 (0.0%) |
| 65 to 74 Years | 200 (44.6%) | 0 (0.0%) |
| 75 Years and over | 8 (2.9%) | 0 (0.0%) |
| Total | 2,616 (70.7%) | 60 (2.3%) |
Employment Status by Educational Attainment in Westborough
According to labor force statistics for Westborough, 83.3% of individuals (2,116) out of the total population between 25 and 64 years of age (2,540) are in the labor force, with 2.9% or 61 of them being unemployed. The group with the highest labor force participation rate are those with the educational attainment of bachelor's degree or higher, with 93.2% or 1,358 individuals in the labor force. Within the labor force, individuals with high school diploma education have the highest percentage of unemployment, with 4.9% or 13 of them being unemployed.
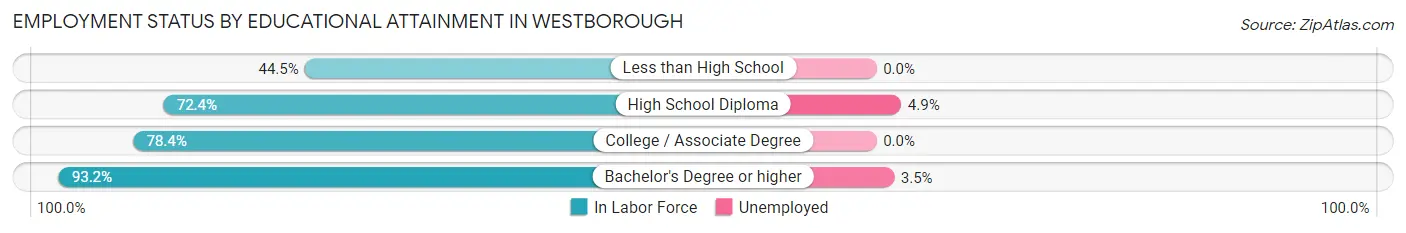
| Educational Attainment | In Labor Force | Unemployed |
| Less than High School | 89 (44.5%) | 0 (0.0%) |
| High School Diploma | 267 (72.4%) | 18 (4.9%) |
| College / Associate Degree | 403 (78.4%) | 0 (0.0%) |
| Bachelor's Degree or higher | 1,358 (93.2%) | 51 (3.5%) |
| Total | 2,116 (83.3%) | 74 (2.9%) |
Employment Occupations by Sex in Westborough
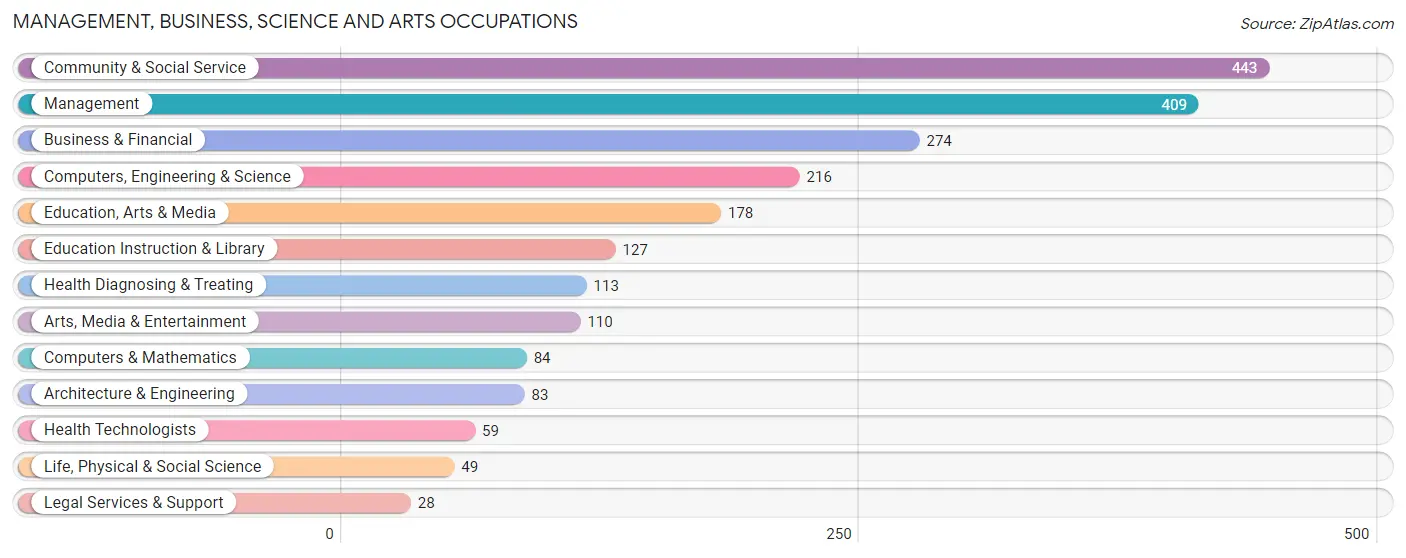
Management, Business, Science and Arts Occupations
The most common Management, Business, Science and Arts occupations in Westborough are Community & Social Service (443 | 17.3%), Management (409 | 16.0%), Business & Financial (274 | 10.7%), Computers, Engineering & Science (216 | 8.5%), and Education, Arts & Media (178 | 7.0%).
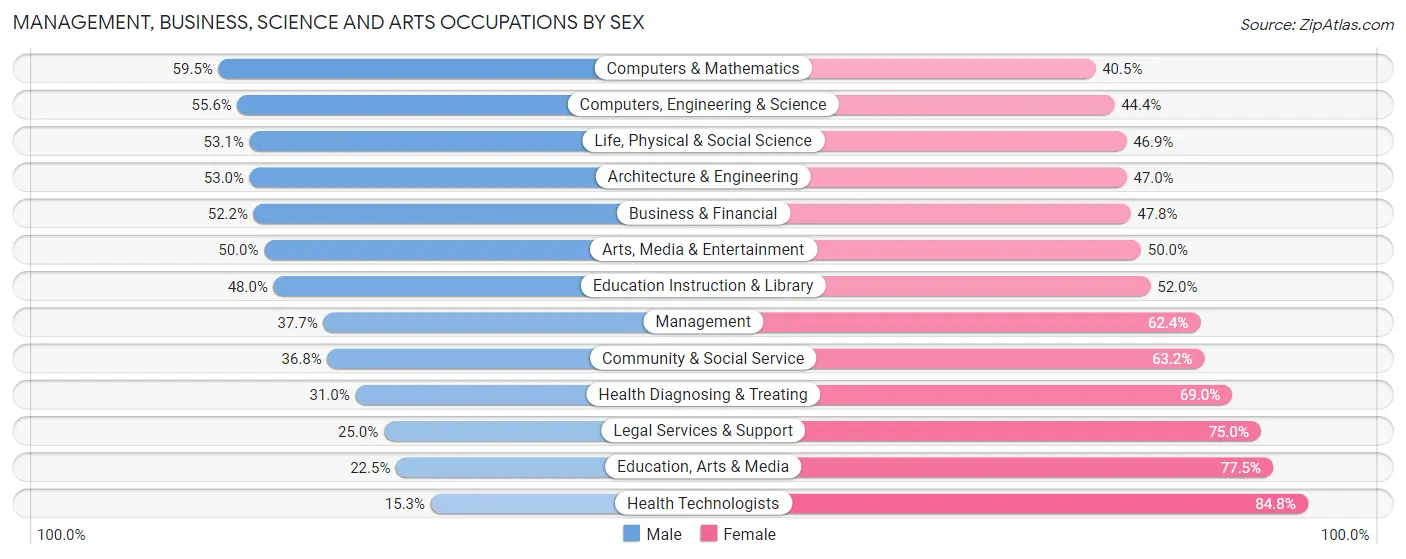
Management, Business, Science and Arts Occupations by Sex
Within the Management, Business, Science and Arts occupations in Westborough, the most male-oriented occupations are Computers & Mathematics (59.5%), Computers, Engineering & Science (55.6%), and Life, Physical & Social Science (53.1%), while the most female-oriented occupations are Health Technologists (84.8%), Education, Arts & Media (77.5%), and Legal Services & Support (75.0%).
| Occupation | Male | Female |
| Management | 154 (37.7%) | 255 (62.4%) |
| Business & Financial | 143 (52.2%) | 131 (47.8%) |
| Computers, Engineering & Science | 120 (55.6%) | 96 (44.4%) |
| Computers & Mathematics | 50 (59.5%) | 34 (40.5%) |
| Architecture & Engineering | 44 (53.0%) | 39 (47.0%) |
| Life, Physical & Social Science | 26 (53.1%) | 23 (46.9%) |
| Community & Social Service | 163 (36.8%) | 280 (63.2%) |
| Education, Arts & Media | 40 (22.5%) | 138 (77.5%) |
| Legal Services & Support | 7 (25.0%) | 21 (75.0%) |
| Education Instruction & Library | 61 (48.0%) | 66 (52.0%) |
| Arts, Media & Entertainment | 55 (50.0%) | 55 (50.0%) |
| Health Diagnosing & Treating | 35 (31.0%) | 78 (69.0%) |
| Health Technologists | 9 (15.2%) | 50 (84.8%) |
| Total (Category) | 615 (42.3%) | 840 (57.7%) |
| Total (Overall) | 1,396 (54.6%) | 1,159 (45.4%) |
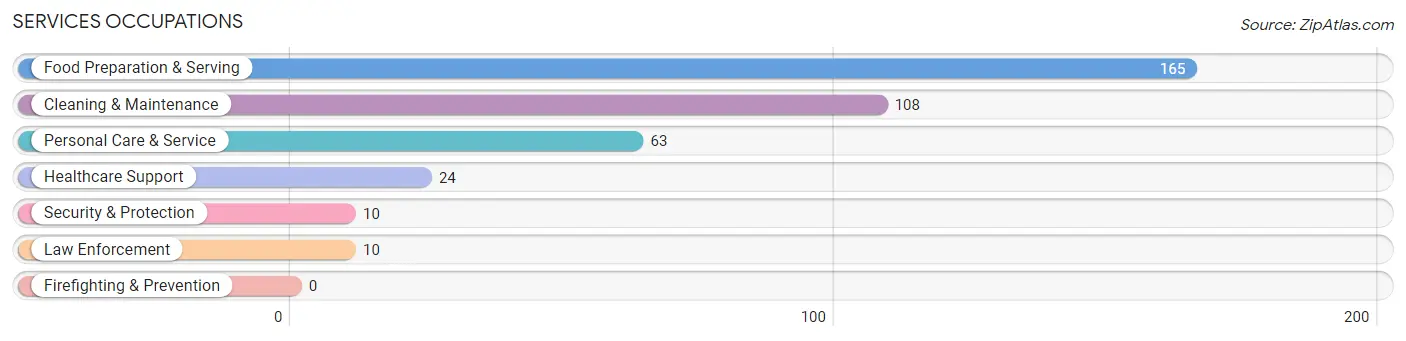
Services Occupations
The most common Services occupations in Westborough are Food Preparation & Serving (165 | 6.5%), Cleaning & Maintenance (108 | 4.2%), Personal Care & Service (63 | 2.5%), Healthcare Support (24 | 0.9%), and Security & Protection (10 | 0.4%).
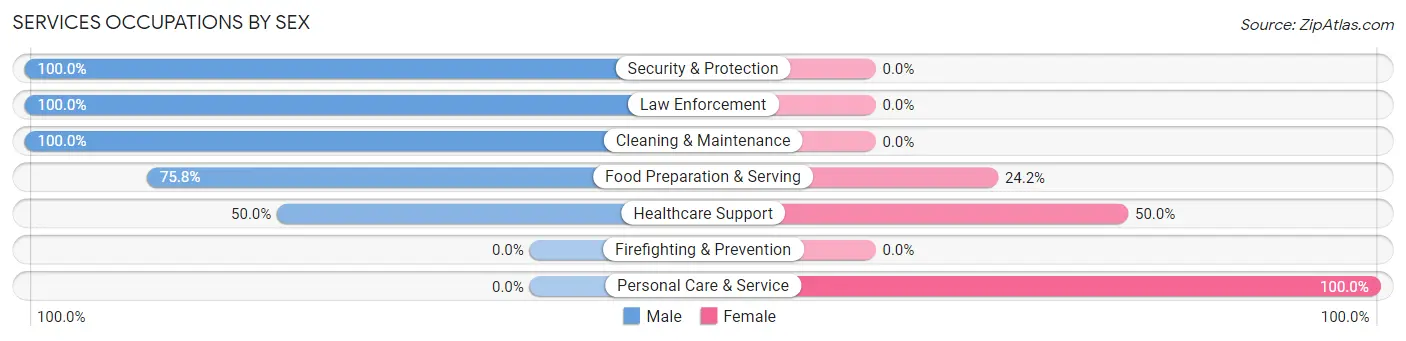
Services Occupations by Sex
Within the Services occupations in Westborough, the most male-oriented occupations are Security & Protection (100.0%), Law Enforcement (100.0%), and Cleaning & Maintenance (100.0%), while the most female-oriented occupations are Personal Care & Service (100.0%), Healthcare Support (50.0%), and Food Preparation & Serving (24.2%).
| Occupation | Male | Female |
| Healthcare Support | 12 (50.0%) | 12 (50.0%) |
| Security & Protection | 10 (100.0%) | 0 (0.0%) |
| Firefighting & Prevention | 0 (0.0%) | 0 (0.0%) |
| Law Enforcement | 10 (100.0%) | 0 (0.0%) |
| Food Preparation & Serving | 125 (75.8%) | 40 (24.2%) |
| Cleaning & Maintenance | 108 (100.0%) | 0 (0.0%) |
| Personal Care & Service | 0 (0.0%) | 63 (100.0%) |
| Total (Category) | 255 (68.9%) | 115 (31.1%) |
| Total (Overall) | 1,396 (54.6%) | 1,159 (45.4%) |
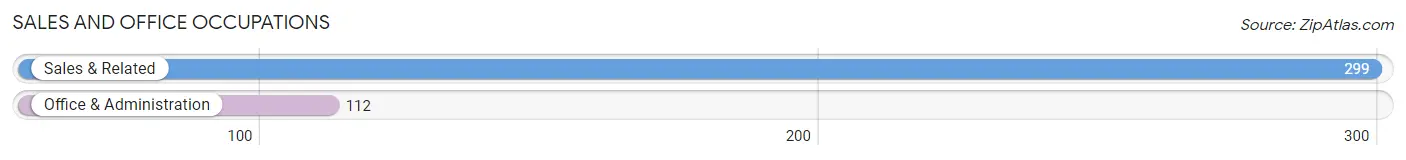
Sales and Office Occupations
The most common Sales and Office occupations in Westborough are Sales & Related (299 | 11.7%), and Office & Administration (112 | 4.4%).
Sales and Office Occupations by Sex
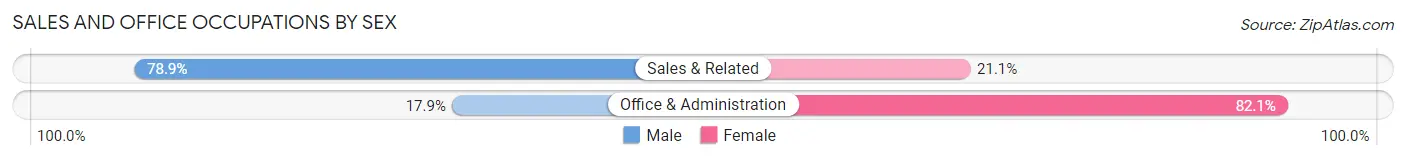
| Occupation | Male | Female |
| Sales & Related | 236 (78.9%) | 63 (21.1%) |
| Office & Administration | 20 (17.9%) | 92 (82.1%) |
| Total (Category) | 256 (62.3%) | 155 (37.7%) |
| Total (Overall) | 1,396 (54.6%) | 1,159 (45.4%) |
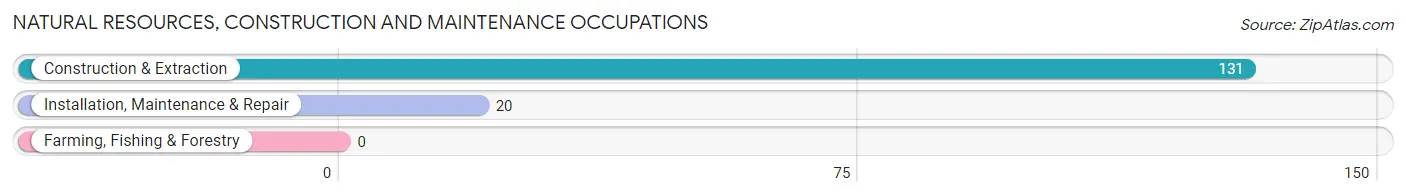
Natural Resources, Construction and Maintenance Occupations
The most common Natural Resources, Construction and Maintenance occupations in Westborough are Construction & Extraction (131 | 5.1%), and Installation, Maintenance & Repair (20 | 0.8%).
Natural Resources, Construction and Maintenance Occupations by Sex
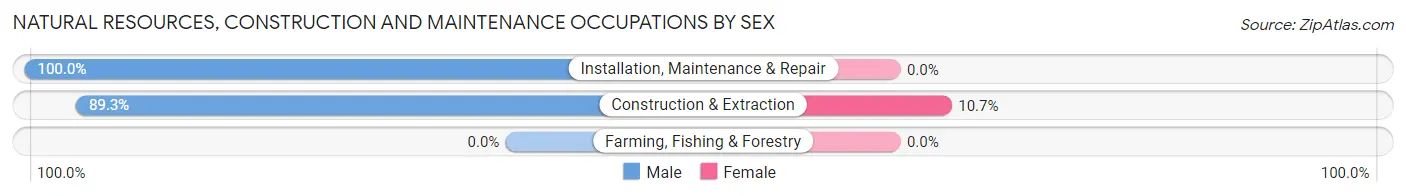
| Occupation | Male | Female |
| Farming, Fishing & Forestry | 0 (0.0%) | 0 (0.0%) |
| Construction & Extraction | 117 (89.3%) | 14 (10.7%) |
| Installation, Maintenance & Repair | 20 (100.0%) | 0 (0.0%) |
| Total (Category) | 137 (90.7%) | 14 (9.3%) |
| Total (Overall) | 1,396 (54.6%) | 1,159 (45.4%) |
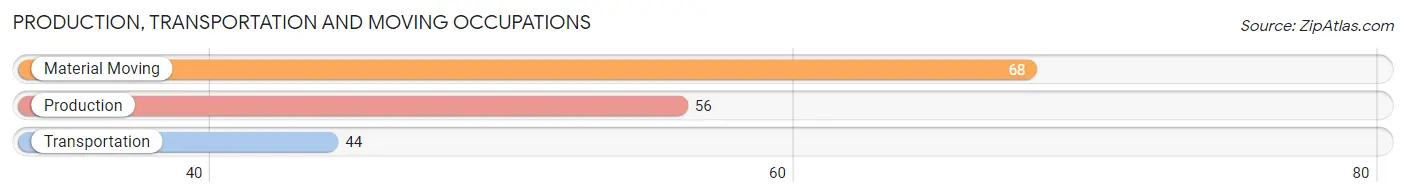
Production, Transportation and Moving Occupations
The most common Production, Transportation and Moving occupations in Westborough are Material Moving (68 | 2.7%), Production (56 | 2.2%), and Transportation (44 | 1.7%).
Production, Transportation and Moving Occupations by Sex
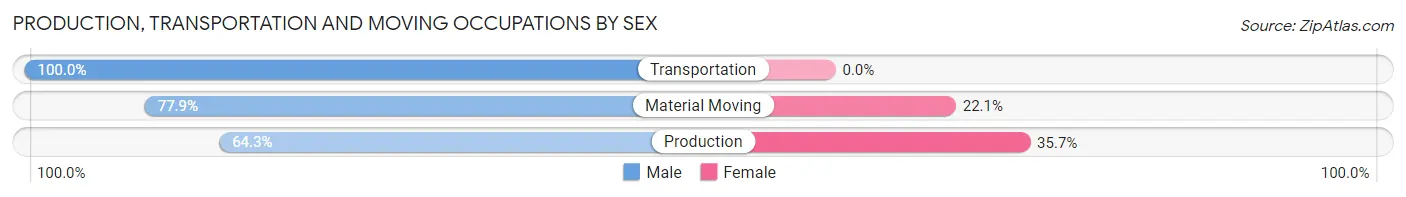
| Occupation | Male | Female |
| Production | 36 (64.3%) | 20 (35.7%) |
| Transportation | 44 (100.0%) | 0 (0.0%) |
| Material Moving | 53 (77.9%) | 15 (22.1%) |
| Total (Category) | 133 (79.2%) | 35 (20.8%) |
| Total (Overall) | 1,396 (54.6%) | 1,159 (45.4%) |
Employment Industries by Sex in Westborough
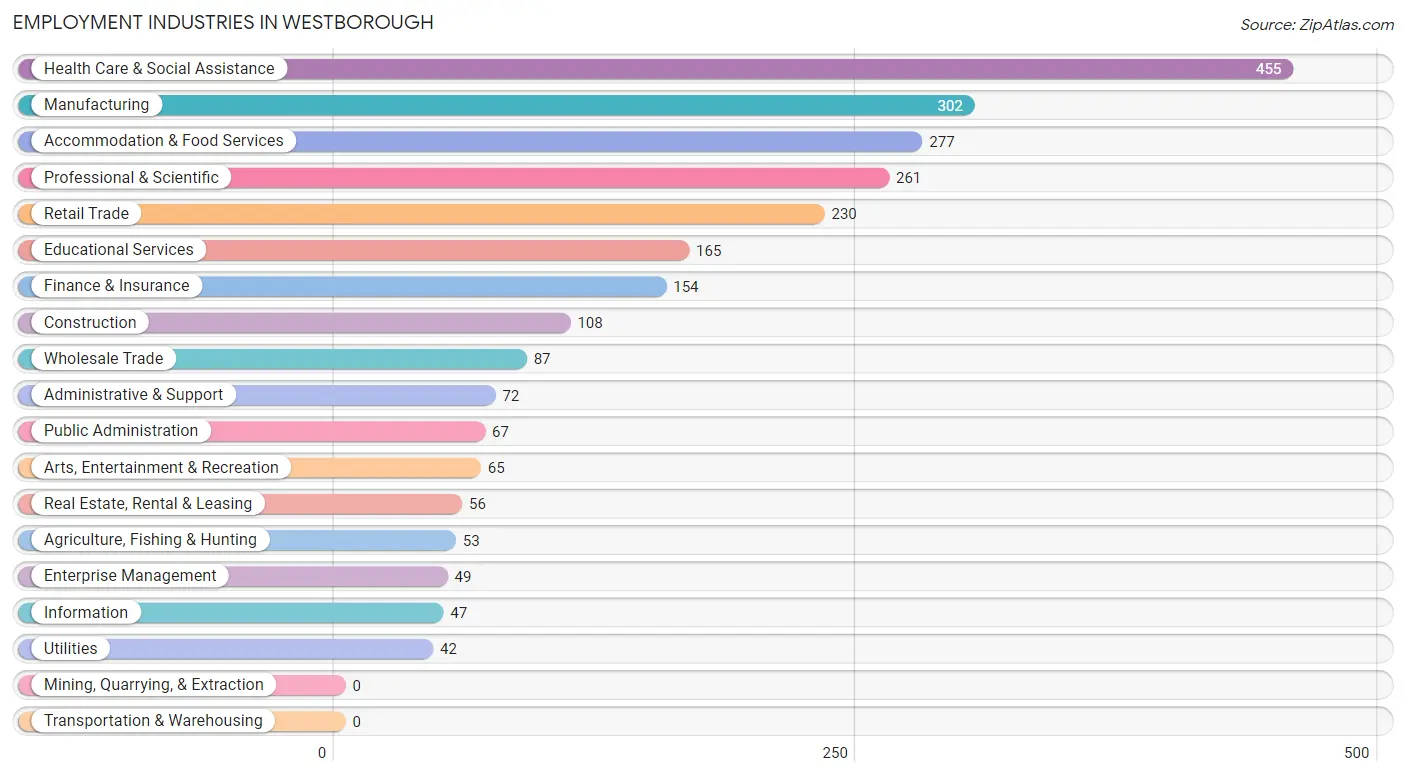
Employment Industries in Westborough
The major employment industries in Westborough include Health Care & Social Assistance (455 | 17.8%), Manufacturing (302 | 11.8%), Accommodation & Food Services (277 | 10.8%), Professional & Scientific (261 | 10.2%), and Retail Trade (230 | 9.0%).
Employment Industries by Sex in Westborough
The Westborough industries that see more men than women are Administrative & Support (87.5%), Real Estate, Rental & Leasing (78.6%), and Agriculture, Fishing & Hunting (73.6%), whereas the industries that tend to have a higher number of women are Enterprise Management (100.0%), Arts, Entertainment & Recreation (100.0%), and Public Administration (85.1%).
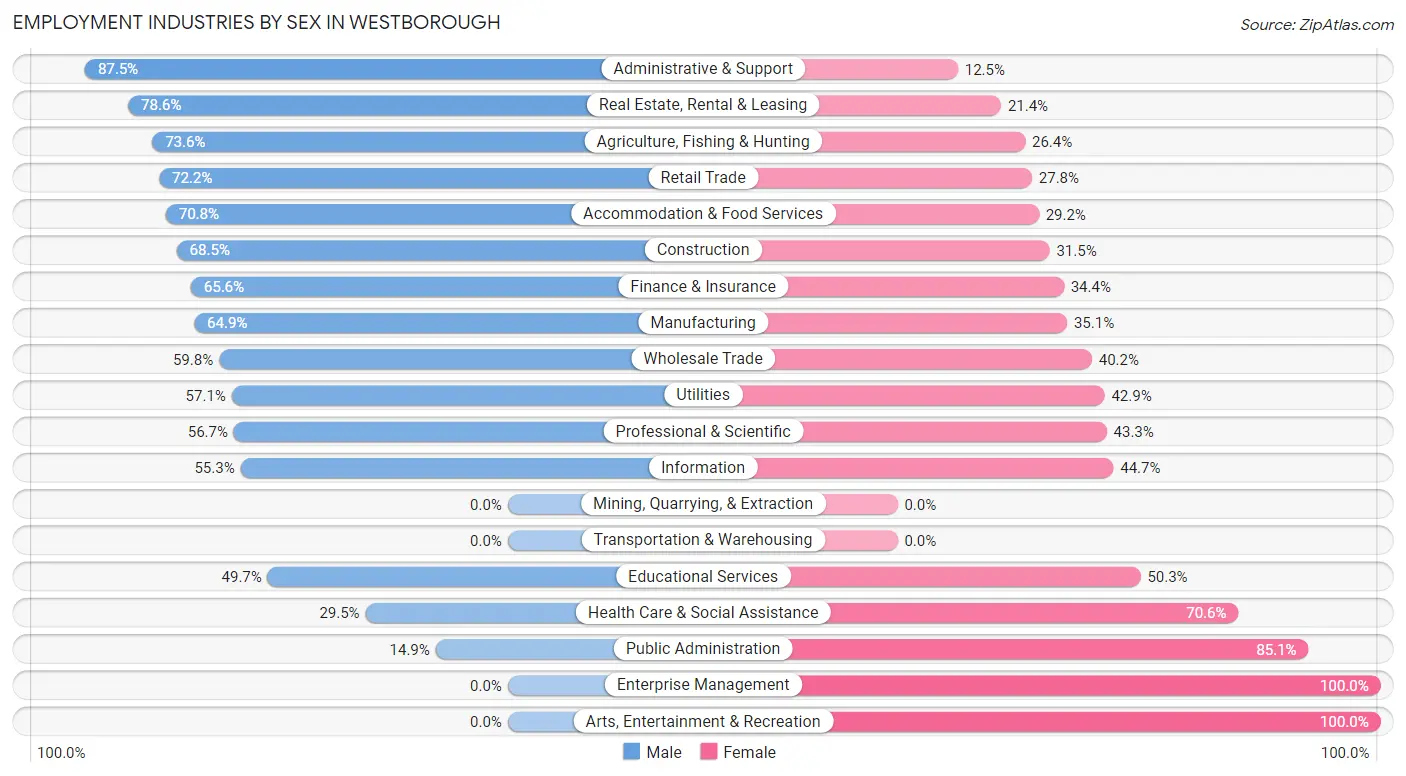
| Industry | Male | Female |
| Agriculture, Fishing & Hunting | 39 (73.6%) | 14 (26.4%) |
| Mining, Quarrying, & Extraction | 0 (0.0%) | 0 (0.0%) |
| Construction | 74 (68.5%) | 34 (31.5%) |
| Manufacturing | 196 (64.9%) | 106 (35.1%) |
| Wholesale Trade | 52 (59.8%) | 35 (40.2%) |
| Retail Trade | 166 (72.2%) | 64 (27.8%) |
| Transportation & Warehousing | 0 (0.0%) | 0 (0.0%) |
| Utilities | 24 (57.1%) | 18 (42.9%) |
| Information | 26 (55.3%) | 21 (44.7%) |
| Finance & Insurance | 101 (65.6%) | 53 (34.4%) |
| Real Estate, Rental & Leasing | 44 (78.6%) | 12 (21.4%) |
| Professional & Scientific | 148 (56.7%) | 113 (43.3%) |
| Enterprise Management | 0 (0.0%) | 49 (100.0%) |
| Administrative & Support | 63 (87.5%) | 9 (12.5%) |
| Educational Services | 82 (49.7%) | 83 (50.3%) |
| Health Care & Social Assistance | 134 (29.4%) | 321 (70.6%) |
| Arts, Entertainment & Recreation | 0 (0.0%) | 65 (100.0%) |
| Accommodation & Food Services | 196 (70.8%) | 81 (29.2%) |
| Public Administration | 10 (14.9%) | 57 (85.1%) |
| Total | 1,396 (54.6%) | 1,159 (45.4%) |
Education in Westborough
School Enrollment in Westborough
The most common levels of schooling among the 799 students in Westborough are middle school (232 | 29.0%), high school (185 | 23.2%), and elementary school (170 | 21.3%).
| School Level | # Students | % Students |
| Nursery / Preschool | 50 | 6.3% |
| Kindergarten | 21 | 2.6% |
| Elementary School | 170 | 21.3% |
| Middle School | 232 | 29.0% |
| High School | 185 | 23.2% |
| College / Undergraduate | 114 | 14.3% |
| Graduate / Professional | 27 | 3.4% |
| Total | 799 | 100.0% |
School Enrollment by Age by Funding Source in Westborough
Out of a total of 799 students who are enrolled in schools in Westborough, 68 (8.5%) attend a private institution, while the remaining 731 (91.5%) are enrolled in public schools. The age group of 25 to 34 year olds has the highest likelihood of being enrolled in private schools, with 18 (72.0% in the age bracket) enrolled. Conversely, the age group of 3 to 4 year olds has the lowest likelihood of being enrolled in a private school, with 50 (100.0% in the age bracket) attending a public institution.
| Age Bracket | Public School | Private School |
| 3 to 4 Year Olds | 50 (100.0%) | 0 (0.0%) |
| 5 to 9 Year Old | 157 (92.9%) | 12 (7.1%) |
| 10 to 14 Year Olds | 282 (97.9%) | 6 (2.1%) |
| 15 to 17 Year Olds | 99 (92.5%) | 8 (7.5%) |
| 18 to 19 Year Olds | 60 (81.1%) | 14 (18.9%) |
| 20 to 24 Year Olds | 34 (77.3%) | 10 (22.7%) |
| 25 to 34 Year Olds | 7 (28.0%) | 18 (72.0%) |
| 35 Years and over | 42 (100.0%) | 0 (0.0%) |
| Total | 731 (91.5%) | 68 (8.5%) |
Educational Attainment by Field of Study in Westborough
Business (468 | 25.1%), liberal arts & history (157 | 8.4%), visual & performing arts (137 | 7.3%), bio, nature & agricultural (133 | 7.1%), and engineering (133 | 7.1%) are the most common fields of study among 1,868 individuals in Westborough who have obtained a bachelor's degree or higher.
| Field of Study | # Graduates | % Graduates |
| Computers & Mathematics | 75 | 4.0% |
| Bio, Nature & Agricultural | 133 | 7.1% |
| Physical & Health Sciences | 65 | 3.5% |
| Psychology | 74 | 4.0% |
| Social Sciences | 116 | 6.2% |
| Engineering | 133 | 7.1% |
| Multidisciplinary Studies | 11 | 0.6% |
| Science & Technology | 114 | 6.1% |
| Business | 468 | 25.1% |
| Education | 74 | 4.0% |
| Literature & Languages | 106 | 5.7% |
| Liberal Arts & History | 157 | 8.4% |
| Visual & Performing Arts | 137 | 7.3% |
| Communications | 73 | 3.9% |
| Arts & Humanities | 132 | 7.1% |
| Total | 1,868 | 100.0% |
Transportation & Commute in Westborough
Vehicle Availability by Sex in Westborough
The most prevalent vehicle ownership categories in Westborough are males with 2 vehicles (543, accounting for 40.8%) and females with 2 vehicles (459, making up 48.1%).
| Vehicles Available | Male | Female |
| No Vehicle | 20 (1.5%) | 0 (0.0%) |
| 1 Vehicle | 404 (30.3%) | 441 (39.1%) |
| 2 Vehicles | 543 (40.8%) | 459 (40.7%) |
| 3 Vehicles | 196 (14.7%) | 131 (11.6%) |
| 4 Vehicles | 111 (8.3%) | 49 (4.3%) |
| 5 or more Vehicles | 58 (4.3%) | 48 (4.3%) |
| Total | 1,332 (100.0%) | 1,128 (100.0%) |
Commute Time in Westborough
The most frequently occuring commute durations in Westborough are 15 to 19 minutes (315 commuters, 16.1%), 10 to 14 minutes (295 commuters, 15.1%), and 5 to 9 minutes (279 commuters, 14.2%).
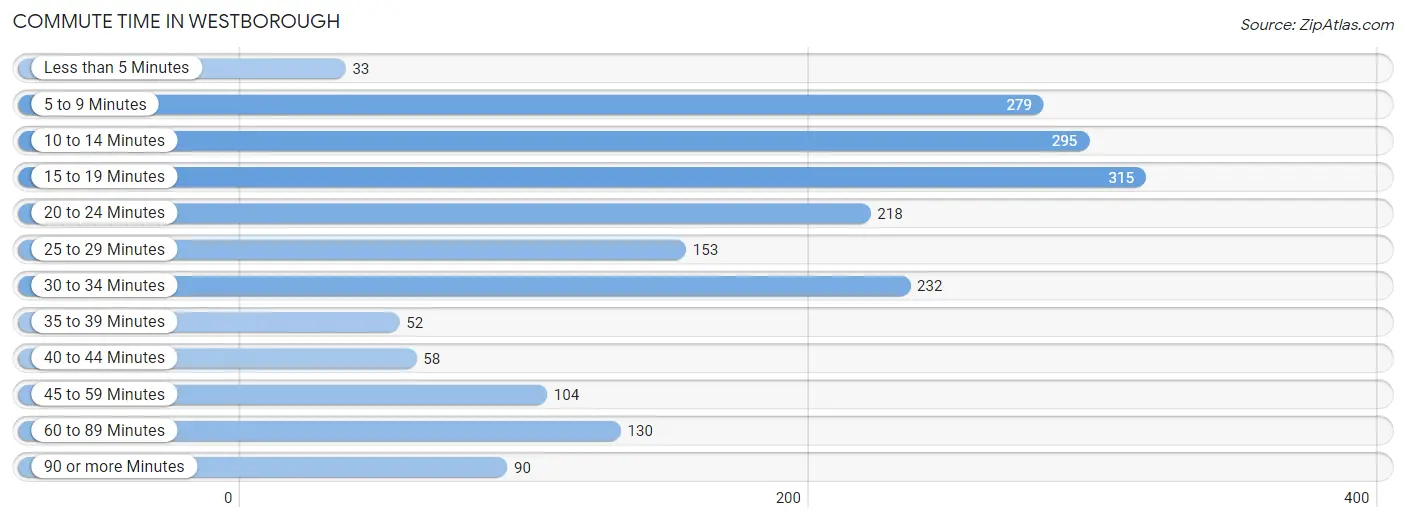
| Commute Time | # Commuters | % Commuters |
| Less than 5 Minutes | 33 | 1.7% |
| 5 to 9 Minutes | 279 | 14.2% |
| 10 to 14 Minutes | 295 | 15.1% |
| 15 to 19 Minutes | 315 | 16.1% |
| 20 to 24 Minutes | 218 | 11.1% |
| 25 to 29 Minutes | 153 | 7.8% |
| 30 to 34 Minutes | 232 | 11.8% |
| 35 to 39 Minutes | 52 | 2.6% |
| 40 to 44 Minutes | 58 | 3.0% |
| 45 to 59 Minutes | 104 | 5.3% |
| 60 to 89 Minutes | 130 | 6.6% |
| 90 or more Minutes | 90 | 4.6% |
Commute Time by Sex in Westborough
The most common commute times in Westborough are 10 to 14 minutes (210 commuters, 18.4%) for males and 15 to 19 minutes (148 commuters, 18.2%) for females.
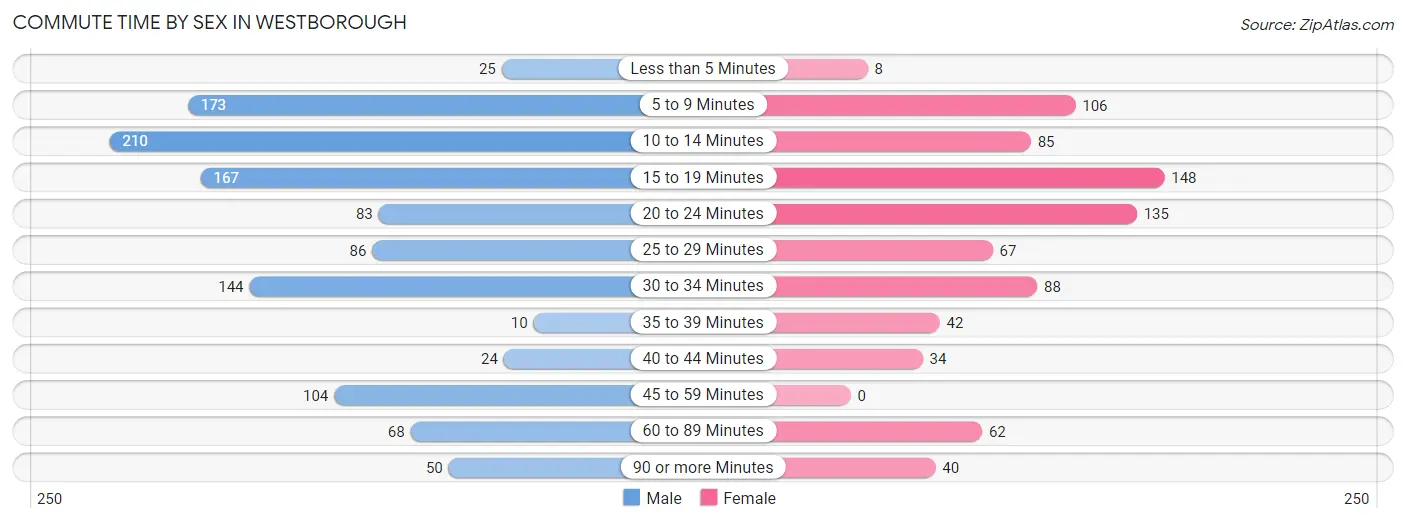
| Commute Time | Male | Female |
| Less than 5 Minutes | 25 (2.2%) | 8 (1.0%) |
| 5 to 9 Minutes | 173 (15.1%) | 106 (13.0%) |
| 10 to 14 Minutes | 210 (18.4%) | 85 (10.4%) |
| 15 to 19 Minutes | 167 (14.6%) | 148 (18.2%) |
| 20 to 24 Minutes | 83 (7.3%) | 135 (16.6%) |
| 25 to 29 Minutes | 86 (7.5%) | 67 (8.2%) |
| 30 to 34 Minutes | 144 (12.6%) | 88 (10.8%) |
| 35 to 39 Minutes | 10 (0.9%) | 42 (5.1%) |
| 40 to 44 Minutes | 24 (2.1%) | 34 (4.2%) |
| 45 to 59 Minutes | 104 (9.1%) | 0 (0.0%) |
| 60 to 89 Minutes | 68 (5.9%) | 62 (7.6%) |
| 90 or more Minutes | 50 (4.4%) | 40 (4.9%) |
Time of Departure to Work by Sex in Westborough
The most frequent times of departure to work in Westborough are 7:30 AM to 7:59 AM (183, 16.0%) for males and 8:00 AM to 8:29 AM (201, 24.7%) for females.
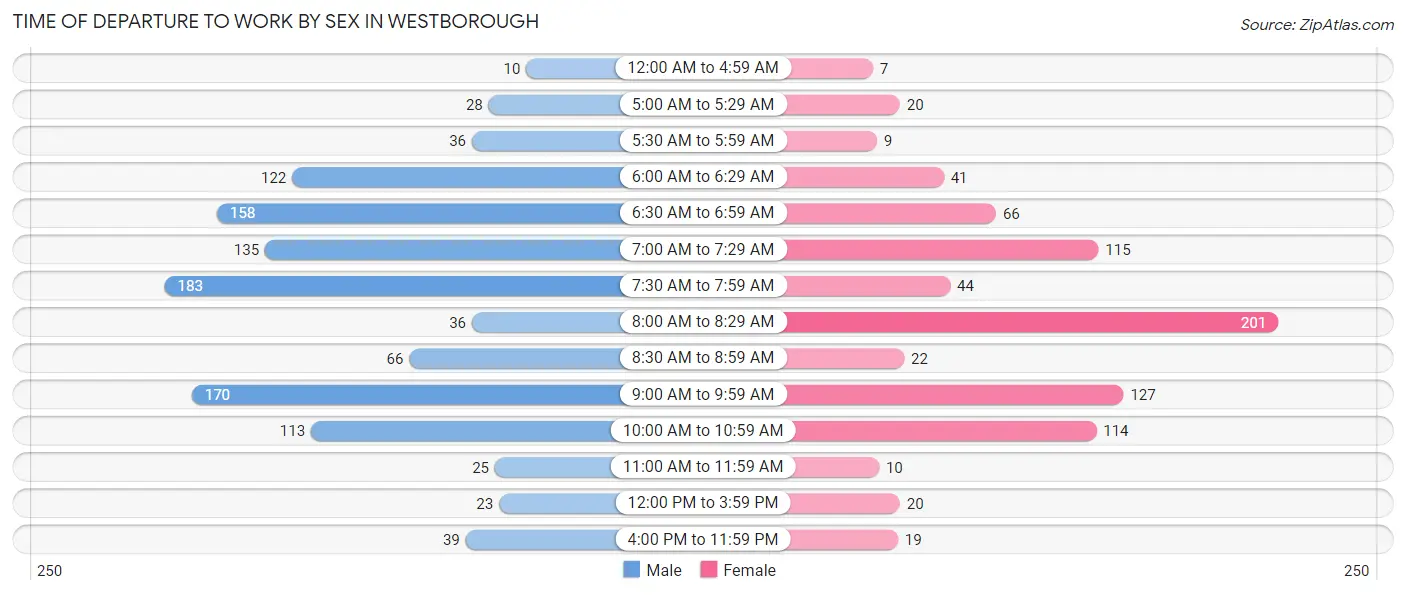
| Time of Departure | Male | Female |
| 12:00 AM to 4:59 AM | 10 (0.9%) | 7 (0.9%) |
| 5:00 AM to 5:29 AM | 28 (2.5%) | 20 (2.5%) |
| 5:30 AM to 5:59 AM | 36 (3.2%) | 9 (1.1%) |
| 6:00 AM to 6:29 AM | 122 (10.7%) | 41 (5.0%) |
| 6:30 AM to 6:59 AM | 158 (13.8%) | 66 (8.1%) |
| 7:00 AM to 7:29 AM | 135 (11.8%) | 115 (14.1%) |
| 7:30 AM to 7:59 AM | 183 (16.0%) | 44 (5.4%) |
| 8:00 AM to 8:29 AM | 36 (3.2%) | 201 (24.7%) |
| 8:30 AM to 8:59 AM | 66 (5.8%) | 22 (2.7%) |
| 9:00 AM to 9:59 AM | 170 (14.9%) | 127 (15.6%) |
| 10:00 AM to 10:59 AM | 113 (9.9%) | 114 (14.0%) |
| 11:00 AM to 11:59 AM | 25 (2.2%) | 10 (1.2%) |
| 12:00 PM to 3:59 PM | 23 (2.0%) | 20 (2.5%) |
| 4:00 PM to 11:59 PM | 39 (3.4%) | 19 (2.3%) |
| Total | 1,144 (100.0%) | 815 (100.0%) |
Housing Occupancy in Westborough
Occupancy by Ownership in Westborough
Of the total 1,992 dwellings in Westborough, owner-occupied units account for 998 (50.1%), while renter-occupied units make up 994 (49.9%).
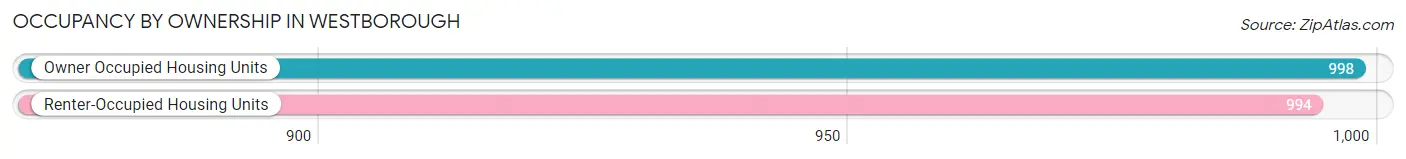
| Occupancy | # Housing Units | % Housing Units |
| Owner Occupied Housing Units | 998 | 50.1% |
| Renter-Occupied Housing Units | 994 | 49.9% |
| Total Occupied Housing Units | 1,992 | 100.0% |
Occupancy by Household Size in Westborough
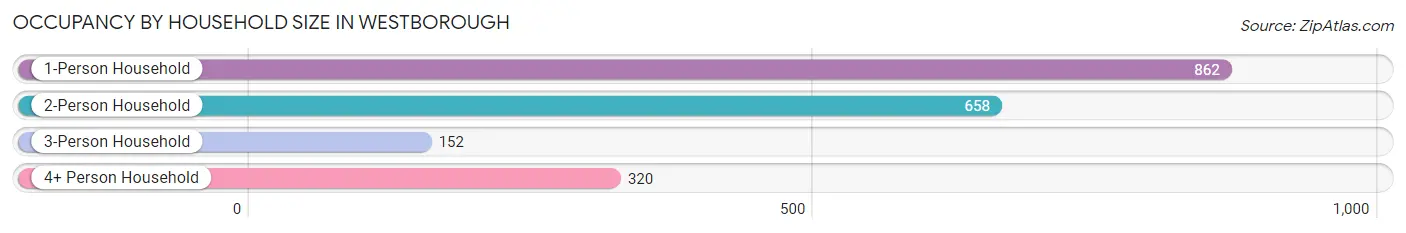
| Household Size | # Housing Units | % Housing Units |
| 1-Person Household | 862 | 43.3% |
| 2-Person Household | 658 | 33.0% |
| 3-Person Household | 152 | 7.6% |
| 4+ Person Household | 320 | 16.1% |
| Total Housing Units | 1,992 | 100.0% |
Occupancy by Ownership by Household Size in Westborough
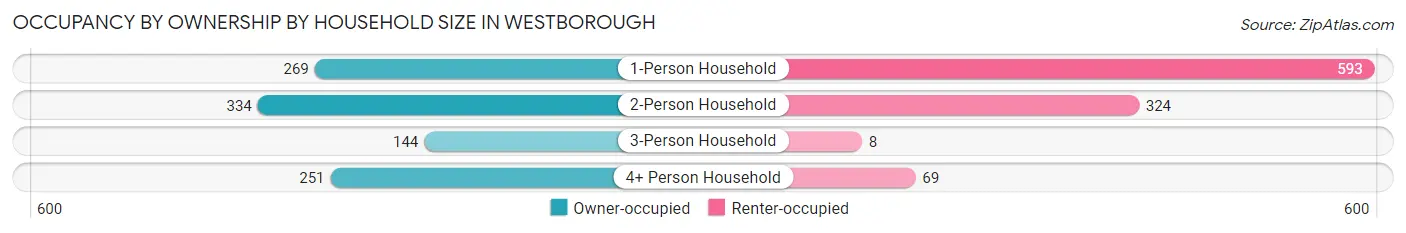
| Household Size | Owner-occupied | Renter-occupied |
| 1-Person Household | 269 (31.2%) | 593 (68.8%) |
| 2-Person Household | 334 (50.8%) | 324 (49.2%) |
| 3-Person Household | 144 (94.7%) | 8 (5.3%) |
| 4+ Person Household | 251 (78.4%) | 69 (21.6%) |
| Total Housing Units | 998 (50.1%) | 994 (49.9%) |
Occupancy by Educational Attainment in Westborough
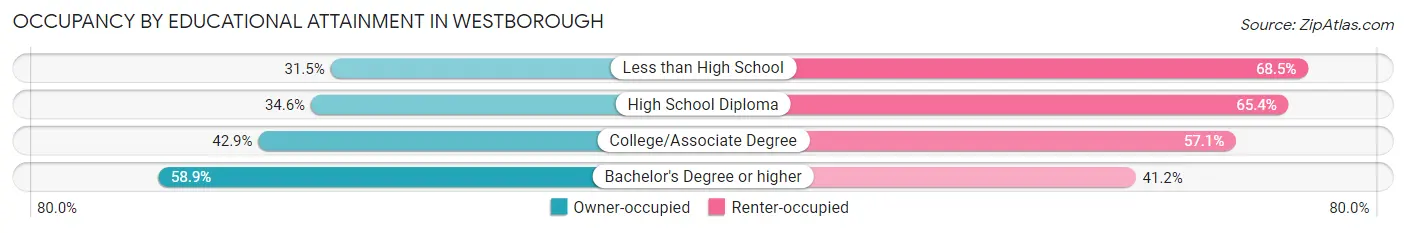
| Household Size | Owner-occupied | Renter-occupied |
| Less than High School | 34 (31.5%) | 74 (68.5%) |
| High School Diploma | 102 (34.6%) | 193 (65.4%) |
| College/Associate Degree | 197 (42.9%) | 262 (57.1%) |
| Bachelor's Degree or higher | 665 (58.9%) | 465 (41.1%) |
Occupancy by Age of Householder in Westborough
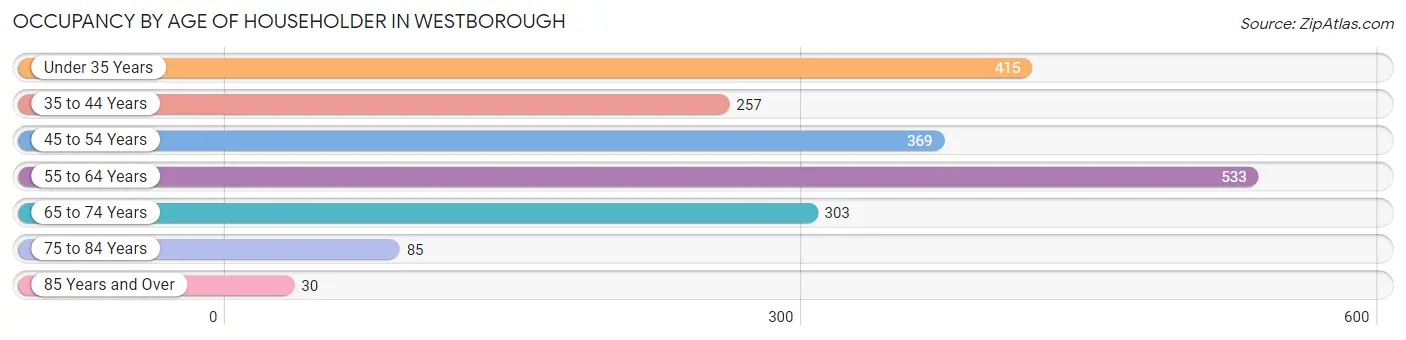
| Age Bracket | # Households | % Households |
| Under 35 Years | 415 | 20.8% |
| 35 to 44 Years | 257 | 12.9% |
| 45 to 54 Years | 369 | 18.5% |
| 55 to 64 Years | 533 | 26.8% |
| 65 to 74 Years | 303 | 15.2% |
| 75 to 84 Years | 85 | 4.3% |
| 85 Years and Over | 30 | 1.5% |
| Total | 1,992 | 100.0% |
Housing Finances in Westborough
Median Income by Occupancy in Westborough
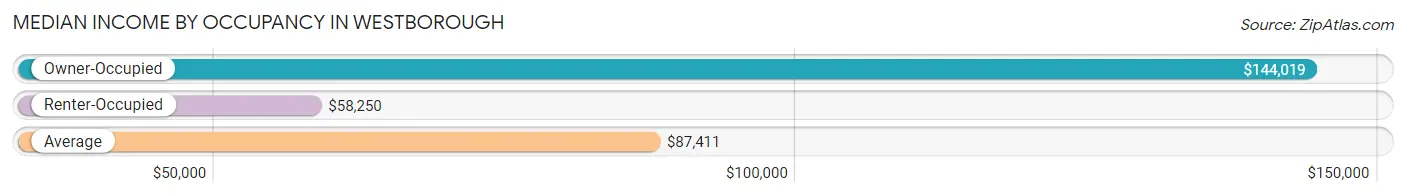
| Occupancy Type | # Households | Median Income |
| Owner-Occupied | 998 (50.1%) | $144,019 |
| Renter-Occupied | 994 (49.9%) | $58,250 |
| Average | 1,992 (100.0%) | $87,411 |
Occupancy by Householder Income Bracket in Westborough
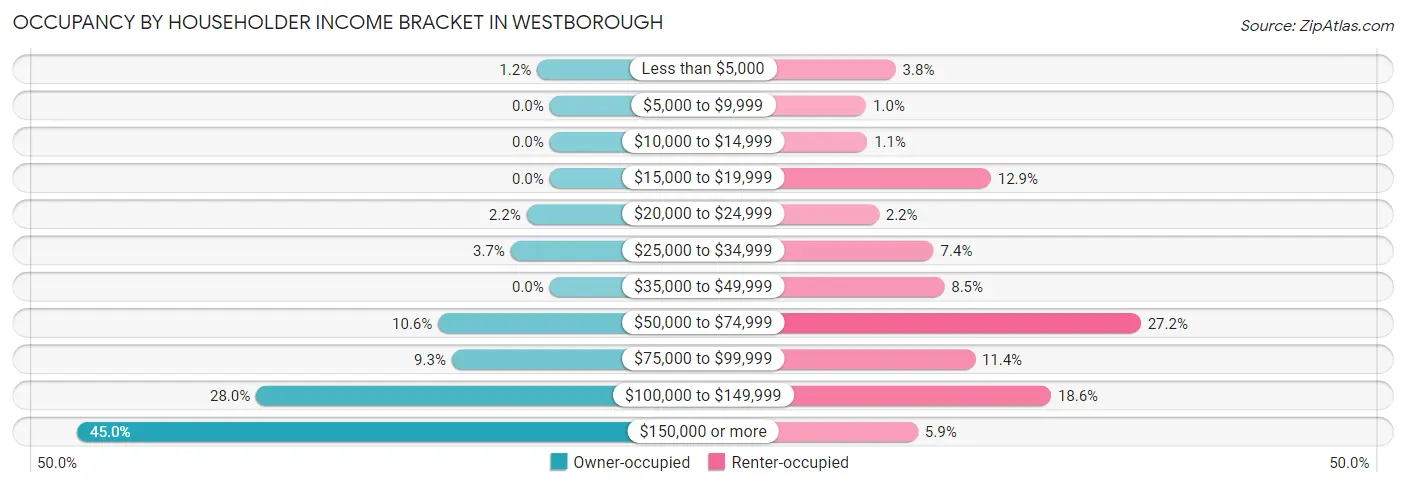
| Income Bracket | Owner-occupied | Renter-occupied |
| Less than $5,000 | 12 (1.2%) | 38 (3.8%) |
| $5,000 to $9,999 | 0 (0.0%) | 10 (1.0%) |
| $10,000 to $14,999 | 0 (0.0%) | 11 (1.1%) |
| $15,000 to $19,999 | 0 (0.0%) | 128 (12.9%) |
| $20,000 to $24,999 | 22 (2.2%) | 22 (2.2%) |
| $25,000 to $34,999 | 37 (3.7%) | 74 (7.4%) |
| $35,000 to $49,999 | 0 (0.0%) | 84 (8.5%) |
| $50,000 to $74,999 | 106 (10.6%) | 270 (27.2%) |
| $75,000 to $99,999 | 93 (9.3%) | 113 (11.4%) |
| $100,000 to $149,999 | 279 (28.0%) | 185 (18.6%) |
| $150,000 or more | 449 (45.0%) | 59 (5.9%) |
| Total | 998 (100.0%) | 994 (100.0%) |
Monthly Housing Cost Tiers in Westborough
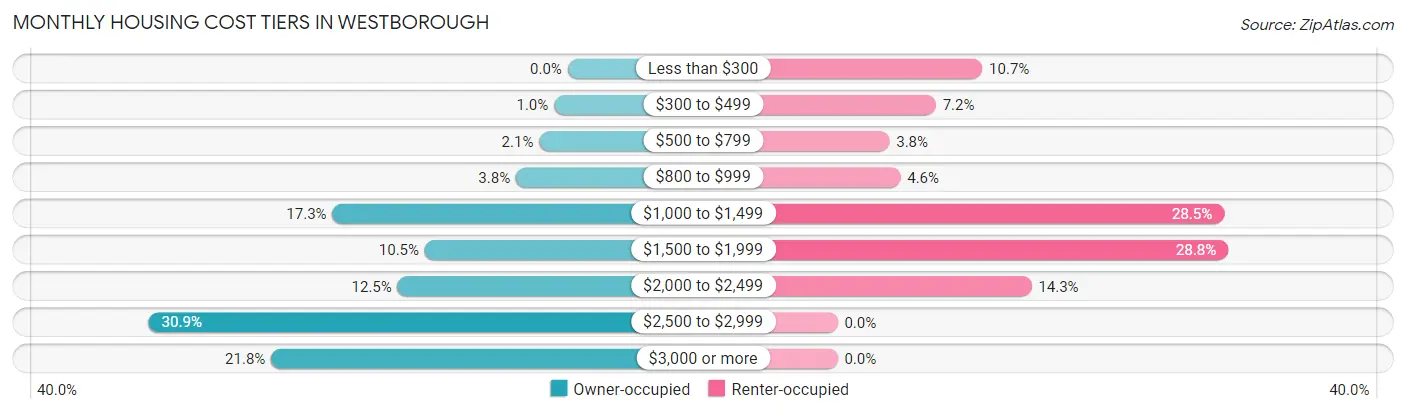
| Monthly Cost | Owner-occupied | Renter-occupied |
| Less than $300 | 0 (0.0%) | 106 (10.7%) |
| $300 to $499 | 10 (1.0%) | 72 (7.2%) |
| $500 to $799 | 21 (2.1%) | 38 (3.8%) |
| $800 to $999 | 38 (3.8%) | 46 (4.6%) |
| $1,000 to $1,499 | 173 (17.3%) | 283 (28.5%) |
| $1,500 to $1,999 | 105 (10.5%) | 286 (28.8%) |
| $2,000 to $2,499 | 125 (12.5%) | 142 (14.3%) |
| $2,500 to $2,999 | 308 (30.9%) | 0 (0.0%) |
| $3,000 or more | 218 (21.8%) | 0 (0.0%) |
| Total | 998 (100.0%) | 994 (100.0%) |
Physical Housing Characteristics in Westborough
Housing Structures in Westborough
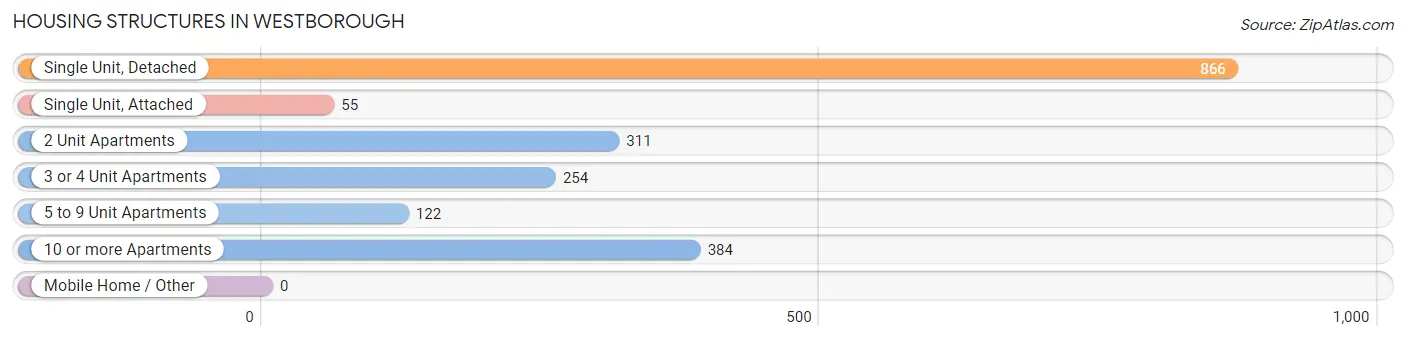
| Structure Type | # Housing Units | % Housing Units |
| Single Unit, Detached | 866 | 43.5% |
| Single Unit, Attached | 55 | 2.8% |
| 2 Unit Apartments | 311 | 15.6% |
| 3 or 4 Unit Apartments | 254 | 12.8% |
| 5 to 9 Unit Apartments | 122 | 6.1% |
| 10 or more Apartments | 384 | 19.3% |
| Mobile Home / Other | 0 | 0.0% |
| Total | 1,992 | 100.0% |
Housing Structures by Occupancy in Westborough
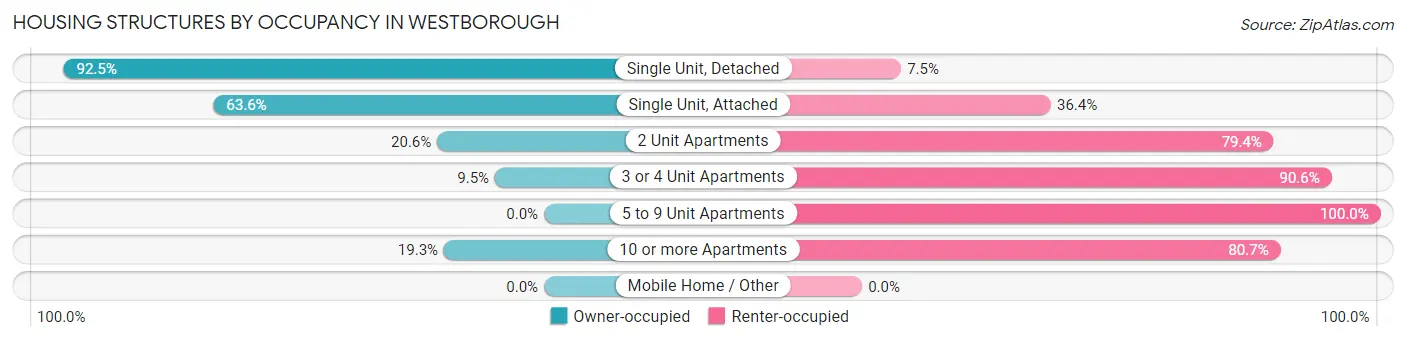
| Structure Type | Owner-occupied | Renter-occupied |
| Single Unit, Detached | 801 (92.5%) | 65 (7.5%) |
| Single Unit, Attached | 35 (63.6%) | 20 (36.4%) |
| 2 Unit Apartments | 64 (20.6%) | 247 (79.4%) |
| 3 or 4 Unit Apartments | 24 (9.5%) | 230 (90.5%) |
| 5 to 9 Unit Apartments | 0 (0.0%) | 122 (100.0%) |
| 10 or more Apartments | 74 (19.3%) | 310 (80.7%) |
| Mobile Home / Other | 0 (0.0%) | 0 (0.0%) |
| Total | 998 (50.1%) | 994 (49.9%) |
Housing Structures by Number of Rooms in Westborough
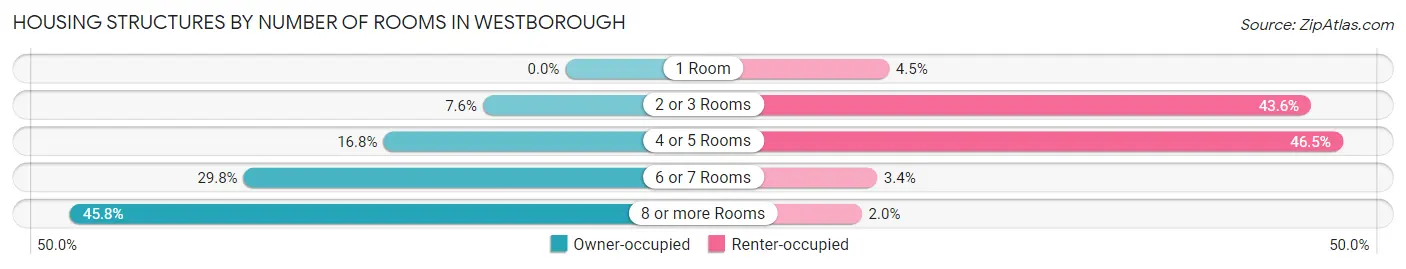
| Number of Rooms | Owner-occupied | Renter-occupied |
| 1 Room | 0 (0.0%) | 45 (4.5%) |
| 2 or 3 Rooms | 76 (7.6%) | 433 (43.6%) |
| 4 or 5 Rooms | 168 (16.8%) | 462 (46.5%) |
| 6 or 7 Rooms | 297 (29.8%) | 34 (3.4%) |
| 8 or more Rooms | 457 (45.8%) | 20 (2.0%) |
| Total | 998 (100.0%) | 994 (100.0%) |
Housing Structure by Heating Type in Westborough
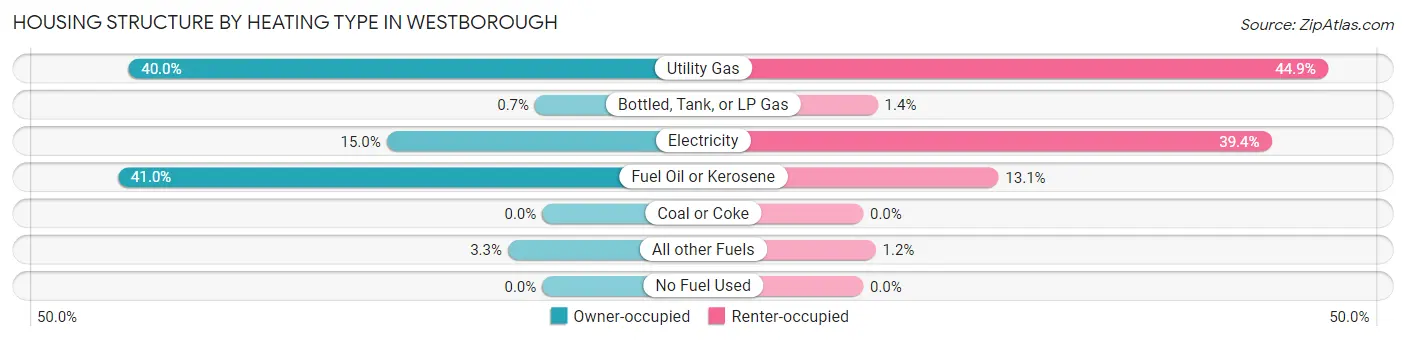
| Heating Type | Owner-occupied | Renter-occupied |
| Utility Gas | 399 (40.0%) | 446 (44.9%) |
| Bottled, Tank, or LP Gas | 7 (0.7%) | 14 (1.4%) |
| Electricity | 150 (15.0%) | 392 (39.4%) |
| Fuel Oil or Kerosene | 409 (41.0%) | 130 (13.1%) |
| Coal or Coke | 0 (0.0%) | 0 (0.0%) |
| All other Fuels | 33 (3.3%) | 12 (1.2%) |
| No Fuel Used | 0 (0.0%) | 0 (0.0%) |
| Total | 998 (100.0%) | 994 (100.0%) |
Household Vehicle Usage in Westborough
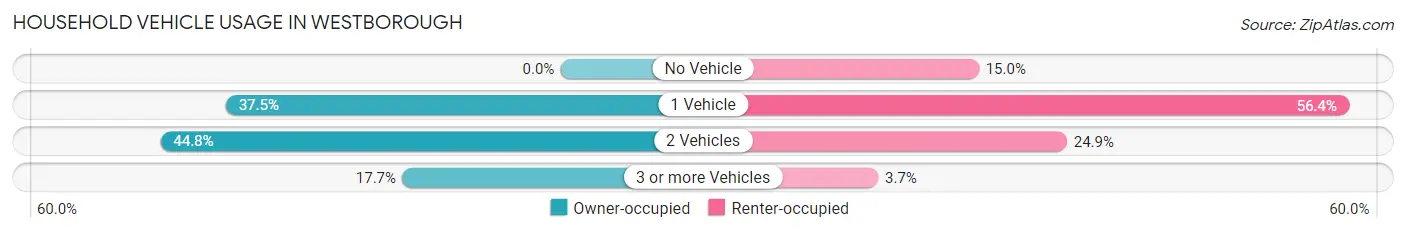
| Vehicles per Household | Owner-occupied | Renter-occupied |
| No Vehicle | 0 (0.0%) | 149 (15.0%) |
| 1 Vehicle | 374 (37.5%) | 561 (56.4%) |
| 2 Vehicles | 447 (44.8%) | 247 (24.8%) |
| 3 or more Vehicles | 177 (17.7%) | 37 (3.7%) |
| Total | 998 (100.0%) | 994 (100.0%) |
Real Estate & Mortgages in Westborough
Real Estate and Mortgage Overview in Westborough
| Characteristic | Without Mortgage | With Mortgage |
| Housing Units | 196 | 802 |
| Median Property Value | $472,100 | $507,400 |
| Median Household Income | $75,833 | $391 |
| Monthly Housing Costs | $1,110 | $218 |
| Real Estate Taxes | $7,710 | $0 |
Property Value by Mortgage Status in Westborough
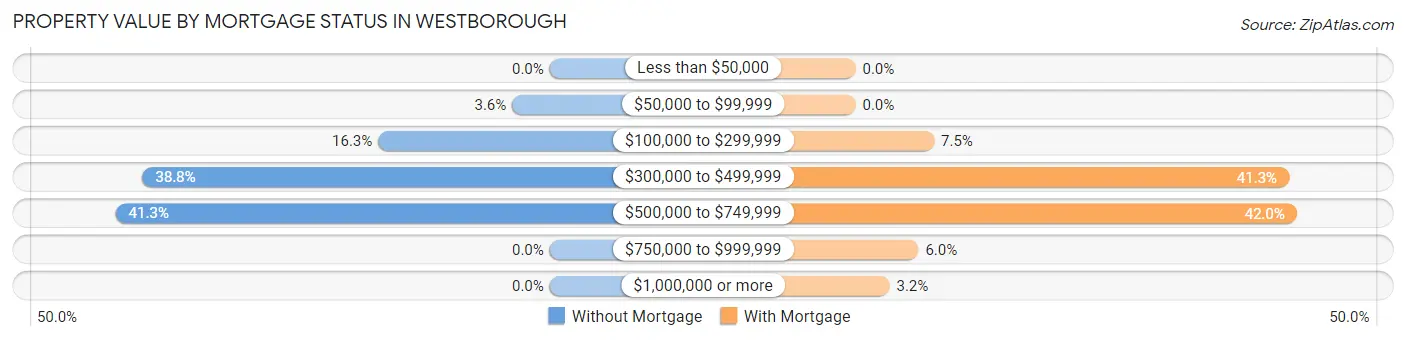
| Property Value | Without Mortgage | With Mortgage |
| Less than $50,000 | 0 (0.0%) | 0 (0.0%) |
| $50,000 to $99,999 | 7 (3.6%) | 0 (0.0%) |
| $100,000 to $299,999 | 32 (16.3%) | 60 (7.5%) |
| $300,000 to $499,999 | 76 (38.8%) | 331 (41.3%) |
| $500,000 to $749,999 | 81 (41.3%) | 337 (42.0%) |
| $750,000 to $999,999 | 0 (0.0%) | 48 (6.0%) |
| $1,000,000 or more | 0 (0.0%) | 26 (3.2%) |
| Total | 196 (100.0%) | 802 (100.0%) |
Household Income by Mortgage Status in Westborough
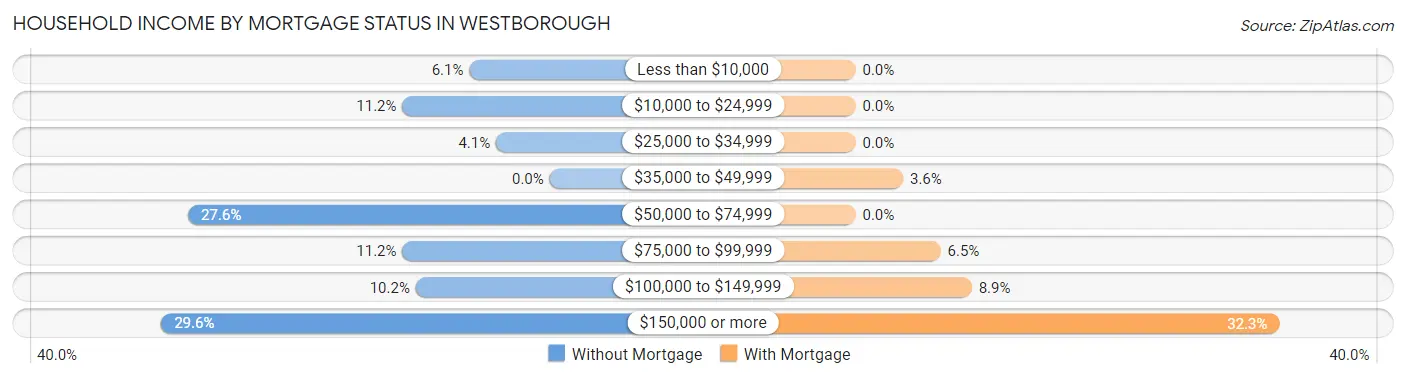
| Household Income | Without Mortgage | With Mortgage |
| Less than $10,000 | 12 (6.1%) | 0 (0.0%) |
| $10,000 to $24,999 | 22 (11.2%) | 0 (0.0%) |
| $25,000 to $34,999 | 8 (4.1%) | 0 (0.0%) |
| $35,000 to $49,999 | 0 (0.0%) | 29 (3.6%) |
| $50,000 to $74,999 | 54 (27.6%) | 0 (0.0%) |
| $75,000 to $99,999 | 22 (11.2%) | 52 (6.5%) |
| $100,000 to $149,999 | 20 (10.2%) | 71 (8.8%) |
| $150,000 or more | 58 (29.6%) | 259 (32.3%) |
| Total | 196 (100.0%) | 802 (100.0%) |
Property Value to Household Income Ratio in Westborough
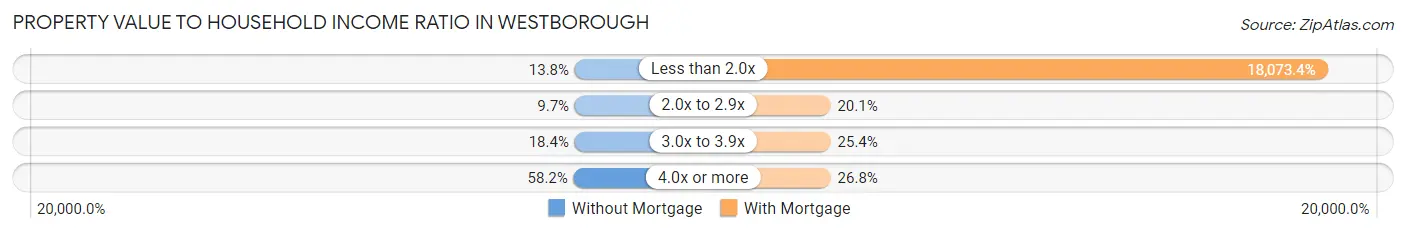
| Value-to-Income Ratio | Without Mortgage | With Mortgage |
| Less than 2.0x | 27 (13.8%) | 144,949 (18,073.4%) |
| 2.0x to 2.9x | 19 (9.7%) | 161 (20.1%) |
| 3.0x to 3.9x | 36 (18.4%) | 204 (25.4%) |
| 4.0x or more | 114 (58.2%) | 215 (26.8%) |
| Total | 196 (100.0%) | 802 (100.0%) |
Real Estate Taxes by Mortgage Status in Westborough
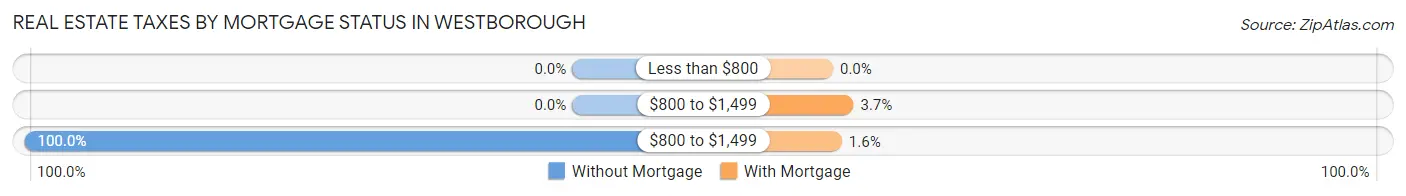
| Property Taxes | Without Mortgage | With Mortgage |
| Less than $800 | 0 (0.0%) | 0 (0.0%) |
| $800 to $1,499 | 0 (0.0%) | 30 (3.7%) |
| $800 to $1,499 | 196 (100.0%) | 13 (1.6%) |
| Total | 196 (100.0%) | 802 (100.0%) |
Health & Disability in Westborough
Health Insurance Coverage by Age in Westborough
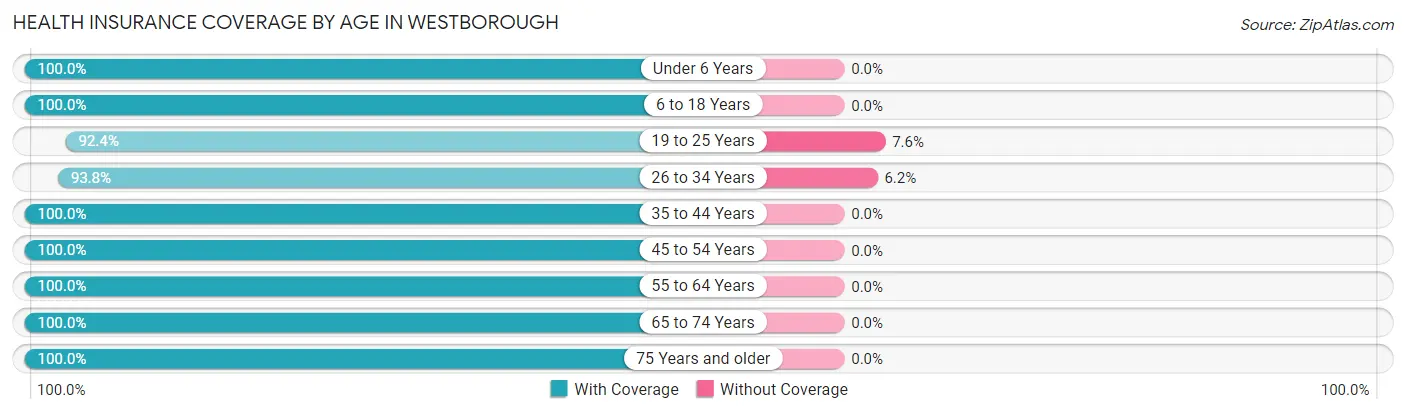
| Age Bracket | With Coverage | Without Coverage |
| Under 6 Years | 229 (100.0%) | 0 (0.0%) |
| 6 to 18 Years | 554 (100.0%) | 0 (0.0%) |
| 19 to 25 Years | 339 (92.4%) | 28 (7.6%) |
| 26 to 34 Years | 621 (93.8%) | 41 (6.2%) |
| 35 to 44 Years | 478 (100.0%) | 0 (0.0%) |
| 45 to 54 Years | 606 (100.0%) | 0 (0.0%) |
| 55 to 64 Years | 739 (100.0%) | 0 (0.0%) |
| 65 to 74 Years | 425 (100.0%) | 0 (0.0%) |
| 75 Years and older | 202 (100.0%) | 0 (0.0%) |
| Total | 4,193 (98.4%) | 69 (1.6%) |
Health Insurance Coverage by Citizenship Status in Westborough
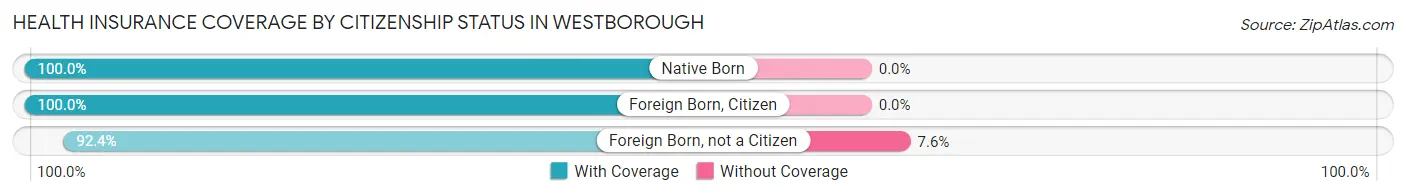
| Citizenship Status | With Coverage | Without Coverage |
| Native Born | 229 (100.0%) | 0 (0.0%) |
| Foreign Born, Citizen | 554 (100.0%) | 0 (0.0%) |
| Foreign Born, not a Citizen | 339 (92.4%) | 28 (7.6%) |
Health Insurance Coverage by Household Income in Westborough
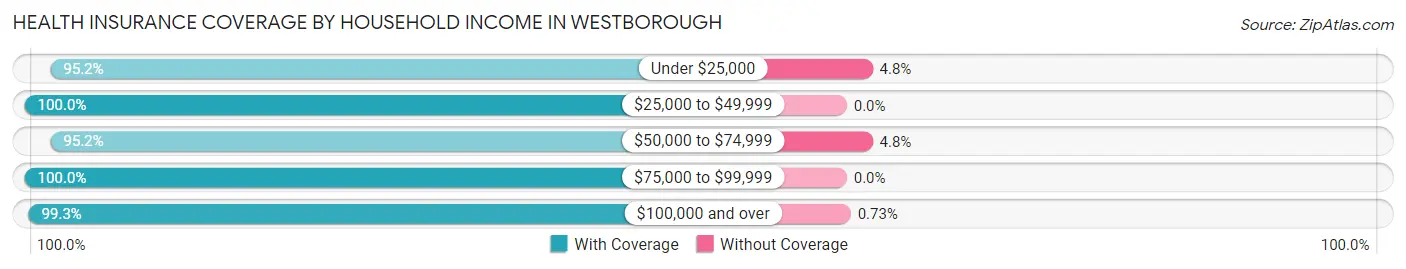
| Household Income | With Coverage | Without Coverage |
| Under $25,000 | 335 (95.2%) | 17 (4.8%) |
| $25,000 to $49,999 | 277 (100.0%) | 0 (0.0%) |
| $50,000 to $74,999 | 650 (95.2%) | 33 (4.8%) |
| $75,000 to $99,999 | 333 (100.0%) | 0 (0.0%) |
| $100,000 and over | 2,588 (99.3%) | 19 (0.7%) |
Public vs Private Health Insurance Coverage by Age in Westborough
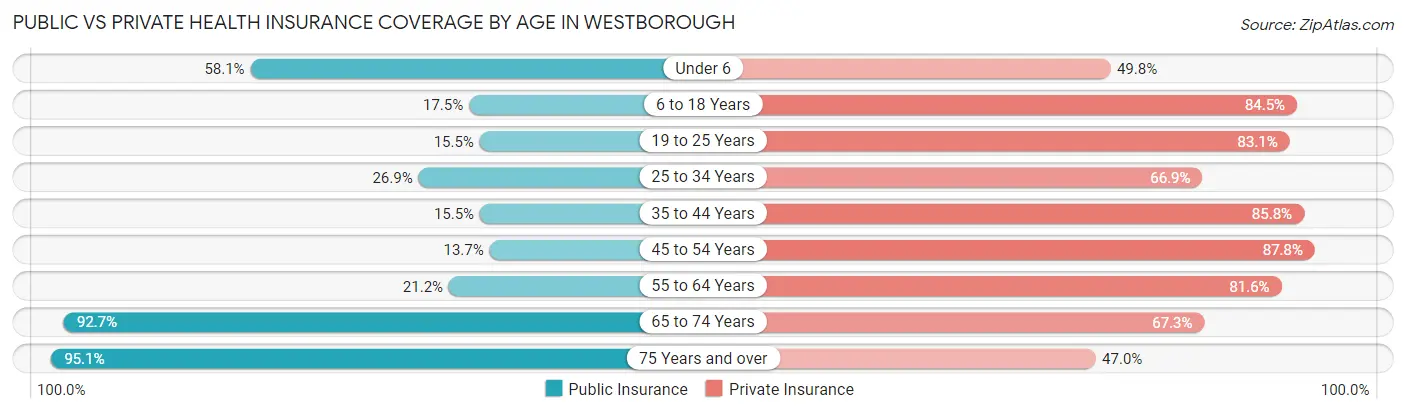
| Age Bracket | Public Insurance | Private Insurance |
| Under 6 | 133 (58.1%) | 114 (49.8%) |
| 6 to 18 Years | 97 (17.5%) | 468 (84.5%) |
| 19 to 25 Years | 57 (15.5%) | 305 (83.1%) |
| 25 to 34 Years | 178 (26.9%) | 443 (66.9%) |
| 35 to 44 Years | 74 (15.5%) | 410 (85.8%) |
| 45 to 54 Years | 83 (13.7%) | 532 (87.8%) |
| 55 to 64 Years | 157 (21.2%) | 603 (81.6%) |
| 65 to 74 Years | 394 (92.7%) | 286 (67.3%) |
| 75 Years and over | 192 (95.1%) | 95 (47.0%) |
| Total | 1,365 (32.0%) | 3,256 (76.4%) |
Disability Status by Sex by Age in Westborough
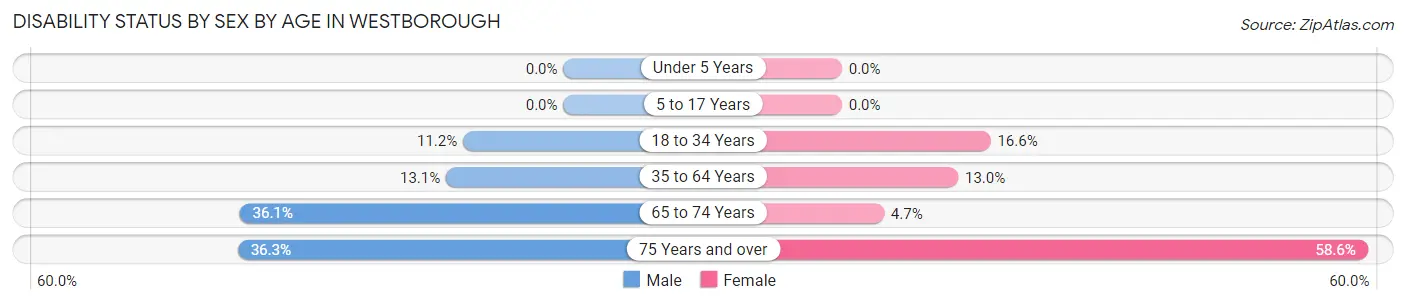
| Age Bracket | Male | Female |
| Under 5 Years | 0 (0.0%) | 0 (0.0%) |
| 5 to 17 Years | 0 (0.0%) | 0 (0.0%) |
| 18 to 34 Years | 66 (11.2%) | 76 (16.6%) |
| 35 to 64 Years | 111 (13.1%) | 126 (13.0%) |
| 65 to 74 Years | 84 (36.0%) | 9 (4.7%) |
| 75 Years and over | 33 (36.3%) | 65 (58.6%) |
Disability Class by Sex by Age in Westborough
Disability Class: Hearing Difficulty
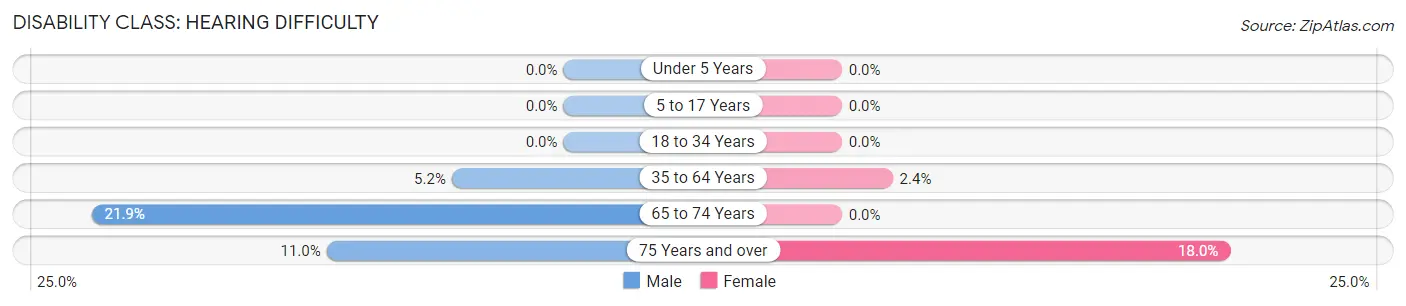
| Age Bracket | Male | Female |
| Under 5 Years | 0 (0.0%) | 0 (0.0%) |
| 5 to 17 Years | 0 (0.0%) | 0 (0.0%) |
| 18 to 34 Years | 0 (0.0%) | 0 (0.0%) |
| 35 to 64 Years | 44 (5.2%) | 23 (2.4%) |
| 65 to 74 Years | 51 (21.9%) | 0 (0.0%) |
| 75 Years and over | 10 (11.0%) | 20 (18.0%) |
Disability Class: Vision Difficulty
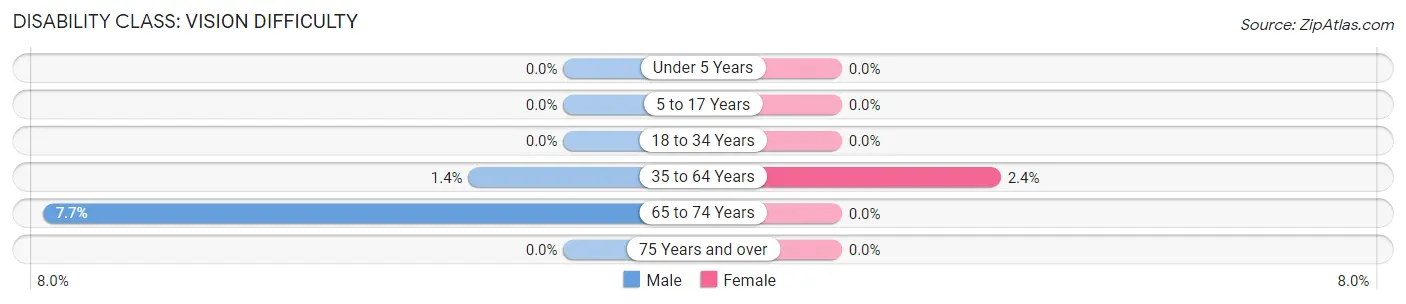
| Age Bracket | Male | Female |
| Under 5 Years | 0 (0.0%) | 0 (0.0%) |
| 5 to 17 Years | 0 (0.0%) | 0 (0.0%) |
| 18 to 34 Years | 0 (0.0%) | 0 (0.0%) |
| 35 to 64 Years | 12 (1.4%) | 23 (2.4%) |
| 65 to 74 Years | 18 (7.7%) | 0 (0.0%) |
| 75 Years and over | 0 (0.0%) | 0 (0.0%) |
Disability Class: Cognitive Difficulty
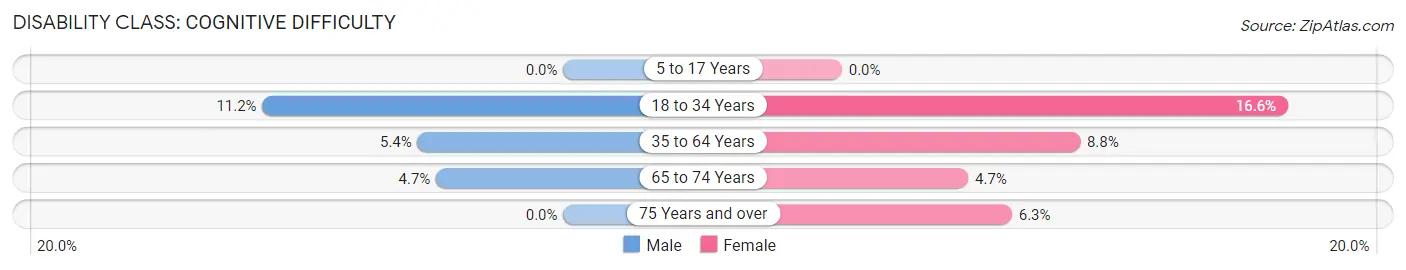
| Age Bracket | Male | Female |
| 5 to 17 Years | 0 (0.0%) | 0 (0.0%) |
| 18 to 34 Years | 66 (11.2%) | 76 (16.6%) |
| 35 to 64 Years | 46 (5.4%) | 86 (8.8%) |
| 65 to 74 Years | 11 (4.7%) | 9 (4.7%) |
| 75 Years and over | 0 (0.0%) | 7 (6.3%) |
Disability Class: Ambulatory Difficulty
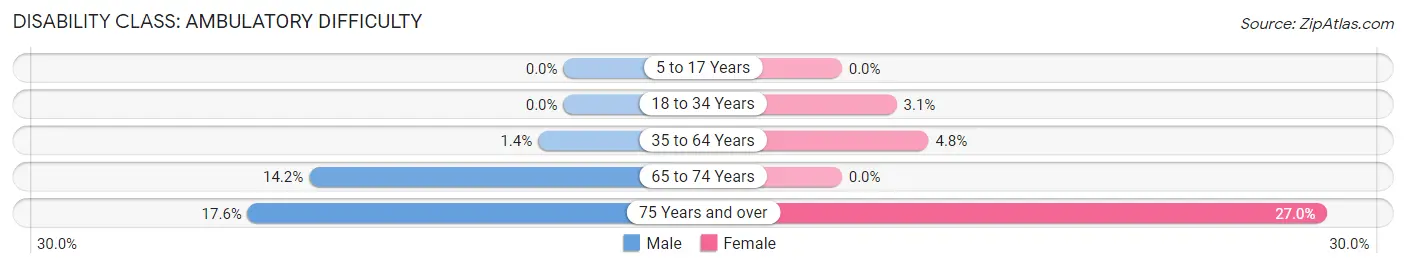
| Age Bracket | Male | Female |
| 5 to 17 Years | 0 (0.0%) | 0 (0.0%) |
| 18 to 34 Years | 0 (0.0%) | 14 (3.0%) |
| 35 to 64 Years | 12 (1.4%) | 47 (4.8%) |
| 65 to 74 Years | 33 (14.2%) | 0 (0.0%) |
| 75 Years and over | 16 (17.6%) | 30 (27.0%) |
Disability Class: Self-Care Difficulty
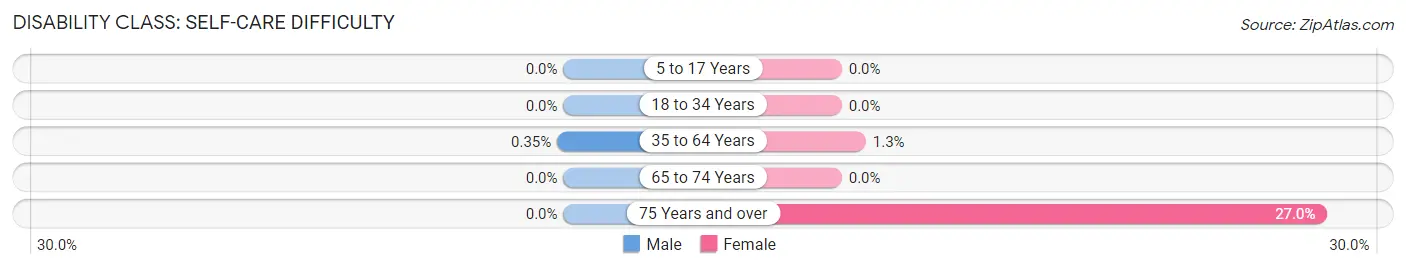
| Age Bracket | Male | Female |
| 5 to 17 Years | 0 (0.0%) | 0 (0.0%) |
| 18 to 34 Years | 0 (0.0%) | 0 (0.0%) |
| 35 to 64 Years | 3 (0.4%) | 13 (1.3%) |
| 65 to 74 Years | 0 (0.0%) | 0 (0.0%) |
| 75 Years and over | 0 (0.0%) | 30 (27.0%) |
Technology Access in Westborough
Computing Device Access in Westborough
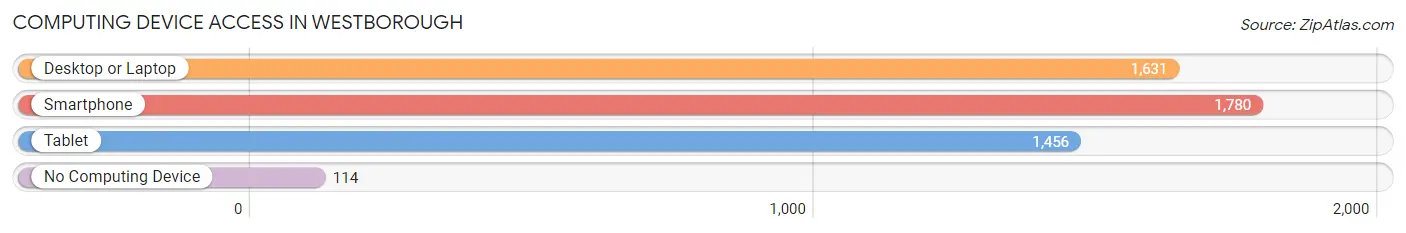
| Device Type | # Households | % Households |
| Desktop or Laptop | 1,631 | 81.9% |
| Smartphone | 1,780 | 89.4% |
| Tablet | 1,456 | 73.1% |
| No Computing Device | 114 | 5.7% |
| Total | 1,992 | 100.0% |
Internet Access in Westborough
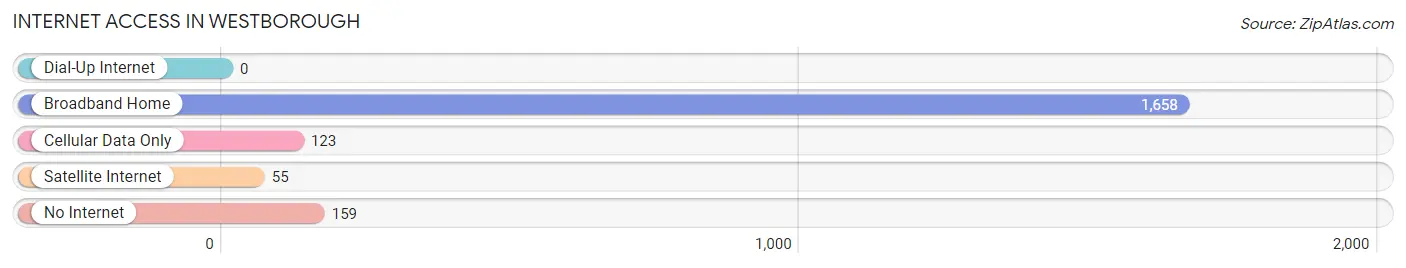
| Internet Type | # Households | % Households |
| Dial-Up Internet | 0 | 0.0% |
| Broadband Home | 1,658 | 83.2% |
| Cellular Data Only | 123 | 6.2% |
| Satellite Internet | 55 | 2.8% |
| No Internet | 159 | 8.0% |
| Total | 1,992 | 100.0% |
Westborough Summary
History
Westborough, Massachusetts is a town located in Worcester County, approximately 25 miles west of Boston. It was first settled in 1660 and was officially incorporated in 1717. The town was originally part of the town of Marlborough, but was separated in 1717 due to the growing population. The town was named after Westbury, England, which was the hometown of the first settlers.
The town was primarily an agricultural community for many years, with the main crops being corn, wheat, and hay. In the late 19th century, the town began to industrialize, with the opening of several factories, including the Westborough Woolen Mill and the Westborough Machine Company. The town also became a popular summer resort destination, with many wealthy Bostonians building summer homes in the area.
In the 20th century, Westborough continued to grow and develop. The town was home to several large companies, including the Westborough State Hospital, the Westborough Country Club, and the Westborough Shopping Center. The town also became a popular commuter town, with many people commuting to Boston and other nearby cities.
Geography
Westborough is located in central Massachusetts, in Worcester County. It is bordered by the towns of Northborough, Southborough, Shrewsbury, and Grafton. The town is located on the western edge of the Blackstone Valley, and is approximately 25 miles west of Boston.
The town is mostly flat, with some rolling hills in the northern and eastern parts of town. The town is drained by the Westborough River, which flows through the center of town. The town is also home to several ponds, including Lake Chauncy, Lake Hoccomocco, and Lake Chauncy.
Economy
Westborough has a diverse economy, with a mix of manufacturing, retail, and service industries. The town is home to several large companies, including the Westborough State Hospital, the Westborough Country Club, and the Westborough Shopping Center. The town is also home to several technology companies, including EMC Corporation, MathWorks, and Akamai Technologies.
The town is also home to several educational institutions, including Westborough High School, Westborough Middle School, and Westborough Elementary School. The town is also home to several colleges and universities, including Worcester Polytechnic Institute, Assumption College, and Clark University.
Demographics
As of the 2010 census, Westborough had a population of 18,272. The racial makeup of the town was 87.3% White, 4.2% Asian, 3.2% African American, 0.3% Native American, and 4.9% from other races. The median household income was $90,837, and the median family income was $106,837. The town had a poverty rate of 4.2%.
Westborough is a predominantly white town, with a large Asian population. The town is also home to a large Jewish population, with approximately 10% of the population identifying as Jewish. The town is also home to a large Irish-American population, with approximately 10% of the population identifying as Irish-American.
Common Questions
What is Per Capita Income in Westborough?
Per Capita income in Westborough is $58,215.
What is the Median Family Income in Westborough?
Median Family Income in Westborough is $150,083.
What is the Median Household income in Westborough?
Median Household Income in Westborough is $87,411.
What is Income or Wage Gap in Westborough?
Income or Wage Gap in Westborough is 13.3%.
Women in Westborough earn 86.7 cents for every dollar earned by a man.
What is Family Income Deficit in Westborough?
Family Income Deficit in Westborough is $15,667.
Families that are below poverty line in Westborough earn $15,667 less on average than the poverty threshold level.
What is Inequality or Gini Index in Westborough?
Inequality or Gini Index in Westborough is 0.45.
What is the Total Population of Westborough?
Total Population of Westborough is 4,381.
What is the Total Male Population of Westborough?
Total Male Population of Westborough is 2,217.
What is the Total Female Population of Westborough?
Total Female Population of Westborough is 2,164.
What is the Ratio of Males per 100 Females in Westborough?
There are 102.45 Males per 100 Females in Westborough.
What is the Ratio of Females per 100 Males in Westborough?
There are 97.61 Females per 100 Males in Westborough.
What is the Median Population Age in Westborough?
Median Population Age in Westborough is 43.1 Years.
What is the Average Family Size in Westborough
Average Family Size in Westborough is 3.2 People.
What is the Average Household Size in Westborough
Average Household Size in Westborough is 2.1 People.
How Large is the Labor Force in Westborough?
There are 2,616 People in the Labor Forcein in Westborough.
What is the Percentage of People in the Labor Force in Westborough?
70.7% of People are in the Labor Force in Westborough.
What is the Unemployment Rate in Westborough?
Unemployment Rate in Westborough is 2.3%.