Holbrook, MA Map & Demographics
Holbrook Map
Holbrook Overview
$46,376
PER CAPITA INCOME
$118,561
AVG FAMILY INCOME
$96,920
AVG HOUSEHOLD INCOME
25.5%
WAGE / INCOME GAP [ % ]
74.5¢/ $1
WAGE / INCOME GAP [ $ ]
0.40
INEQUALITY / GINI INDEX
11,338
TOTAL POPULATION
5,591
MALE POPULATION
5,747
FEMALE POPULATION
97.29
MALES / 100 FEMALES
102.79
FEMALES / 100 MALES
43.0
MEDIAN AGE
3.0
AVG FAMILY SIZE
2.4
AVG HOUSEHOLD SIZE
6,443
LABOR FORCE [ PEOPLE ]
68.3%
PERCENT IN LABOR FORCE
3.8%
UNEMPLOYMENT RATE
Holbrook Zip Codes
Income in Holbrook
Income Overview in Holbrook
Per Capita Income in Holbrook is $46,376, while median incomes of families and households are $118,561 and $96,920 respectively.
| Characteristic | Number | Measure |
| Per Capita Income | 11,338 | $46,376 |
| Median Family Income | 3,083 | $118,561 |
| Mean Family Income | 3,083 | $128,842 |
| Median Household Income | 4,615 | $96,920 |
| Mean Household Income | 4,615 | $111,132 |
| Income Deficit | 3,083 | $0 |
| Wage / Income Gap (%) | 11,338 | 25.47% |
| Wage / Income Gap ($) | 11,338 | 74.53¢ per $1 |
| Gini / Inequality Index | 11,338 | 0.40 |
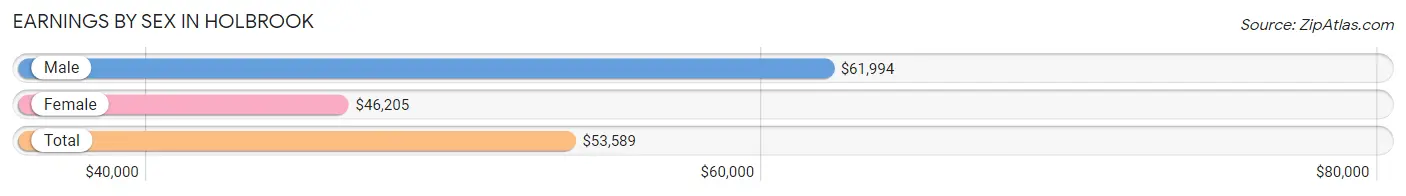
Earnings by Sex in Holbrook
Average Earnings in Holbrook are $53,589, $61,994 for men and $46,205 for women, a difference of 25.5%.
| Sex | Number | Average Earnings |
| Male | 3,477 (53.0%) | $61,994 |
| Female | 3,079 (47.0%) | $46,205 |
| Total | 6,556 (100.0%) | $53,589 |
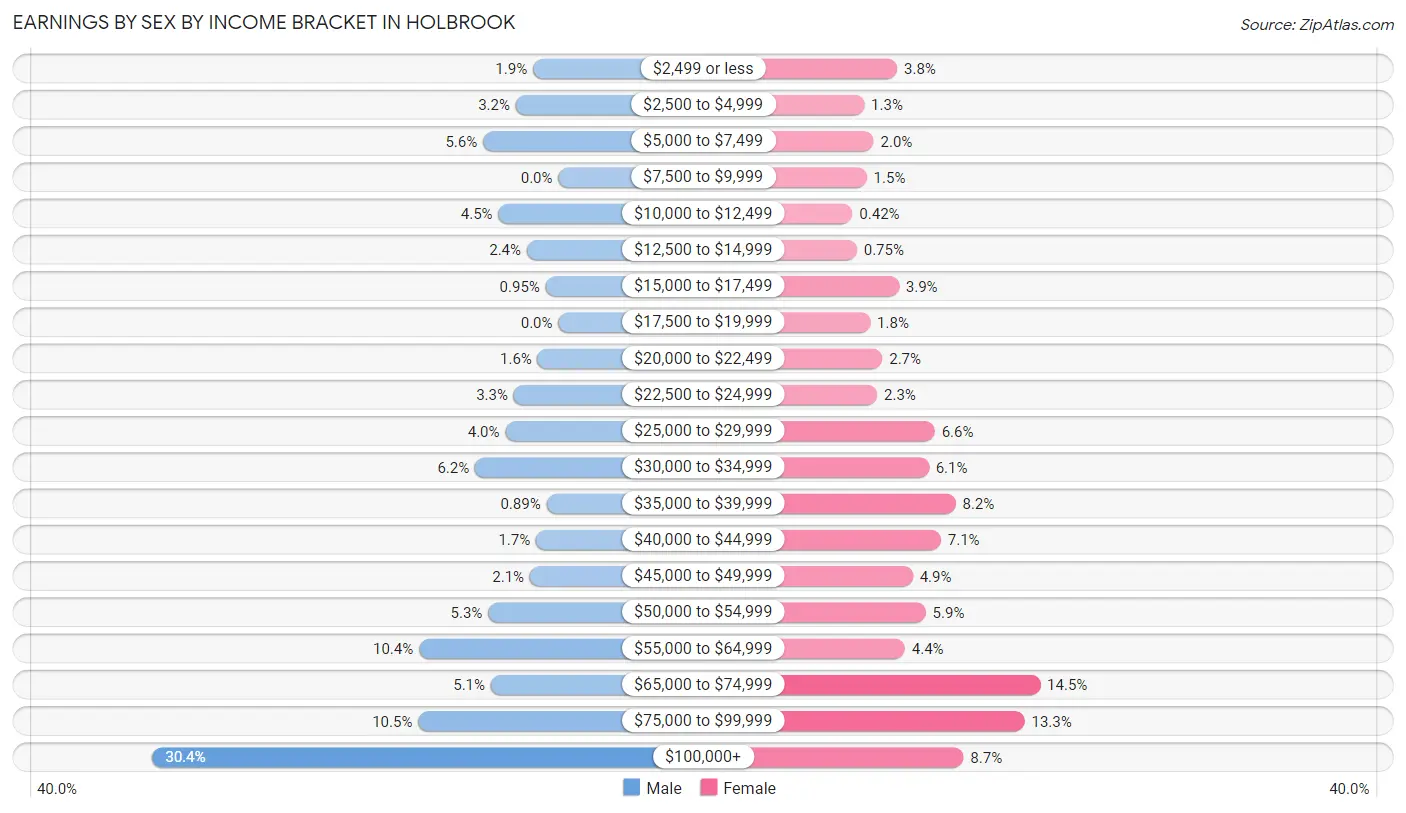
Earnings by Sex by Income Bracket in Holbrook
The most common earnings brackets in Holbrook are $100,000+ for men (1,058 | 30.4%) and $65,000 to $74,999 for women (446 | 14.5%).
| Income | Male | Female |
| $2,499 or less | 66 (1.9%) | 116 (3.8%) |
| $2,500 to $4,999 | 111 (3.2%) | 40 (1.3%) |
| $5,000 to $7,499 | 196 (5.6%) | 62 (2.0%) |
| $7,500 to $9,999 | 0 (0.0%) | 46 (1.5%) |
| $10,000 to $12,499 | 156 (4.5%) | 13 (0.4%) |
| $12,500 to $14,999 | 82 (2.4%) | 23 (0.7%) |
| $15,000 to $17,499 | 33 (0.9%) | 120 (3.9%) |
| $17,500 to $19,999 | 0 (0.0%) | 54 (1.8%) |
| $20,000 to $22,499 | 54 (1.5%) | 82 (2.7%) |
| $22,500 to $24,999 | 116 (3.3%) | 70 (2.3%) |
| $25,000 to $29,999 | 138 (4.0%) | 203 (6.6%) |
| $30,000 to $34,999 | 217 (6.2%) | 189 (6.1%) |
| $35,000 to $39,999 | 31 (0.9%) | 251 (8.2%) |
| $40,000 to $44,999 | 58 (1.7%) | 217 (7.0%) |
| $45,000 to $49,999 | 74 (2.1%) | 152 (4.9%) |
| $50,000 to $54,999 | 183 (5.3%) | 182 (5.9%) |
| $55,000 to $64,999 | 363 (10.4%) | 134 (4.3%) |
| $65,000 to $74,999 | 176 (5.1%) | 446 (14.5%) |
| $75,000 to $99,999 | 365 (10.5%) | 410 (13.3%) |
| $100,000+ | 1,058 (30.4%) | 269 (8.7%) |
| Total | 3,477 (100.0%) | 3,079 (100.0%) |
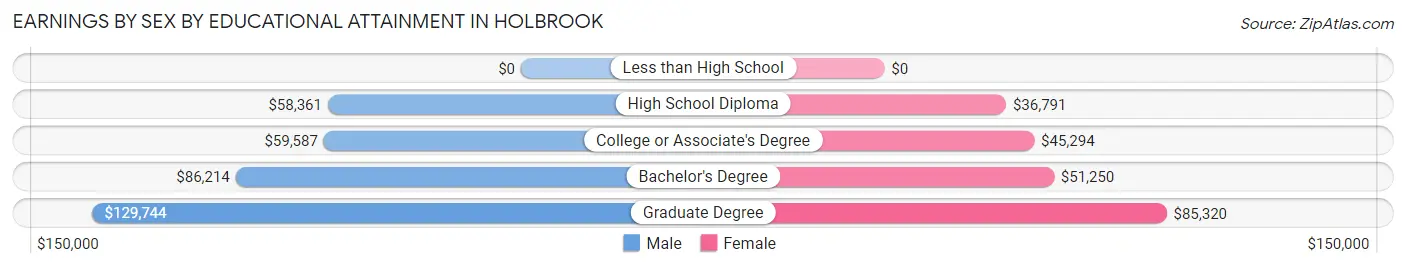
Earnings by Sex by Educational Attainment in Holbrook
Average earnings in Holbrook are $64,294 for men and $47,805 for women, a difference of 25.7%. Men with an educational attainment of graduate degree enjoy the highest average annual earnings of $129,744, while those with high school diploma education earn the least with $58,361. Women with an educational attainment of graduate degree earn the most with the average annual earnings of $85,320, while those with high school diploma education have the smallest earnings of $36,791.
| Educational Attainment | Male Income | Female Income |
| Less than High School | - | - |
| High School Diploma | $58,361 | $36,791 |
| College or Associate's Degree | $59,587 | $45,294 |
| Bachelor's Degree | $86,214 | $51,250 |
| Graduate Degree | $129,744 | $85,320 |
| Total | $64,294 | $47,805 |
Family Income in Holbrook
Family Income Brackets in Holbrook
According to the Holbrook family income data, there are 780 families falling into the $100,000 to $149,999 income range, which is the most common income bracket and makes up 25.3% of all families. Conversely, the less than $10,000 income bracket is the least frequent group with only 9 families (0.3%) belonging to this category.
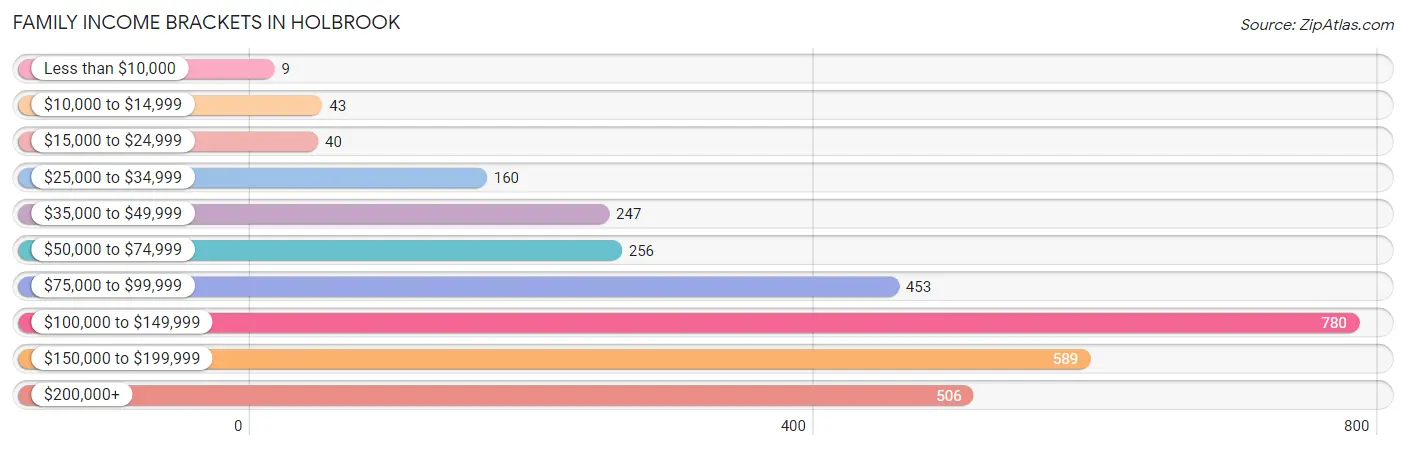
| Income Bracket | # Families | % Families |
| Less than $10,000 | 9 | 0.3% |
| $10,000 to $14,999 | 43 | 1.4% |
| $15,000 to $24,999 | 40 | 1.3% |
| $25,000 to $34,999 | 160 | 5.2% |
| $35,000 to $49,999 | 247 | 8.0% |
| $50,000 to $74,999 | 256 | 8.3% |
| $75,000 to $99,999 | 453 | 14.7% |
| $100,000 to $149,999 | 780 | 25.3% |
| $150,000 to $199,999 | 589 | 19.1% |
| $200,000+ | 506 | 16.4% |
Family Income by Famaliy Size in Holbrook
5-person families (212 | 6.9%) account for the highest median family income in Holbrook with $174,211 per family, while 3-person families (803 | 26.1%) have the highest median income of $54,750 per family member.
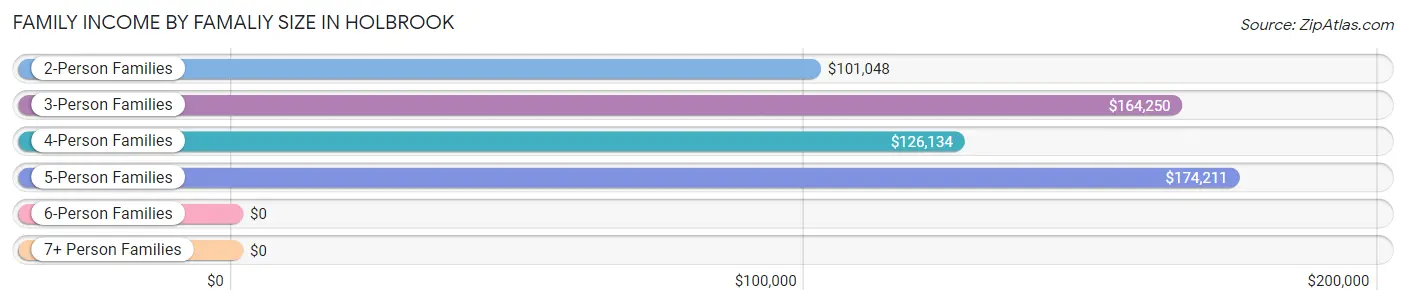
| Income Bracket | # Families | Median Income |
| 2-Person Families | 1,410 (45.7%) | $101,048 |
| 3-Person Families | 803 (26.1%) | $164,250 |
| 4-Person Families | 645 (20.9%) | $126,134 |
| 5-Person Families | 212 (6.9%) | $174,211 |
| 6-Person Families | 0 (0.0%) | $0 |
| 7+ Person Families | 13 (0.4%) | $0 |
| Total | 3,083 (100.0%) | $118,561 |
Family Income by Number of Earners in Holbrook
The median family income in Holbrook is $118,561, with families comprising 3+ earners (352) having the highest median family income of $200,698, while families with no earners (249) have the lowest median family income of $66,510, accounting for 11.4% and 8.1% of families, respectively.
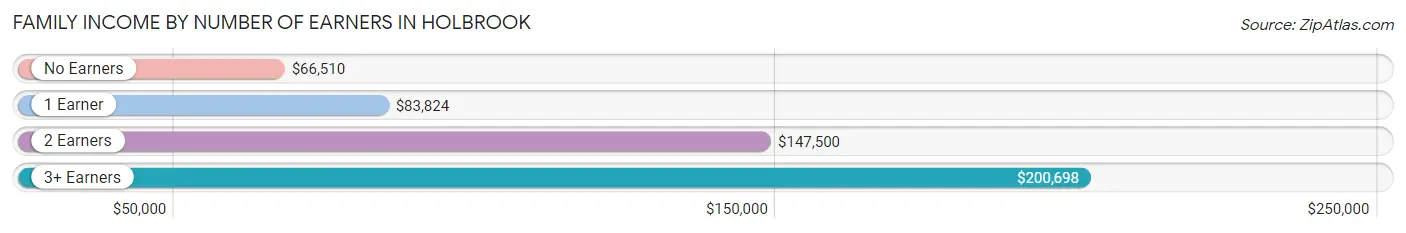
| Number of Earners | # Families | Median Income |
| No Earners | 249 (8.1%) | $66,510 |
| 1 Earner | 1,020 (33.1%) | $83,824 |
| 2 Earners | 1,462 (47.4%) | $147,500 |
| 3+ Earners | 352 (11.4%) | $200,698 |
| Total | 3,083 (100.0%) | $118,561 |
Household Income in Holbrook
Household Income Brackets in Holbrook
With 1,034 households falling in the category, the $100,000 to $149,999 income range is the most frequent in Holbrook, accounting for 22.4% of all households. In contrast, only 125 households (2.7%) fall into the $10,000 to $14,999 income bracket, making it the least populous group.
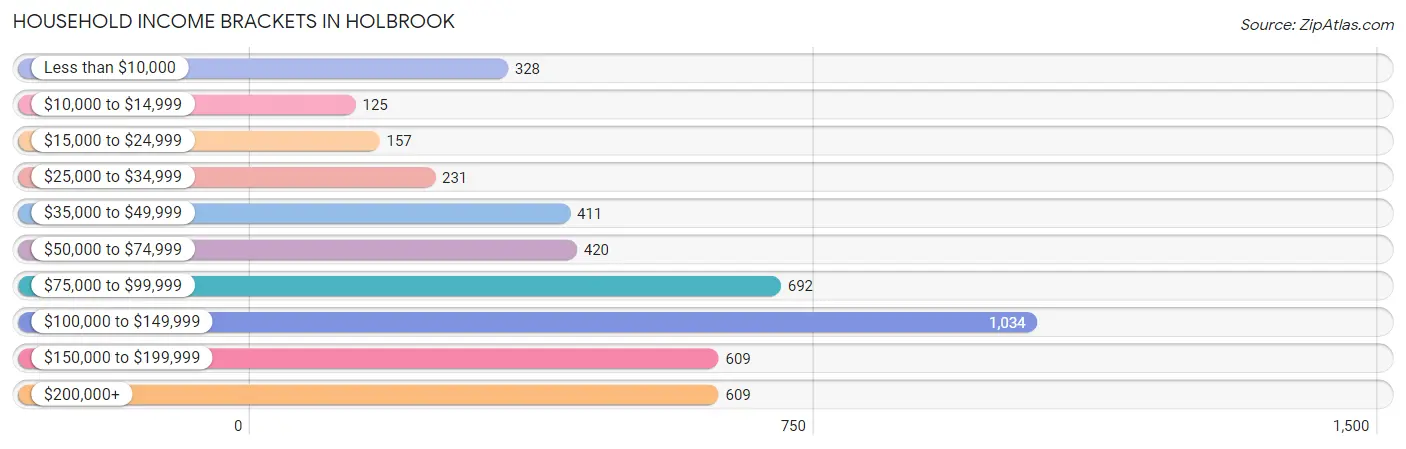
| Income Bracket | # Households | % Households |
| Less than $10,000 | 328 | 7.1% |
| $10,000 to $14,999 | 125 | 2.7% |
| $15,000 to $24,999 | 157 | 3.4% |
| $25,000 to $34,999 | 231 | 5.0% |
| $35,000 to $49,999 | 411 | 8.9% |
| $50,000 to $74,999 | 420 | 9.1% |
| $75,000 to $99,999 | 692 | 15.0% |
| $100,000 to $149,999 | 1,034 | 22.4% |
| $150,000 to $199,999 | 609 | 13.2% |
| $200,000+ | 609 | 13.2% |
Household Income by Householder Age in Holbrook
The median household income in Holbrook is $96,920, with the highest median household income of $120,105 found in the 25 to 44 years age bracket for the primary householder. A total of 1,455 households (31.5%) fall into this category.
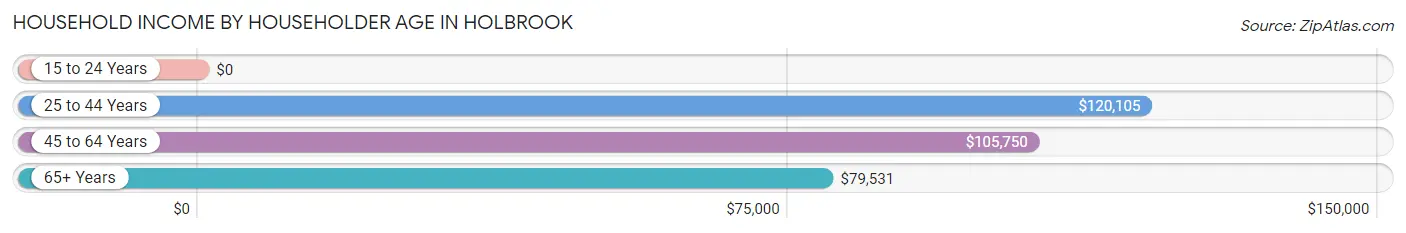
| Income Bracket | # Households | Median Income |
| 15 to 24 Years | 0 (0.0%) | $0 |
| 25 to 44 Years | 1,455 (31.5%) | $120,105 |
| 45 to 64 Years | 1,583 (34.3%) | $105,750 |
| 65+ Years | 1,577 (34.2%) | $79,531 |
| Total | 4,615 (100.0%) | $96,920 |
Poverty in Holbrook
Income Below Poverty by Sex and Age in Holbrook
With 6.3% poverty level for males and 8.4% for females among the residents of Holbrook, 18 to 24 year old males and 75 year old and over females are the most vulnerable to poverty, with 39 males (15.1%) and 188 females (39.4%) in their respective age groups living below the poverty level.
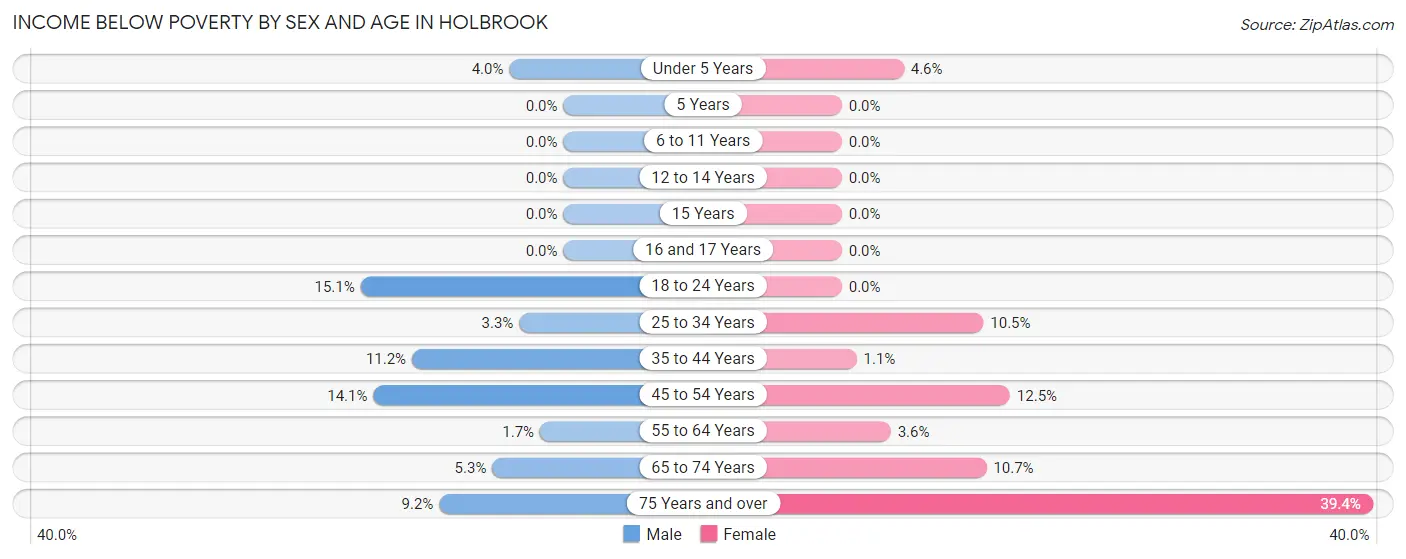
| Age Bracket | Male | Female |
| Under 5 Years | 11 (4.0%) | 12 (4.6%) |
| 5 Years | 0 (0.0%) | 0 (0.0%) |
| 6 to 11 Years | 0 (0.0%) | 0 (0.0%) |
| 12 to 14 Years | 0 (0.0%) | 0 (0.0%) |
| 15 Years | 0 (0.0%) | 0 (0.0%) |
| 16 and 17 Years | 0 (0.0%) | 0 (0.0%) |
| 18 to 24 Years | 39 (15.1%) | 0 (0.0%) |
| 25 to 34 Years | 23 (3.3%) | 86 (10.5%) |
| 35 to 44 Years | 78 (11.2%) | 10 (1.1%) |
| 45 to 54 Years | 113 (14.1%) | 74 (12.5%) |
| 55 to 64 Years | 16 (1.7%) | 27 (3.6%) |
| 65 to 74 Years | 39 (5.3%) | 83 (10.7%) |
| 75 Years and over | 33 (9.2%) | 188 (39.4%) |
| Total | 352 (6.3%) | 480 (8.4%) |
Income Above Poverty by Sex and Age in Holbrook
According to the poverty statistics in Holbrook, males aged 5 years and females aged 5 years are the age groups that are most secure financially, with 100.0% of males and 100.0% of females in these age groups living above the poverty line.
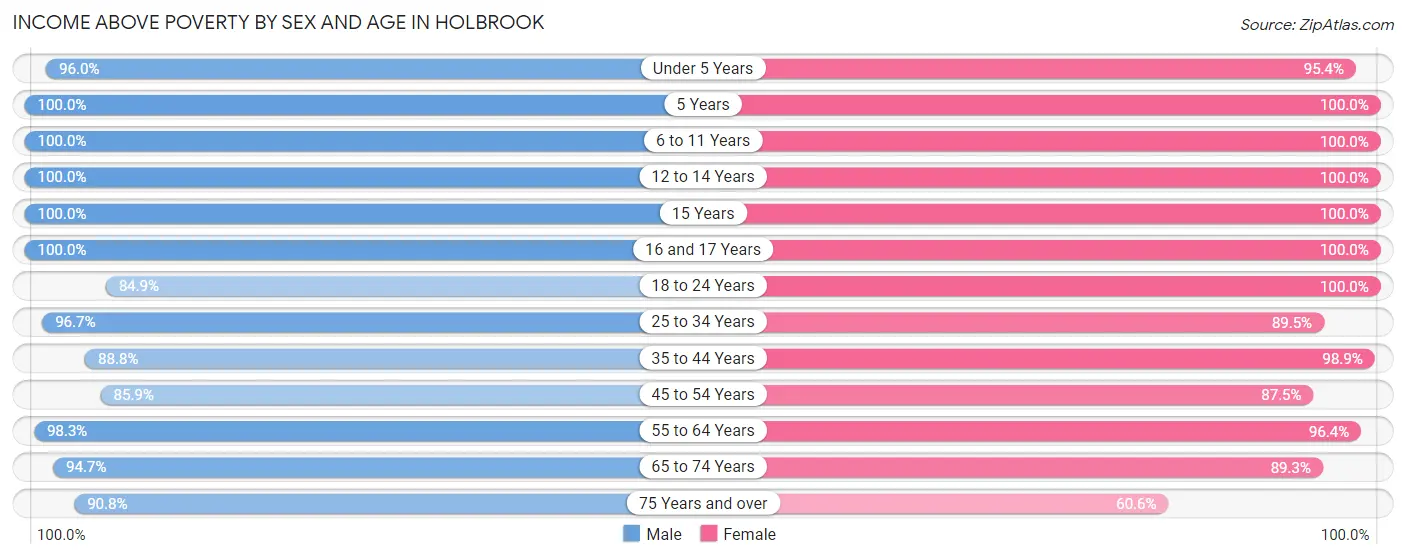
| Age Bracket | Male | Female |
| Under 5 Years | 263 (96.0%) | 249 (95.4%) |
| 5 Years | 77 (100.0%) | 55 (100.0%) |
| 6 to 11 Years | 304 (100.0%) | 406 (100.0%) |
| 12 to 14 Years | 136 (100.0%) | 247 (100.0%) |
| 15 Years | 28 (100.0%) | 84 (100.0%) |
| 16 and 17 Years | 265 (100.0%) | 92 (100.0%) |
| 18 to 24 Years | 220 (84.9%) | 270 (100.0%) |
| 25 to 34 Years | 679 (96.7%) | 732 (89.5%) |
| 35 to 44 Years | 616 (88.8%) | 900 (98.9%) |
| 45 to 54 Years | 688 (85.9%) | 519 (87.5%) |
| 55 to 64 Years | 906 (98.3%) | 716 (96.4%) |
| 65 to 74 Years | 700 (94.7%) | 690 (89.3%) |
| 75 Years and over | 325 (90.8%) | 289 (60.6%) |
| Total | 5,207 (93.7%) | 5,249 (91.6%) |
Income Below Poverty Among Married-Couple Families in Holbrook
The poverty statistics for married-couple families in Holbrook show that 0.5% or 10 of the total 1,916 families live below the poverty line. Families with 1 or 2 children have the highest poverty rate of 1.4%, comprising of 10 families. On the other hand, families with no children have the lowest poverty rate of 0.0%, which includes 0 families.
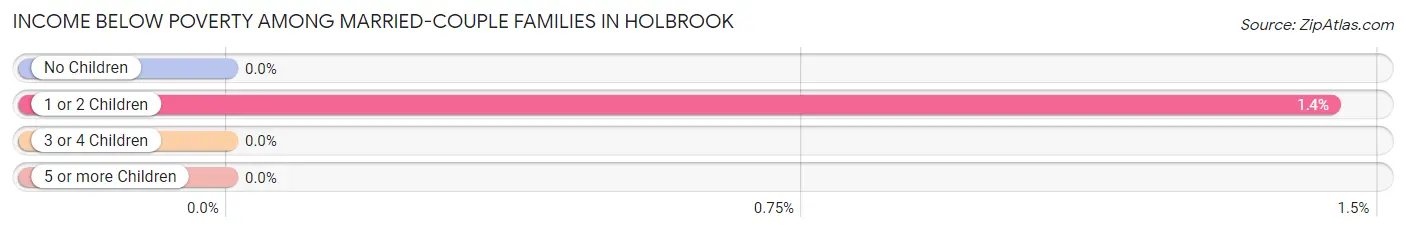
| Children | Above Poverty | Below Poverty |
| No Children | 1,129 (100.0%) | 0 (0.0%) |
| 1 or 2 Children | 685 (98.6%) | 10 (1.4%) |
| 3 or 4 Children | 92 (100.0%) | 0 (0.0%) |
| 5 or more Children | 0 (0.0%) | 0 (0.0%) |
| Total | 1,906 (99.5%) | 10 (0.5%) |
Income Below Poverty Among Single-Parent Households in Holbrook
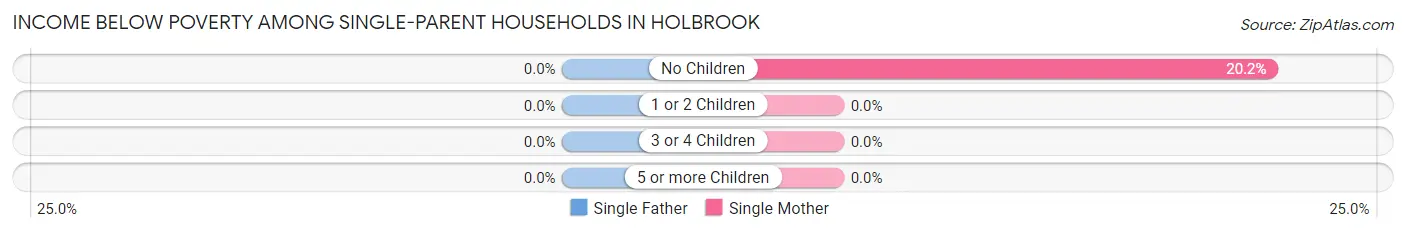
| Children | Single Father | Single Mother |
| No Children | 0 (0.0%) | 68 (20.2%) |
| 1 or 2 Children | 0 (0.0%) | 0 (0.0%) |
| 3 or 4 Children | 0 (0.0%) | 0 (0.0%) |
| 5 or more Children | 0 (0.0%) | 0 (0.0%) |
| Total | 0 (0.0%) | 68 (8.9%) |
Income Below Poverty Among Married-Couple vs Single-Parent Households in Holbrook
The poverty data for Holbrook shows that 10 of the married-couple family households (0.5%) and 68 of the single-parent households (5.8%) are living below the poverty level. Within the married-couple family households, those with 1 or 2 children have the highest poverty rate, with 10 households (1.4%) falling below the poverty line. Among the single-parent households, those with no children have the highest poverty rate, with 68 household (10.8%) living below poverty.
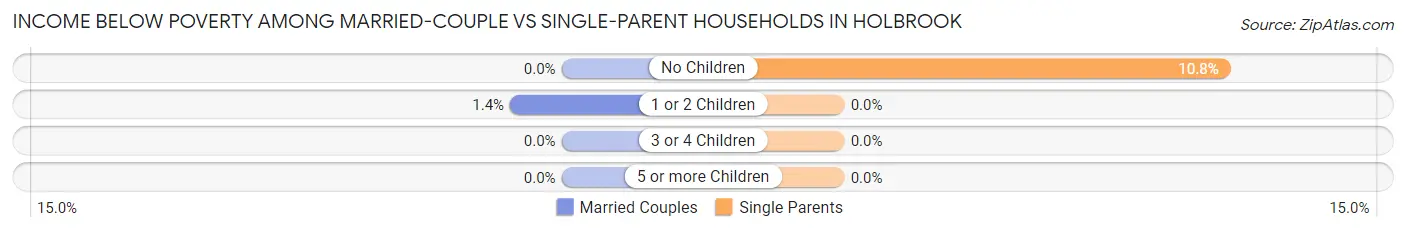
| Children | Married-Couple Families | Single-Parent Households |
| No Children | 0 (0.0%) | 68 (10.8%) |
| 1 or 2 Children | 10 (1.4%) | 0 (0.0%) |
| 3 or 4 Children | 0 (0.0%) | 0 (0.0%) |
| 5 or more Children | 0 (0.0%) | 0 (0.0%) |
| Total | 10 (0.5%) | 68 (5.8%) |
Race in Holbrook
The most populous races in Holbrook are White / Caucasian (8,521 | 75.1%), Two or more Races (1,220 | 10.8%), and Black / African American (1,121 | 9.9%).
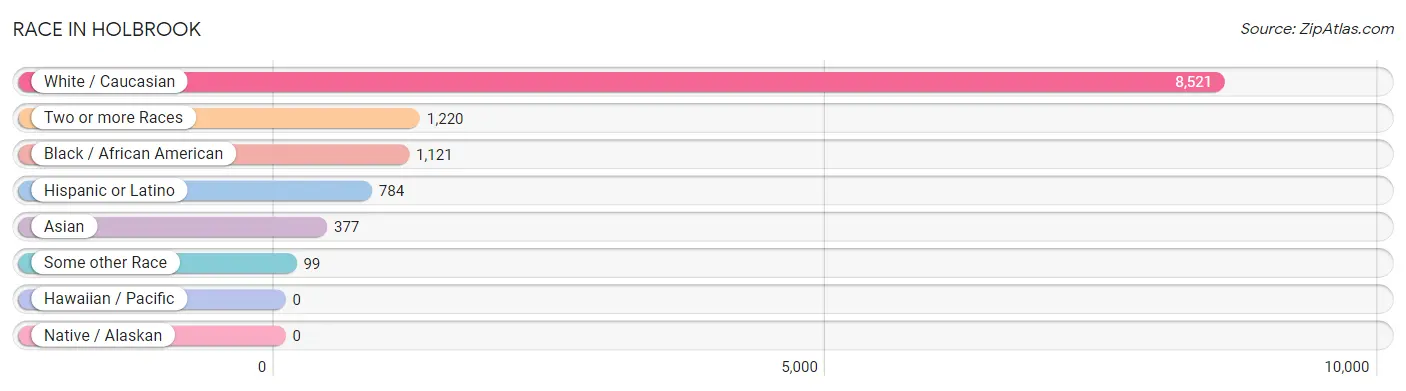
| Race | # Population | % Population |
| Asian | 377 | 3.3% |
| Black / African American | 1,121 | 9.9% |
| Hawaiian / Pacific | 0 | 0.0% |
| Hispanic or Latino | 784 | 6.9% |
| Native / Alaskan | 0 | 0.0% |
| White / Caucasian | 8,521 | 75.1% |
| Two or more Races | 1,220 | 10.8% |
| Some other Race | 99 | 0.9% |
| Total | 11,338 | 100.0% |
Ancestry in Holbrook
The most populous ancestries reported in Holbrook are Irish (3,774 | 33.3%), Italian (1,227 | 10.8%), German (1,167 | 10.3%), English (962 | 8.5%), and Polish (536 | 4.7%), together accounting for 67.6% of all Holbrook residents.
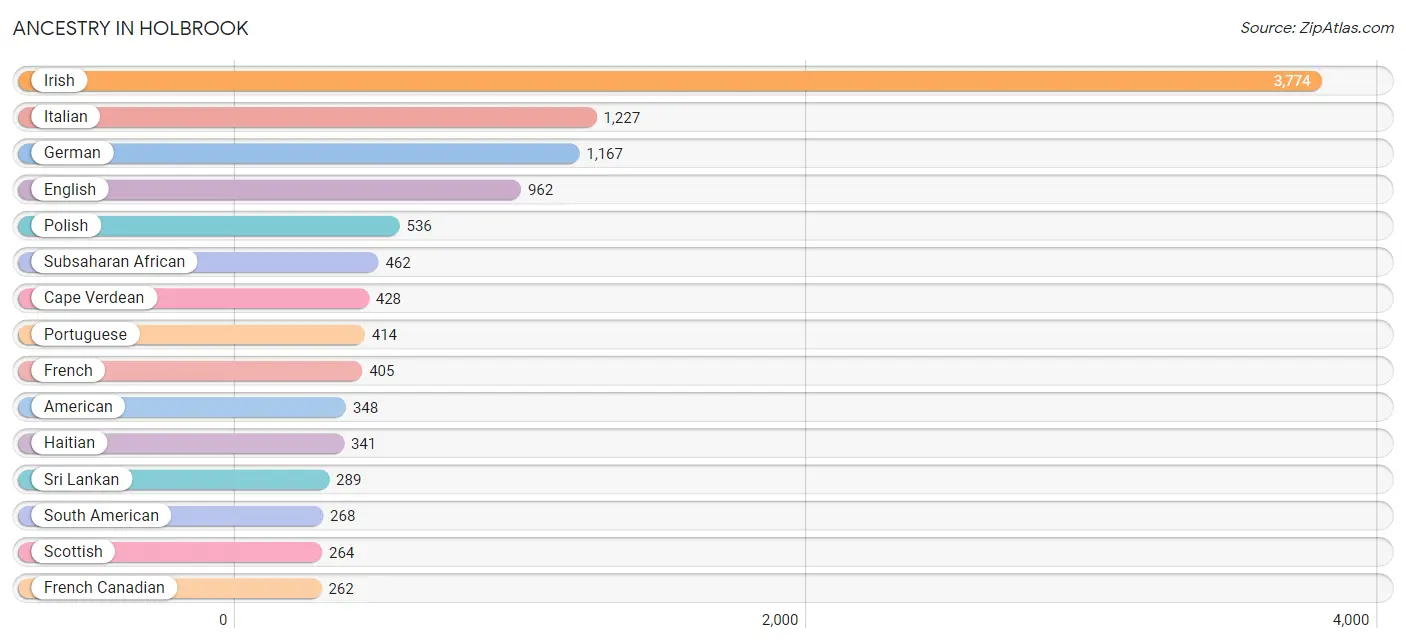
| Ancestry | # Population | % Population |
| African | 34 | 0.3% |
| American | 348 | 3.1% |
| Arab | 235 | 2.1% |
| Armenian | 29 | 0.3% |
| Bahamian | 192 | 1.7% |
| Barbadian | 184 | 1.6% |
| Belgian | 54 | 0.5% |
| Blackfeet | 16 | 0.1% |
| Canadian | 136 | 1.2% |
| Cape Verdean | 428 | 3.8% |
| Celtic | 13 | 0.1% |
| Central American | 205 | 1.8% |
| Chilean | 52 | 0.5% |
| Colombian | 186 | 1.6% |
| Costa Rican | 13 | 0.1% |
| Danish | 28 | 0.3% |
| Dominican | 141 | 1.2% |
| Dutch | 87 | 0.8% |
| Eastern European | 5 | 0.0% |
| English | 962 | 8.5% |
| French | 405 | 3.6% |
| French Canadian | 262 | 2.3% |
| German | 1,167 | 10.3% |
| Haitian | 341 | 3.0% |
| Honduran | 192 | 1.7% |
| Hungarian | 111 | 1.0% |
| Indian (Asian) | 75 | 0.7% |
| Irish | 3,774 | 33.3% |
| Italian | 1,227 | 10.8% |
| Jamaican | 26 | 0.2% |
| Korean | 8 | 0.1% |
| Lebanese | 235 | 2.1% |
| Lithuanian | 26 | 0.2% |
| Northern European | 19 | 0.2% |
| Norwegian | 180 | 1.6% |
| Peruvian | 30 | 0.3% |
| Polish | 536 | 4.7% |
| Portuguese | 414 | 3.6% |
| Puerto Rican | 94 | 0.8% |
| Russian | 62 | 0.5% |
| Scotch-Irish | 68 | 0.6% |
| Scottish | 264 | 2.3% |
| South American | 268 | 2.4% |
| Spaniard | 22 | 0.2% |
| Sri Lankan | 289 | 2.5% |
| Subsaharan African | 462 | 4.1% |
| Swedish | 126 | 1.1% |
| Trinidadian and Tobagonian | 14 | 0.1% |
| West Indian | 82 | 0.7% | View All 49 Rows |
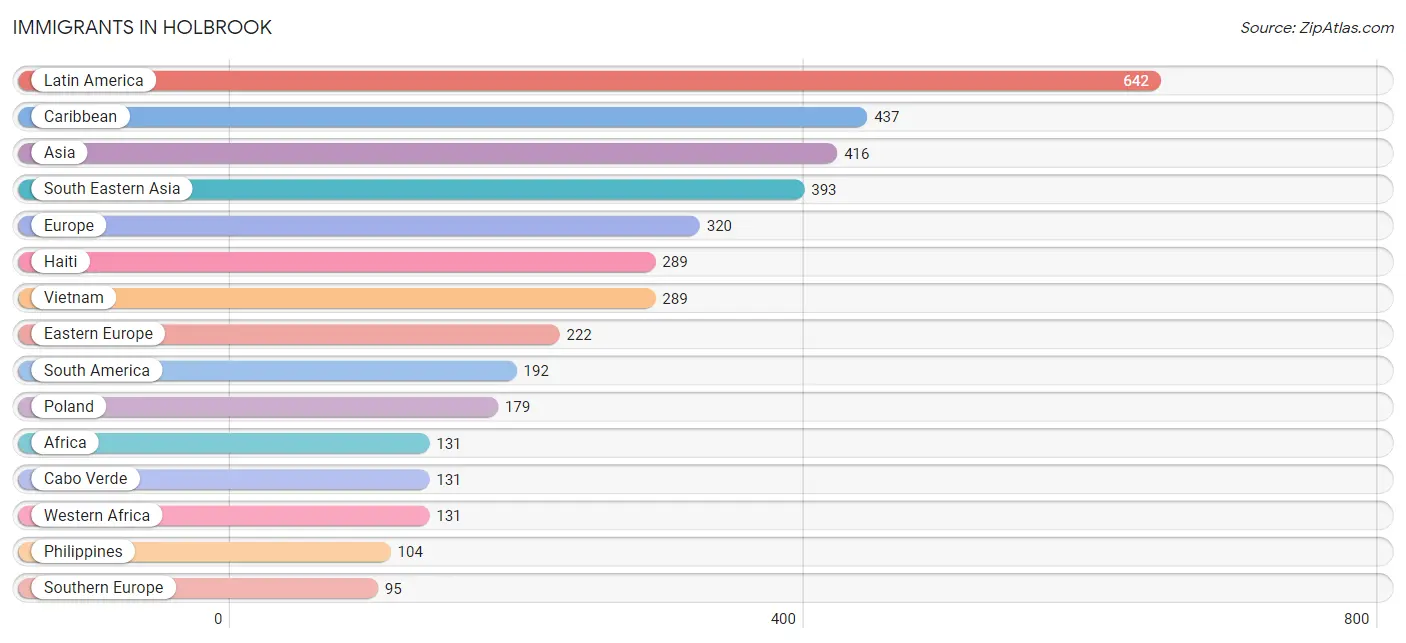
Immigrants in Holbrook
The most numerous immigrant groups reported in Holbrook came from Latin America (642 | 5.7%), Caribbean (437 | 3.8%), Asia (416 | 3.7%), South Eastern Asia (393 | 3.5%), and Europe (320 | 2.8%), together accounting for 19.5% of all Holbrook residents.
| Immigration Origin | # Population | % Population |
| Africa | 131 | 1.2% |
| Albania | 24 | 0.2% |
| Asia | 416 | 3.7% |
| Brazil | 32 | 0.3% |
| Cabo Verde | 131 | 1.2% |
| Caribbean | 437 | 3.8% |
| Central America | 13 | 0.1% |
| Chile | 52 | 0.5% |
| China | 23 | 0.2% |
| Colombia | 78 | 0.7% |
| Costa Rica | 13 | 0.1% |
| Dominica | 52 | 0.5% |
| Dominican Republic | 44 | 0.4% |
| Eastern Asia | 23 | 0.2% |
| Eastern Europe | 222 | 2.0% |
| Europe | 320 | 2.8% |
| Haiti | 289 | 2.5% |
| Hungary | 19 | 0.2% |
| Ireland | 3 | 0.0% |
| Italy | 36 | 0.3% |
| Jamaica | 26 | 0.2% |
| Latin America | 642 | 5.7% |
| Northern Europe | 3 | 0.0% |
| Peru | 30 | 0.3% |
| Philippines | 104 | 0.9% |
| Poland | 179 | 1.6% |
| Portugal | 59 | 0.5% |
| South America | 192 | 1.7% |
| South Eastern Asia | 393 | 3.5% |
| Southern Europe | 95 | 0.8% |
| Trinidad and Tobago | 26 | 0.2% |
| Vietnam | 289 | 2.5% |
| Western Africa | 131 | 1.2% | View All 33 Rows |
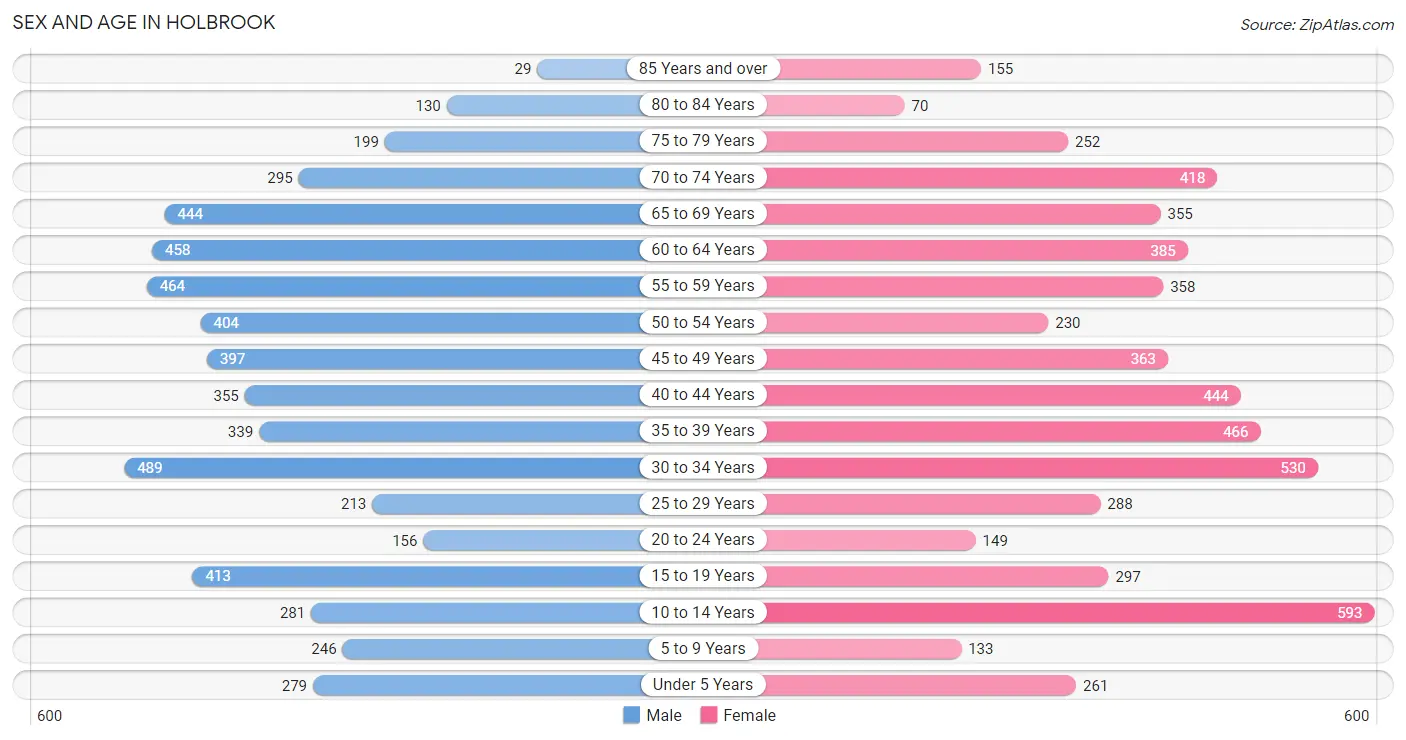
Sex and Age in Holbrook
Sex and Age in Holbrook
The most populous age groups in Holbrook are 30 to 34 Years (489 | 8.7%) for men and 10 to 14 Years (593 | 10.3%) for women.
| Age Bracket | Male | Female |
| Under 5 Years | 279 (5.0%) | 261 (4.5%) |
| 5 to 9 Years | 246 (4.4%) | 133 (2.3%) |
| 10 to 14 Years | 281 (5.0%) | 593 (10.3%) |
| 15 to 19 Years | 413 (7.4%) | 297 (5.2%) |
| 20 to 24 Years | 156 (2.8%) | 149 (2.6%) |
| 25 to 29 Years | 213 (3.8%) | 288 (5.0%) |
| 30 to 34 Years | 489 (8.7%) | 530 (9.2%) |
| 35 to 39 Years | 339 (6.1%) | 466 (8.1%) |
| 40 to 44 Years | 355 (6.4%) | 444 (7.7%) |
| 45 to 49 Years | 397 (7.1%) | 363 (6.3%) |
| 50 to 54 Years | 404 (7.2%) | 230 (4.0%) |
| 55 to 59 Years | 464 (8.3%) | 358 (6.2%) |
| 60 to 64 Years | 458 (8.2%) | 385 (6.7%) |
| 65 to 69 Years | 444 (7.9%) | 355 (6.2%) |
| 70 to 74 Years | 295 (5.3%) | 418 (7.3%) |
| 75 to 79 Years | 199 (3.6%) | 252 (4.4%) |
| 80 to 84 Years | 130 (2.3%) | 70 (1.2%) |
| 85 Years and over | 29 (0.5%) | 155 (2.7%) |
| Total | 5,591 (100.0%) | 5,747 (100.0%) |
Families and Households in Holbrook
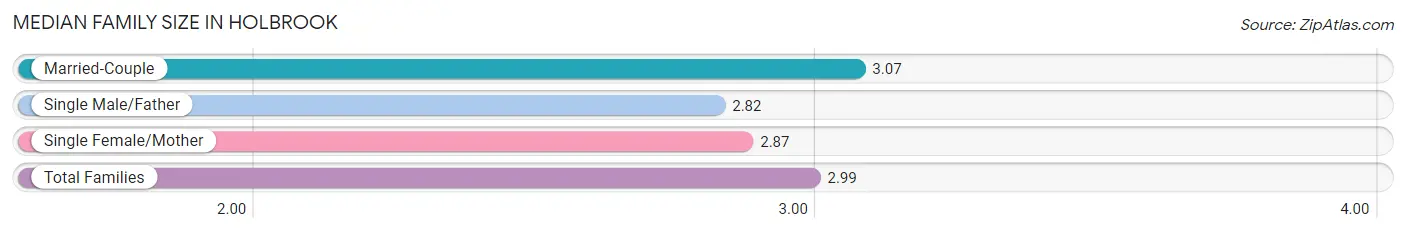
Median Family Size in Holbrook
The median family size in Holbrook is 2.99 persons per family, with married-couple families (1,916 | 62.2%) accounting for the largest median family size of 3.07 persons per family. On the other hand, single male/father families (400 | 13.0%) represent the smallest median family size with 2.82 persons per family.
| Family Type | # Families | Family Size |
| Married-Couple | 1,916 (62.2%) | 3.07 |
| Single Male/Father | 400 (13.0%) | 2.82 |
| Single Female/Mother | 767 (24.9%) | 2.87 |
| Total Families | 3,083 (100.0%) | 2.99 |
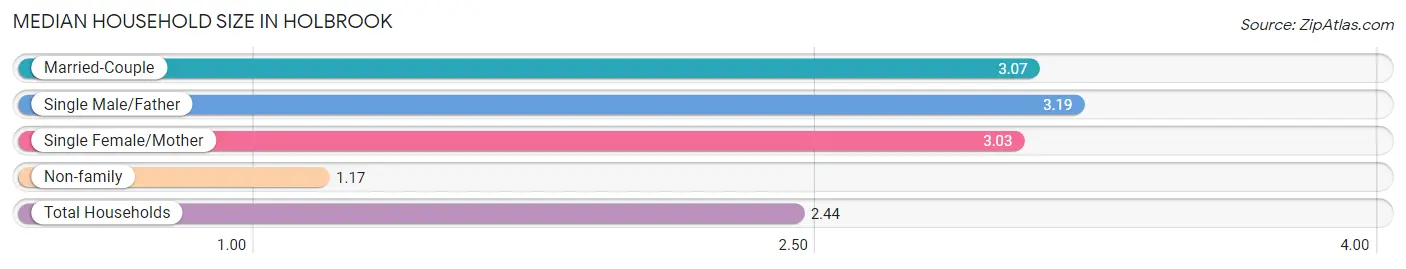
Median Household Size in Holbrook
The median household size in Holbrook is 2.44 persons per household, with single male/father households (400 | 8.7%) accounting for the largest median household size of 3.19 persons per household. non-family households (1,532 | 33.2%) represent the smallest median household size with 1.17 persons per household.
| Household Type | # Households | Household Size |
| Married-Couple | 1,916 (41.5%) | 3.07 |
| Single Male/Father | 400 (8.7%) | 3.19 |
| Single Female/Mother | 767 (16.6%) | 3.03 |
| Non-family | 1,532 (33.2%) | 1.17 |
| Total Households | 4,615 (100.0%) | 2.44 |
Household Size by Marriage Status in Holbrook
Out of a total of 4,615 households in Holbrook, 3,083 (66.8%) are family households, while 1,532 (33.2%) are nonfamily households. The most numerous type of family households are 2-person households, comprising 1,293, and the most common type of nonfamily households are 1-person households, comprising 1,257.
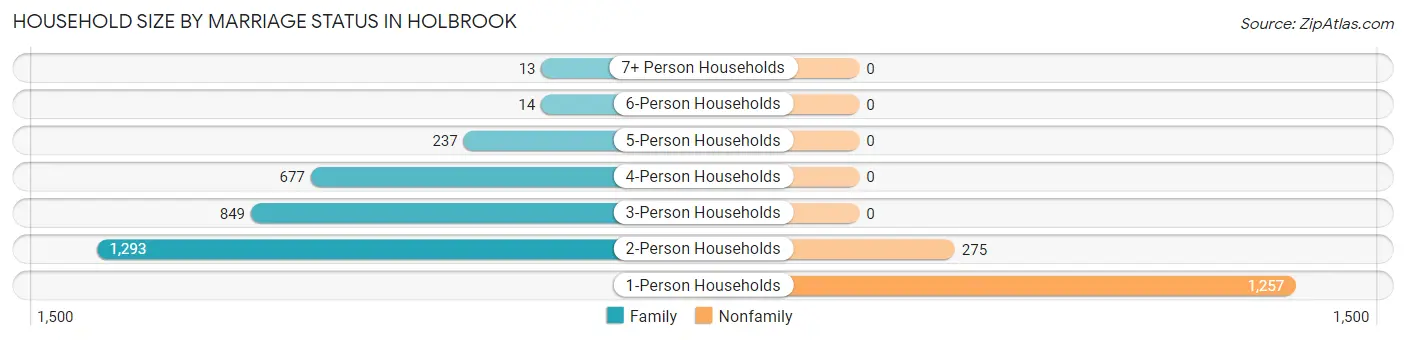
| Household Size | Family Households | Nonfamily Households |
| 1-Person Households | - | 1,257 (27.2%) |
| 2-Person Households | 1,293 (28.0%) | 275 (6.0%) |
| 3-Person Households | 849 (18.4%) | 0 (0.0%) |
| 4-Person Households | 677 (14.7%) | 0 (0.0%) |
| 5-Person Households | 237 (5.1%) | 0 (0.0%) |
| 6-Person Households | 14 (0.3%) | 0 (0.0%) |
| 7+ Person Households | 13 (0.3%) | 0 (0.0%) |
| Total | 3,083 (66.8%) | 1,532 (33.2%) |
Female Fertility in Holbrook
Fertility by Age in Holbrook
Average fertility rate in Holbrook is 58.0 births per 1,000 women. Women in the age bracket of 20 to 34 years have the highest fertility rate with 73.0 births per 1,000 women. Women in the age bracket of 35 to 50 years acount for 52.3% of all women with births.
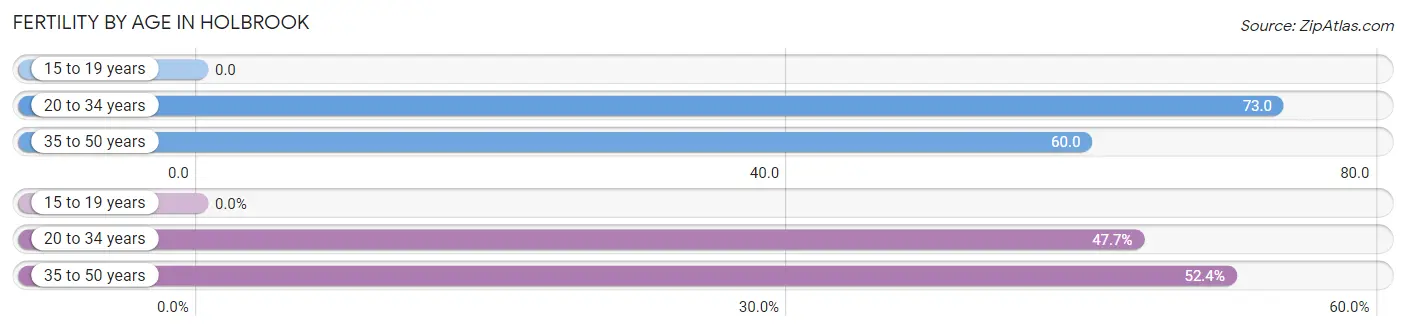
| Age Bracket | Women with Births | Births / 1,000 Women |
| 15 to 19 years | 0 (0.0%) | 0.0 |
| 20 to 34 years | 71 (47.6%) | 73.0 |
| 35 to 50 years | 78 (52.3%) | 60.0 |
| Total | 149 (100.0%) | 58.0 |
Fertility by Age by Marriage Status in Holbrook
79.2% of women with births (149) in Holbrook are married. The highest percentage of unmarried women with births falls into 20 to 34 years age bracket with 43.7% of them unmarried at the time of birth, while the lowest percentage of unmarried women with births belong to 35 to 50 years age bracket with 0.0% of them unmarried.
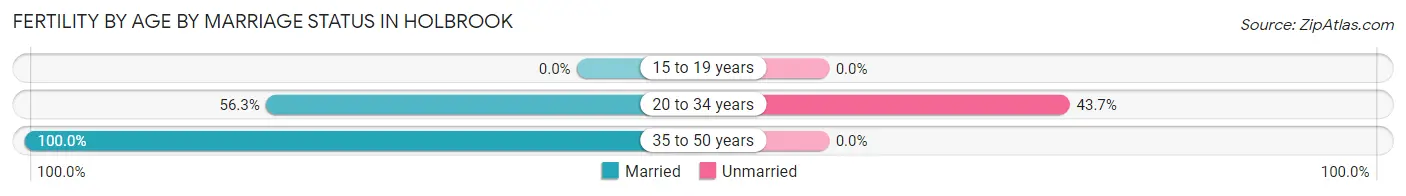
| Age Bracket | Married | Unmarried |
| 15 to 19 years | 0 (0.0%) | 0 (0.0%) |
| 20 to 34 years | 40 (56.3%) | 31 (43.7%) |
| 35 to 50 years | 78 (100.0%) | 0 (0.0%) |
| Total | 118 (79.2%) | 31 (20.8%) |
Fertility by Education in Holbrook
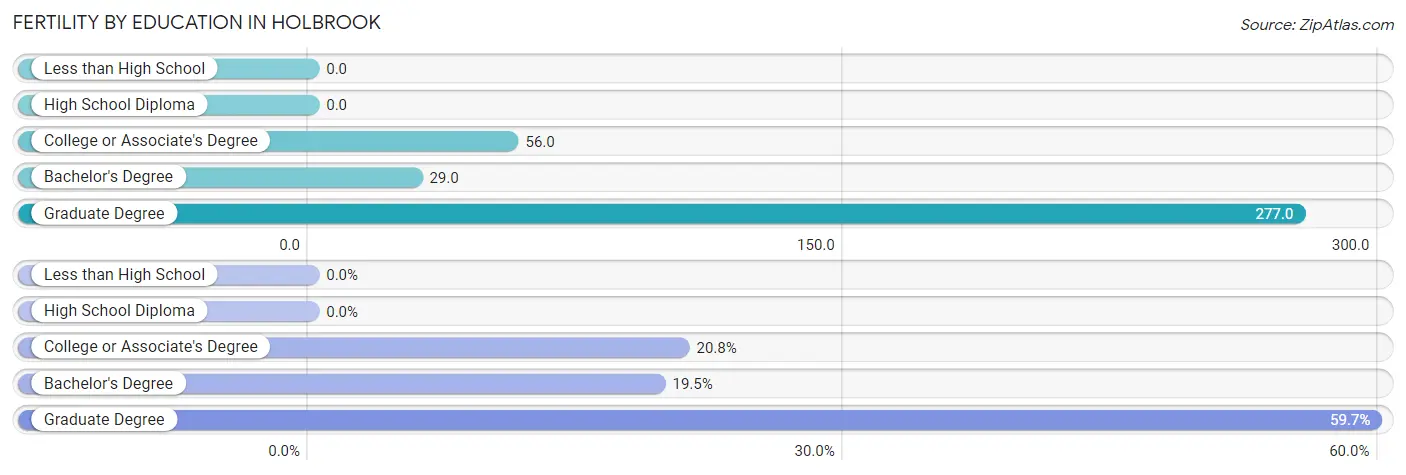
| Educational Attainment | Women with Births | Births / 1,000 Women |
| Less than High School | 0 (0.0%) | 0.0 |
| High School Diploma | 0 (0.0%) | 0.0 |
| College or Associate's Degree | 31 (20.8%) | 56.0 |
| Bachelor's Degree | 29 (19.5%) | 29.0 |
| Graduate Degree | 89 (59.7%) | 277.0 |
| Total | 149 (100.0%) | 58.0 |
Fertility by Education by Marriage Status in Holbrook
20.8% of women with births in Holbrook are unmarried. Women with the educational attainment of bachelor's degree are most likely to be married with 100.0% of them married at childbirth, while women with the educational attainment of college or associate's degree are least likely to be married with 100.0% of them unmarried at childbirth.
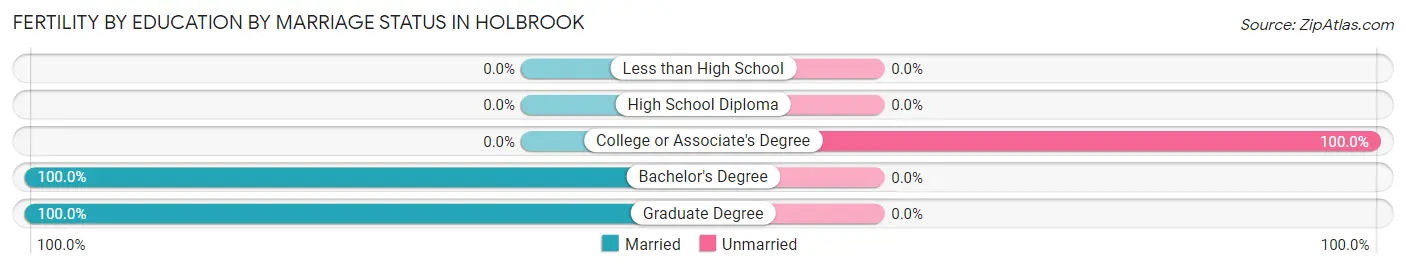
| Educational Attainment | Married | Unmarried |
| Less than High School | 0 (0.0%) | 0 (0.0%) |
| High School Diploma | 0 (0.0%) | 0 (0.0%) |
| College or Associate's Degree | 0 (0.0%) | 31 (100.0%) |
| Bachelor's Degree | 29 (100.0%) | 0 (0.0%) |
| Graduate Degree | 89 (100.0%) | 0 (0.0%) |
| Total | 118 (79.2%) | 31 (20.8%) |
Employment Characteristics in Holbrook
Employment by Class of Employer in Holbrook
Among the 6,016 employed individuals in Holbrook, private company employees (4,121 | 68.5%), not-for-profit organizations (584 | 9.7%), and state government employees (408 | 6.8%) make up the most common classes of employment.
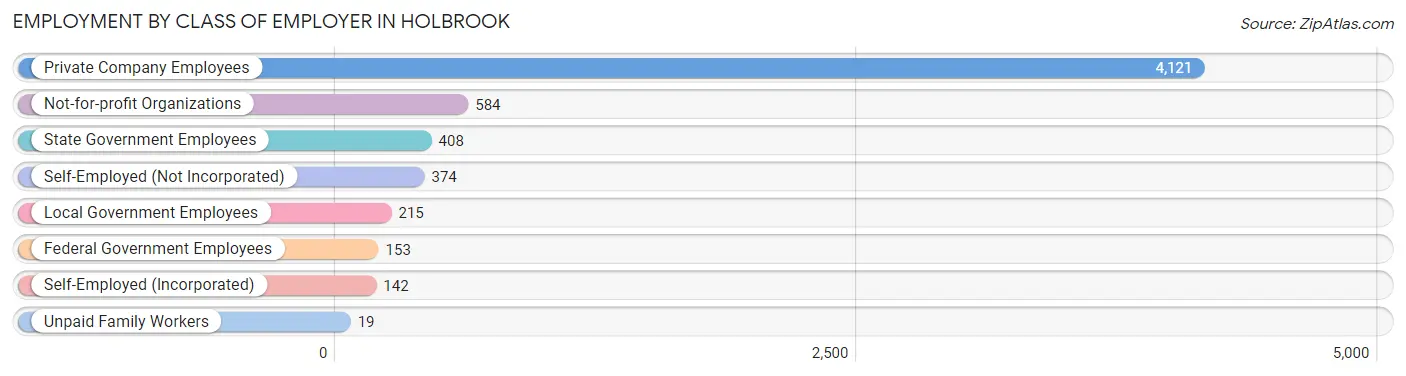
| Employer Class | # Employees | % Employees |
| Private Company Employees | 4,121 | 68.5% |
| Self-Employed (Incorporated) | 142 | 2.4% |
| Self-Employed (Not Incorporated) | 374 | 6.2% |
| Not-for-profit Organizations | 584 | 9.7% |
| Local Government Employees | 215 | 3.6% |
| State Government Employees | 408 | 6.8% |
| Federal Government Employees | 153 | 2.5% |
| Unpaid Family Workers | 19 | 0.3% |
| Total | 6,016 | 100.0% |
Employment Status by Age in Holbrook
According to the labor force statistics for Holbrook, out of the total population over 16 years of age (9,433), 68.3% or 6,443 individuals are in the labor force, with 3.8% or 245 of them unemployed. The age group with the highest labor force participation rate is 35 to 44 years, with 94.2% or 1,511 individuals in the labor force. Within the labor force, the 16 to 19 years age range has the highest percentage of unemployed individuals, with 15.8% or 33 of them being unemployed.
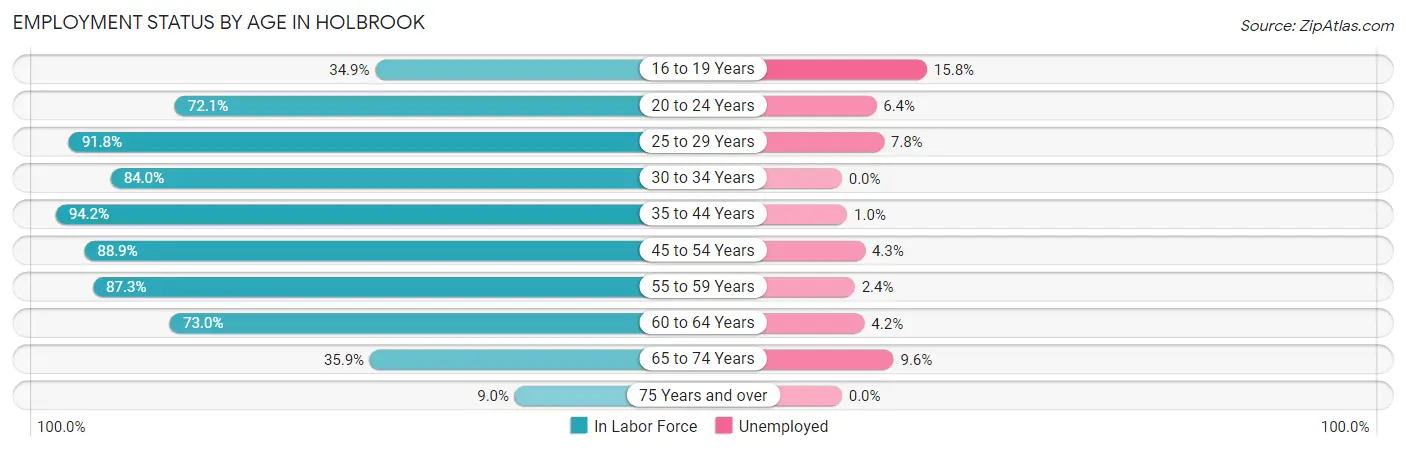
| Age Bracket | In Labor Force | Unemployed |
| 16 to 19 Years | 209 (34.9%) | 33 (15.8%) |
| 20 to 24 Years | 220 (72.1%) | 14 (6.4%) |
| 25 to 29 Years | 460 (91.8%) | 36 (7.8%) |
| 30 to 34 Years | 856 (84.0%) | 0 (0.0%) |
| 35 to 44 Years | 1,511 (94.2%) | 15 (1.0%) |
| 45 to 54 Years | 1,239 (88.9%) | 53 (4.3%) |
| 55 to 59 Years | 718 (87.3%) | 17 (2.4%) |
| 60 to 64 Years | 615 (73.0%) | 26 (4.2%) |
| 65 to 74 Years | 543 (35.9%) | 52 (9.6%) |
| 75 Years and over | 75 (9.0%) | 0 (0.0%) |
| Total | 6,443 (68.3%) | 245 (3.8%) |
Employment Status by Educational Attainment in Holbrook
According to labor force statistics for Holbrook, 87.3% of individuals (5,398) out of the total population between 25 and 64 years of age (6,183) are in the labor force, with 2.7% or 146 of them being unemployed. The group with the highest labor force participation rate are those with the educational attainment of bachelor's degree or higher, with 94.7% or 2,314 individuals in the labor force. Within the labor force, individuals with less than high school education have the highest percentage of unemployment, with 38.3% or 44 of them being unemployed.
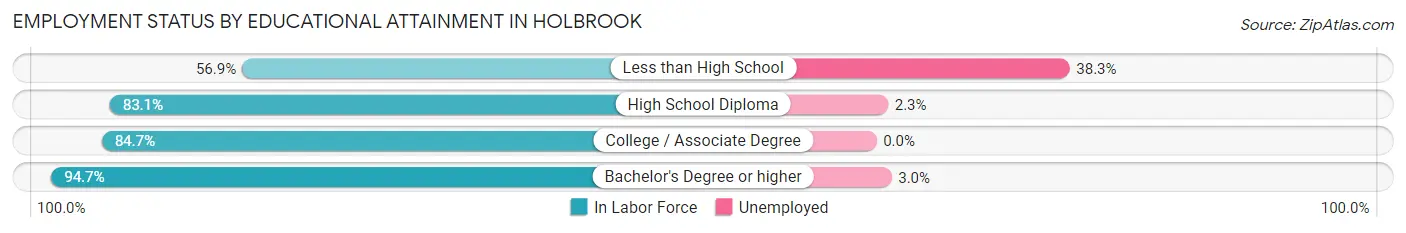
| Educational Attainment | In Labor Force | Unemployed |
| Less than High School | 115 (56.9%) | 77 (38.3%) |
| High School Diploma | 1,412 (83.1%) | 39 (2.3%) |
| College / Associate Degree | 1,557 (84.7%) | 0 (0.0%) |
| Bachelor's Degree or higher | 2,314 (94.7%) | 73 (3.0%) |
| Total | 5,398 (87.3%) | 167 (2.7%) |
Employment Occupations by Sex in Holbrook
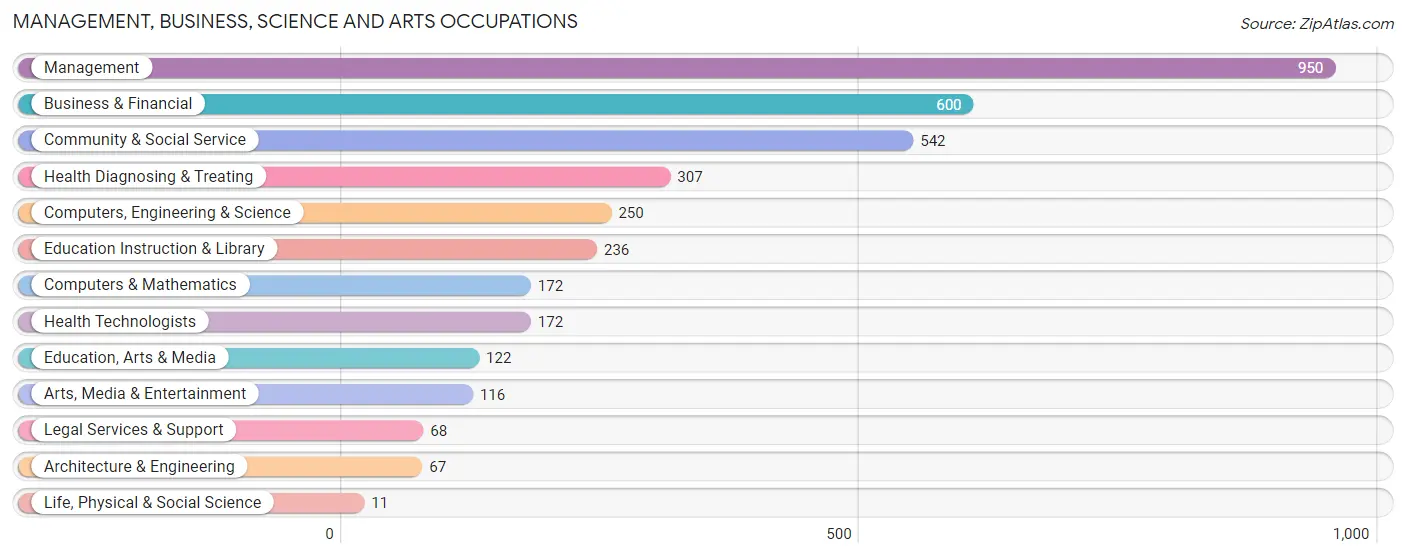
Management, Business, Science and Arts Occupations
The most common Management, Business, Science and Arts occupations in Holbrook are Management (950 | 15.3%), Business & Financial (600 | 9.7%), Community & Social Service (542 | 8.7%), Health Diagnosing & Treating (307 | 5.0%), and Computers, Engineering & Science (250 | 4.0%).
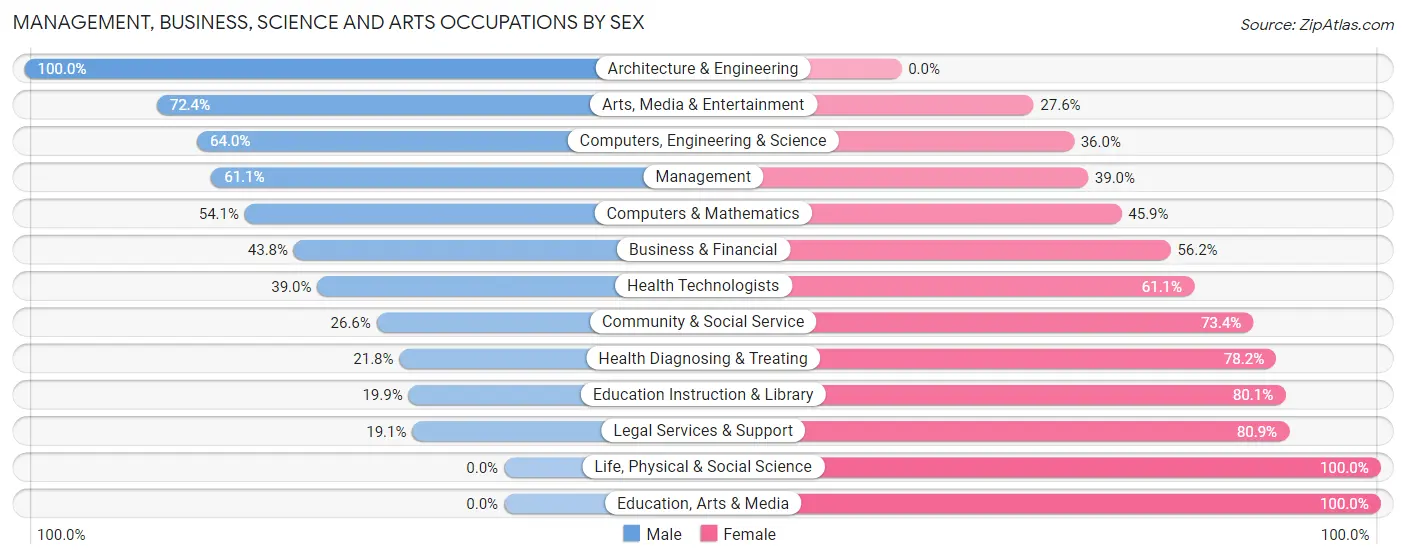
Management, Business, Science and Arts Occupations by Sex
Within the Management, Business, Science and Arts occupations in Holbrook, the most male-oriented occupations are Architecture & Engineering (100.0%), Arts, Media & Entertainment (72.4%), and Computers, Engineering & Science (64.0%), while the most female-oriented occupations are Life, Physical & Social Science (100.0%), Education, Arts & Media (100.0%), and Legal Services & Support (80.9%).
| Occupation | Male | Female |
| Management | 580 (61.1%) | 370 (39.0%) |
| Business & Financial | 263 (43.8%) | 337 (56.2%) |
| Computers, Engineering & Science | 160 (64.0%) | 90 (36.0%) |
| Computers & Mathematics | 93 (54.1%) | 79 (45.9%) |
| Architecture & Engineering | 67 (100.0%) | 0 (0.0%) |
| Life, Physical & Social Science | 0 (0.0%) | 11 (100.0%) |
| Community & Social Service | 144 (26.6%) | 398 (73.4%) |
| Education, Arts & Media | 0 (0.0%) | 122 (100.0%) |
| Legal Services & Support | 13 (19.1%) | 55 (80.9%) |
| Education Instruction & Library | 47 (19.9%) | 189 (80.1%) |
| Arts, Media & Entertainment | 84 (72.4%) | 32 (27.6%) |
| Health Diagnosing & Treating | 67 (21.8%) | 240 (78.2%) |
| Health Technologists | 67 (39.0%) | 105 (61.1%) |
| Total (Category) | 1,214 (45.8%) | 1,435 (54.2%) |
| Total (Overall) | 3,285 (53.0%) | 2,915 (47.0%) |
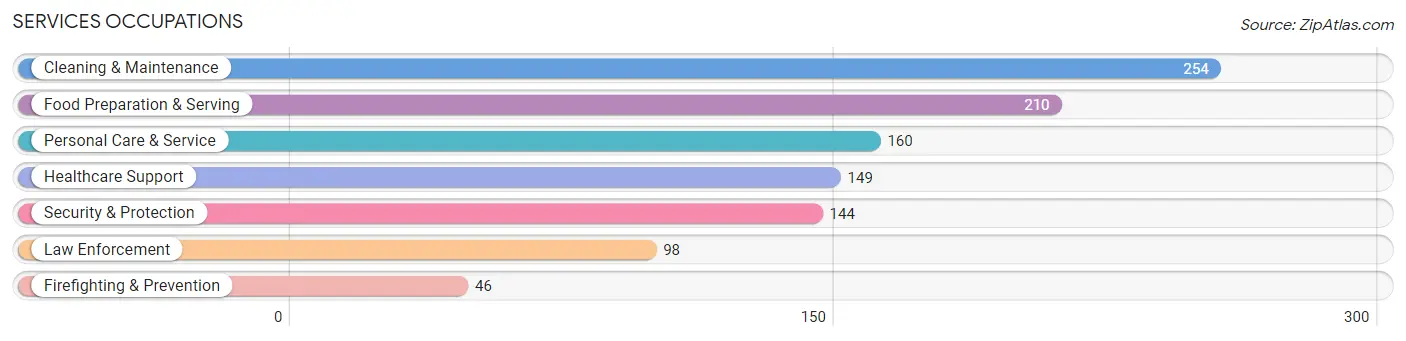
Services Occupations
The most common Services occupations in Holbrook are Cleaning & Maintenance (254 | 4.1%), Food Preparation & Serving (210 | 3.4%), Personal Care & Service (160 | 2.6%), Healthcare Support (149 | 2.4%), and Security & Protection (144 | 2.3%).
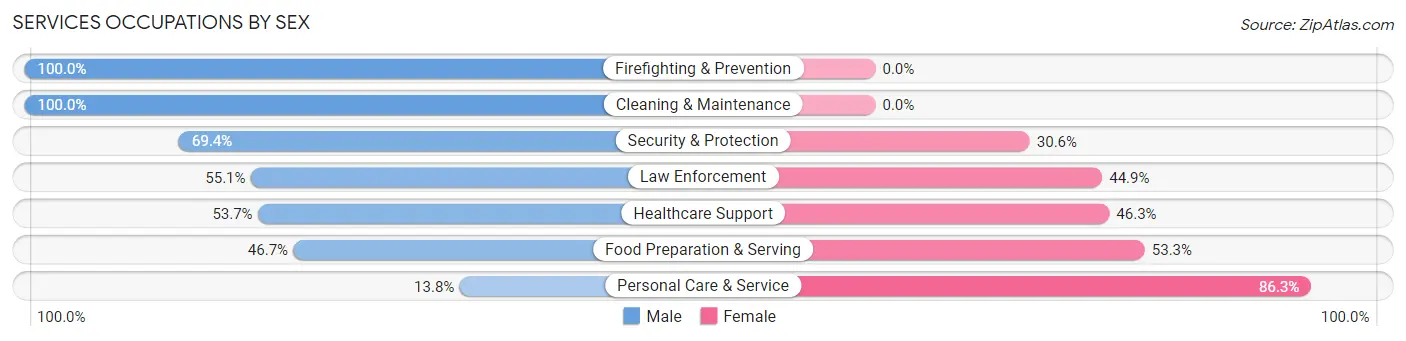
Services Occupations by Sex
Within the Services occupations in Holbrook, the most male-oriented occupations are Firefighting & Prevention (100.0%), Cleaning & Maintenance (100.0%), and Security & Protection (69.4%), while the most female-oriented occupations are Personal Care & Service (86.3%), Food Preparation & Serving (53.3%), and Healthcare Support (46.3%).
| Occupation | Male | Female |
| Healthcare Support | 80 (53.7%) | 69 (46.3%) |
| Security & Protection | 100 (69.4%) | 44 (30.6%) |
| Firefighting & Prevention | 46 (100.0%) | 0 (0.0%) |
| Law Enforcement | 54 (55.1%) | 44 (44.9%) |
| Food Preparation & Serving | 98 (46.7%) | 112 (53.3%) |
| Cleaning & Maintenance | 254 (100.0%) | 0 (0.0%) |
| Personal Care & Service | 22 (13.8%) | 138 (86.3%) |
| Total (Category) | 554 (60.4%) | 363 (39.6%) |
| Total (Overall) | 3,285 (53.0%) | 2,915 (47.0%) |
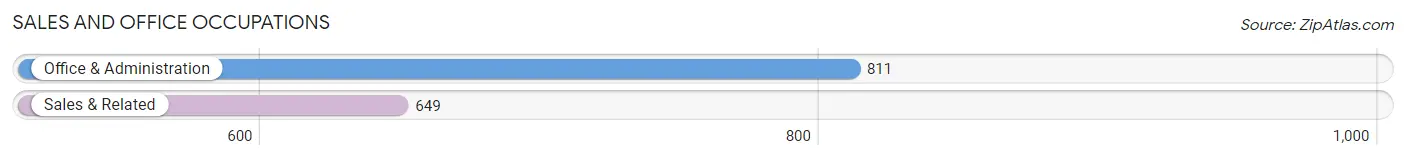
Sales and Office Occupations
The most common Sales and Office occupations in Holbrook are Office & Administration (811 | 13.1%), and Sales & Related (649 | 10.5%).
Sales and Office Occupations by Sex
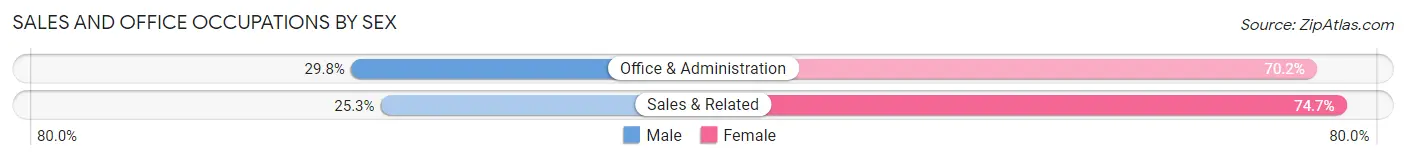
| Occupation | Male | Female |
| Sales & Related | 164 (25.3%) | 485 (74.7%) |
| Office & Administration | 242 (29.8%) | 569 (70.2%) |
| Total (Category) | 406 (27.8%) | 1,054 (72.2%) |
| Total (Overall) | 3,285 (53.0%) | 2,915 (47.0%) |
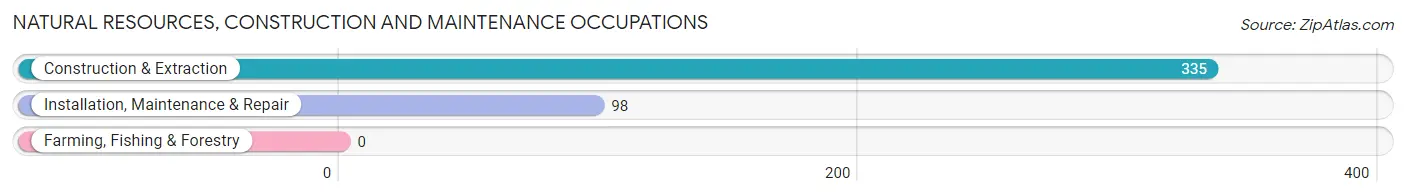
Natural Resources, Construction and Maintenance Occupations
The most common Natural Resources, Construction and Maintenance occupations in Holbrook are Construction & Extraction (335 | 5.4%), and Installation, Maintenance & Repair (98 | 1.6%).
Natural Resources, Construction and Maintenance Occupations by Sex
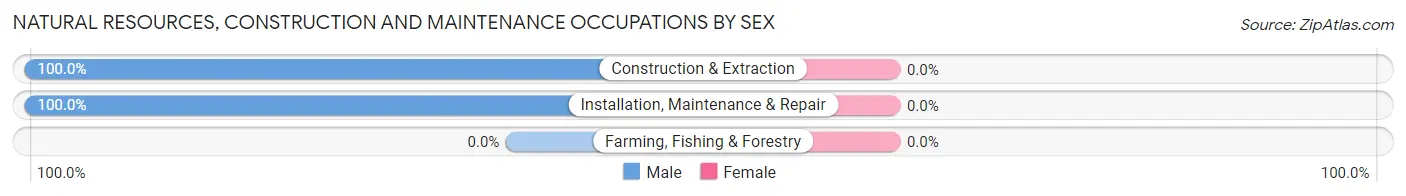
| Occupation | Male | Female |
| Farming, Fishing & Forestry | 0 (0.0%) | 0 (0.0%) |
| Construction & Extraction | 335 (100.0%) | 0 (0.0%) |
| Installation, Maintenance & Repair | 98 (100.0%) | 0 (0.0%) |
| Total (Category) | 433 (100.0%) | 0 (0.0%) |
| Total (Overall) | 3,285 (53.0%) | 2,915 (47.0%) |
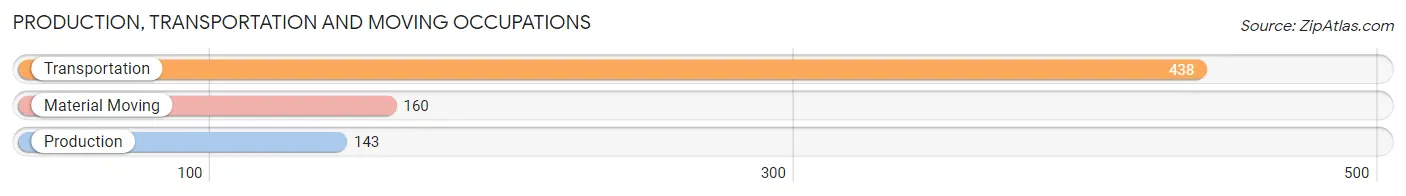
Production, Transportation and Moving Occupations
The most common Production, Transportation and Moving occupations in Holbrook are Transportation (438 | 7.1%), Material Moving (160 | 2.6%), and Production (143 | 2.3%).
Production, Transportation and Moving Occupations by Sex
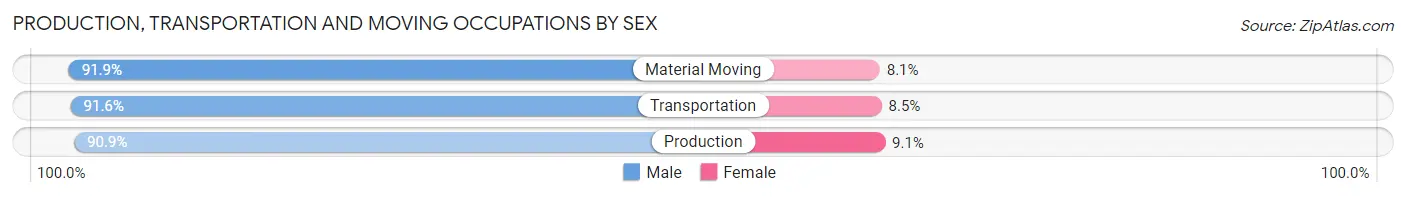
| Occupation | Male | Female |
| Production | 130 (90.9%) | 13 (9.1%) |
| Transportation | 401 (91.5%) | 37 (8.5%) |
| Material Moving | 147 (91.9%) | 13 (8.1%) |
| Total (Category) | 678 (91.5%) | 63 (8.5%) |
| Total (Overall) | 3,285 (53.0%) | 2,915 (47.0%) |
Employment Industries by Sex in Holbrook
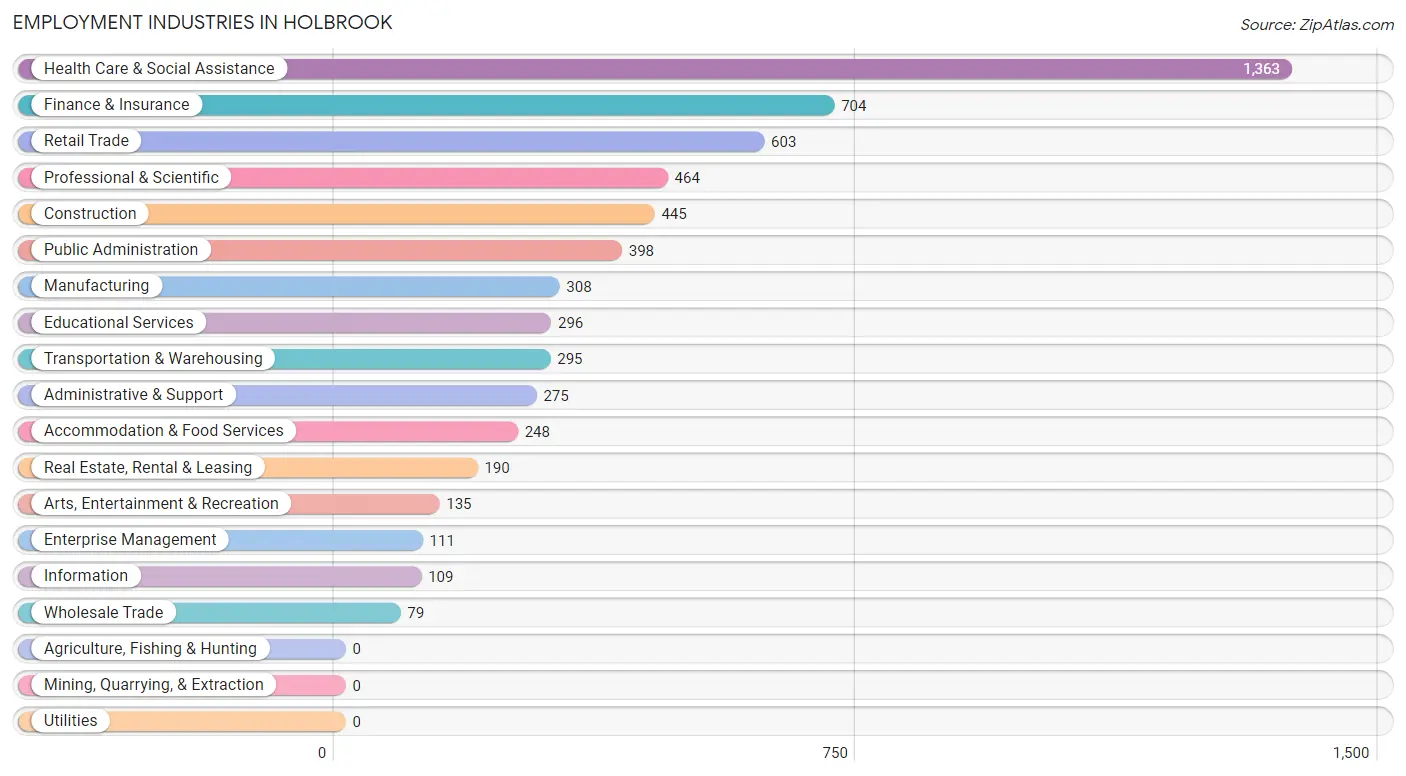
Employment Industries in Holbrook
The major employment industries in Holbrook include Health Care & Social Assistance (1,363 | 22.0%), Finance & Insurance (704 | 11.4%), Retail Trade (603 | 9.7%), Professional & Scientific (464 | 7.5%), and Construction (445 | 7.2%).
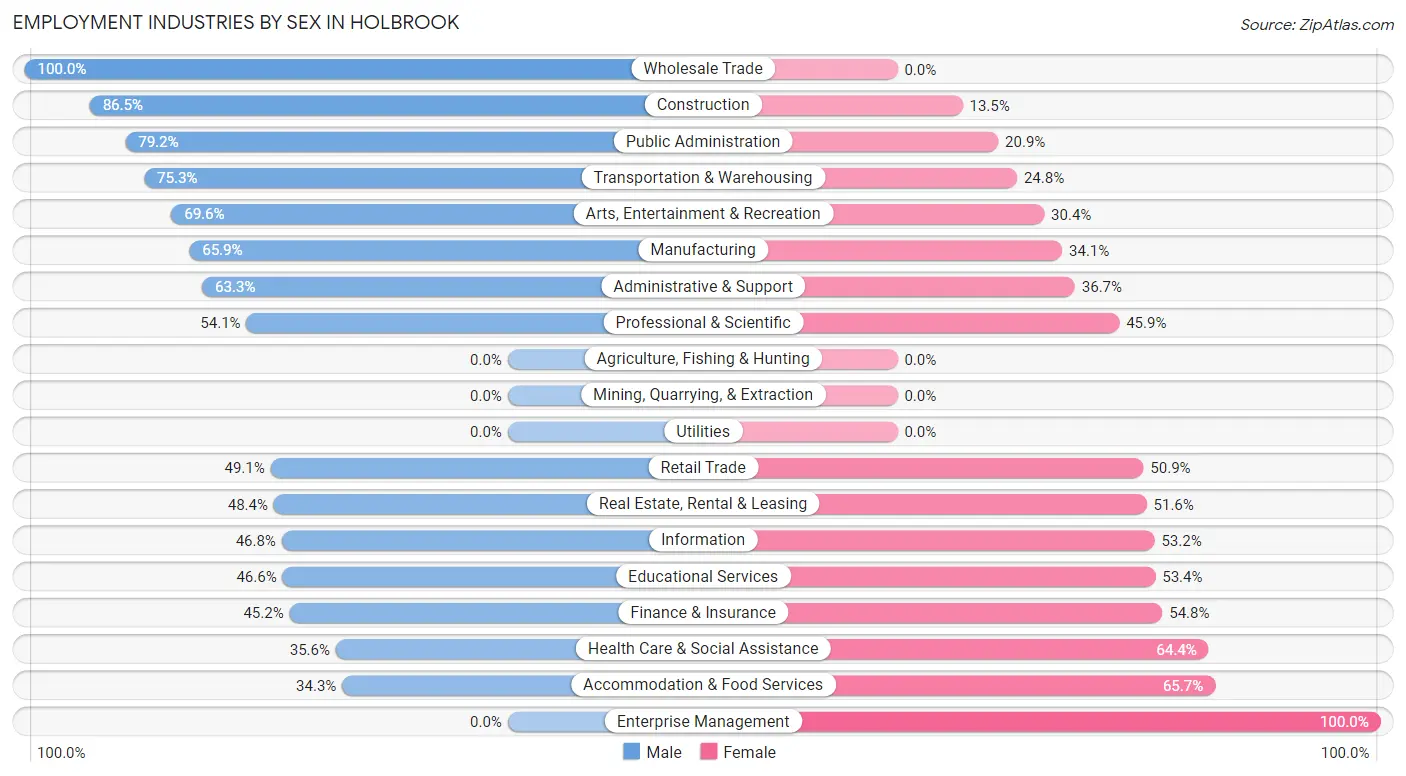
Employment Industries by Sex in Holbrook
The Holbrook industries that see more men than women are Wholesale Trade (100.0%), Construction (86.5%), and Public Administration (79.1%), whereas the industries that tend to have a higher number of women are Enterprise Management (100.0%), Accommodation & Food Services (65.7%), and Health Care & Social Assistance (64.4%).
| Industry | Male | Female |
| Agriculture, Fishing & Hunting | 0 (0.0%) | 0 (0.0%) |
| Mining, Quarrying, & Extraction | 0 (0.0%) | 0 (0.0%) |
| Construction | 385 (86.5%) | 60 (13.5%) |
| Manufacturing | 203 (65.9%) | 105 (34.1%) |
| Wholesale Trade | 79 (100.0%) | 0 (0.0%) |
| Retail Trade | 296 (49.1%) | 307 (50.9%) |
| Transportation & Warehousing | 222 (75.2%) | 73 (24.7%) |
| Utilities | 0 (0.0%) | 0 (0.0%) |
| Information | 51 (46.8%) | 58 (53.2%) |
| Finance & Insurance | 318 (45.2%) | 386 (54.8%) |
| Real Estate, Rental & Leasing | 92 (48.4%) | 98 (51.6%) |
| Professional & Scientific | 251 (54.1%) | 213 (45.9%) |
| Enterprise Management | 0 (0.0%) | 111 (100.0%) |
| Administrative & Support | 174 (63.3%) | 101 (36.7%) |
| Educational Services | 138 (46.6%) | 158 (53.4%) |
| Health Care & Social Assistance | 485 (35.6%) | 878 (64.4%) |
| Arts, Entertainment & Recreation | 94 (69.6%) | 41 (30.4%) |
| Accommodation & Food Services | 85 (34.3%) | 163 (65.7%) |
| Public Administration | 315 (79.1%) | 83 (20.8%) |
| Total | 3,285 (53.0%) | 2,915 (47.0%) |
Education in Holbrook
School Enrollment in Holbrook
The most common levels of schooling among the 2,369 students in Holbrook are middle school (830 | 35.0%), high school (626 | 26.4%), and college / undergraduate (336 | 14.2%).
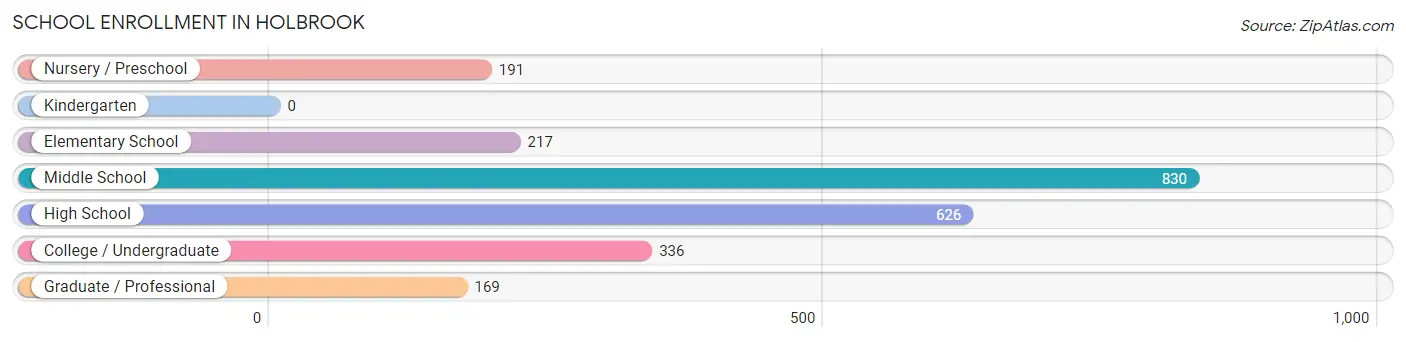
| School Level | # Students | % Students |
| Nursery / Preschool | 191 | 8.1% |
| Kindergarten | 0 | 0.0% |
| Elementary School | 217 | 9.2% |
| Middle School | 830 | 35.0% |
| High School | 626 | 26.4% |
| College / Undergraduate | 336 | 14.2% |
| Graduate / Professional | 169 | 7.1% |
| Total | 2,369 | 100.0% |
School Enrollment by Age by Funding Source in Holbrook
Out of a total of 2,369 students who are enrolled in schools in Holbrook, 445 (18.8%) attend a private institution, while the remaining 1,924 (81.2%) are enrolled in public schools. The age group of 3 to 4 year olds has the highest likelihood of being enrolled in private schools, with 85 (87.6% in the age bracket) enrolled. Conversely, the age group of 20 to 24 year olds has the lowest likelihood of being enrolled in a private school, with 93 (100.0% in the age bracket) attending a public institution.
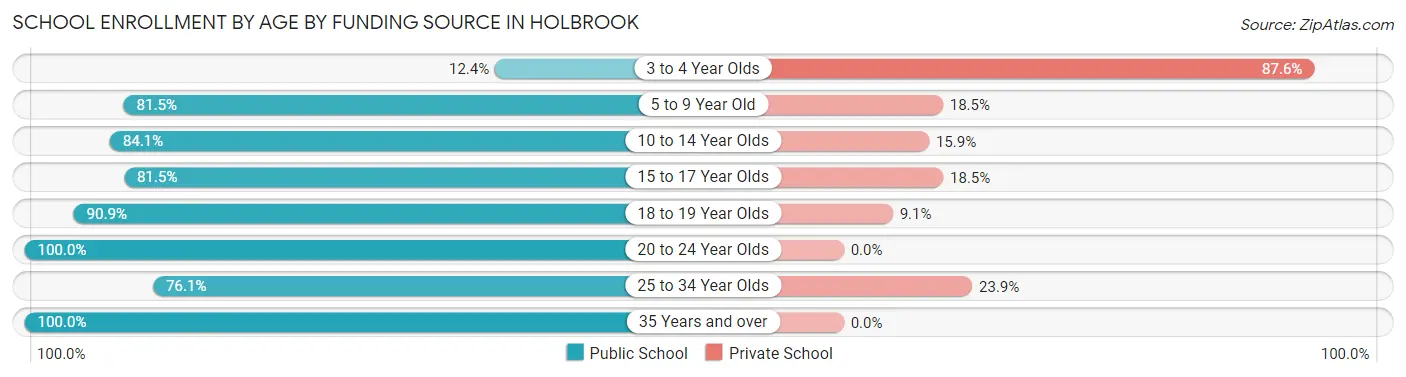
| Age Bracket | Public School | Private School |
| 3 to 4 Year Olds | 12 (12.4%) | 85 (87.6%) |
| 5 to 9 Year Old | 243 (81.5%) | 55 (18.5%) |
| 10 to 14 Year Olds | 725 (84.1%) | 137 (15.9%) |
| 15 to 17 Year Olds | 396 (81.5%) | 90 (18.5%) |
| 18 to 19 Year Olds | 179 (90.9%) | 18 (9.1%) |
| 20 to 24 Year Olds | 93 (100.0%) | 0 (0.0%) |
| 25 to 34 Year Olds | 194 (76.1%) | 61 (23.9%) |
| 35 Years and over | 81 (100.0%) | 0 (0.0%) |
| Total | 1,924 (81.2%) | 445 (18.8%) |
Educational Attainment by Field of Study in Holbrook
Business (606 | 20.5%), science & technology (369 | 12.5%), social sciences (331 | 11.2%), literature & languages (284 | 9.6%), and computers & mathematics (229 | 7.7%) are the most common fields of study among 2,960 individuals in Holbrook who have obtained a bachelor's degree or higher.
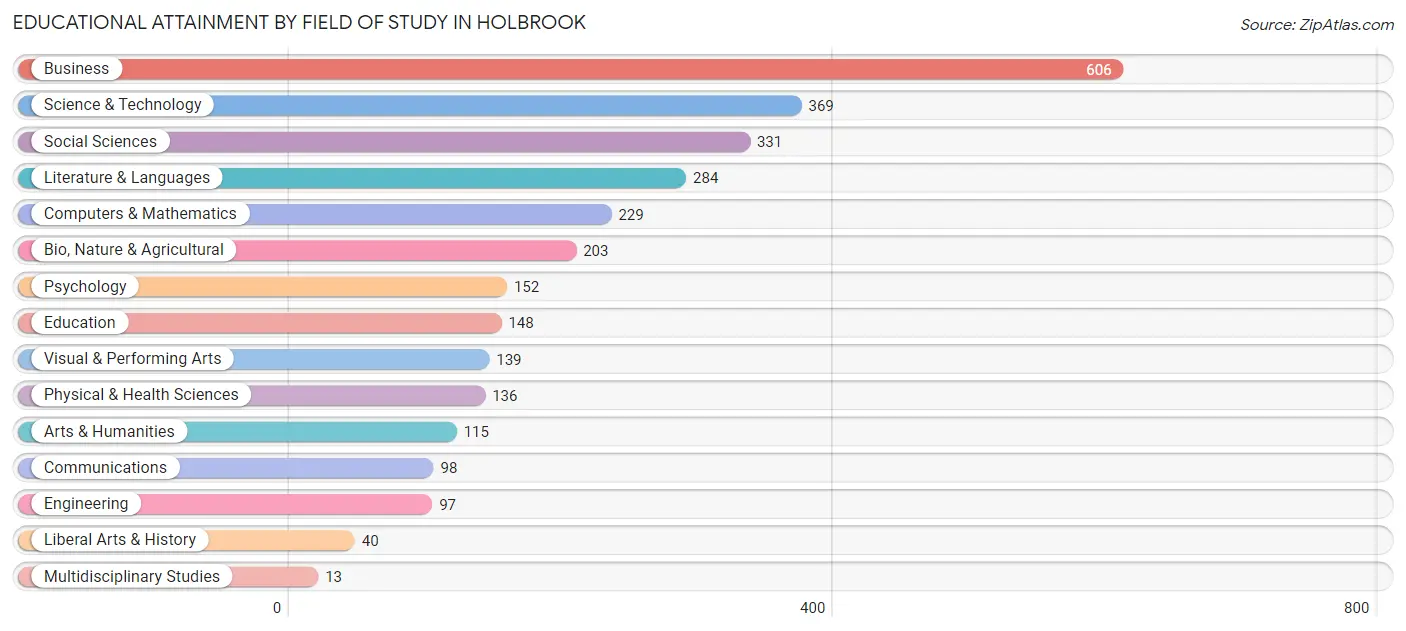
| Field of Study | # Graduates | % Graduates |
| Computers & Mathematics | 229 | 7.7% |
| Bio, Nature & Agricultural | 203 | 6.9% |
| Physical & Health Sciences | 136 | 4.6% |
| Psychology | 152 | 5.1% |
| Social Sciences | 331 | 11.2% |
| Engineering | 97 | 3.3% |
| Multidisciplinary Studies | 13 | 0.4% |
| Science & Technology | 369 | 12.5% |
| Business | 606 | 20.5% |
| Education | 148 | 5.0% |
| Literature & Languages | 284 | 9.6% |
| Liberal Arts & History | 40 | 1.3% |
| Visual & Performing Arts | 139 | 4.7% |
| Communications | 98 | 3.3% |
| Arts & Humanities | 115 | 3.9% |
| Total | 2,960 | 100.0% |
Transportation & Commute in Holbrook
Vehicle Availability by Sex in Holbrook
The most prevalent vehicle ownership categories in Holbrook are males with 2 vehicles (1,677, accounting for 53.2%) and females with 2 vehicles (1,538, making up 58.6%).
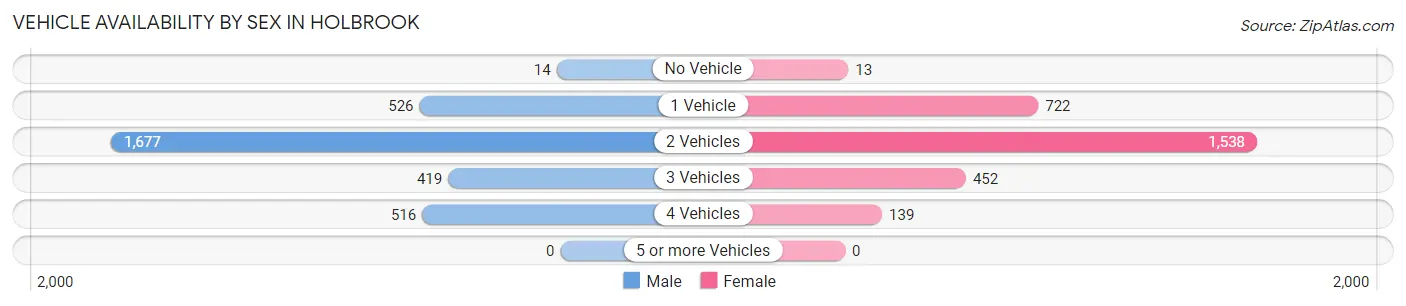
| Vehicles Available | Male | Female |
| No Vehicle | 14 (0.4%) | 13 (0.4%) |
| 1 Vehicle | 526 (16.7%) | 722 (25.2%) |
| 2 Vehicles | 1,677 (53.2%) | 1,538 (53.7%) |
| 3 Vehicles | 419 (13.3%) | 452 (15.8%) |
| 4 Vehicles | 516 (16.4%) | 139 (4.9%) |
| 5 or more Vehicles | 0 (0.0%) | 0 (0.0%) |
| Total | 3,152 (100.0%) | 2,864 (100.0%) |
Commute Time in Holbrook
The most frequently occuring commute durations in Holbrook are 60 to 89 minutes (870 commuters, 16.7%), 20 to 24 minutes (746 commuters, 14.3%), and 30 to 34 minutes (645 commuters, 12.4%).
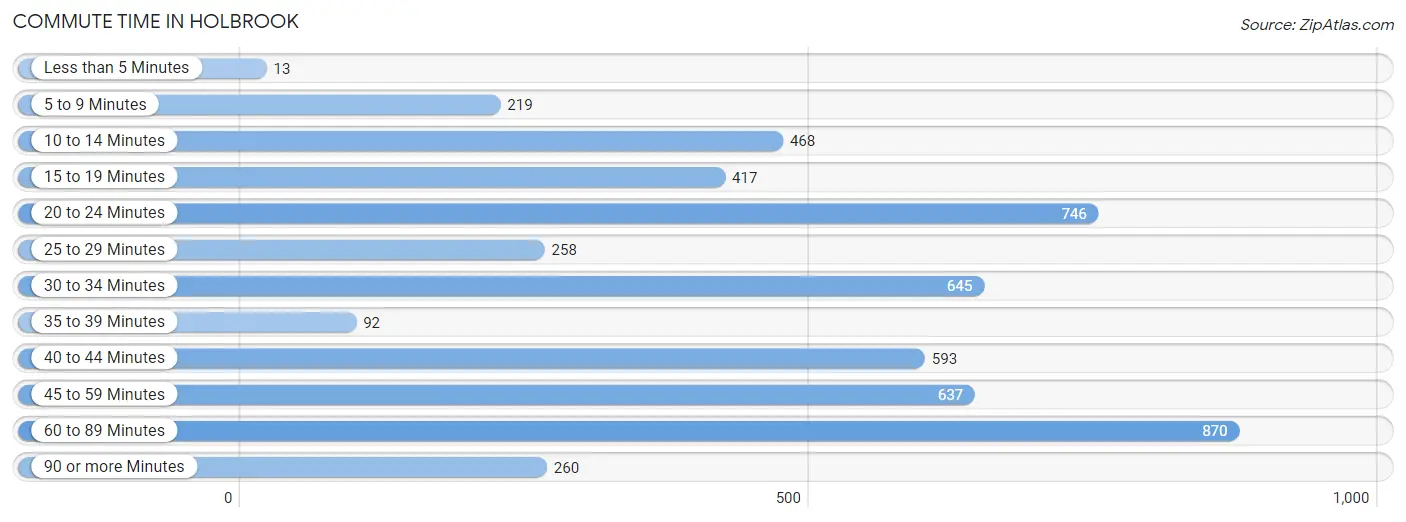
| Commute Time | # Commuters | % Commuters |
| Less than 5 Minutes | 13 | 0.3% |
| 5 to 9 Minutes | 219 | 4.2% |
| 10 to 14 Minutes | 468 | 9.0% |
| 15 to 19 Minutes | 417 | 8.0% |
| 20 to 24 Minutes | 746 | 14.3% |
| 25 to 29 Minutes | 258 | 4.9% |
| 30 to 34 Minutes | 645 | 12.4% |
| 35 to 39 Minutes | 92 | 1.8% |
| 40 to 44 Minutes | 593 | 11.4% |
| 45 to 59 Minutes | 637 | 12.2% |
| 60 to 89 Minutes | 870 | 16.7% |
| 90 or more Minutes | 260 | 5.0% |
Commute Time by Sex in Holbrook
The most common commute times in Holbrook are 60 to 89 minutes (669 commuters, 24.0%) for males and 20 to 24 minutes (627 commuters, 25.8%) for females.
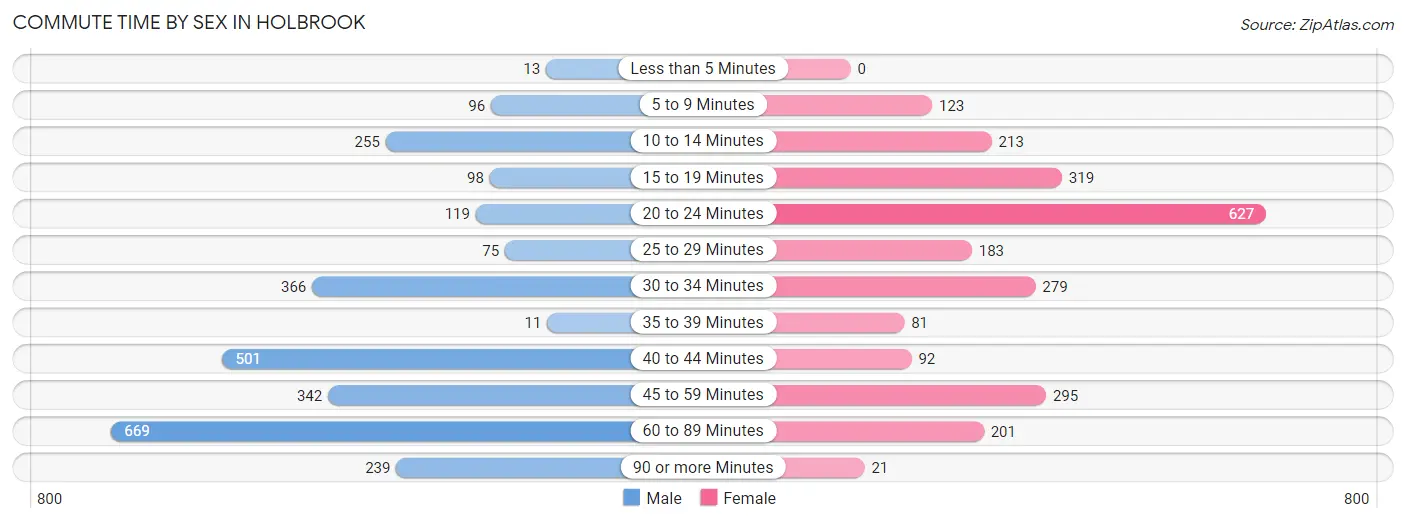
| Commute Time | Male | Female |
| Less than 5 Minutes | 13 (0.5%) | 0 (0.0%) |
| 5 to 9 Minutes | 96 (3.5%) | 123 (5.1%) |
| 10 to 14 Minutes | 255 (9.2%) | 213 (8.7%) |
| 15 to 19 Minutes | 98 (3.5%) | 319 (13.1%) |
| 20 to 24 Minutes | 119 (4.3%) | 627 (25.8%) |
| 25 to 29 Minutes | 75 (2.7%) | 183 (7.5%) |
| 30 to 34 Minutes | 366 (13.2%) | 279 (11.5%) |
| 35 to 39 Minutes | 11 (0.4%) | 81 (3.3%) |
| 40 to 44 Minutes | 501 (18.0%) | 92 (3.8%) |
| 45 to 59 Minutes | 342 (12.3%) | 295 (12.1%) |
| 60 to 89 Minutes | 669 (24.0%) | 201 (8.3%) |
| 90 or more Minutes | 239 (8.6%) | 21 (0.9%) |
Time of Departure to Work by Sex in Holbrook
The most frequent times of departure to work in Holbrook are 5:30 AM to 5:59 AM (493, 17.7%) for males and 7:00 AM to 7:29 AM (593, 24.4%) for females.
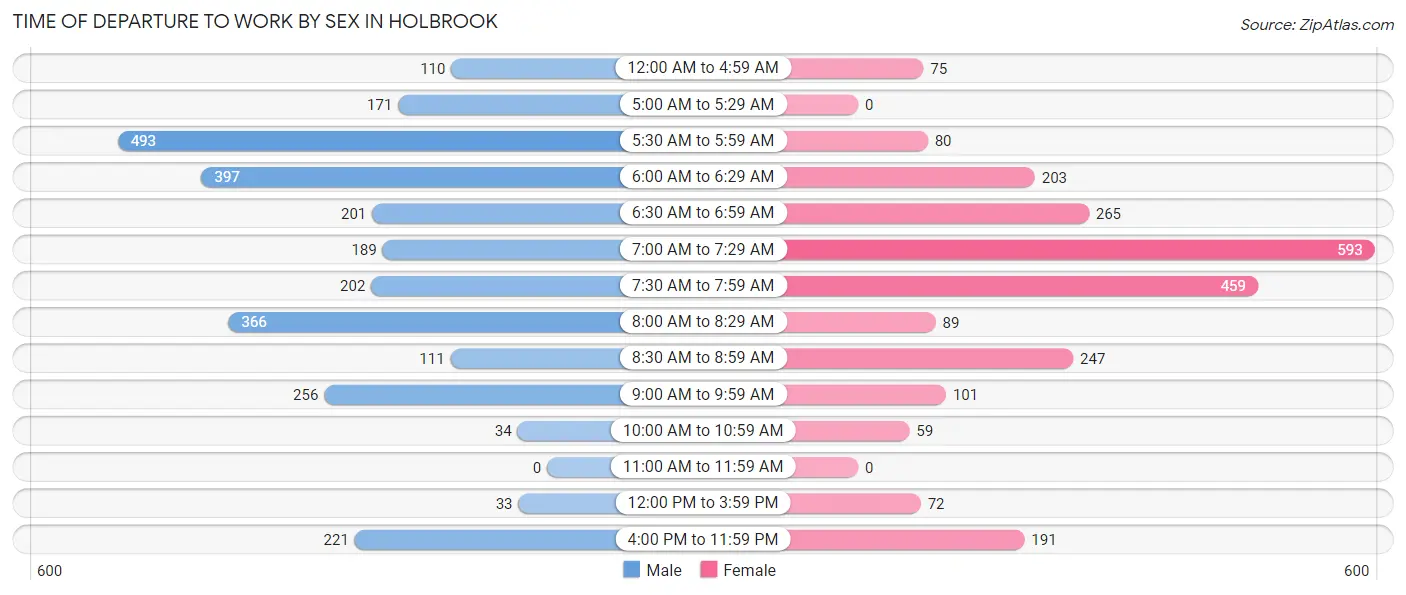
| Time of Departure | Male | Female |
| 12:00 AM to 4:59 AM | 110 (4.0%) | 75 (3.1%) |
| 5:00 AM to 5:29 AM | 171 (6.1%) | 0 (0.0%) |
| 5:30 AM to 5:59 AM | 493 (17.7%) | 80 (3.3%) |
| 6:00 AM to 6:29 AM | 397 (14.3%) | 203 (8.3%) |
| 6:30 AM to 6:59 AM | 201 (7.2%) | 265 (10.9%) |
| 7:00 AM to 7:29 AM | 189 (6.8%) | 593 (24.4%) |
| 7:30 AM to 7:59 AM | 202 (7.3%) | 459 (18.9%) |
| 8:00 AM to 8:29 AM | 366 (13.2%) | 89 (3.7%) |
| 8:30 AM to 8:59 AM | 111 (4.0%) | 247 (10.2%) |
| 9:00 AM to 9:59 AM | 256 (9.2%) | 101 (4.2%) |
| 10:00 AM to 10:59 AM | 34 (1.2%) | 59 (2.4%) |
| 11:00 AM to 11:59 AM | 0 (0.0%) | 0 (0.0%) |
| 12:00 PM to 3:59 PM | 33 (1.2%) | 72 (3.0%) |
| 4:00 PM to 11:59 PM | 221 (7.9%) | 191 (7.9%) |
| Total | 2,784 (100.0%) | 2,434 (100.0%) |
Housing Occupancy in Holbrook
Occupancy by Ownership in Holbrook
Of the total 4,615 dwellings in Holbrook, owner-occupied units account for 3,660 (79.3%), while renter-occupied units make up 955 (20.7%).
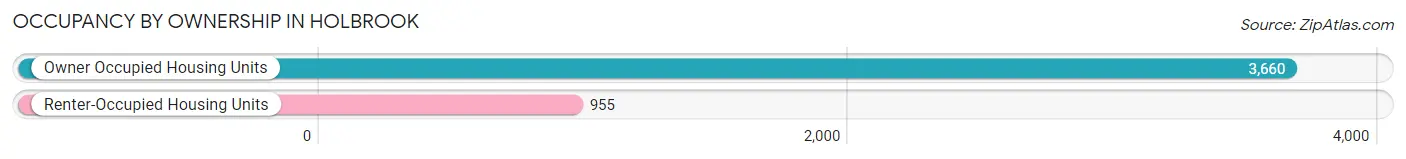
| Occupancy | # Housing Units | % Housing Units |
| Owner Occupied Housing Units | 3,660 | 79.3% |
| Renter-Occupied Housing Units | 955 | 20.7% |
| Total Occupied Housing Units | 4,615 | 100.0% |
Occupancy by Household Size in Holbrook
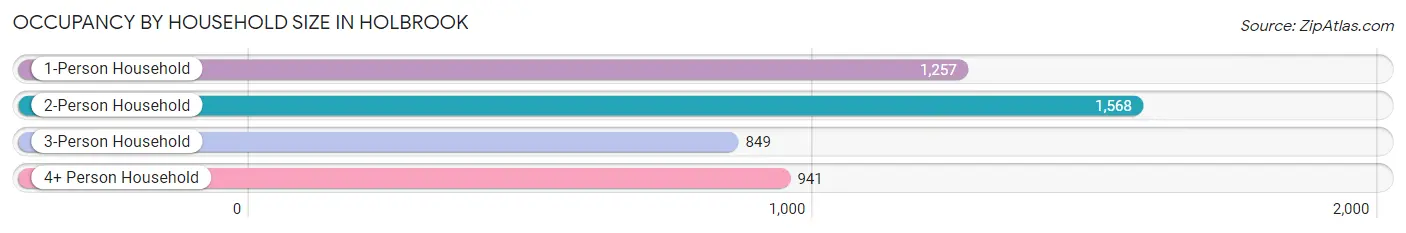
| Household Size | # Housing Units | % Housing Units |
| 1-Person Household | 1,257 | 27.2% |
| 2-Person Household | 1,568 | 34.0% |
| 3-Person Household | 849 | 18.4% |
| 4+ Person Household | 941 | 20.4% |
| Total Housing Units | 4,615 | 100.0% |
Occupancy by Ownership by Household Size in Holbrook
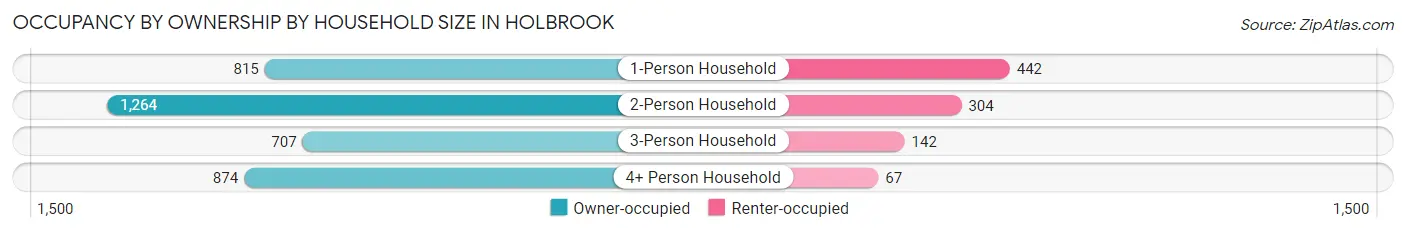
| Household Size | Owner-occupied | Renter-occupied |
| 1-Person Household | 815 (64.8%) | 442 (35.2%) |
| 2-Person Household | 1,264 (80.6%) | 304 (19.4%) |
| 3-Person Household | 707 (83.3%) | 142 (16.7%) |
| 4+ Person Household | 874 (92.9%) | 67 (7.1%) |
| Total Housing Units | 3,660 (79.3%) | 955 (20.7%) |
Occupancy by Educational Attainment in Holbrook
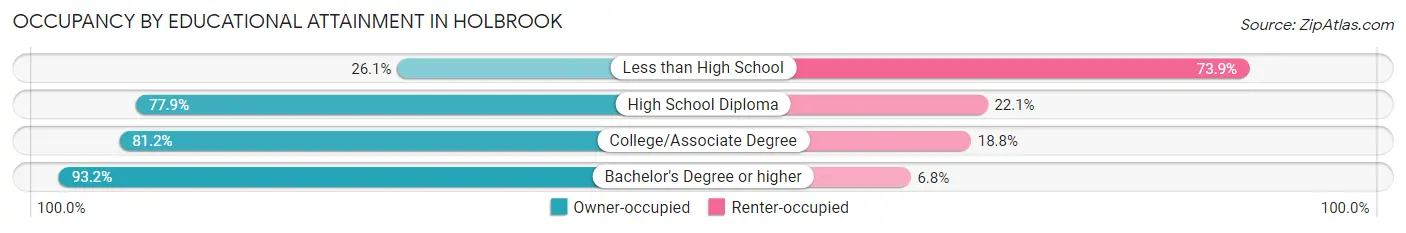
| Household Size | Owner-occupied | Renter-occupied |
| Less than High School | 106 (26.1%) | 300 (73.9%) |
| High School Diploma | 1,014 (77.9%) | 287 (22.1%) |
| College/Associate Degree | 1,156 (81.2%) | 267 (18.8%) |
| Bachelor's Degree or higher | 1,384 (93.2%) | 101 (6.8%) |
Occupancy by Age of Householder in Holbrook
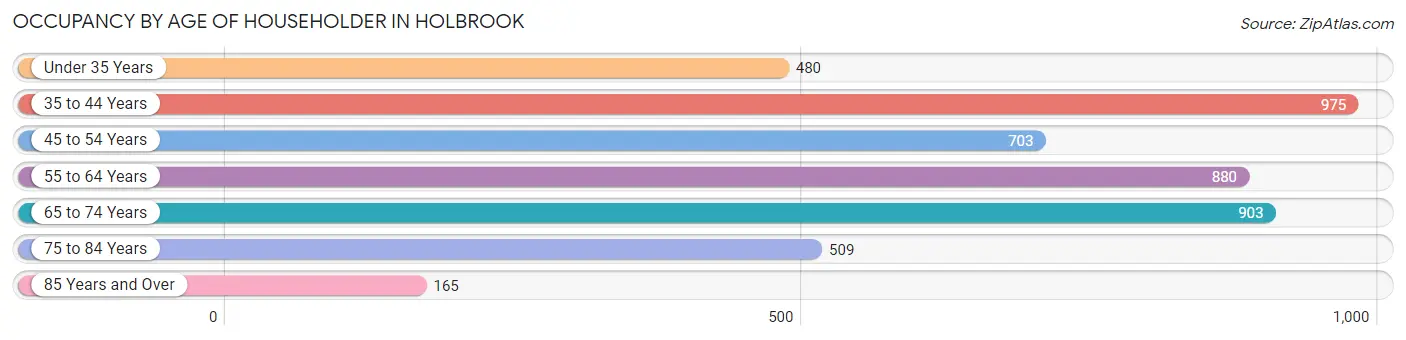
| Age Bracket | # Households | % Households |
| Under 35 Years | 480 | 10.4% |
| 35 to 44 Years | 975 | 21.1% |
| 45 to 54 Years | 703 | 15.2% |
| 55 to 64 Years | 880 | 19.1% |
| 65 to 74 Years | 903 | 19.6% |
| 75 to 84 Years | 509 | 11.0% |
| 85 Years and Over | 165 | 3.6% |
| Total | 4,615 | 100.0% |
Housing Finances in Holbrook
Median Income by Occupancy in Holbrook
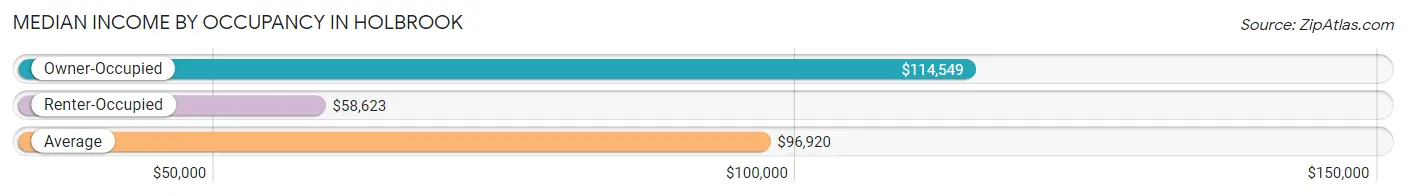
| Occupancy Type | # Households | Median Income |
| Owner-Occupied | 3,660 (79.3%) | $114,549 |
| Renter-Occupied | 955 (20.7%) | $58,623 |
| Average | 4,615 (100.0%) | $96,920 |
Occupancy by Householder Income Bracket in Holbrook
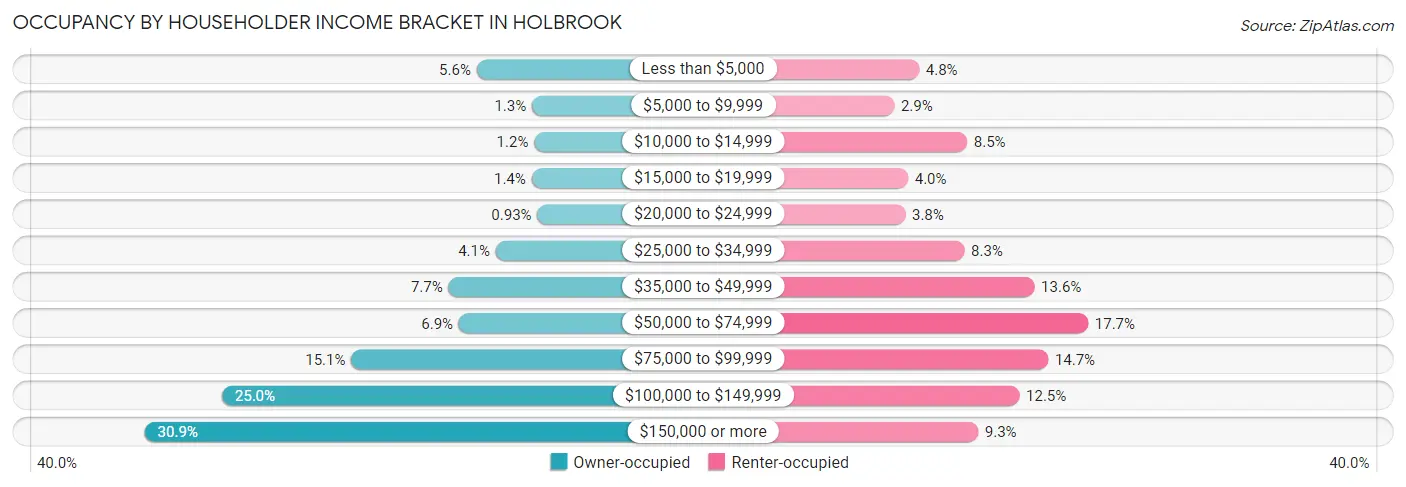
| Income Bracket | Owner-occupied | Renter-occupied |
| Less than $5,000 | 203 (5.6%) | 46 (4.8%) |
| $5,000 to $9,999 | 49 (1.3%) | 28 (2.9%) |
| $10,000 to $14,999 | 43 (1.2%) | 81 (8.5%) |
| $15,000 to $19,999 | 50 (1.4%) | 38 (4.0%) |
| $20,000 to $24,999 | 34 (0.9%) | 36 (3.8%) |
| $25,000 to $34,999 | 150 (4.1%) | 79 (8.3%) |
| $35,000 to $49,999 | 282 (7.7%) | 130 (13.6%) |
| $50,000 to $74,999 | 253 (6.9%) | 169 (17.7%) |
| $75,000 to $99,999 | 553 (15.1%) | 140 (14.7%) |
| $100,000 to $149,999 | 914 (25.0%) | 119 (12.5%) |
| $150,000 or more | 1,129 (30.8%) | 89 (9.3%) |
| Total | 3,660 (100.0%) | 955 (100.0%) |
Monthly Housing Cost Tiers in Holbrook
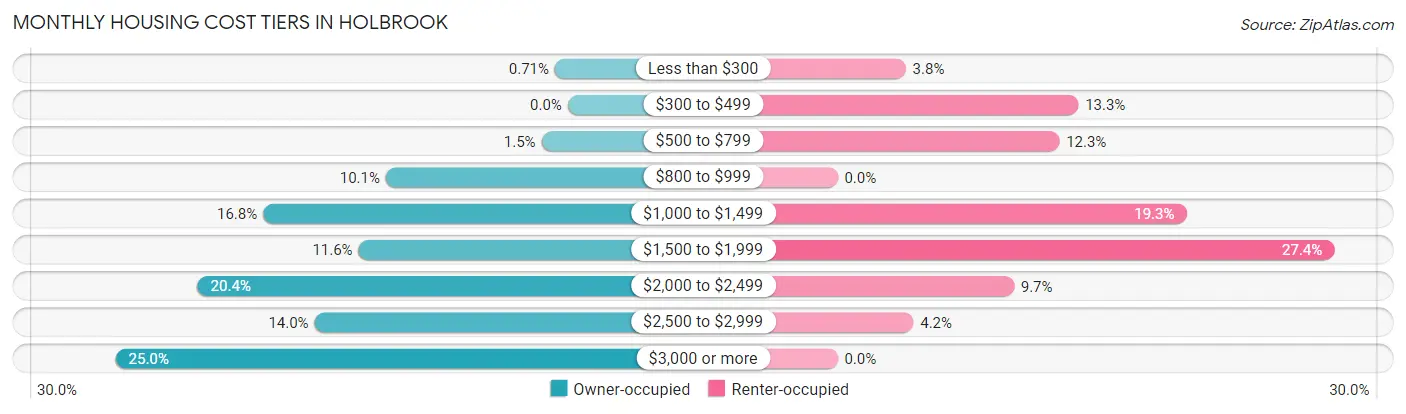
| Monthly Cost | Owner-occupied | Renter-occupied |
| Less than $300 | 26 (0.7%) | 36 (3.8%) |
| $300 to $499 | 0 (0.0%) | 127 (13.3%) |
| $500 to $799 | 53 (1.5%) | 117 (12.2%) |
| $800 to $999 | 368 (10.1%) | 0 (0.0%) |
| $1,000 to $1,499 | 616 (16.8%) | 184 (19.3%) |
| $1,500 to $1,999 | 423 (11.6%) | 262 (27.4%) |
| $2,000 to $2,499 | 748 (20.4%) | 93 (9.7%) |
| $2,500 to $2,999 | 512 (14.0%) | 40 (4.2%) |
| $3,000 or more | 914 (25.0%) | 0 (0.0%) |
| Total | 3,660 (100.0%) | 955 (100.0%) |
Physical Housing Characteristics in Holbrook
Housing Structures in Holbrook
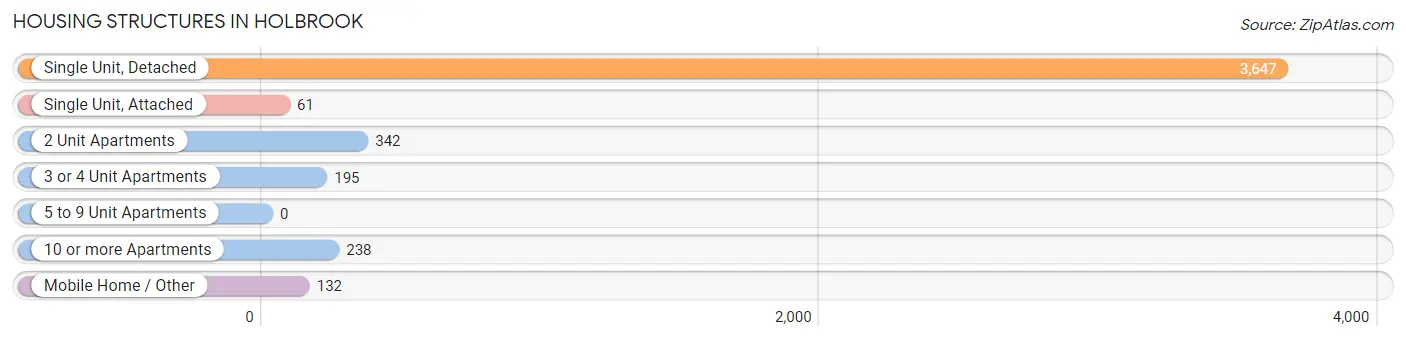
| Structure Type | # Housing Units | % Housing Units |
| Single Unit, Detached | 3,647 | 79.0% |
| Single Unit, Attached | 61 | 1.3% |
| 2 Unit Apartments | 342 | 7.4% |
| 3 or 4 Unit Apartments | 195 | 4.2% |
| 5 to 9 Unit Apartments | 0 | 0.0% |
| 10 or more Apartments | 238 | 5.2% |
| Mobile Home / Other | 132 | 2.9% |
| Total | 4,615 | 100.0% |
Housing Structures by Occupancy in Holbrook
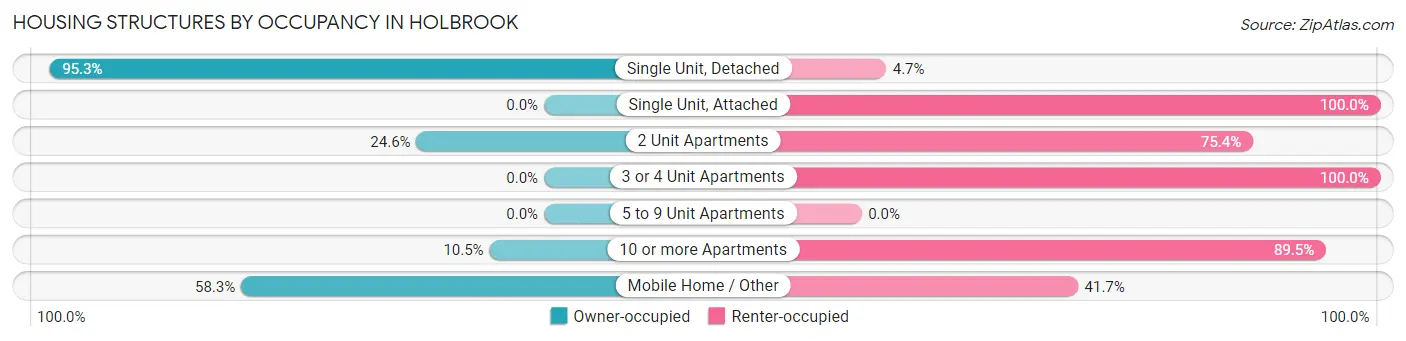
| Structure Type | Owner-occupied | Renter-occupied |
| Single Unit, Detached | 3,474 (95.3%) | 173 (4.7%) |
| Single Unit, Attached | 0 (0.0%) | 61 (100.0%) |
| 2 Unit Apartments | 84 (24.6%) | 258 (75.4%) |
| 3 or 4 Unit Apartments | 0 (0.0%) | 195 (100.0%) |
| 5 to 9 Unit Apartments | 0 (0.0%) | 0 (0.0%) |
| 10 or more Apartments | 25 (10.5%) | 213 (89.5%) |
| Mobile Home / Other | 77 (58.3%) | 55 (41.7%) |
| Total | 3,660 (79.3%) | 955 (20.7%) |
Housing Structures by Number of Rooms in Holbrook
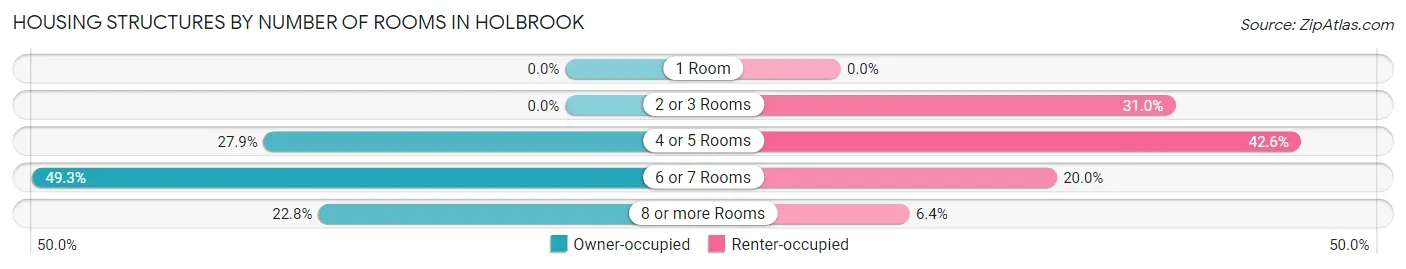
| Number of Rooms | Owner-occupied | Renter-occupied |
| 1 Room | 0 (0.0%) | 0 (0.0%) |
| 2 or 3 Rooms | 0 (0.0%) | 296 (31.0%) |
| 4 or 5 Rooms | 1,021 (27.9%) | 407 (42.6%) |
| 6 or 7 Rooms | 1,803 (49.3%) | 191 (20.0%) |
| 8 or more Rooms | 836 (22.8%) | 61 (6.4%) |
| Total | 3,660 (100.0%) | 955 (100.0%) |
Housing Structure by Heating Type in Holbrook
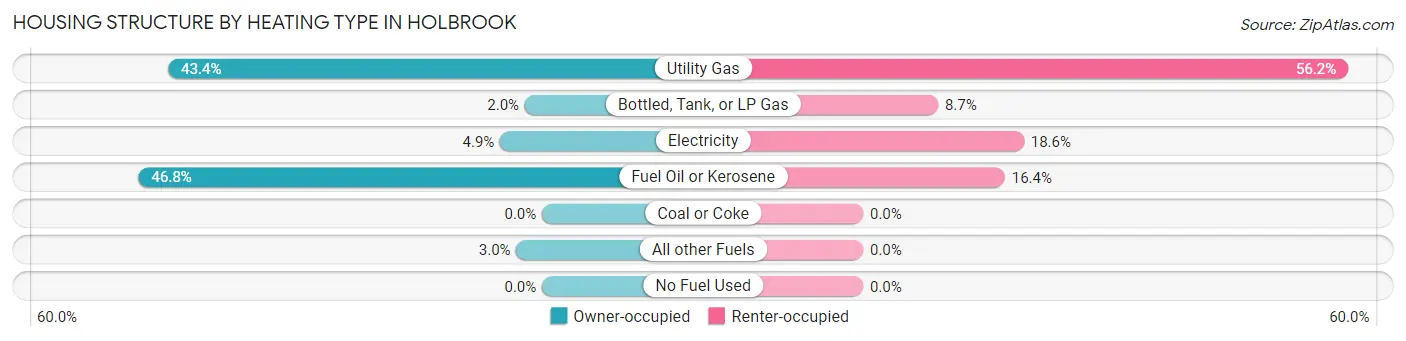
| Heating Type | Owner-occupied | Renter-occupied |
| Utility Gas | 1,587 (43.4%) | 537 (56.2%) |
| Bottled, Tank, or LP Gas | 73 (2.0%) | 83 (8.7%) |
| Electricity | 178 (4.9%) | 178 (18.6%) |
| Fuel Oil or Kerosene | 1,713 (46.8%) | 157 (16.4%) |
| Coal or Coke | 0 (0.0%) | 0 (0.0%) |
| All other Fuels | 109 (3.0%) | 0 (0.0%) |
| No Fuel Used | 0 (0.0%) | 0 (0.0%) |
| Total | 3,660 (100.0%) | 955 (100.0%) |
Household Vehicle Usage in Holbrook
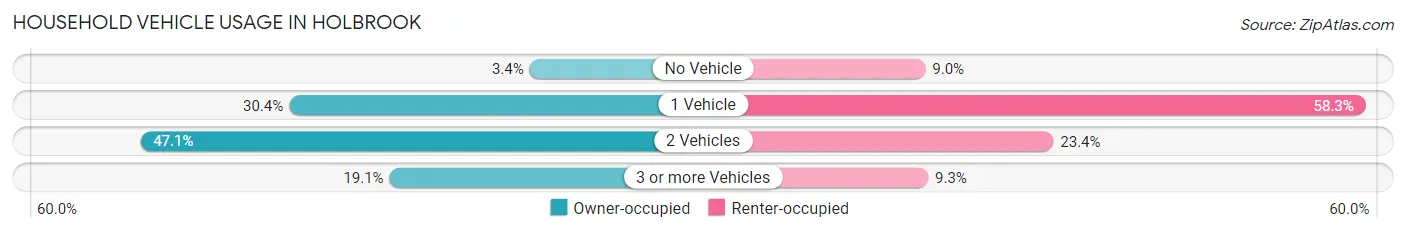
| Vehicles per Household | Owner-occupied | Renter-occupied |
| No Vehicle | 126 (3.4%) | 86 (9.0%) |
| 1 Vehicle | 1,112 (30.4%) | 557 (58.3%) |
| 2 Vehicles | 1,722 (47.0%) | 223 (23.4%) |
| 3 or more Vehicles | 700 (19.1%) | 89 (9.3%) |
| Total | 3,660 (100.0%) | 955 (100.0%) |
Real Estate & Mortgages in Holbrook
Real Estate and Mortgage Overview in Holbrook
| Characteristic | Without Mortgage | With Mortgage |
| Housing Units | 922 | 2,738 |
| Median Property Value | $380,800 | $413,000 |
| Median Household Income | $73,750 | $936 |
| Monthly Housing Costs | $1,049 | $914 |
| Real Estate Taxes | $6,254 | $0 |
Property Value by Mortgage Status in Holbrook
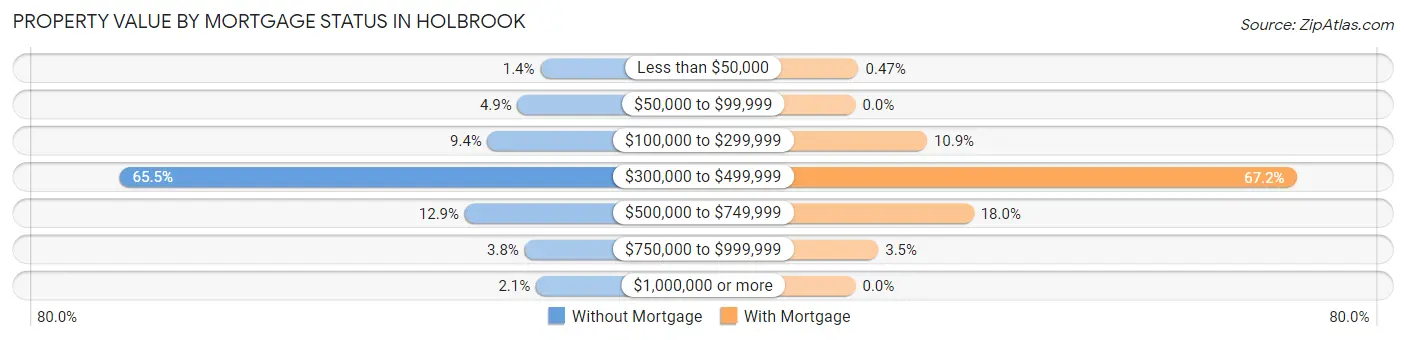
| Property Value | Without Mortgage | With Mortgage |
| Less than $50,000 | 13 (1.4%) | 13 (0.5%) |
| $50,000 to $99,999 | 45 (4.9%) | 0 (0.0%) |
| $100,000 to $299,999 | 87 (9.4%) | 298 (10.9%) |
| $300,000 to $499,999 | 604 (65.5%) | 1,839 (67.2%) |
| $500,000 to $749,999 | 119 (12.9%) | 493 (18.0%) |
| $750,000 to $999,999 | 35 (3.8%) | 95 (3.5%) |
| $1,000,000 or more | 19 (2.1%) | 0 (0.0%) |
| Total | 922 (100.0%) | 2,738 (100.0%) |
Household Income by Mortgage Status in Holbrook
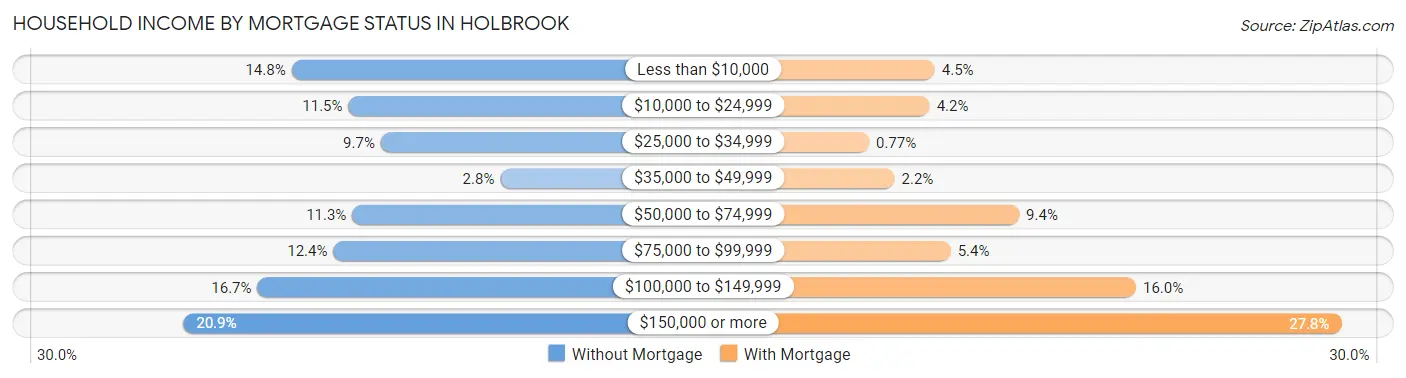
| Household Income | Without Mortgage | With Mortgage |
| Less than $10,000 | 136 (14.7%) | 124 (4.5%) |
| $10,000 to $24,999 | 106 (11.5%) | 116 (4.2%) |
| $25,000 to $34,999 | 89 (9.7%) | 21 (0.8%) |
| $35,000 to $49,999 | 26 (2.8%) | 61 (2.2%) |
| $50,000 to $74,999 | 104 (11.3%) | 256 (9.3%) |
| $75,000 to $99,999 | 114 (12.4%) | 149 (5.4%) |
| $100,000 to $149,999 | 154 (16.7%) | 439 (16.0%) |
| $150,000 or more | 193 (20.9%) | 760 (27.8%) |
| Total | 922 (100.0%) | 2,738 (100.0%) |
Property Value to Household Income Ratio in Holbrook
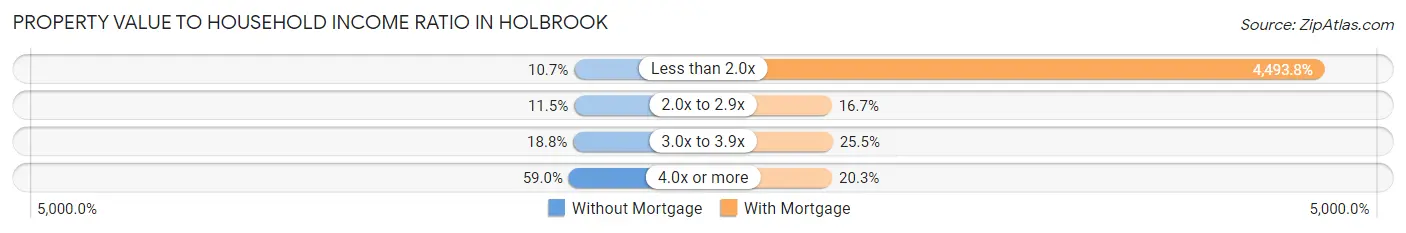
| Value-to-Income Ratio | Without Mortgage | With Mortgage |
| Less than 2.0x | 99 (10.7%) | 123,039 (4,493.8%) |
| 2.0x to 2.9x | 106 (11.5%) | 456 (16.7%) |
| 3.0x to 3.9x | 173 (18.8%) | 697 (25.5%) |
| 4.0x or more | 544 (59.0%) | 555 (20.3%) |
| Total | 922 (100.0%) | 2,738 (100.0%) |
Real Estate Taxes by Mortgage Status in Holbrook
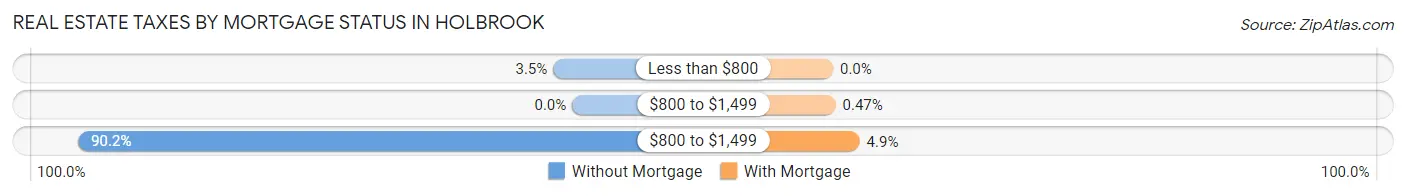
| Property Taxes | Without Mortgage | With Mortgage |
| Less than $800 | 32 (3.5%) | 0 (0.0%) |
| $800 to $1,499 | 0 (0.0%) | 13 (0.5%) |
| $800 to $1,499 | 832 (90.2%) | 133 (4.9%) |
| Total | 922 (100.0%) | 2,738 (100.0%) |
Health & Disability in Holbrook
Health Insurance Coverage by Age in Holbrook
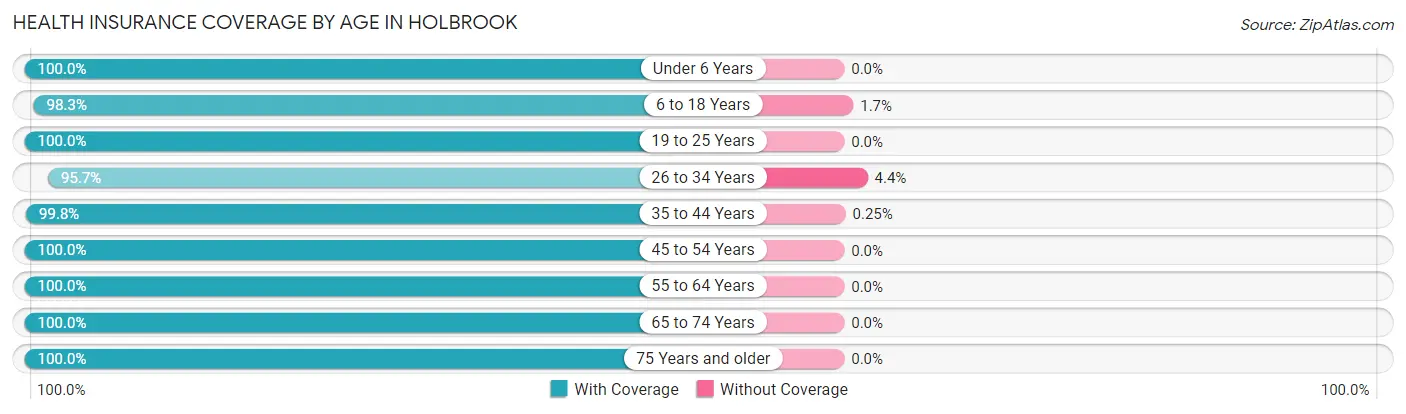
| Age Bracket | With Coverage | Without Coverage |
| Under 6 Years | 672 (100.0%) | 0 (0.0%) |
| 6 to 18 Years | 1,642 (98.3%) | 28 (1.7%) |
| 19 to 25 Years | 511 (100.0%) | 0 (0.0%) |
| 26 to 34 Years | 1,385 (95.7%) | 63 (4.3%) |
| 35 to 44 Years | 1,600 (99.8%) | 4 (0.3%) |
| 45 to 54 Years | 1,394 (100.0%) | 0 (0.0%) |
| 55 to 64 Years | 1,665 (100.0%) | 0 (0.0%) |
| 65 to 74 Years | 1,512 (100.0%) | 0 (0.0%) |
| 75 Years and older | 835 (100.0%) | 0 (0.0%) |
| Total | 11,216 (99.2%) | 95 (0.8%) |
Health Insurance Coverage by Citizenship Status in Holbrook
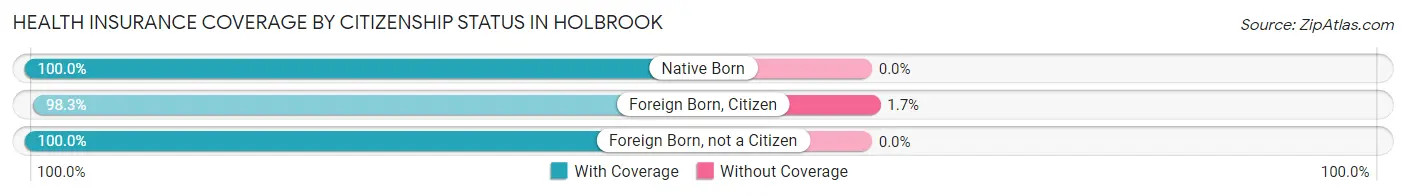
| Citizenship Status | With Coverage | Without Coverage |
| Native Born | 672 (100.0%) | 0 (0.0%) |
| Foreign Born, Citizen | 1,642 (98.3%) | 28 (1.7%) |
| Foreign Born, not a Citizen | 511 (100.0%) | 0 (0.0%) |
Health Insurance Coverage by Household Income in Holbrook
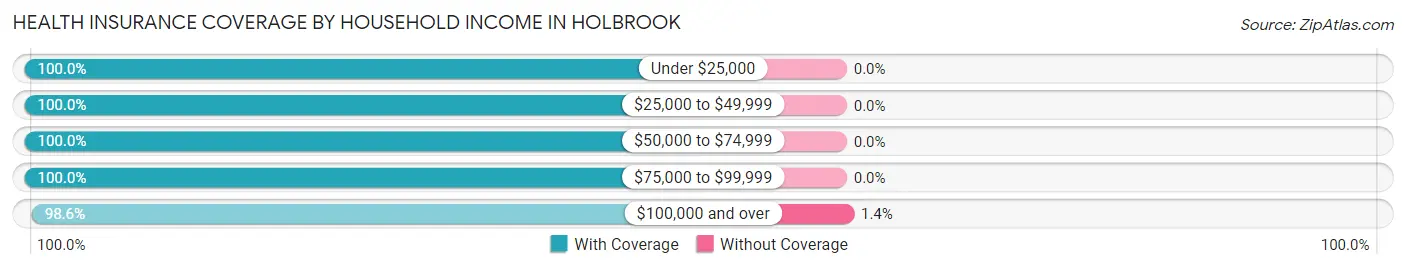
| Household Income | With Coverage | Without Coverage |
| Under $25,000 | 786 (100.0%) | 0 (0.0%) |
| $25,000 to $49,999 | 1,311 (100.0%) | 0 (0.0%) |
| $50,000 to $74,999 | 912 (100.0%) | 0 (0.0%) |
| $75,000 to $99,999 | 1,592 (100.0%) | 0 (0.0%) |
| $100,000 and over | 6,584 (98.6%) | 91 (1.4%) |
Public vs Private Health Insurance Coverage by Age in Holbrook
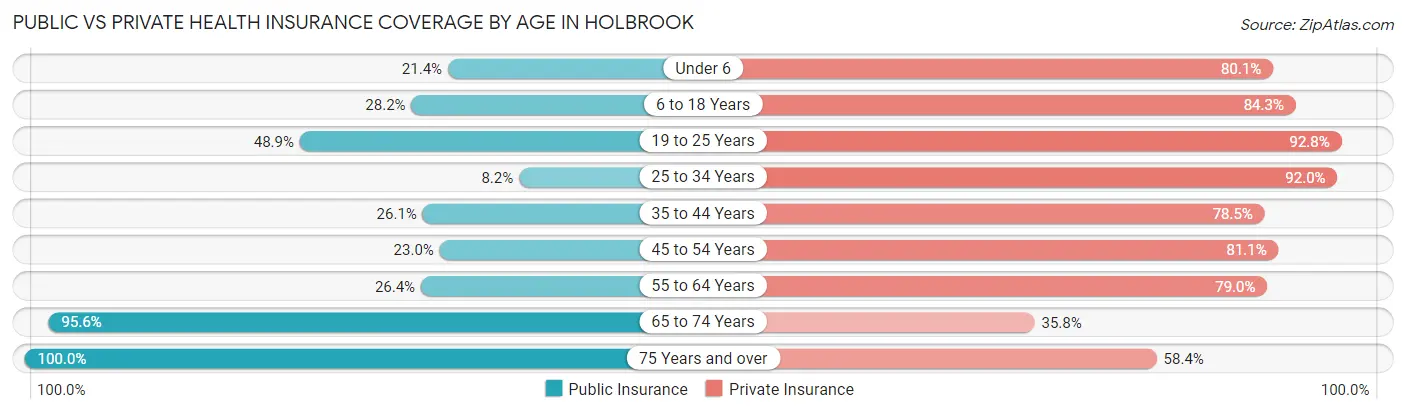
| Age Bracket | Public Insurance | Private Insurance |
| Under 6 | 144 (21.4%) | 538 (80.1%) |
| 6 to 18 Years | 471 (28.2%) | 1,407 (84.3%) |
| 19 to 25 Years | 250 (48.9%) | 474 (92.8%) |
| 25 to 34 Years | 119 (8.2%) | 1,332 (92.0%) |
| 35 to 44 Years | 419 (26.1%) | 1,259 (78.5%) |
| 45 to 54 Years | 320 (23.0%) | 1,130 (81.1%) |
| 55 to 64 Years | 440 (26.4%) | 1,315 (79.0%) |
| 65 to 74 Years | 1,445 (95.6%) | 541 (35.8%) |
| 75 Years and over | 835 (100.0%) | 488 (58.4%) |
| Total | 4,443 (39.3%) | 8,484 (75.0%) |
Disability Status by Sex by Age in Holbrook
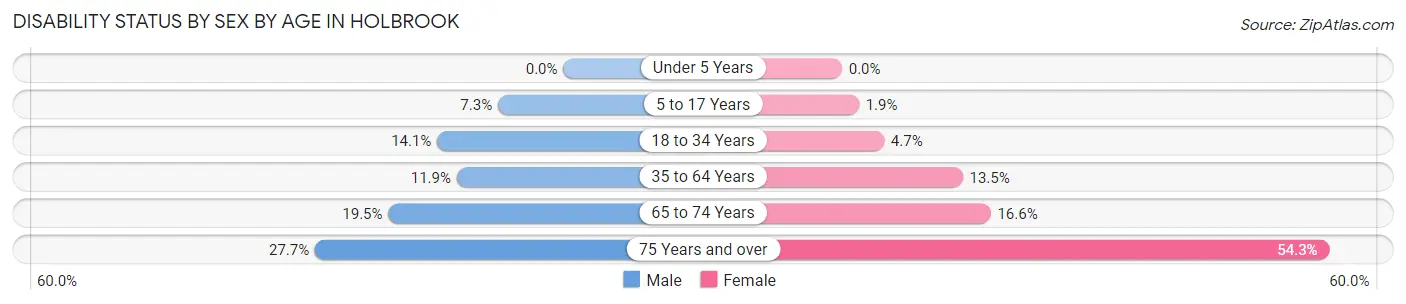
| Age Bracket | Male | Female |
| Under 5 Years | 0 (0.0%) | 0 (0.0%) |
| 5 to 17 Years | 59 (7.3%) | 17 (1.9%) |
| 18 to 34 Years | 135 (14.1%) | 51 (4.7%) |
| 35 to 64 Years | 287 (11.9%) | 302 (13.5%) |
| 65 to 74 Years | 144 (19.5%) | 128 (16.6%) |
| 75 Years and over | 99 (27.7%) | 259 (54.3%) |
Disability Class by Sex by Age in Holbrook
Disability Class: Hearing Difficulty
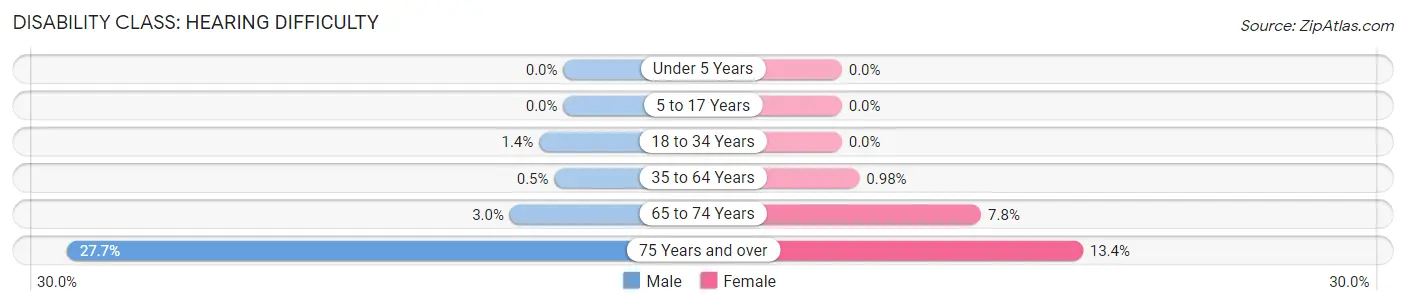
| Age Bracket | Male | Female |
| Under 5 Years | 0 (0.0%) | 0 (0.0%) |
| 5 to 17 Years | 0 (0.0%) | 0 (0.0%) |
| 18 to 34 Years | 13 (1.3%) | 0 (0.0%) |
| 35 to 64 Years | 12 (0.5%) | 22 (1.0%) |
| 65 to 74 Years | 22 (3.0%) | 60 (7.8%) |
| 75 Years and over | 99 (27.7%) | 64 (13.4%) |
Disability Class: Vision Difficulty
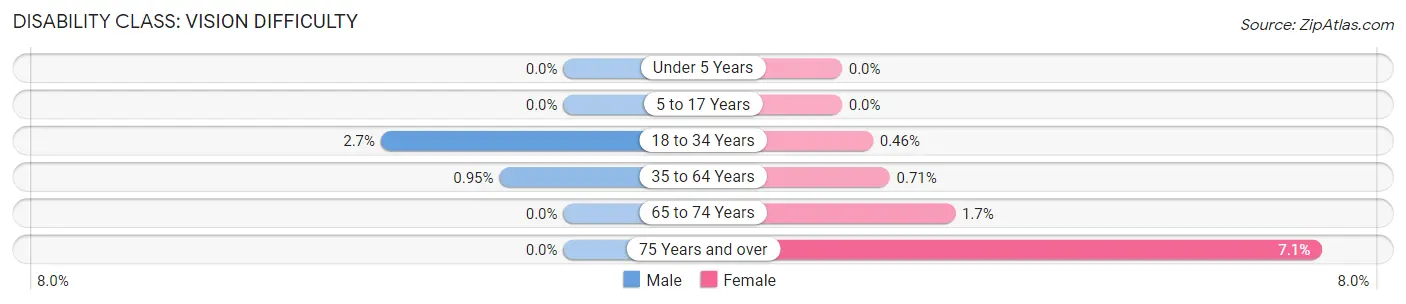
| Age Bracket | Male | Female |
| Under 5 Years | 0 (0.0%) | 0 (0.0%) |
| 5 to 17 Years | 0 (0.0%) | 0 (0.0%) |
| 18 to 34 Years | 26 (2.7%) | 5 (0.5%) |
| 35 to 64 Years | 23 (0.9%) | 16 (0.7%) |
| 65 to 74 Years | 0 (0.0%) | 13 (1.7%) |
| 75 Years and over | 0 (0.0%) | 34 (7.1%) |
Disability Class: Cognitive Difficulty
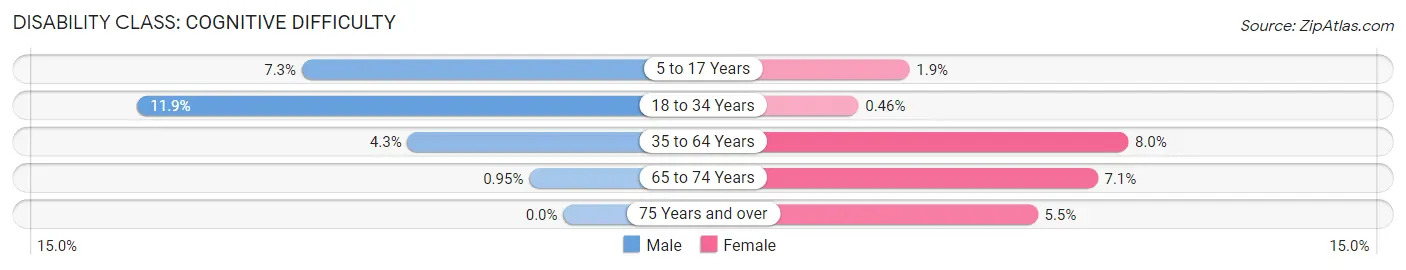
| Age Bracket | Male | Female |
| 5 to 17 Years | 59 (7.3%) | 17 (1.9%) |
| 18 to 34 Years | 114 (11.9%) | 5 (0.5%) |
| 35 to 64 Years | 105 (4.3%) | 179 (8.0%) |
| 65 to 74 Years | 7 (0.9%) | 55 (7.1%) |
| 75 Years and over | 0 (0.0%) | 26 (5.4%) |
Disability Class: Ambulatory Difficulty
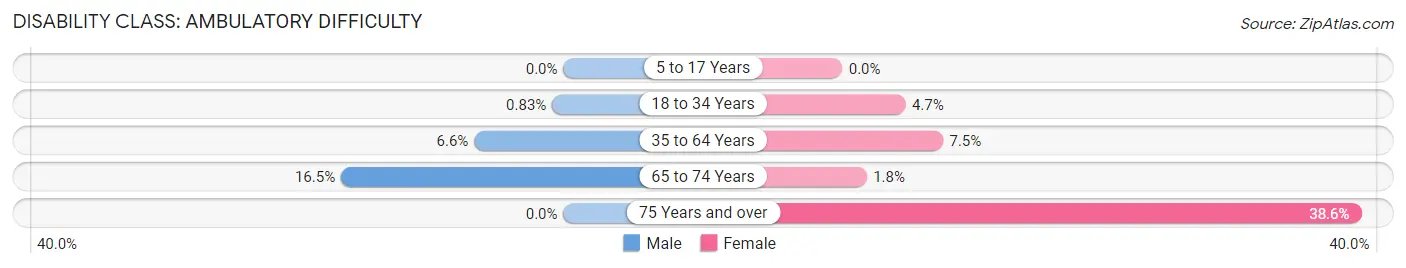
| Age Bracket | Male | Female |
| 5 to 17 Years | 0 (0.0%) | 0 (0.0%) |
| 18 to 34 Years | 8 (0.8%) | 51 (4.7%) |
| 35 to 64 Years | 160 (6.6%) | 168 (7.5%) |
| 65 to 74 Years | 122 (16.5%) | 14 (1.8%) |
| 75 Years and over | 0 (0.0%) | 184 (38.6%) |
Disability Class: Self-Care Difficulty
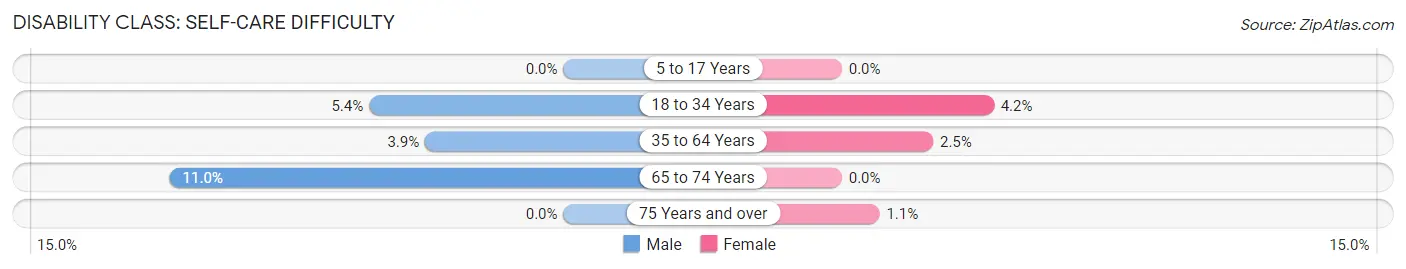
| Age Bracket | Male | Female |
| 5 to 17 Years | 0 (0.0%) | 0 (0.0%) |
| 18 to 34 Years | 52 (5.4%) | 46 (4.2%) |
| 35 to 64 Years | 93 (3.8%) | 57 (2.5%) |
| 65 to 74 Years | 81 (11.0%) | 0 (0.0%) |
| 75 Years and over | 0 (0.0%) | 5 (1.1%) |
Technology Access in Holbrook
Computing Device Access in Holbrook
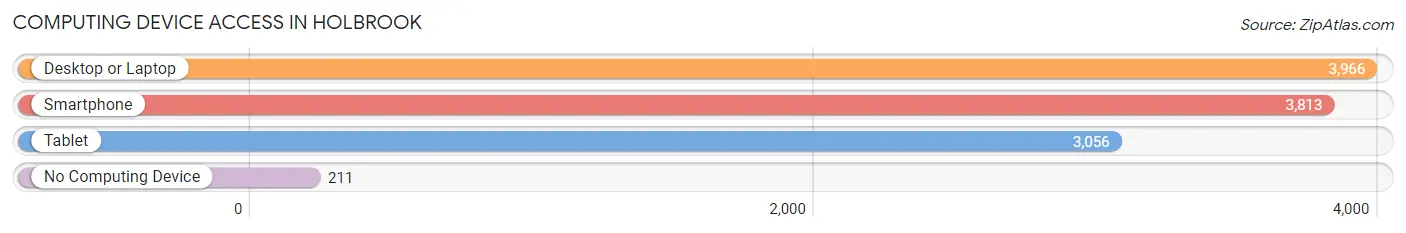
| Device Type | # Households | % Households |
| Desktop or Laptop | 3,966 | 85.9% |
| Smartphone | 3,813 | 82.6% |
| Tablet | 3,056 | 66.2% |
| No Computing Device | 211 | 4.6% |
| Total | 4,615 | 100.0% |
Internet Access in Holbrook
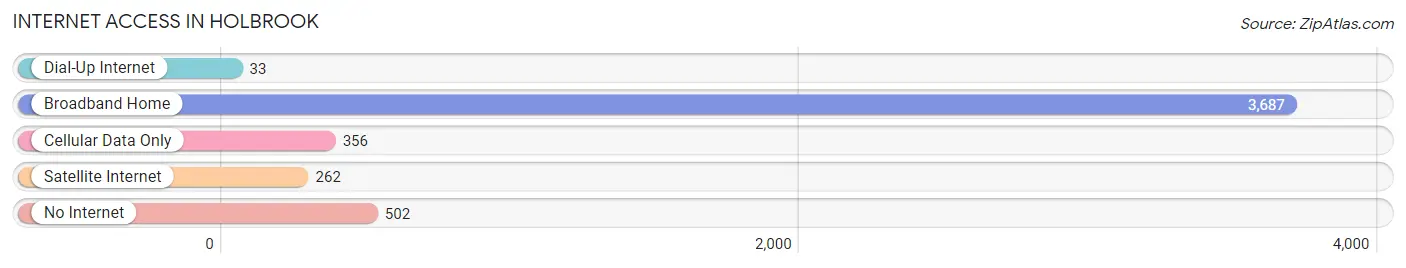
| Internet Type | # Households | % Households |
| Dial-Up Internet | 33 | 0.7% |
| Broadband Home | 3,687 | 79.9% |
| Cellular Data Only | 356 | 7.7% |
| Satellite Internet | 262 | 5.7% |
| No Internet | 502 | 10.9% |
| Total | 4,615 | 100.0% |
Holbrook Summary
Holbrook, Massachusetts is a small town located in Norfolk County, approximately 20 miles south of Boston. It is bordered by the towns of Randolph, Avon, Braintree, Weymouth, and Abington. The town has a population of 10,791, according to the 2010 census.
History
Holbrook was first settled in 1649 by a group of settlers from Weymouth. The town was originally part of the town of Braintree, and was known as East Braintree. In 1872, the town was officially incorporated as Holbrook, named after the Holbrook family who had been living in the area since the 1600s.
The town was primarily an agricultural community until the mid-1800s, when the Boston and Providence Railroad was built through the town. This allowed for the development of industry in the area, and the town began to grow. By the early 1900s, Holbrook had become a popular summer resort destination, with many wealthy Bostonians building summer homes in the area.
Geography
Holbrook is located in the southeastern part of Norfolk County, approximately 20 miles south of Boston. The town is bordered by the towns of Randolph, Avon, Braintree, Weymouth, and Abington. The town is located on the Neponset River, which runs through the center of town.
The town is mostly flat, with some rolling hills in the northern part of town. The highest point in the town is located at the intersection of South Street and Union Street, at an elevation of approximately 200 feet.
Economy
Holbrook’s economy is primarily based on retail and services. The town is home to several large retail stores, including Walmart, Target, and Home Depot. There are also several smaller retail stores and restaurants in the town.
The town is also home to several industrial and manufacturing businesses, including a plastics manufacturer, a printing company, and a metal fabrication company.
Demographics
According to the 2010 census, Holbrook has a population of 10,791. The racial makeup of the town is 87.3% White, 5.2% African American, 2.2% Asian, 0.3% Native American, and 4.9% from other races.
The median household income in Holbrook is $68,945, and the median family income is $77,945. The town has a poverty rate of 8.2%.
Holbrook is served by the Holbrook Public Schools, which includes two elementary schools, one middle school, and one high school. The town is also home to several private schools, including a Catholic school and a Jewish day school.
Common Questions
What is Per Capita Income in Holbrook?
Per Capita income in Holbrook is $46,376.
What is the Median Family Income in Holbrook?
Median Family Income in Holbrook is $118,561.
What is the Median Household income in Holbrook?
Median Household Income in Holbrook is $96,920.
What is Income or Wage Gap in Holbrook?
Income or Wage Gap in Holbrook is 25.5%.
Women in Holbrook earn 74.5 cents for every dollar earned by a man.
What is Inequality or Gini Index in Holbrook?
Inequality or Gini Index in Holbrook is 0.40.
What is the Total Population of Holbrook?
Total Population of Holbrook is 11,338.
What is the Total Male Population of Holbrook?
Total Male Population of Holbrook is 5,591.
What is the Total Female Population of Holbrook?
Total Female Population of Holbrook is 5,747.
What is the Ratio of Males per 100 Females in Holbrook?
There are 97.29 Males per 100 Females in Holbrook.
What is the Ratio of Females per 100 Males in Holbrook?
There are 102.79 Females per 100 Males in Holbrook.
What is the Median Population Age in Holbrook?
Median Population Age in Holbrook is 43.0 Years.
What is the Average Family Size in Holbrook
Average Family Size in Holbrook is 3.0 People.
What is the Average Household Size in Holbrook
Average Household Size in Holbrook is 2.4 People.
How Large is the Labor Force in Holbrook?
There are 6,443 People in the Labor Forcein in Holbrook.
What is the Percentage of People in the Labor Force in Holbrook?
68.3% of People are in the Labor Force in Holbrook.
What is the Unemployment Rate in Holbrook?
Unemployment Rate in Holbrook is 3.8%.