Salisbury, MA Map & Demographics
Salisbury Map
Salisbury Overview
$62,826
PER CAPITA INCOME
$119,955
AVG FAMILY INCOME
$89,768
AVG HOUSEHOLD INCOME
25.1%
WAGE / INCOME GAP [ % ]
74.9¢/ $1
WAGE / INCOME GAP [ $ ]
0.46
INEQUALITY / GINI INDEX
5,269
TOTAL POPULATION
2,579
MALE POPULATION
2,690
FEMALE POPULATION
95.87
MALES / 100 FEMALES
104.30
FEMALES / 100 MALES
52.6
MEDIAN AGE
2.6
AVG FAMILY SIZE
2.0
AVG HOUSEHOLD SIZE
3,057
LABOR FORCE [ PEOPLE ]
64.8%
PERCENT IN LABOR FORCE
3.1%
UNEMPLOYMENT RATE
Salisbury Zip Codes
Income in Salisbury
Income Overview in Salisbury
Per Capita Income in Salisbury is $62,826, while median incomes of families and households are $119,955 and $89,768 respectively.
| Characteristic | Number | Measure |
| Per Capita Income | 5,269 | $62,826 |
| Median Family Income | 1,417 | $119,955 |
| Mean Family Income | 1,417 | $139,505 |
| Median Household Income | 2,695 | $89,768 |
| Mean Household Income | 2,695 | $124,228 |
| Income Deficit | 1,417 | $0 |
| Wage / Income Gap (%) | 5,269 | 25.14% |
| Wage / Income Gap ($) | 5,269 | 74.86¢ per $1 |
| Gini / Inequality Index | 5,269 | 0.46 |
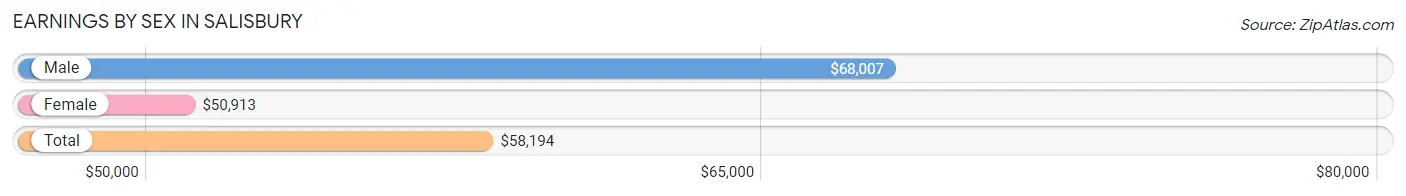
Earnings by Sex in Salisbury
Average Earnings in Salisbury are $58,194, $68,007 for men and $50,913 for women, a difference of 25.1%.
| Sex | Number | Average Earnings |
| Male | 1,635 (49.6%) | $68,007 |
| Female | 1,663 (50.4%) | $50,913 |
| Total | 3,298 (100.0%) | $58,194 |
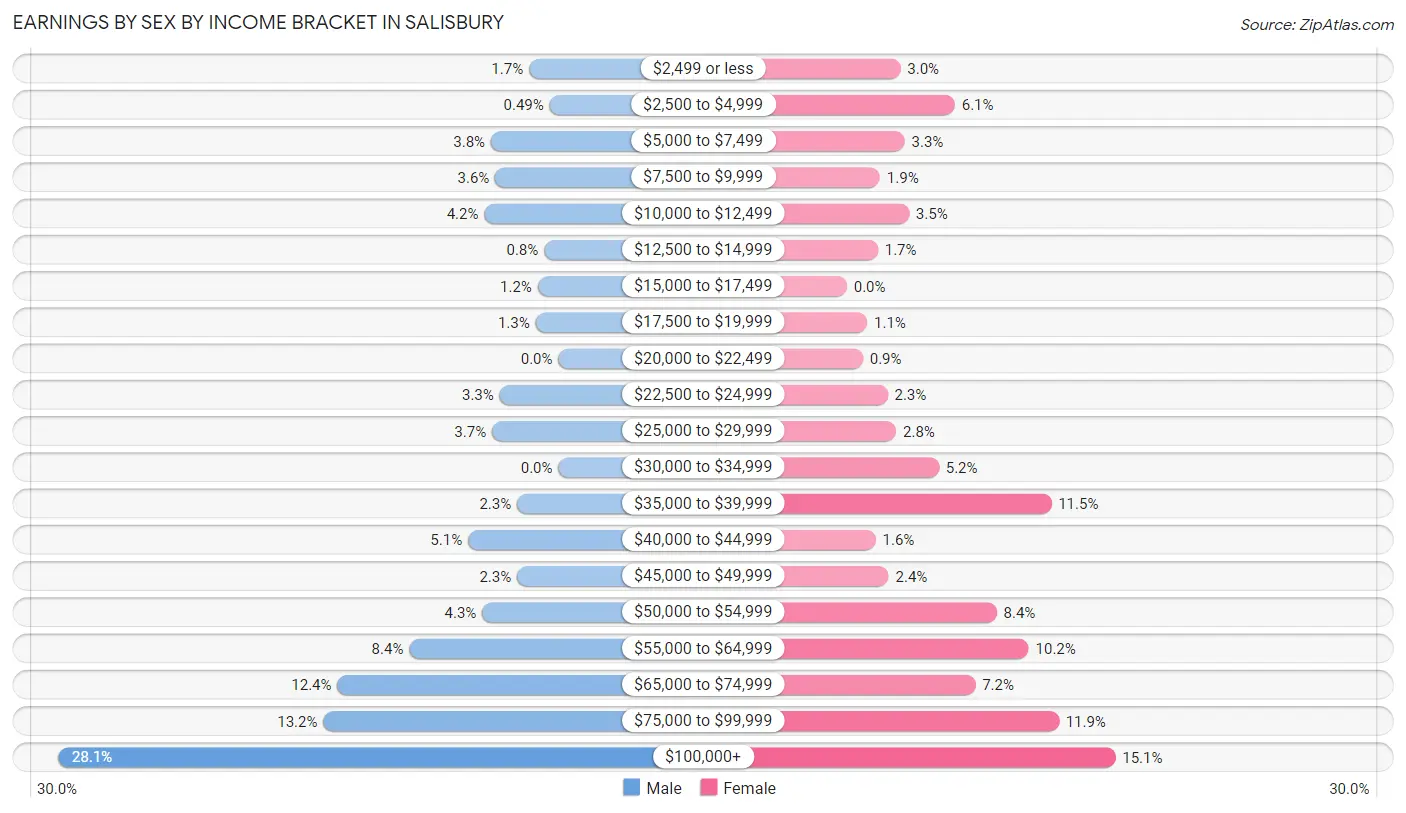
Earnings by Sex by Income Bracket in Salisbury
The most common earnings brackets in Salisbury are $100,000+ for men (459 | 28.1%) and $100,000+ for women (251 | 15.1%).
| Income | Male | Female |
| $2,499 or less | 27 (1.7%) | 50 (3.0%) |
| $2,500 to $4,999 | 8 (0.5%) | 101 (6.1%) |
| $5,000 to $7,499 | 62 (3.8%) | 54 (3.3%) |
| $7,500 to $9,999 | 58 (3.5%) | 31 (1.9%) |
| $10,000 to $12,499 | 68 (4.2%) | 58 (3.5%) |
| $12,500 to $14,999 | 13 (0.8%) | 29 (1.7%) |
| $15,000 to $17,499 | 19 (1.2%) | 0 (0.0%) |
| $17,500 to $19,999 | 21 (1.3%) | 19 (1.1%) |
| $20,000 to $22,499 | 0 (0.0%) | 15 (0.9%) |
| $22,500 to $24,999 | 54 (3.3%) | 38 (2.3%) |
| $25,000 to $29,999 | 61 (3.7%) | 46 (2.8%) |
| $30,000 to $34,999 | 0 (0.0%) | 86 (5.2%) |
| $35,000 to $39,999 | 38 (2.3%) | 191 (11.5%) |
| $40,000 to $44,999 | 83 (5.1%) | 27 (1.6%) |
| $45,000 to $49,999 | 38 (2.3%) | 39 (2.4%) |
| $50,000 to $54,999 | 70 (4.3%) | 140 (8.4%) |
| $55,000 to $64,999 | 137 (8.4%) | 170 (10.2%) |
| $65,000 to $74,999 | 203 (12.4%) | 120 (7.2%) |
| $75,000 to $99,999 | 216 (13.2%) | 198 (11.9%) |
| $100,000+ | 459 (28.1%) | 251 (15.1%) |
| Total | 1,635 (100.0%) | 1,663 (100.0%) |
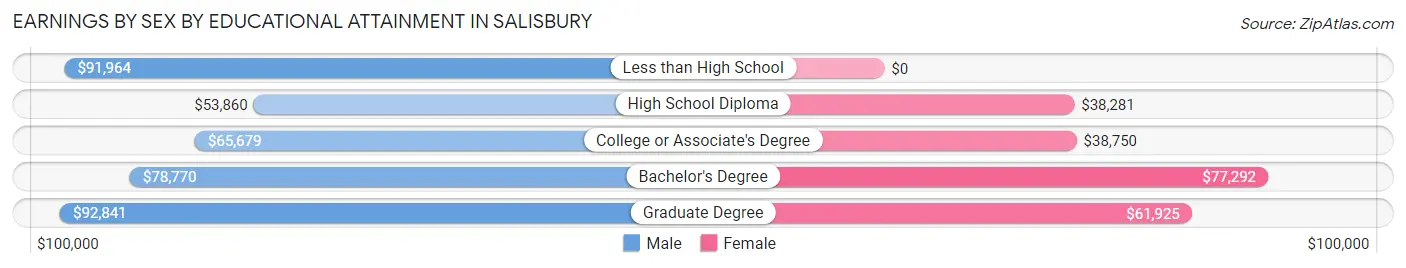
Earnings by Sex by Educational Attainment in Salisbury
Average earnings in Salisbury are $70,929 for men and $58,523 for women, a difference of 17.5%. Men with an educational attainment of graduate degree enjoy the highest average annual earnings of $92,841, while those with high school diploma education earn the least with $53,860. Women with an educational attainment of bachelor's degree earn the most with the average annual earnings of $77,292, while those with high school diploma education have the smallest earnings of $38,281.
| Educational Attainment | Male Income | Female Income |
| Less than High School | $91,964 | $0 |
| High School Diploma | $53,860 | $38,281 |
| College or Associate's Degree | $65,679 | $38,750 |
| Bachelor's Degree | $78,770 | $77,292 |
| Graduate Degree | $92,841 | $61,925 |
| Total | $70,929 | $58,523 |
Family Income in Salisbury
Family Income Brackets in Salisbury
According to the Salisbury family income data, there are 354 families falling into the $100,000 to $149,999 income range, which is the most common income bracket and makes up 25.0% of all families.
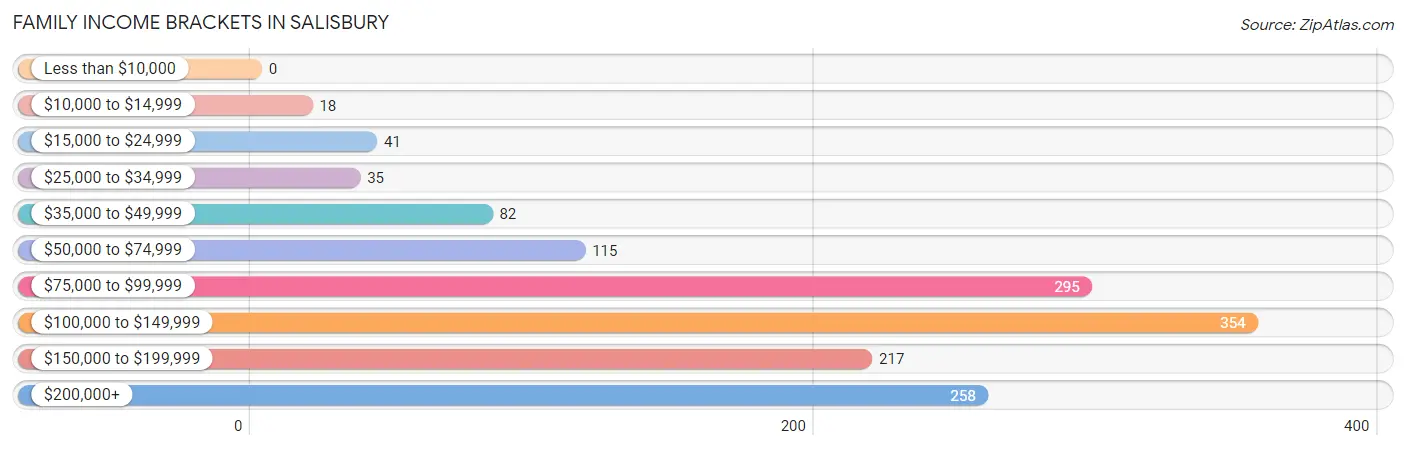
| Income Bracket | # Families | % Families |
| Less than $10,000 | 0 | 0.0% |
| $10,000 to $14,999 | 18 | 1.3% |
| $15,000 to $24,999 | 41 | 2.9% |
| $25,000 to $34,999 | 35 | 2.5% |
| $35,000 to $49,999 | 82 | 5.8% |
| $50,000 to $74,999 | 115 | 8.1% |
| $75,000 to $99,999 | 295 | 20.8% |
| $100,000 to $149,999 | 354 | 25.0% |
| $150,000 to $199,999 | 217 | 15.3% |
| $200,000+ | 258 | 18.2% |
Family Income by Famaliy Size in Salisbury
5-person families (27 | 1.9%) account for the highest median family income in Salisbury with $217,321 per family, while 2-person families (899 | 63.4%) have the highest median income of $56,292 per family member.
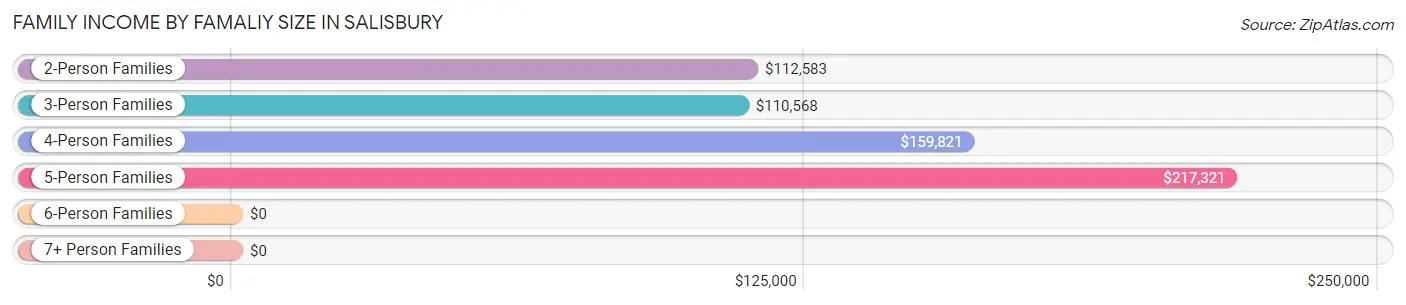
| Income Bracket | # Families | Median Income |
| 2-Person Families | 899 (63.4%) | $112,583 |
| 3-Person Families | 273 (19.3%) | $110,568 |
| 4-Person Families | 199 (14.0%) | $159,821 |
| 5-Person Families | 27 (1.9%) | $217,321 |
| 6-Person Families | 19 (1.3%) | $0 |
| 7+ Person Families | 0 (0.0%) | $0 |
| Total | 1,417 (100.0%) | $119,955 |
Family Income by Number of Earners in Salisbury
The median family income in Salisbury is $119,955, with families comprising 3+ earners (150) having the highest median family income of $224,737, while families with no earners (223) have the lowest median family income of $54,107, accounting for 10.6% and 15.7% of families, respectively.
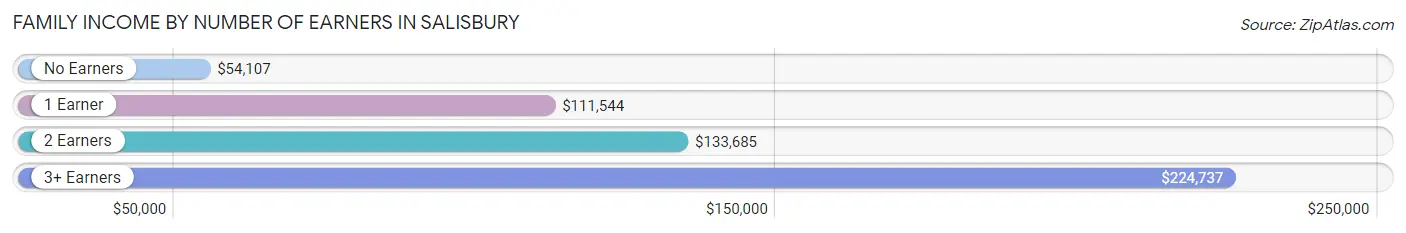
| Number of Earners | # Families | Median Income |
| No Earners | 223 (15.7%) | $54,107 |
| 1 Earner | 463 (32.7%) | $111,544 |
| 2 Earners | 581 (41.0%) | $133,685 |
| 3+ Earners | 150 (10.6%) | $224,737 |
| Total | 1,417 (100.0%) | $119,955 |
Household Income in Salisbury
Household Income Brackets in Salisbury
With 534 households falling in the category, the $100,000 to $149,999 income range is the most frequent in Salisbury, accounting for 19.8% of all households. In contrast, only 105 households (3.9%) fall into the less than $10,000 income bracket, making it the least populous group.
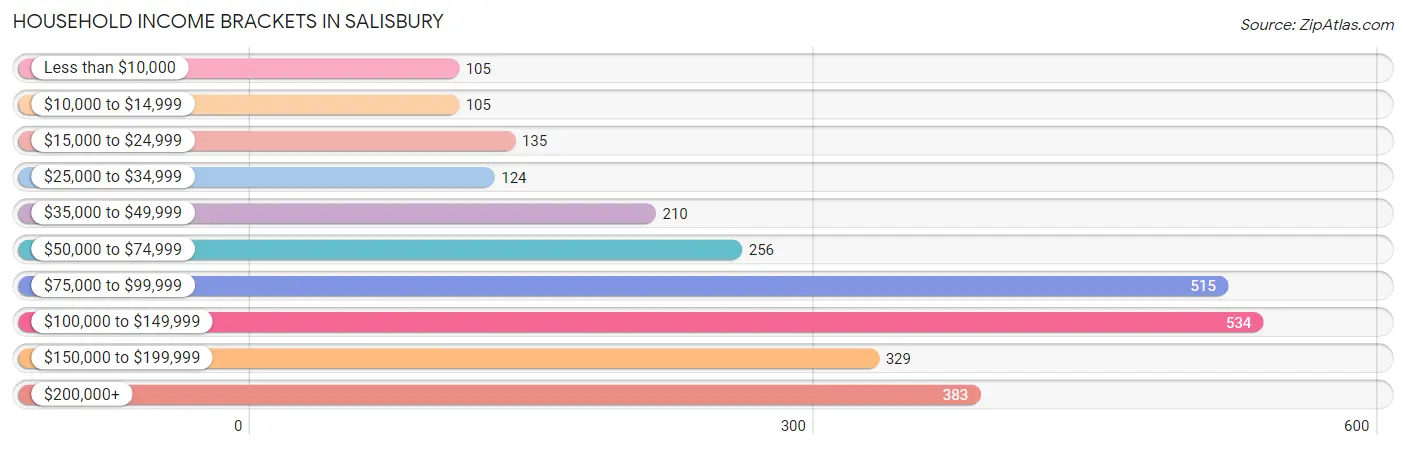
| Income Bracket | # Households | % Households |
| Less than $10,000 | 105 | 3.9% |
| $10,000 to $14,999 | 105 | 3.9% |
| $15,000 to $24,999 | 135 | 5.0% |
| $25,000 to $34,999 | 124 | 4.6% |
| $35,000 to $49,999 | 210 | 7.8% |
| $50,000 to $74,999 | 256 | 9.5% |
| $75,000 to $99,999 | 515 | 19.1% |
| $100,000 to $149,999 | 534 | 19.8% |
| $150,000 to $199,999 | 329 | 12.2% |
| $200,000+ | 383 | 14.2% |
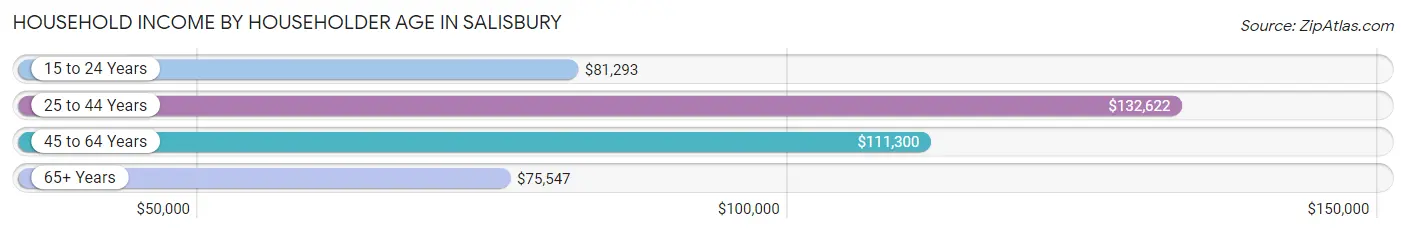
Household Income by Householder Age in Salisbury
The median household income in Salisbury is $89,768, with the highest median household income of $132,622 found in the 25 to 44 years age bracket for the primary householder. A total of 616 households (22.9%) fall into this category. Meanwhile, the 65+ years age bracket for the primary householder has the lowest median household income of $75,547, with 997 households (37.0%) in this group.
| Income Bracket | # Households | Median Income |
| 15 to 24 Years | 140 (5.2%) | $81,293 |
| 25 to 44 Years | 616 (22.9%) | $132,622 |
| 45 to 64 Years | 942 (34.9%) | $111,300 |
| 65+ Years | 997 (37.0%) | $75,547 |
| Total | 2,695 (100.0%) | $89,768 |
Poverty in Salisbury
Income Below Poverty by Sex and Age in Salisbury
With 5.4% poverty level for males and 5.7% for females among the residents of Salisbury, 18 to 24 year old males and 45 to 54 year old females are the most vulnerable to poverty, with 26 males (20.6%) and 48 females (13.1%) in their respective age groups living below the poverty level.
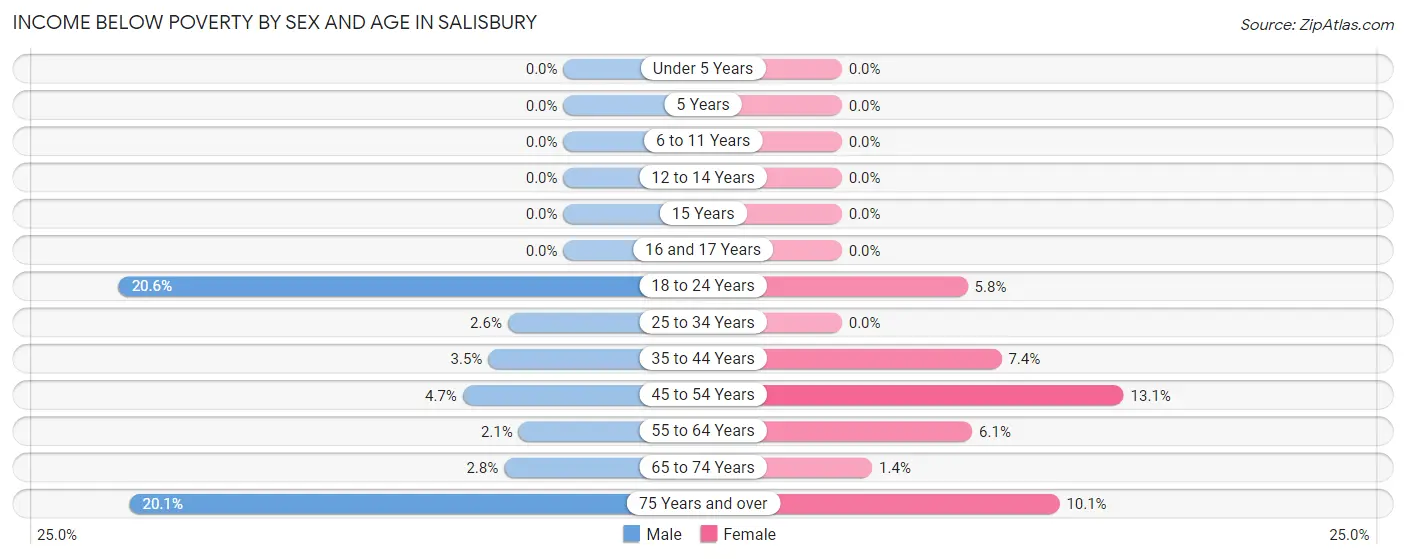
| Age Bracket | Male | Female |
| Under 5 Years | 0 (0.0%) | 0 (0.0%) |
| 5 Years | 0 (0.0%) | 0 (0.0%) |
| 6 to 11 Years | 0 (0.0%) | 0 (0.0%) |
| 12 to 14 Years | 0 (0.0%) | 0 (0.0%) |
| 15 Years | 0 (0.0%) | 0 (0.0%) |
| 16 and 17 Years | 0 (0.0%) | 0 (0.0%) |
| 18 to 24 Years | 26 (20.6%) | 16 (5.8%) |
| 25 to 34 Years | 10 (2.6%) | 0 (0.0%) |
| 35 to 44 Years | 8 (3.5%) | 24 (7.4%) |
| 45 to 54 Years | 12 (4.7%) | 48 (13.1%) |
| 55 to 64 Years | 10 (2.1%) | 28 (6.0%) |
| 65 to 74 Years | 10 (2.8%) | 7 (1.4%) |
| 75 Years and over | 64 (20.1%) | 31 (10.1%) |
| Total | 140 (5.4%) | 154 (5.7%) |
Income Above Poverty by Sex and Age in Salisbury
According to the poverty statistics in Salisbury, males aged under 5 years and females aged under 5 years are the age groups that are most secure financially, with 100.0% of males and 100.0% of females in these age groups living above the poverty line.
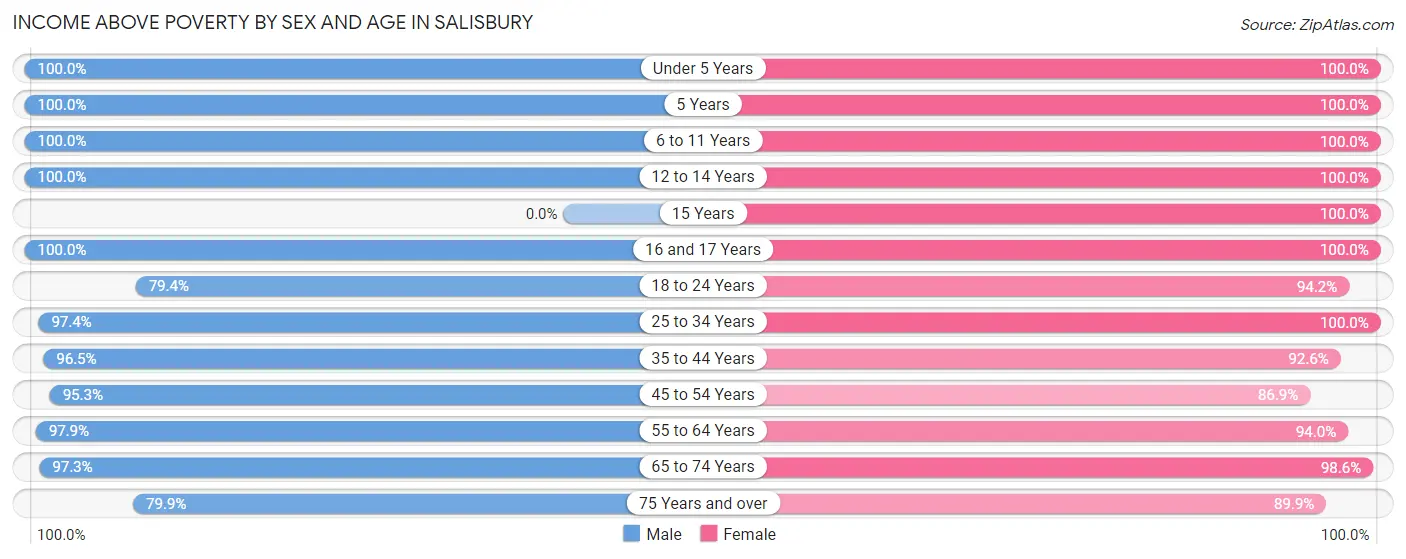
| Age Bracket | Male | Female |
| Under 5 Years | 170 (100.0%) | 14 (100.0%) |
| 5 Years | 8 (100.0%) | 11 (100.0%) |
| 6 to 11 Years | 153 (100.0%) | 74 (100.0%) |
| 12 to 14 Years | 58 (100.0%) | 49 (100.0%) |
| 15 Years | 0 (0.0%) | 14 (100.0%) |
| 16 and 17 Years | 29 (100.0%) | 28 (100.0%) |
| 18 to 24 Years | 100 (79.4%) | 258 (94.2%) |
| 25 to 34 Years | 378 (97.4%) | 270 (100.0%) |
| 35 to 44 Years | 221 (96.5%) | 300 (92.6%) |
| 45 to 54 Years | 245 (95.3%) | 319 (86.9%) |
| 55 to 64 Years | 470 (97.9%) | 435 (94.0%) |
| 65 to 74 Years | 353 (97.3%) | 488 (98.6%) |
| 75 Years and over | 254 (79.9%) | 276 (89.9%) |
| Total | 2,439 (94.6%) | 2,536 (94.3%) |
Income Below Poverty Among Married-Couple Families in Salisbury
The poverty statistics for married-couple families in Salisbury show that 2.4% or 28 of the total 1,173 families live below the poverty line. Families with no children have the highest poverty rate of 3.3%, comprising of 28 families. On the other hand, families with 1 or 2 children have the lowest poverty rate of 0.0%, which includes 0 families.
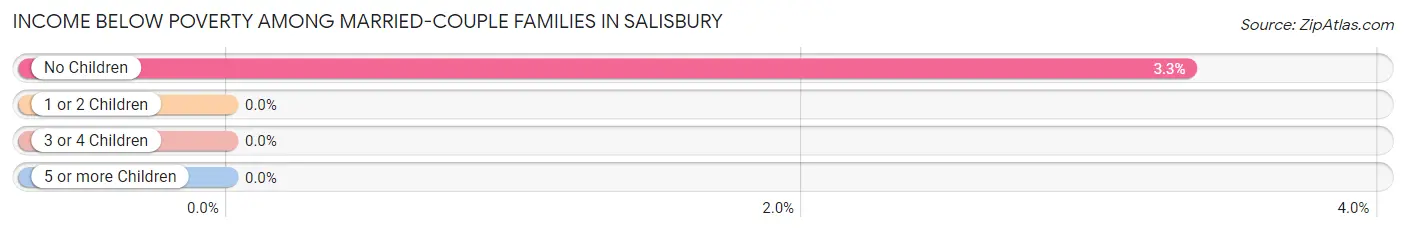
| Children | Above Poverty | Below Poverty |
| No Children | 810 (96.7%) | 28 (3.3%) |
| 1 or 2 Children | 334 (100.0%) | 0 (0.0%) |
| 3 or 4 Children | 1 (100.0%) | 0 (0.0%) |
| 5 or more Children | 0 (0.0%) | 0 (0.0%) |
| Total | 1,145 (97.6%) | 28 (2.4%) |
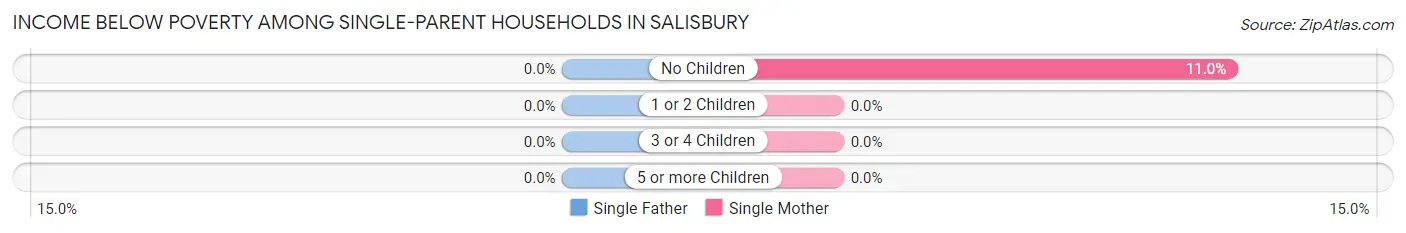
Income Below Poverty Among Single-Parent Households in Salisbury
| Children | Single Father | Single Mother |
| No Children | 0 (0.0%) | 14 (11.0%) |
| 1 or 2 Children | 0 (0.0%) | 0 (0.0%) |
| 3 or 4 Children | 0 (0.0%) | 0 (0.0%) |
| 5 or more Children | 0 (0.0%) | 0 (0.0%) |
| Total | 0 (0.0%) | 14 (6.7%) |
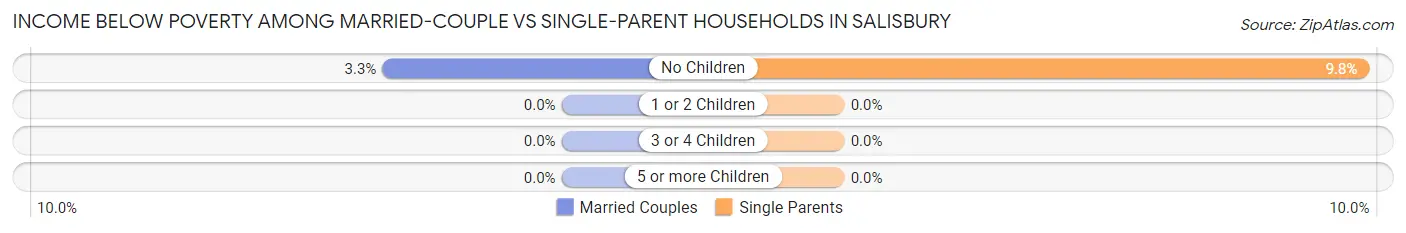
Income Below Poverty Among Married-Couple vs Single-Parent Households in Salisbury
The poverty data for Salisbury shows that 28 of the married-couple family households (2.4%) and 14 of the single-parent households (5.7%) are living below the poverty level. Within the married-couple family households, those with no children have the highest poverty rate, with 28 households (3.3%) falling below the poverty line. Among the single-parent households, those with no children have the highest poverty rate, with 14 household (9.8%) living below poverty.
| Children | Married-Couple Families | Single-Parent Households |
| No Children | 28 (3.3%) | 14 (9.8%) |
| 1 or 2 Children | 0 (0.0%) | 0 (0.0%) |
| 3 or 4 Children | 0 (0.0%) | 0 (0.0%) |
| 5 or more Children | 0 (0.0%) | 0 (0.0%) |
| Total | 28 (2.4%) | 14 (5.7%) |
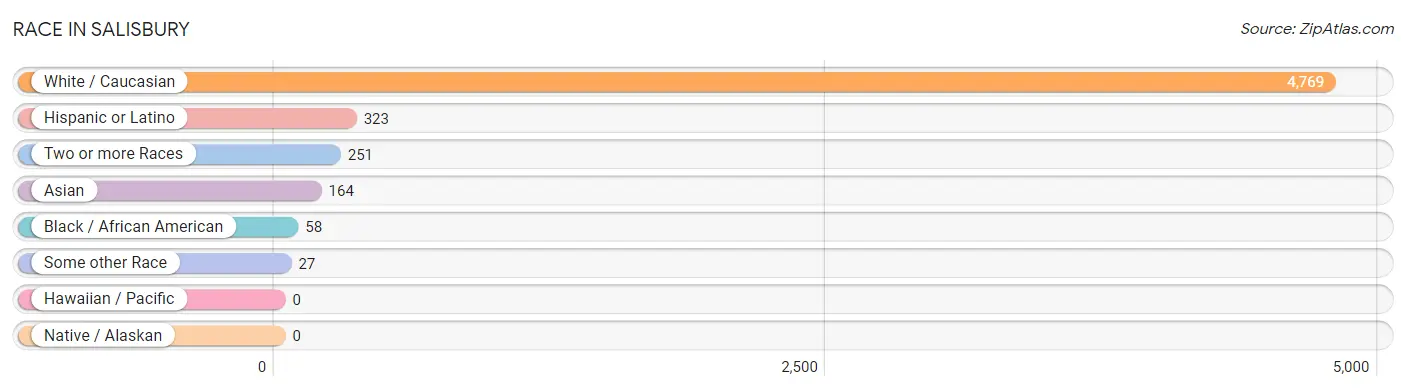
Race in Salisbury
The most populous races in Salisbury are White / Caucasian (4,769 | 90.5%), Hispanic or Latino (323 | 6.1%), and Two or more Races (251 | 4.8%).
| Race | # Population | % Population |
| Asian | 164 | 3.1% |
| Black / African American | 58 | 1.1% |
| Hawaiian / Pacific | 0 | 0.0% |
| Hispanic or Latino | 323 | 6.1% |
| Native / Alaskan | 0 | 0.0% |
| White / Caucasian | 4,769 | 90.5% |
| Two or more Races | 251 | 4.8% |
| Some other Race | 27 | 0.5% |
| Total | 5,269 | 100.0% |
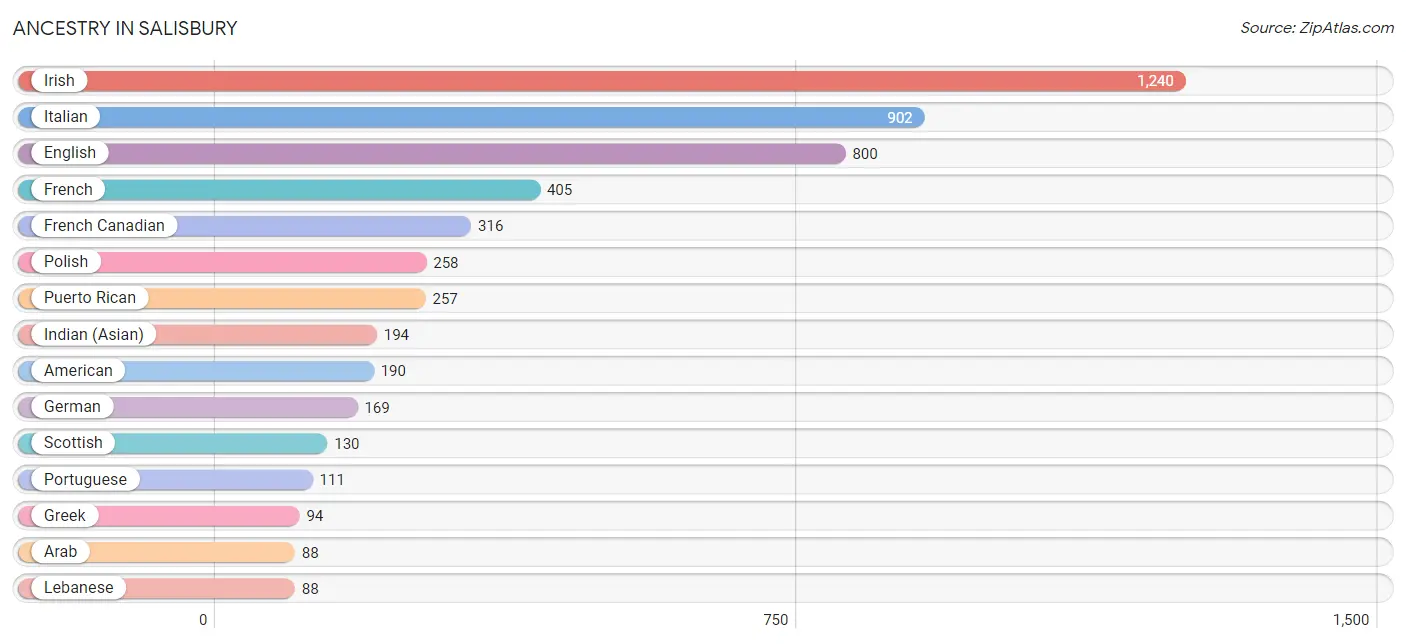
Ancestry in Salisbury
The most populous ancestries reported in Salisbury are Irish (1,240 | 23.5%), Italian (902 | 17.1%), English (800 | 15.2%), French (405 | 7.7%), and French Canadian (316 | 6.0%), together accounting for 69.5% of all Salisbury residents.
| Ancestry | # Population | % Population |
| American | 190 | 3.6% |
| Arab | 88 | 1.7% |
| Armenian | 14 | 0.3% |
| Bhutanese | 6 | 0.1% |
| Bolivian | 29 | 0.5% |
| Brazilian | 10 | 0.2% |
| British | 36 | 0.7% |
| Canadian | 87 | 1.7% |
| Cape Verdean | 10 | 0.2% |
| Central American | 10 | 0.2% |
| Czech | 21 | 0.4% |
| Dutch | 41 | 0.8% |
| Eastern European | 72 | 1.4% |
| English | 800 | 15.2% |
| European | 17 | 0.3% |
| Finnish | 8 | 0.2% |
| French | 405 | 7.7% |
| French Canadian | 316 | 6.0% |
| German | 169 | 3.2% |
| Greek | 94 | 1.8% |
| Indian (Asian) | 194 | 3.7% |
| Irish | 1,240 | 23.5% |
| Italian | 902 | 17.1% |
| Jamaican | 14 | 0.3% |
| Korean | 21 | 0.4% |
| Lebanese | 88 | 1.7% |
| Lithuanian | 10 | 0.2% |
| Mexican | 27 | 0.5% |
| Northern European | 16 | 0.3% |
| Norwegian | 15 | 0.3% |
| Panamanian | 10 | 0.2% |
| Polish | 258 | 4.9% |
| Portuguese | 111 | 2.1% |
| Puerto Rican | 257 | 4.9% |
| Russian | 48 | 0.9% |
| Scandinavian | 19 | 0.4% |
| Scotch-Irish | 20 | 0.4% |
| Scottish | 130 | 2.5% |
| South American | 29 | 0.5% |
| Sri Lankan | 7 | 0.1% |
| Subsaharan African | 10 | 0.2% |
| Swedish | 35 | 0.7% |
| Ukrainian | 16 | 0.3% |
| Welsh | 22 | 0.4% | View All 44 Rows |
Immigrants in Salisbury
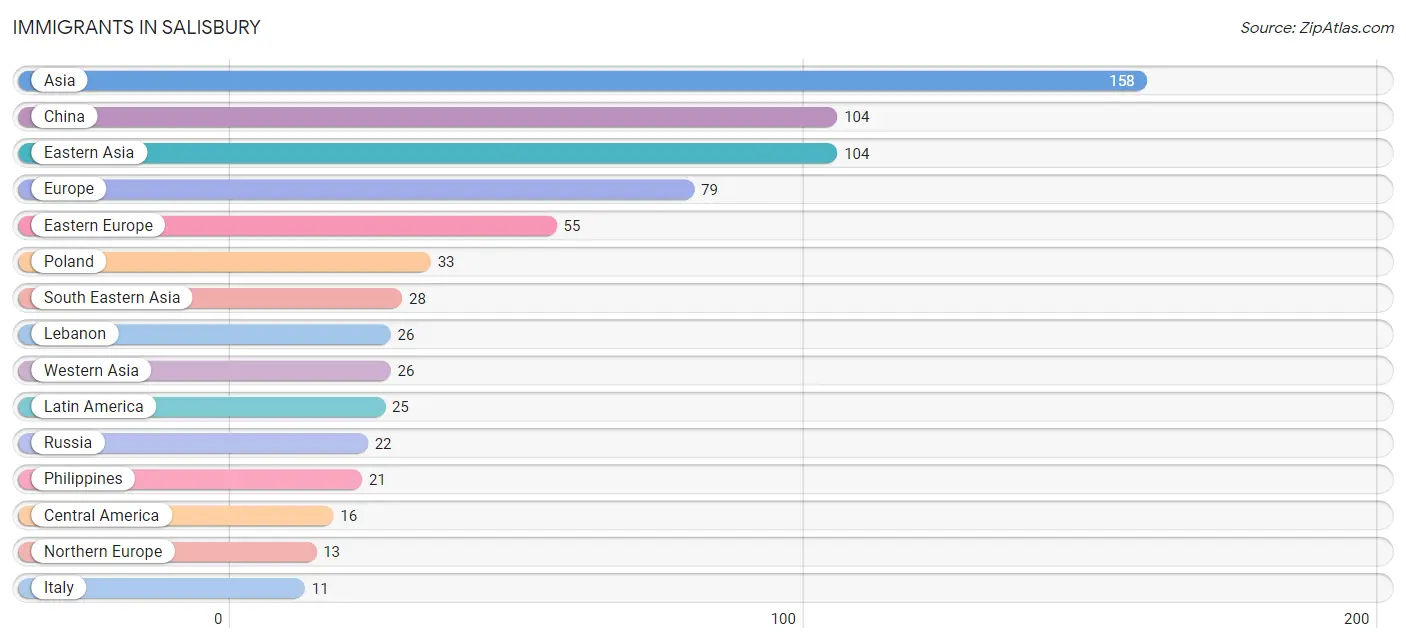
The most numerous immigrant groups reported in Salisbury came from Asia (158 | 3.0%), China (104 | 2.0%), Eastern Asia (104 | 2.0%), Europe (79 | 1.5%), and Eastern Europe (55 | 1.0%), together accounting for 9.5% of all Salisbury residents.
| Immigration Origin | # Population | % Population |
| Asia | 158 | 3.0% |
| Bolivia | 9 | 0.2% |
| Central America | 16 | 0.3% |
| China | 104 | 2.0% |
| Eastern Asia | 104 | 2.0% |
| Eastern Europe | 55 | 1.0% |
| England | 5 | 0.1% |
| Europe | 79 | 1.5% |
| Ireland | 8 | 0.2% |
| Italy | 11 | 0.2% |
| Latin America | 25 | 0.5% |
| Lebanon | 26 | 0.5% |
| Mexico | 6 | 0.1% |
| Northern Europe | 13 | 0.3% |
| Panama | 10 | 0.2% |
| Philippines | 21 | 0.4% |
| Poland | 33 | 0.6% |
| Russia | 22 | 0.4% |
| South America | 9 | 0.2% |
| South Eastern Asia | 28 | 0.5% |
| Southern Europe | 11 | 0.2% |
| Vietnam | 7 | 0.1% |
| Western Asia | 26 | 0.5% | View All 23 Rows |
Sex and Age in Salisbury
Sex and Age in Salisbury
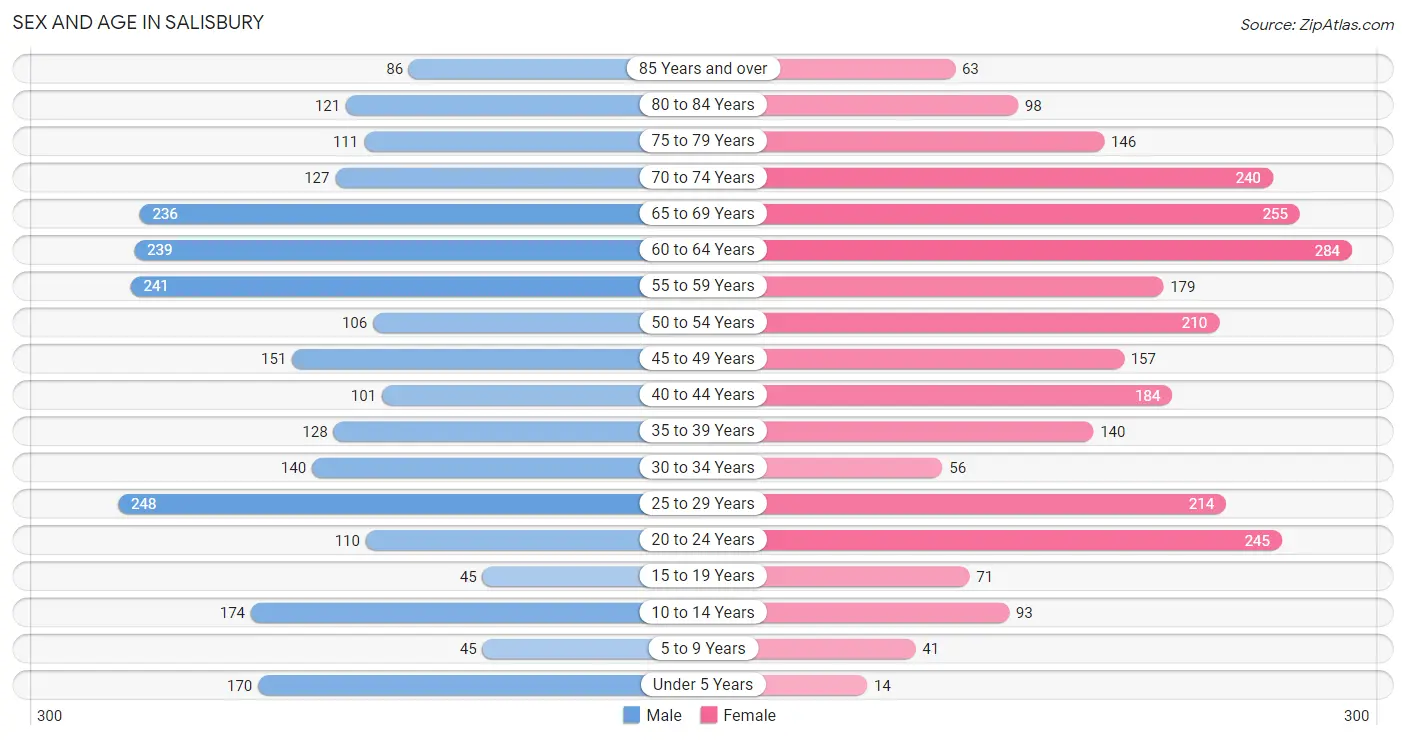
The most populous age groups in Salisbury are 25 to 29 Years (248 | 9.6%) for men and 60 to 64 Years (284 | 10.6%) for women.
| Age Bracket | Male | Female |
| Under 5 Years | 170 (6.6%) | 14 (0.5%) |
| 5 to 9 Years | 45 (1.7%) | 41 (1.5%) |
| 10 to 14 Years | 174 (6.8%) | 93 (3.5%) |
| 15 to 19 Years | 45 (1.7%) | 71 (2.6%) |
| 20 to 24 Years | 110 (4.3%) | 245 (9.1%) |
| 25 to 29 Years | 248 (9.6%) | 214 (8.0%) |
| 30 to 34 Years | 140 (5.4%) | 56 (2.1%) |
| 35 to 39 Years | 128 (5.0%) | 140 (5.2%) |
| 40 to 44 Years | 101 (3.9%) | 184 (6.8%) |
| 45 to 49 Years | 151 (5.9%) | 157 (5.8%) |
| 50 to 54 Years | 106 (4.1%) | 210 (7.8%) |
| 55 to 59 Years | 241 (9.3%) | 179 (6.7%) |
| 60 to 64 Years | 239 (9.3%) | 284 (10.6%) |
| 65 to 69 Years | 236 (9.1%) | 255 (9.5%) |
| 70 to 74 Years | 127 (4.9%) | 240 (8.9%) |
| 75 to 79 Years | 111 (4.3%) | 146 (5.4%) |
| 80 to 84 Years | 121 (4.7%) | 98 (3.6%) |
| 85 Years and over | 86 (3.3%) | 63 (2.3%) |
| Total | 2,579 (100.0%) | 2,690 (100.0%) |
Families and Households in Salisbury
Median Family Size in Salisbury
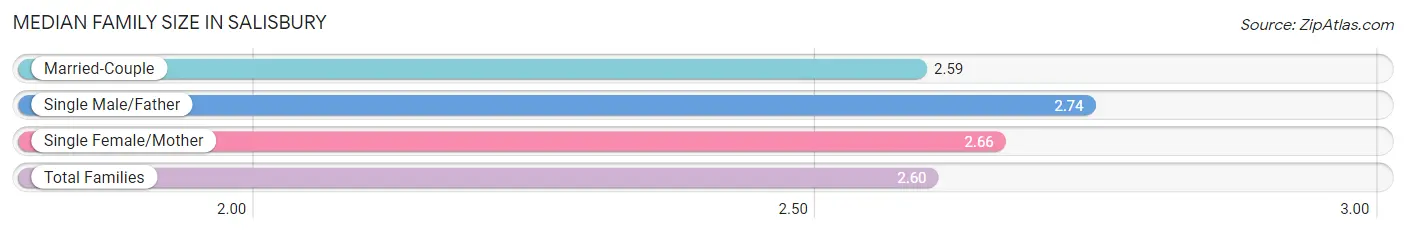
The median family size in Salisbury is 2.60 persons per family, with single male/father families (34 | 2.4%) accounting for the largest median family size of 2.74 persons per family. On the other hand, married-couple families (1,173 | 82.8%) represent the smallest median family size with 2.59 persons per family.
| Family Type | # Families | Family Size |
| Married-Couple | 1,173 (82.8%) | 2.59 |
| Single Male/Father | 34 (2.4%) | 2.74 |
| Single Female/Mother | 210 (14.8%) | 2.66 |
| Total Families | 1,417 (100.0%) | 2.60 |
Median Household Size in Salisbury
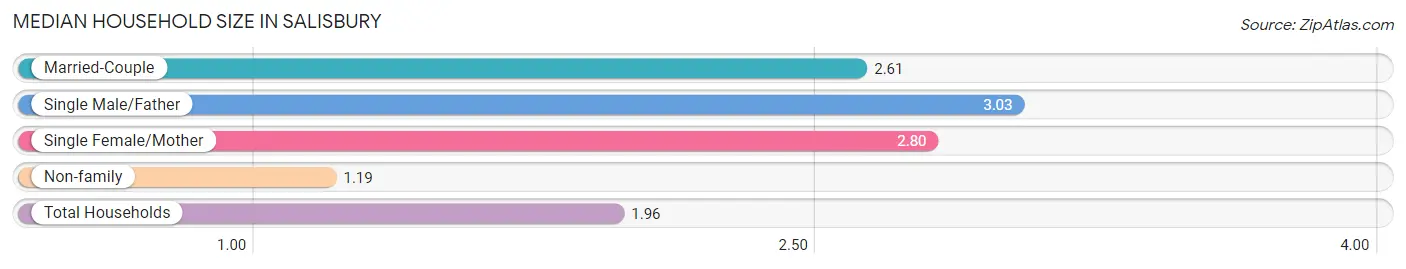
The median household size in Salisbury is 1.96 persons per household, with single male/father households (34 | 1.3%) accounting for the largest median household size of 3.03 persons per household. non-family households (1,278 | 47.4%) represent the smallest median household size with 1.19 persons per household.
| Household Type | # Households | Household Size |
| Married-Couple | 1,173 (43.5%) | 2.61 |
| Single Male/Father | 34 (1.3%) | 3.03 |
| Single Female/Mother | 210 (7.8%) | 2.80 |
| Non-family | 1,278 (47.4%) | 1.19 |
| Total Households | 2,695 (100.0%) | 1.96 |
Household Size by Marriage Status in Salisbury
Out of a total of 2,695 households in Salisbury, 1,417 (52.6%) are family households, while 1,278 (47.4%) are nonfamily households. The most numerous type of family households are 2-person households, comprising 870, and the most common type of nonfamily households are 1-person households, comprising 957.
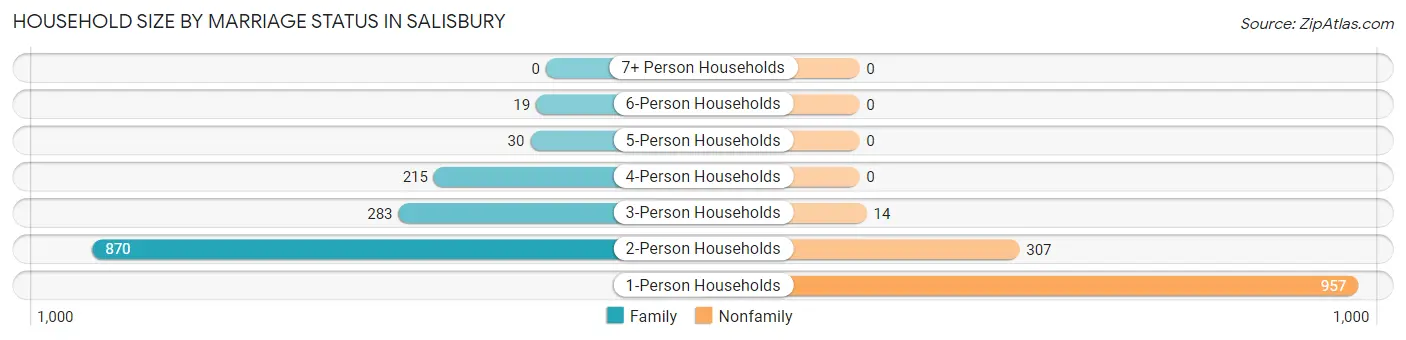
| Household Size | Family Households | Nonfamily Households |
| 1-Person Households | - | 957 (35.5%) |
| 2-Person Households | 870 (32.3%) | 307 (11.4%) |
| 3-Person Households | 283 (10.5%) | 14 (0.5%) |
| 4-Person Households | 215 (8.0%) | 0 (0.0%) |
| 5-Person Households | 30 (1.1%) | 0 (0.0%) |
| 6-Person Households | 19 (0.7%) | 0 (0.0%) |
| 7+ Person Households | 0 (0.0%) | 0 (0.0%) |
| Total | 1,417 (52.6%) | 1,278 (47.4%) |
Female Fertility in Salisbury
Fertility by Age in Salisbury
| Age Bracket | Women with Births | Births / 1,000 Women |
| 15 to 19 years | 0 (0.0%) | 0.0 |
| 20 to 34 years | 0 (0.0%) | 0.0 |
| 35 to 50 years | 0 (0.0%) | 0.0 |
| Total | 0 (0.0%) | 0.0 |
Fertility by Age by Marriage Status in Salisbury
| Age Bracket | Married | Unmarried |
| 15 to 19 years | 0 (0.0%) | 0 (0.0%) |
| 20 to 34 years | 0 (0.0%) | 0 (0.0%) |
| 35 to 50 years | 0 (0.0%) | 0 (0.0%) |
| Total | 0 (0.0%) | 0 (0.0%) |
Fertility by Education in Salisbury
| Educational Attainment | Women with Births | Births / 1,000 Women |
| Less than High School | 0 (0.0%) | 0.0 |
| High School Diploma | 0 (0.0%) | 0.0 |
| College or Associate's Degree | 0 (0.0%) | 0.0 |
| Bachelor's Degree | 0 (0.0%) | 0.0 |
| Graduate Degree | 0 (0.0%) | 0.0 |
| Total | 0 (0.0%) | 0.0 |
Fertility by Education by Marriage Status in Salisbury
| Educational Attainment | Married | Unmarried |
| Less than High School | 0 (0.0%) | 0 (0.0%) |
| High School Diploma | 0 (0.0%) | 0 (0.0%) |
| College or Associate's Degree | 0 (0.0%) | 0 (0.0%) |
| Bachelor's Degree | 0 (0.0%) | 0 (0.0%) |
| Graduate Degree | 0 (0.0%) | 0 (0.0%) |
| Total | 0 (0.0%) | 0 (0.0%) |
Employment Characteristics in Salisbury
Employment by Class of Employer in Salisbury
Among the 2,941 employed individuals in Salisbury, private company employees (2,075 | 70.6%), not-for-profit organizations (366 | 12.4%), and self-employed (not incorporated) (195 | 6.6%) make up the most common classes of employment.
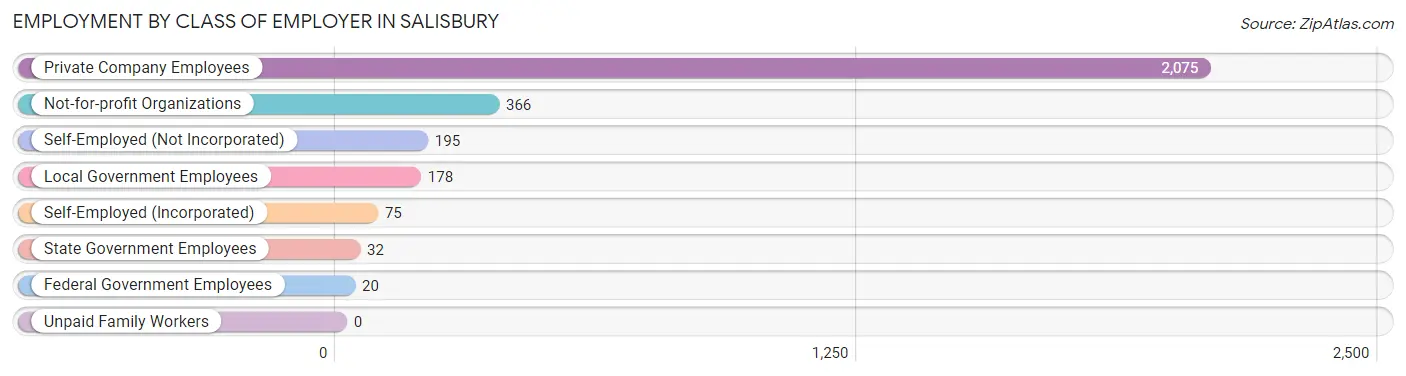
| Employer Class | # Employees | % Employees |
| Private Company Employees | 2,075 | 70.6% |
| Self-Employed (Incorporated) | 75 | 2.5% |
| Self-Employed (Not Incorporated) | 195 | 6.6% |
| Not-for-profit Organizations | 366 | 12.4% |
| Local Government Employees | 178 | 6.0% |
| State Government Employees | 32 | 1.1% |
| Federal Government Employees | 20 | 0.7% |
| Unpaid Family Workers | 0 | 0.0% |
| Total | 2,941 | 100.0% |
Employment Status by Age in Salisbury
According to the labor force statistics for Salisbury, out of the total population over 16 years of age (4,718), 64.8% or 3,057 individuals are in the labor force, with 3.1% or 95 of them unemployed. The age group with the highest labor force participation rate is 30 to 34 years, with 100.0% or 196 individuals in the labor force. Within the labor force, the 60 to 64 years age range has the highest percentage of unemployed individuals, with 9.5% or 28 of them being unemployed.
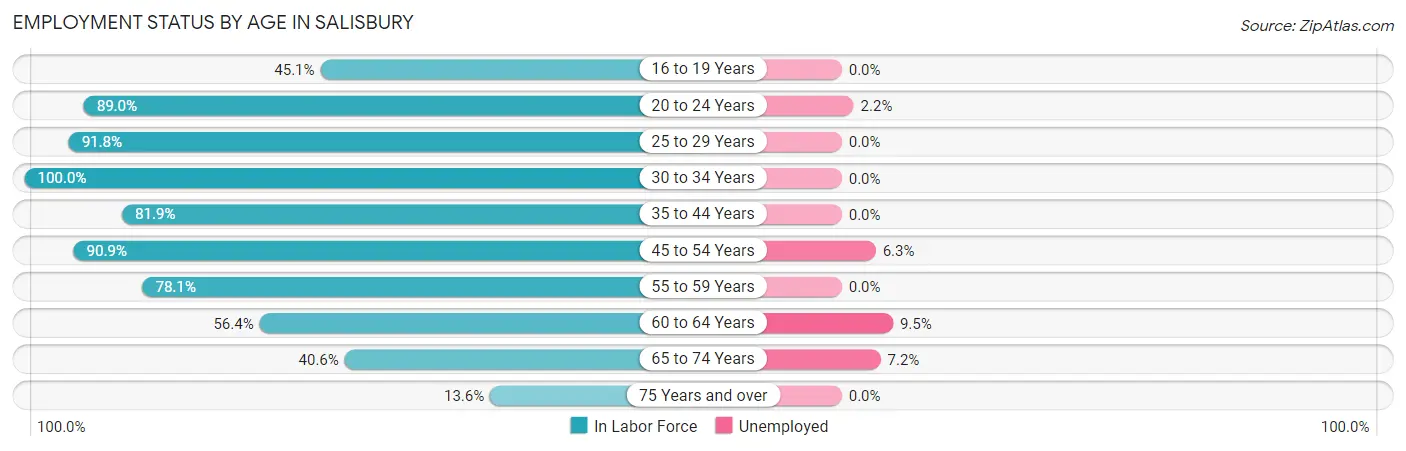
| Age Bracket | In Labor Force | Unemployed |
| 16 to 19 Years | 46 (45.1%) | 0 (0.0%) |
| 20 to 24 Years | 316 (89.0%) | 7 (2.2%) |
| 25 to 29 Years | 424 (91.8%) | 0 (0.0%) |
| 30 to 34 Years | 196 (100.0%) | 0 (0.0%) |
| 35 to 44 Years | 453 (81.9%) | 0 (0.0%) |
| 45 to 54 Years | 567 (90.9%) | 36 (6.3%) |
| 55 to 59 Years | 328 (78.1%) | 0 (0.0%) |
| 60 to 64 Years | 295 (56.4%) | 28 (9.5%) |
| 65 to 74 Years | 348 (40.6%) | 25 (7.2%) |
| 75 Years and over | 85 (13.6%) | 0 (0.0%) |
| Total | 3,057 (64.8%) | 95 (3.1%) |
Employment Status by Educational Attainment in Salisbury
According to labor force statistics for Salisbury, 81.5% of individuals (2,264) out of the total population between 25 and 64 years of age (2,778) are in the labor force, with 2.8% or 63 of them being unemployed. The group with the highest labor force participation rate are those with the educational attainment of college / associate degree, with 89.1% or 525 individuals in the labor force. Within the labor force, individuals with bachelor's degree or higher education have the highest percentage of unemployment, with 3.8% or 52 of them being unemployed.
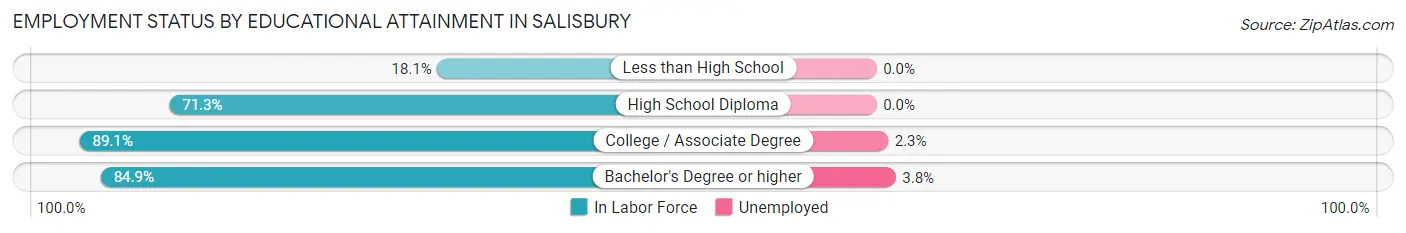
| Educational Attainment | In Labor Force | Unemployed |
| Less than High School | 15 (18.1%) | 0 (0.0%) |
| High School Diploma | 346 (71.3%) | 0 (0.0%) |
| College / Associate Degree | 525 (89.1%) | 14 (2.3%) |
| Bachelor's Degree or higher | 1,376 (84.9%) | 62 (3.8%) |
| Total | 2,264 (81.5%) | 78 (2.8%) |
Employment Occupations by Sex in Salisbury
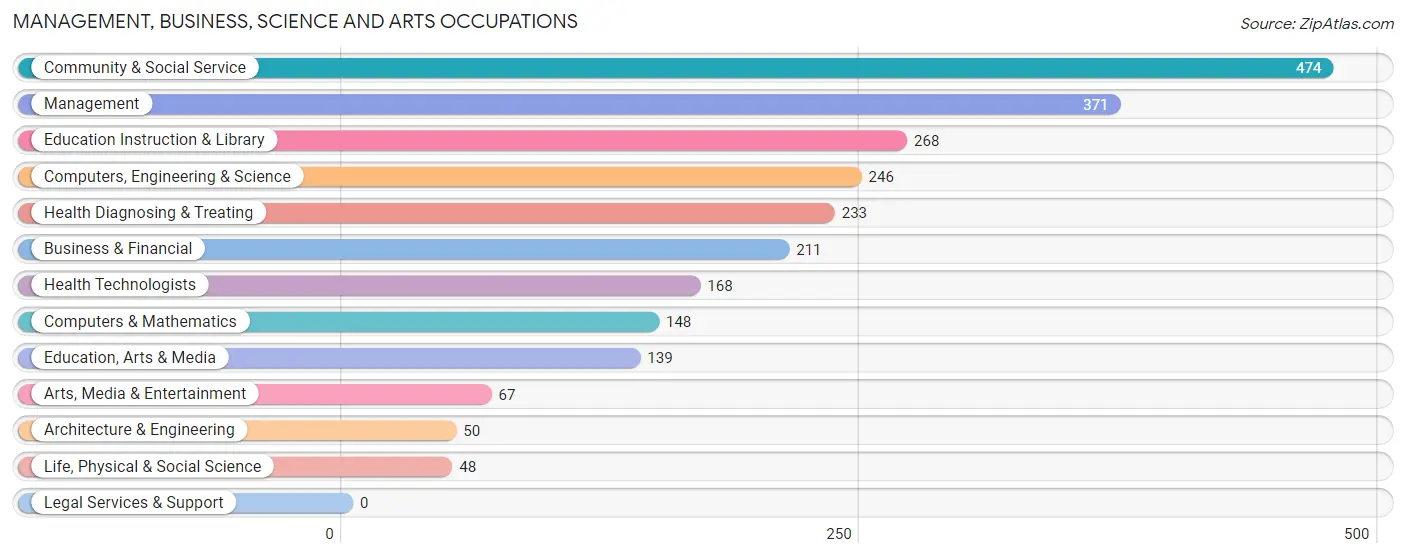
Management, Business, Science and Arts Occupations
The most common Management, Business, Science and Arts occupations in Salisbury are Community & Social Service (474 | 16.0%), Management (371 | 12.5%), Education Instruction & Library (268 | 9.0%), Computers, Engineering & Science (246 | 8.3%), and Health Diagnosing & Treating (233 | 7.9%).
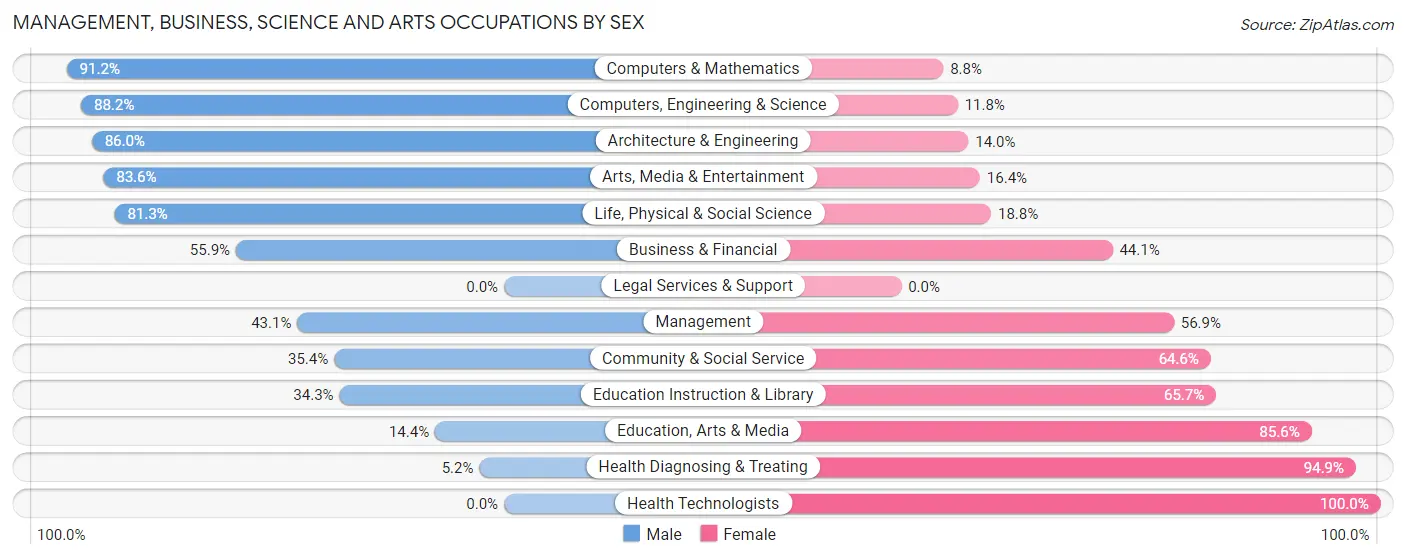
Management, Business, Science and Arts Occupations by Sex
Within the Management, Business, Science and Arts occupations in Salisbury, the most male-oriented occupations are Computers & Mathematics (91.2%), Computers, Engineering & Science (88.2%), and Architecture & Engineering (86.0%), while the most female-oriented occupations are Health Technologists (100.0%), Health Diagnosing & Treating (94.9%), and Education, Arts & Media (85.6%).
| Occupation | Male | Female |
| Management | 160 (43.1%) | 211 (56.9%) |
| Business & Financial | 118 (55.9%) | 93 (44.1%) |
| Computers, Engineering & Science | 217 (88.2%) | 29 (11.8%) |
| Computers & Mathematics | 135 (91.2%) | 13 (8.8%) |
| Architecture & Engineering | 43 (86.0%) | 7 (14.0%) |
| Life, Physical & Social Science | 39 (81.2%) | 9 (18.8%) |
| Community & Social Service | 168 (35.4%) | 306 (64.6%) |
| Education, Arts & Media | 20 (14.4%) | 119 (85.6%) |
| Legal Services & Support | 0 (0.0%) | 0 (0.0%) |
| Education Instruction & Library | 92 (34.3%) | 176 (65.7%) |
| Arts, Media & Entertainment | 56 (83.6%) | 11 (16.4%) |
| Health Diagnosing & Treating | 12 (5.1%) | 221 (94.9%) |
| Health Technologists | 0 (0.0%) | 168 (100.0%) |
| Total (Category) | 675 (44.0%) | 860 (56.0%) |
| Total (Overall) | 1,421 (48.0%) | 1,541 (52.0%) |
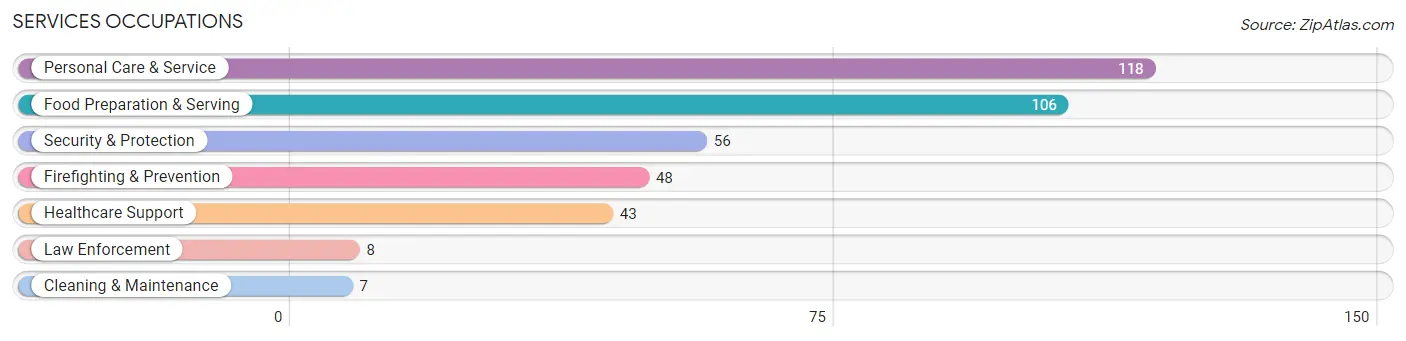
Services Occupations
The most common Services occupations in Salisbury are Personal Care & Service (118 | 4.0%), Food Preparation & Serving (106 | 3.6%), Security & Protection (56 | 1.9%), Firefighting & Prevention (48 | 1.6%), and Healthcare Support (43 | 1.5%).
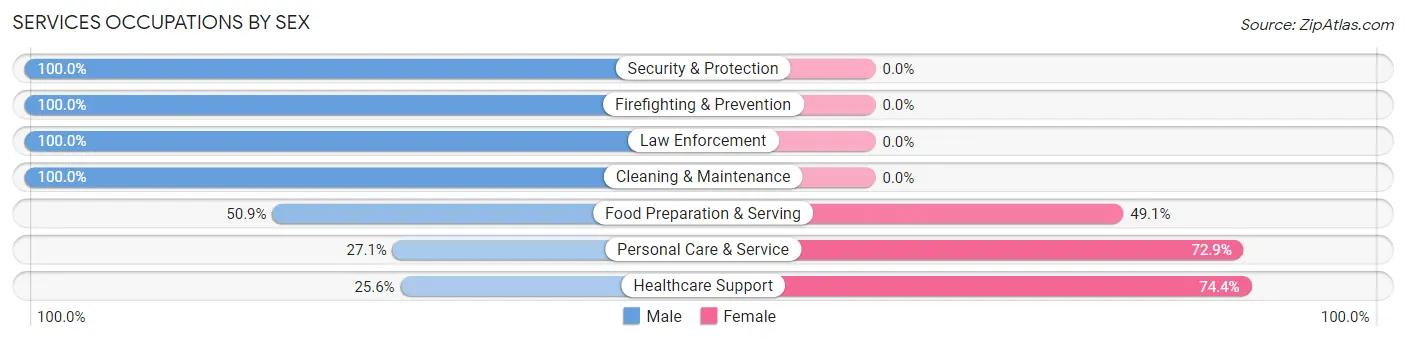
Services Occupations by Sex
Within the Services occupations in Salisbury, the most male-oriented occupations are Security & Protection (100.0%), Firefighting & Prevention (100.0%), and Law Enforcement (100.0%), while the most female-oriented occupations are Healthcare Support (74.4%), Personal Care & Service (72.9%), and Food Preparation & Serving (49.1%).
| Occupation | Male | Female |
| Healthcare Support | 11 (25.6%) | 32 (74.4%) |
| Security & Protection | 56 (100.0%) | 0 (0.0%) |
| Firefighting & Prevention | 48 (100.0%) | 0 (0.0%) |
| Law Enforcement | 8 (100.0%) | 0 (0.0%) |
| Food Preparation & Serving | 54 (50.9%) | 52 (49.1%) |
| Cleaning & Maintenance | 7 (100.0%) | 0 (0.0%) |
| Personal Care & Service | 32 (27.1%) | 86 (72.9%) |
| Total (Category) | 160 (48.5%) | 170 (51.5%) |
| Total (Overall) | 1,421 (48.0%) | 1,541 (52.0%) |
Sales and Office Occupations
The most common Sales and Office occupations in Salisbury are Sales & Related (411 | 13.9%), and Office & Administration (393 | 13.3%).
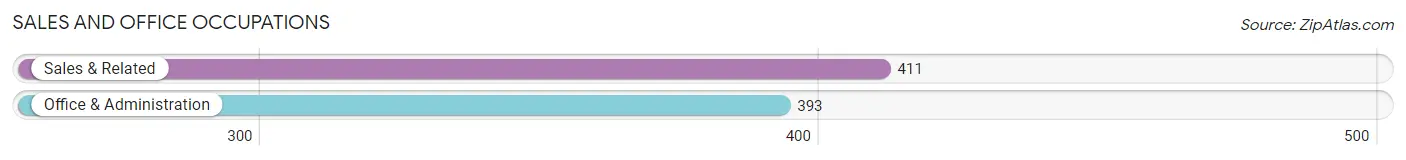
Sales and Office Occupations by Sex
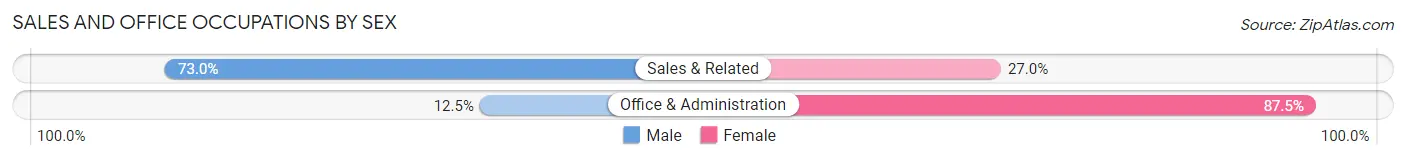
| Occupation | Male | Female |
| Sales & Related | 300 (73.0%) | 111 (27.0%) |
| Office & Administration | 49 (12.5%) | 344 (87.5%) |
| Total (Category) | 349 (43.4%) | 455 (56.6%) |
| Total (Overall) | 1,421 (48.0%) | 1,541 (52.0%) |
Natural Resources, Construction and Maintenance Occupations
The most common Natural Resources, Construction and Maintenance occupations in Salisbury are Construction & Extraction (133 | 4.5%), Farming, Fishing & Forestry (12 | 0.4%), and Installation, Maintenance & Repair (8 | 0.3%).
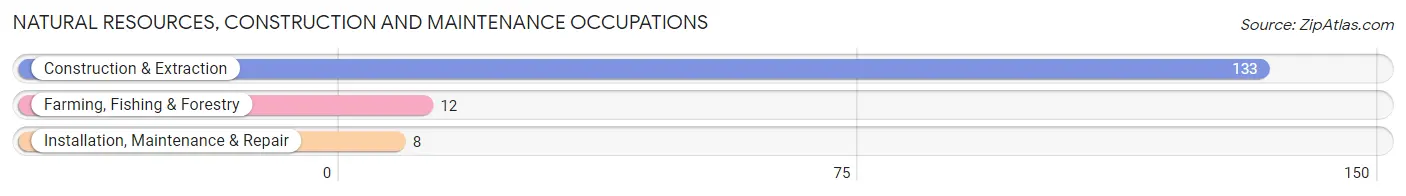
Natural Resources, Construction and Maintenance Occupations by Sex
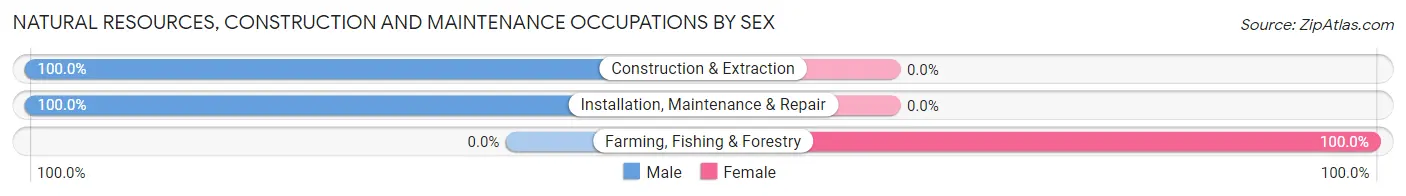
| Occupation | Male | Female |
| Farming, Fishing & Forestry | 0 (0.0%) | 12 (100.0%) |
| Construction & Extraction | 133 (100.0%) | 0 (0.0%) |
| Installation, Maintenance & Repair | 8 (100.0%) | 0 (0.0%) |
| Total (Category) | 141 (92.2%) | 12 (7.8%) |
| Total (Overall) | 1,421 (48.0%) | 1,541 (52.0%) |
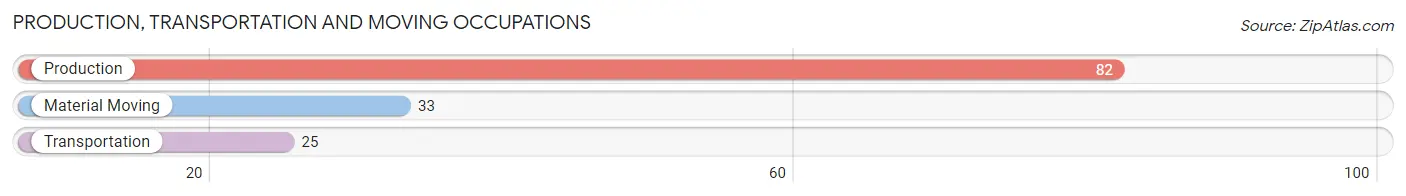
Production, Transportation and Moving Occupations
The most common Production, Transportation and Moving occupations in Salisbury are Production (82 | 2.8%), Material Moving (33 | 1.1%), and Transportation (25 | 0.8%).
Production, Transportation and Moving Occupations by Sex
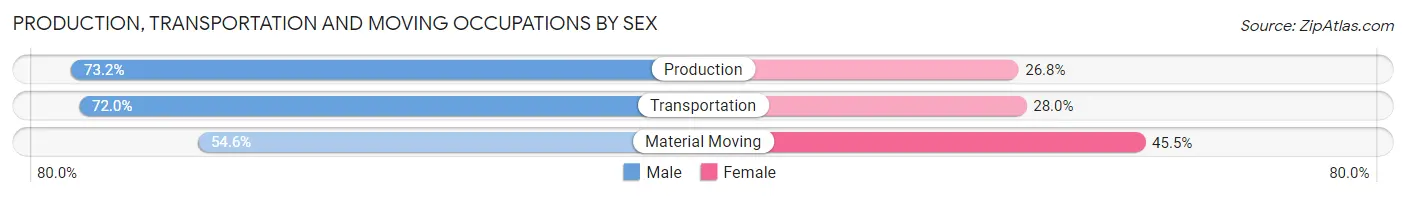
| Occupation | Male | Female |
| Production | 60 (73.2%) | 22 (26.8%) |
| Transportation | 18 (72.0%) | 7 (28.0%) |
| Material Moving | 18 (54.5%) | 15 (45.5%) |
| Total (Category) | 96 (68.6%) | 44 (31.4%) |
| Total (Overall) | 1,421 (48.0%) | 1,541 (52.0%) |
Employment Industries by Sex in Salisbury
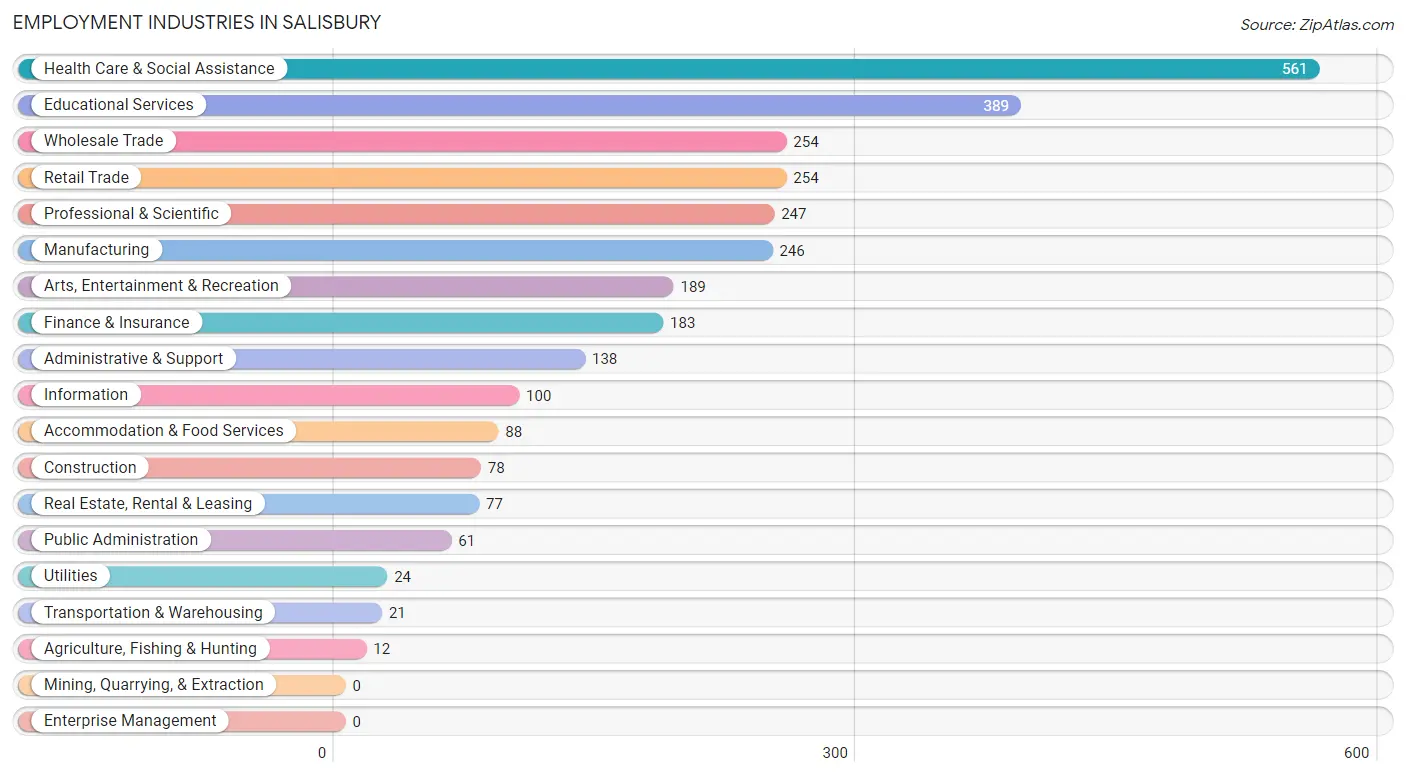
Employment Industries in Salisbury
The major employment industries in Salisbury include Health Care & Social Assistance (561 | 18.9%), Educational Services (389 | 13.1%), Wholesale Trade (254 | 8.6%), Retail Trade (254 | 8.6%), and Professional & Scientific (247 | 8.3%).
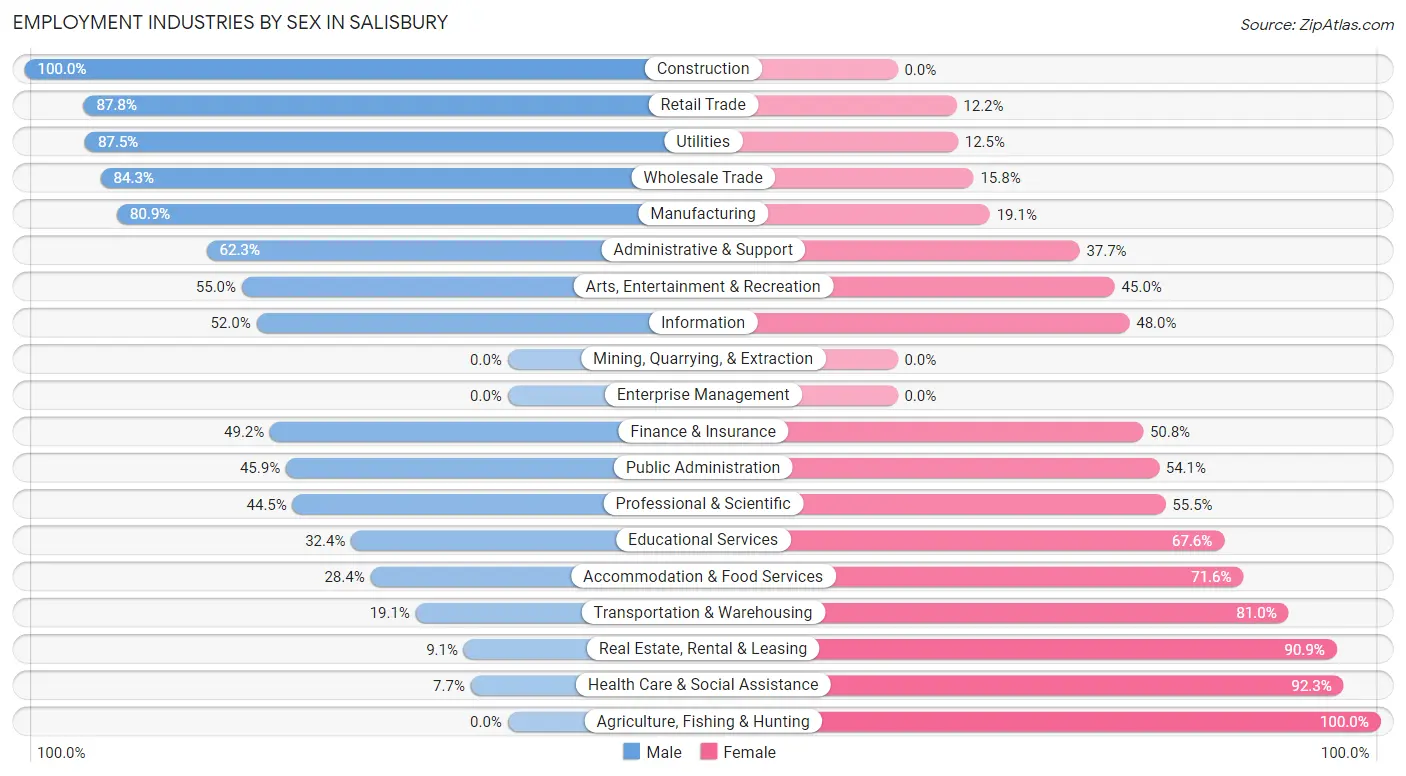
Employment Industries by Sex in Salisbury
The Salisbury industries that see more men than women are Construction (100.0%), Retail Trade (87.8%), and Utilities (87.5%), whereas the industries that tend to have a higher number of women are Agriculture, Fishing & Hunting (100.0%), Health Care & Social Assistance (92.3%), and Real Estate, Rental & Leasing (90.9%).
| Industry | Male | Female |
| Agriculture, Fishing & Hunting | 0 (0.0%) | 12 (100.0%) |
| Mining, Quarrying, & Extraction | 0 (0.0%) | 0 (0.0%) |
| Construction | 78 (100.0%) | 0 (0.0%) |
| Manufacturing | 199 (80.9%) | 47 (19.1%) |
| Wholesale Trade | 214 (84.3%) | 40 (15.8%) |
| Retail Trade | 223 (87.8%) | 31 (12.2%) |
| Transportation & Warehousing | 4 (19.1%) | 17 (80.9%) |
| Utilities | 21 (87.5%) | 3 (12.5%) |
| Information | 52 (52.0%) | 48 (48.0%) |
| Finance & Insurance | 90 (49.2%) | 93 (50.8%) |
| Real Estate, Rental & Leasing | 7 (9.1%) | 70 (90.9%) |
| Professional & Scientific | 110 (44.5%) | 137 (55.5%) |
| Enterprise Management | 0 (0.0%) | 0 (0.0%) |
| Administrative & Support | 86 (62.3%) | 52 (37.7%) |
| Educational Services | 126 (32.4%) | 263 (67.6%) |
| Health Care & Social Assistance | 43 (7.7%) | 518 (92.3%) |
| Arts, Entertainment & Recreation | 104 (55.0%) | 85 (45.0%) |
| Accommodation & Food Services | 25 (28.4%) | 63 (71.6%) |
| Public Administration | 28 (45.9%) | 33 (54.1%) |
| Total | 1,421 (48.0%) | 1,541 (52.0%) |
Education in Salisbury
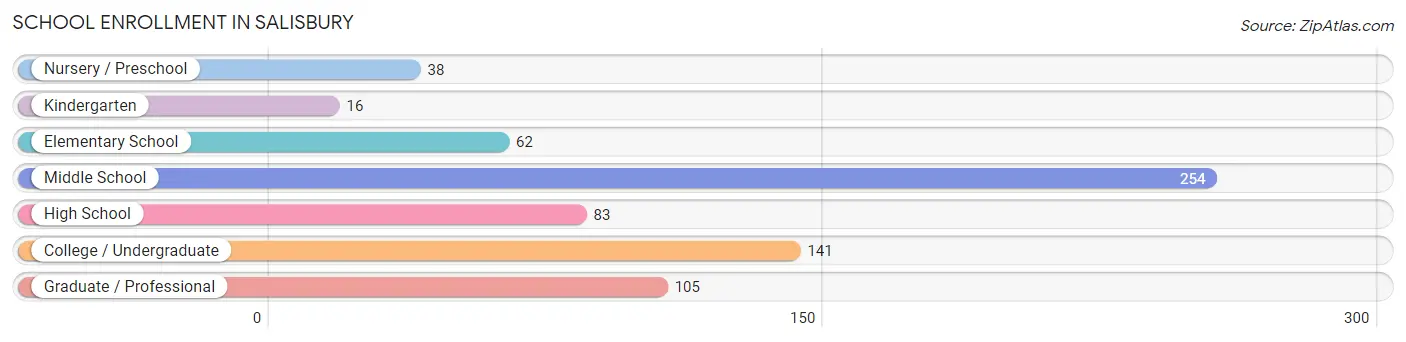
School Enrollment in Salisbury
The most common levels of schooling among the 699 students in Salisbury are middle school (254 | 36.3%), college / undergraduate (141 | 20.2%), and graduate / professional (105 | 15.0%).
| School Level | # Students | % Students |
| Nursery / Preschool | 38 | 5.4% |
| Kindergarten | 16 | 2.3% |
| Elementary School | 62 | 8.9% |
| Middle School | 254 | 36.3% |
| High School | 83 | 11.9% |
| College / Undergraduate | 141 | 20.2% |
| Graduate / Professional | 105 | 15.0% |
| Total | 699 | 100.0% |
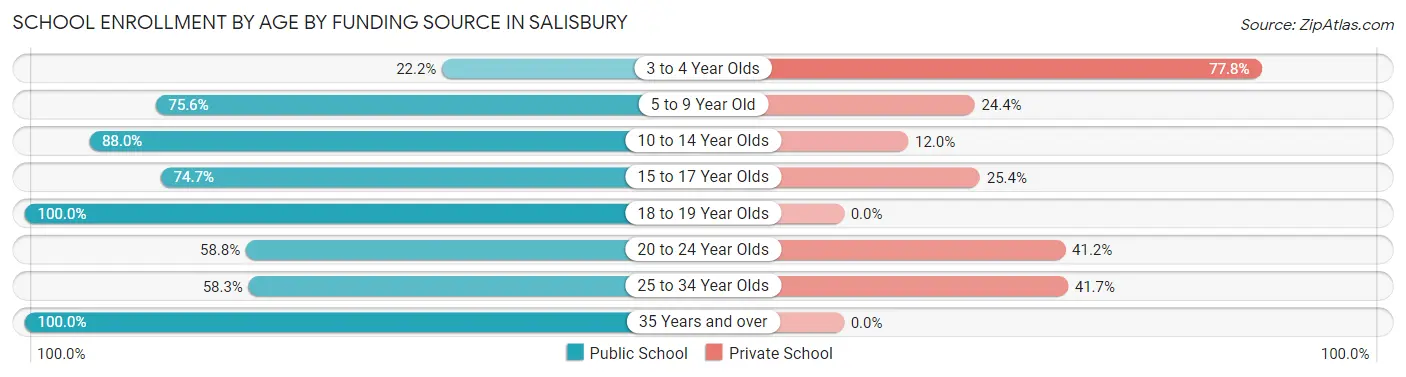
School Enrollment by Age by Funding Source in Salisbury
Out of a total of 699 students who are enrolled in schools in Salisbury, 178 (25.5%) attend a private institution, while the remaining 521 (74.5%) are enrolled in public schools. The age group of 3 to 4 year olds has the highest likelihood of being enrolled in private schools, with 21 (77.8% in the age bracket) enrolled. Conversely, the age group of 18 to 19 year olds has the lowest likelihood of being enrolled in a private school, with 14 (100.0% in the age bracket) attending a public institution.
| Age Bracket | Public School | Private School |
| 3 to 4 Year Olds | 6 (22.2%) | 21 (77.8%) |
| 5 to 9 Year Old | 59 (75.6%) | 19 (24.4%) |
| 10 to 14 Year Olds | 235 (88.0%) | 32 (12.0%) |
| 15 to 17 Year Olds | 53 (74.7%) | 18 (25.4%) |
| 18 to 19 Year Olds | 14 (100.0%) | 0 (0.0%) |
| 20 to 24 Year Olds | 57 (58.8%) | 40 (41.2%) |
| 25 to 34 Year Olds | 67 (58.3%) | 48 (41.7%) |
| 35 Years and over | 30 (100.0%) | 0 (0.0%) |
| Total | 521 (74.5%) | 178 (25.5%) |
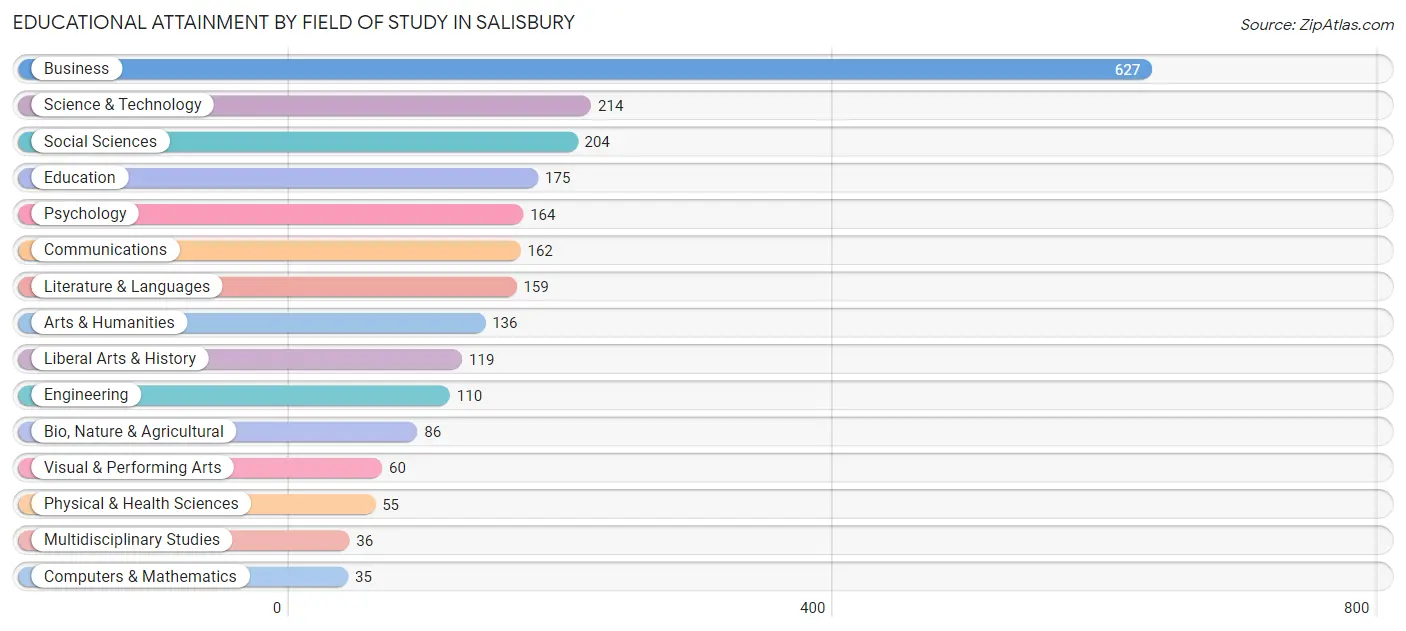
Educational Attainment by Field of Study in Salisbury
Business (627 | 26.8%), science & technology (214 | 9.1%), social sciences (204 | 8.7%), education (175 | 7.5%), and psychology (164 | 7.0%) are the most common fields of study among 2,342 individuals in Salisbury who have obtained a bachelor's degree or higher.
| Field of Study | # Graduates | % Graduates |
| Computers & Mathematics | 35 | 1.5% |
| Bio, Nature & Agricultural | 86 | 3.7% |
| Physical & Health Sciences | 55 | 2.4% |
| Psychology | 164 | 7.0% |
| Social Sciences | 204 | 8.7% |
| Engineering | 110 | 4.7% |
| Multidisciplinary Studies | 36 | 1.5% |
| Science & Technology | 214 | 9.1% |
| Business | 627 | 26.8% |
| Education | 175 | 7.5% |
| Literature & Languages | 159 | 6.8% |
| Liberal Arts & History | 119 | 5.1% |
| Visual & Performing Arts | 60 | 2.6% |
| Communications | 162 | 6.9% |
| Arts & Humanities | 136 | 5.8% |
| Total | 2,342 | 100.0% |
Transportation & Commute in Salisbury
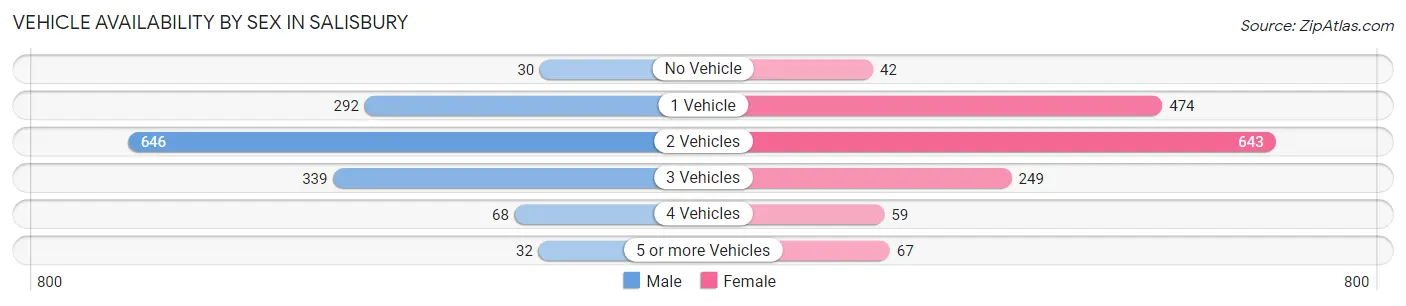
Vehicle Availability by Sex in Salisbury
The most prevalent vehicle ownership categories in Salisbury are males with 2 vehicles (646, accounting for 45.9%) and females with 2 vehicles (643, making up 42.1%).
| Vehicles Available | Male | Female |
| No Vehicle | 30 (2.1%) | 42 (2.7%) |
| 1 Vehicle | 292 (20.7%) | 474 (30.9%) |
| 2 Vehicles | 646 (45.9%) | 643 (41.9%) |
| 3 Vehicles | 339 (24.1%) | 249 (16.2%) |
| 4 Vehicles | 68 (4.8%) | 59 (3.8%) |
| 5 or more Vehicles | 32 (2.3%) | 67 (4.4%) |
| Total | 1,407 (100.0%) | 1,534 (100.0%) |
Commute Time in Salisbury
The most frequently occuring commute durations in Salisbury are 5 to 9 minutes (341 commuters, 14.0%), 15 to 19 minutes (296 commuters, 12.1%), and 10 to 14 minutes (293 commuters, 12.0%).
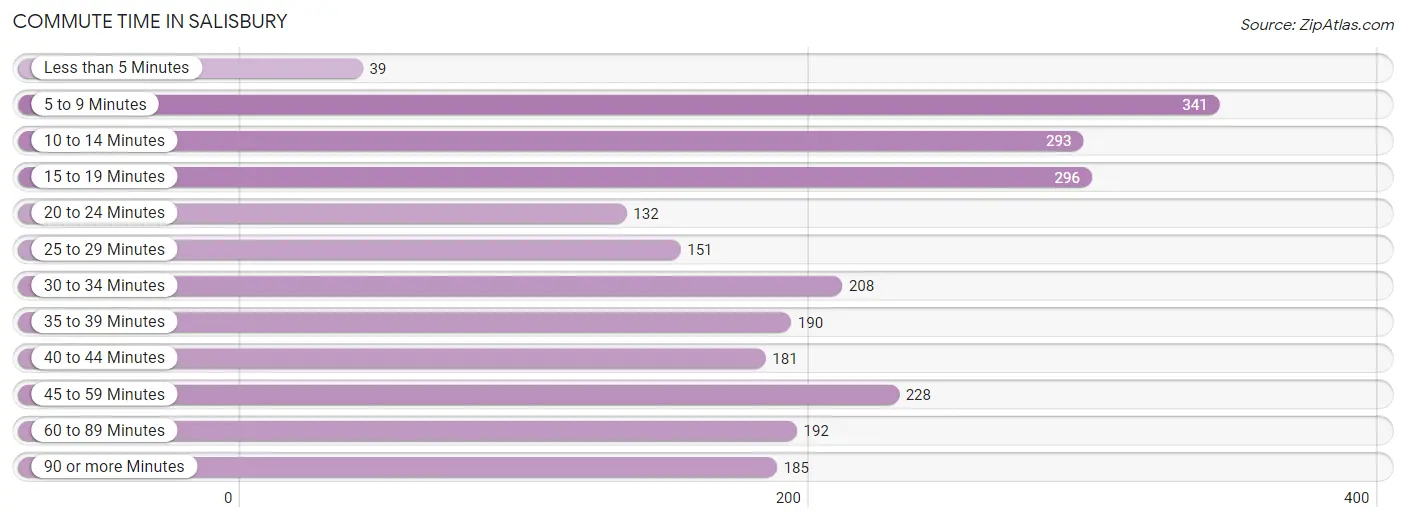
| Commute Time | # Commuters | % Commuters |
| Less than 5 Minutes | 39 | 1.6% |
| 5 to 9 Minutes | 341 | 14.0% |
| 10 to 14 Minutes | 293 | 12.0% |
| 15 to 19 Minutes | 296 | 12.1% |
| 20 to 24 Minutes | 132 | 5.4% |
| 25 to 29 Minutes | 151 | 6.2% |
| 30 to 34 Minutes | 208 | 8.5% |
| 35 to 39 Minutes | 190 | 7.8% |
| 40 to 44 Minutes | 181 | 7.4% |
| 45 to 59 Minutes | 228 | 9.4% |
| 60 to 89 Minutes | 192 | 7.9% |
| 90 or more Minutes | 185 | 7.6% |
Commute Time by Sex in Salisbury
The most common commute times in Salisbury are 10 to 14 minutes (200 commuters, 18.3%) for males and 5 to 9 minutes (296 commuters, 22.0%) for females.
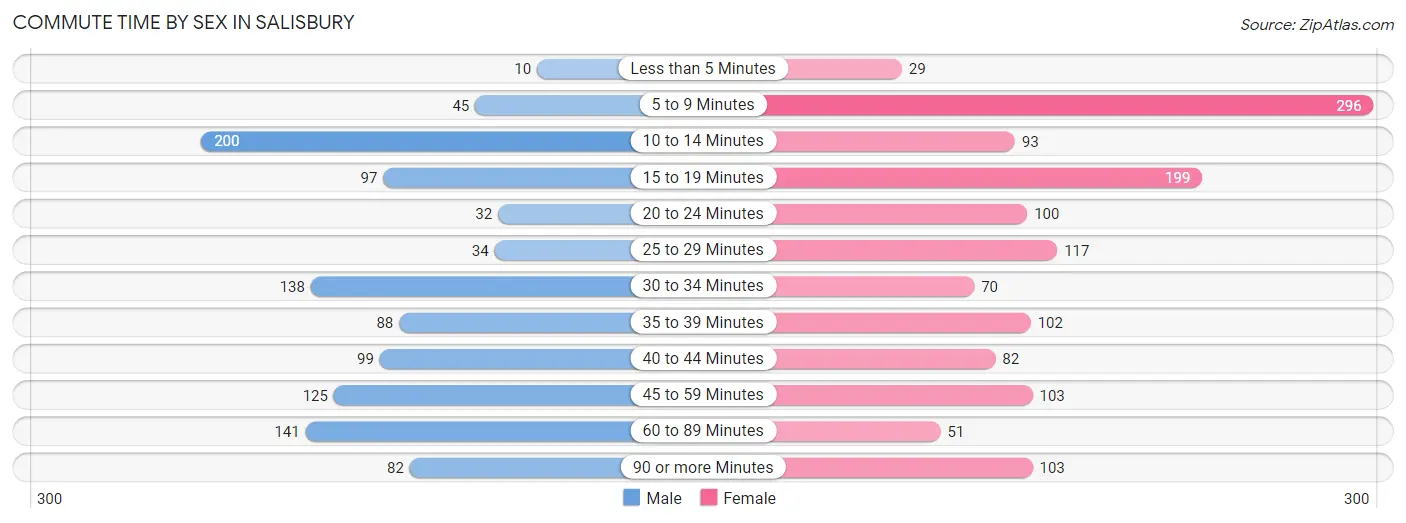
| Commute Time | Male | Female |
| Less than 5 Minutes | 10 (0.9%) | 29 (2.2%) |
| 5 to 9 Minutes | 45 (4.1%) | 296 (22.0%) |
| 10 to 14 Minutes | 200 (18.3%) | 93 (6.9%) |
| 15 to 19 Minutes | 97 (8.9%) | 199 (14.8%) |
| 20 to 24 Minutes | 32 (2.9%) | 100 (7.4%) |
| 25 to 29 Minutes | 34 (3.1%) | 117 (8.7%) |
| 30 to 34 Minutes | 138 (12.7%) | 70 (5.2%) |
| 35 to 39 Minutes | 88 (8.1%) | 102 (7.6%) |
| 40 to 44 Minutes | 99 (9.1%) | 82 (6.1%) |
| 45 to 59 Minutes | 125 (11.5%) | 103 (7.7%) |
| 60 to 89 Minutes | 141 (12.9%) | 51 (3.8%) |
| 90 or more Minutes | 82 (7.5%) | 103 (7.7%) |
Time of Departure to Work by Sex in Salisbury
The most frequent times of departure to work in Salisbury are 7:00 AM to 7:29 AM (195, 17.9%) for males and 8:00 AM to 8:29 AM (311, 23.1%) for females.
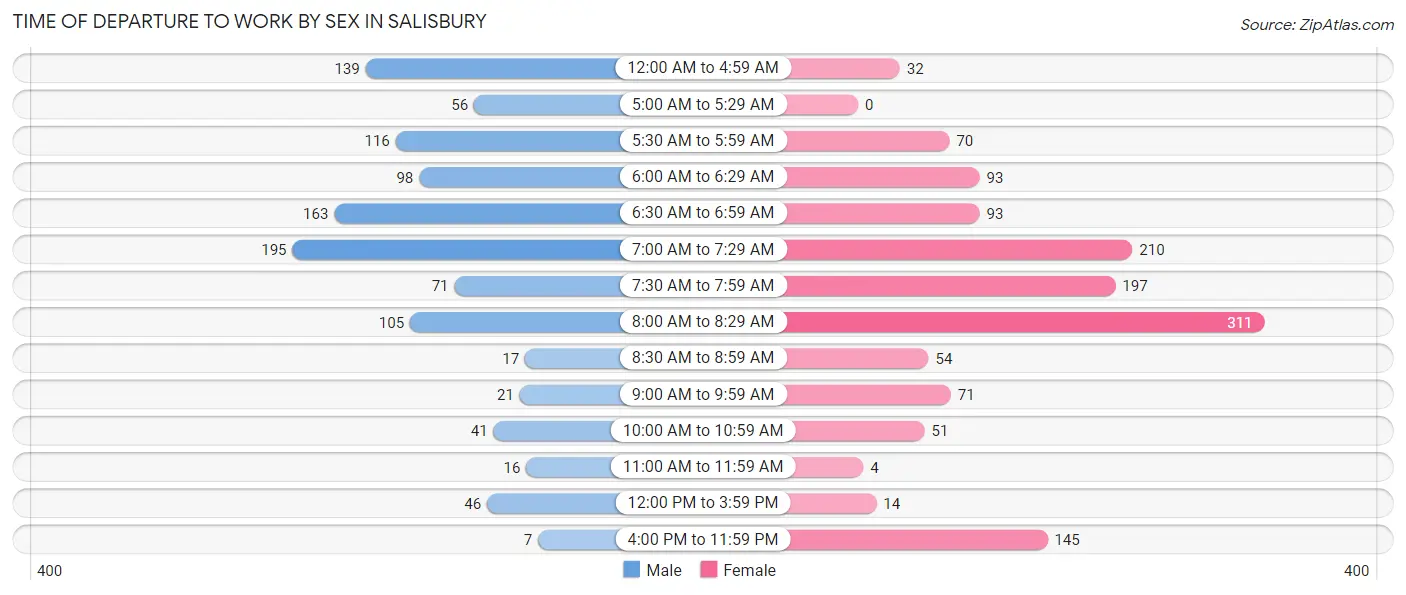
| Time of Departure | Male | Female |
| 12:00 AM to 4:59 AM | 139 (12.7%) | 32 (2.4%) |
| 5:00 AM to 5:29 AM | 56 (5.1%) | 0 (0.0%) |
| 5:30 AM to 5:59 AM | 116 (10.6%) | 70 (5.2%) |
| 6:00 AM to 6:29 AM | 98 (9.0%) | 93 (6.9%) |
| 6:30 AM to 6:59 AM | 163 (14.9%) | 93 (6.9%) |
| 7:00 AM to 7:29 AM | 195 (17.9%) | 210 (15.6%) |
| 7:30 AM to 7:59 AM | 71 (6.5%) | 197 (14.6%) |
| 8:00 AM to 8:29 AM | 105 (9.6%) | 311 (23.1%) |
| 8:30 AM to 8:59 AM | 17 (1.6%) | 54 (4.0%) |
| 9:00 AM to 9:59 AM | 21 (1.9%) | 71 (5.3%) |
| 10:00 AM to 10:59 AM | 41 (3.8%) | 51 (3.8%) |
| 11:00 AM to 11:59 AM | 16 (1.5%) | 4 (0.3%) |
| 12:00 PM to 3:59 PM | 46 (4.2%) | 14 (1.0%) |
| 4:00 PM to 11:59 PM | 7 (0.6%) | 145 (10.8%) |
| Total | 1,091 (100.0%) | 1,345 (100.0%) |
Housing Occupancy in Salisbury
Occupancy by Ownership in Salisbury
Of the total 2,695 dwellings in Salisbury, owner-occupied units account for 1,915 (71.1%), while renter-occupied units make up 780 (28.9%).
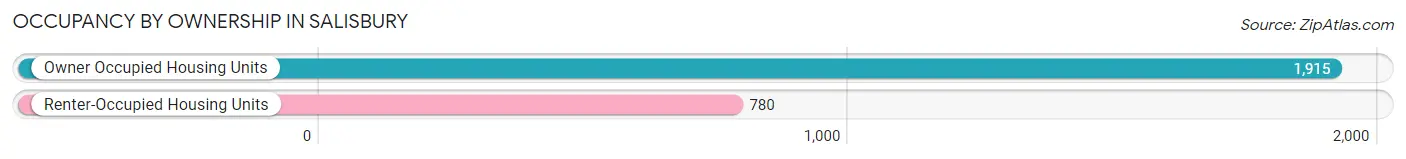
| Occupancy | # Housing Units | % Housing Units |
| Owner Occupied Housing Units | 1,915 | 71.1% |
| Renter-Occupied Housing Units | 780 | 28.9% |
| Total Occupied Housing Units | 2,695 | 100.0% |
Occupancy by Household Size in Salisbury
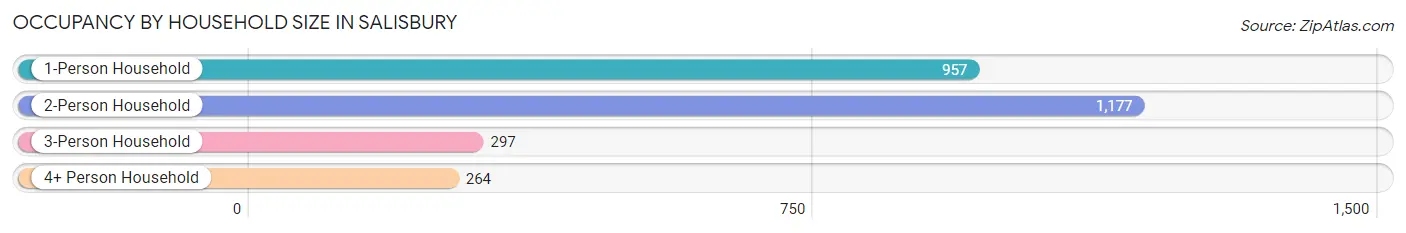
| Household Size | # Housing Units | % Housing Units |
| 1-Person Household | 957 | 35.5% |
| 2-Person Household | 1,177 | 43.7% |
| 3-Person Household | 297 | 11.0% |
| 4+ Person Household | 264 | 9.8% |
| Total Housing Units | 2,695 | 100.0% |
Occupancy by Ownership by Household Size in Salisbury
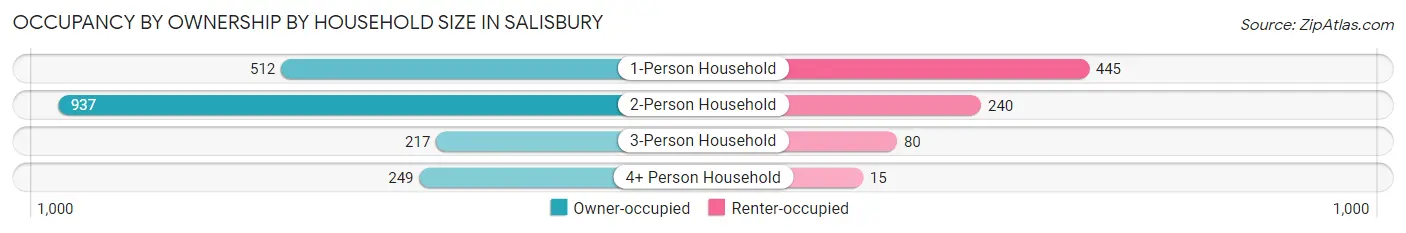
| Household Size | Owner-occupied | Renter-occupied |
| 1-Person Household | 512 (53.5%) | 445 (46.5%) |
| 2-Person Household | 937 (79.6%) | 240 (20.4%) |
| 3-Person Household | 217 (73.1%) | 80 (26.9%) |
| 4+ Person Household | 249 (94.3%) | 15 (5.7%) |
| Total Housing Units | 1,915 (71.1%) | 780 (28.9%) |
Occupancy by Educational Attainment in Salisbury
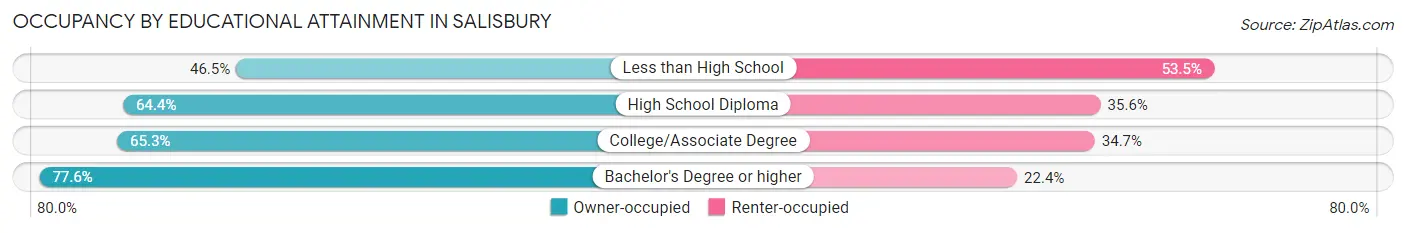
| Household Size | Owner-occupied | Renter-occupied |
| Less than High School | 59 (46.5%) | 68 (53.5%) |
| High School Diploma | 302 (64.4%) | 167 (35.6%) |
| College/Associate Degree | 401 (65.3%) | 213 (34.7%) |
| Bachelor's Degree or higher | 1,153 (77.6%) | 332 (22.4%) |
Occupancy by Age of Householder in Salisbury
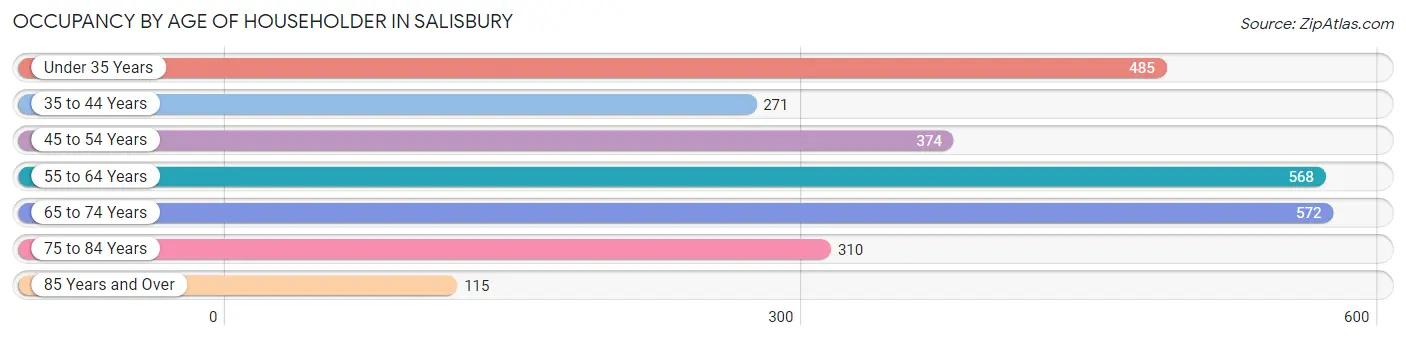
| Age Bracket | # Households | % Households |
| Under 35 Years | 485 | 18.0% |
| 35 to 44 Years | 271 | 10.1% |
| 45 to 54 Years | 374 | 13.9% |
| 55 to 64 Years | 568 | 21.1% |
| 65 to 74 Years | 572 | 21.2% |
| 75 to 84 Years | 310 | 11.5% |
| 85 Years and Over | 115 | 4.3% |
| Total | 2,695 | 100.0% |
Housing Finances in Salisbury
Median Income by Occupancy in Salisbury
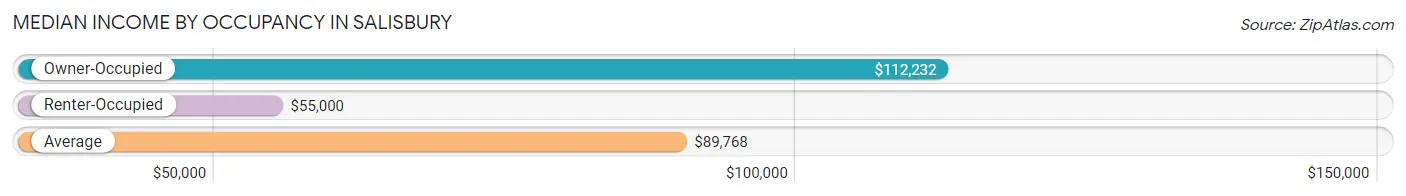
| Occupancy Type | # Households | Median Income |
| Owner-Occupied | 1,915 (71.1%) | $112,232 |
| Renter-Occupied | 780 (28.9%) | $55,000 |
| Average | 2,695 (100.0%) | $89,768 |
Occupancy by Householder Income Bracket in Salisbury
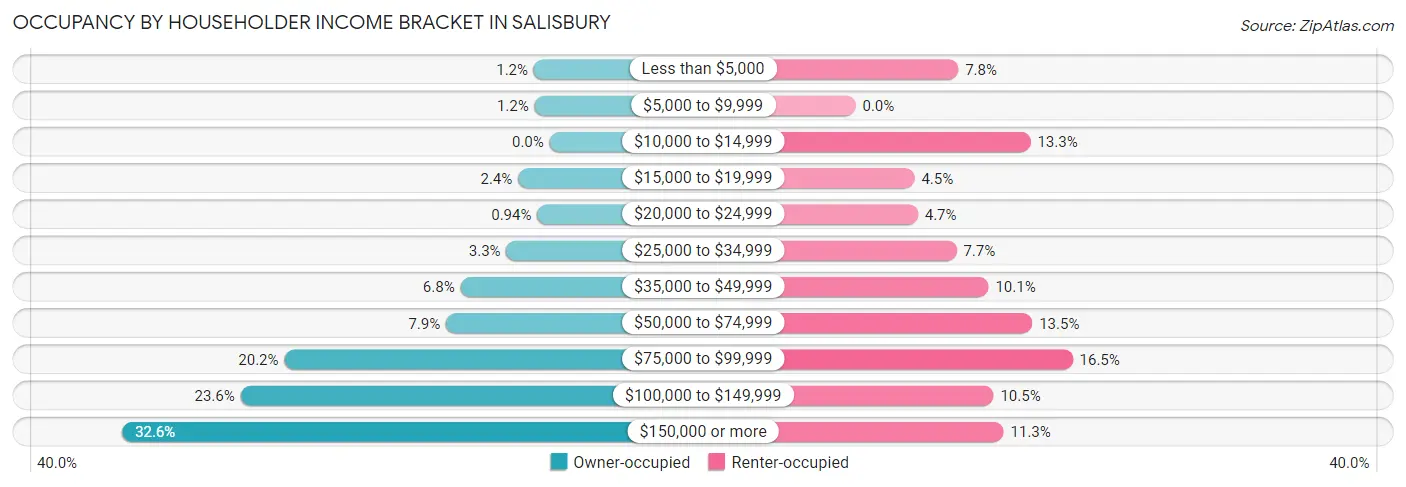
| Income Bracket | Owner-occupied | Renter-occupied |
| Less than $5,000 | 23 (1.2%) | 61 (7.8%) |
| $5,000 to $9,999 | 22 (1.1%) | 0 (0.0%) |
| $10,000 to $14,999 | 0 (0.0%) | 104 (13.3%) |
| $15,000 to $19,999 | 46 (2.4%) | 35 (4.5%) |
| $20,000 to $24,999 | 18 (0.9%) | 37 (4.7%) |
| $25,000 to $34,999 | 63 (3.3%) | 60 (7.7%) |
| $35,000 to $49,999 | 130 (6.8%) | 79 (10.1%) |
| $50,000 to $74,999 | 151 (7.9%) | 105 (13.5%) |
| $75,000 to $99,999 | 387 (20.2%) | 129 (16.5%) |
| $100,000 to $149,999 | 451 (23.5%) | 82 (10.5%) |
| $150,000 or more | 624 (32.6%) | 88 (11.3%) |
| Total | 1,915 (100.0%) | 780 (100.0%) |
Monthly Housing Cost Tiers in Salisbury
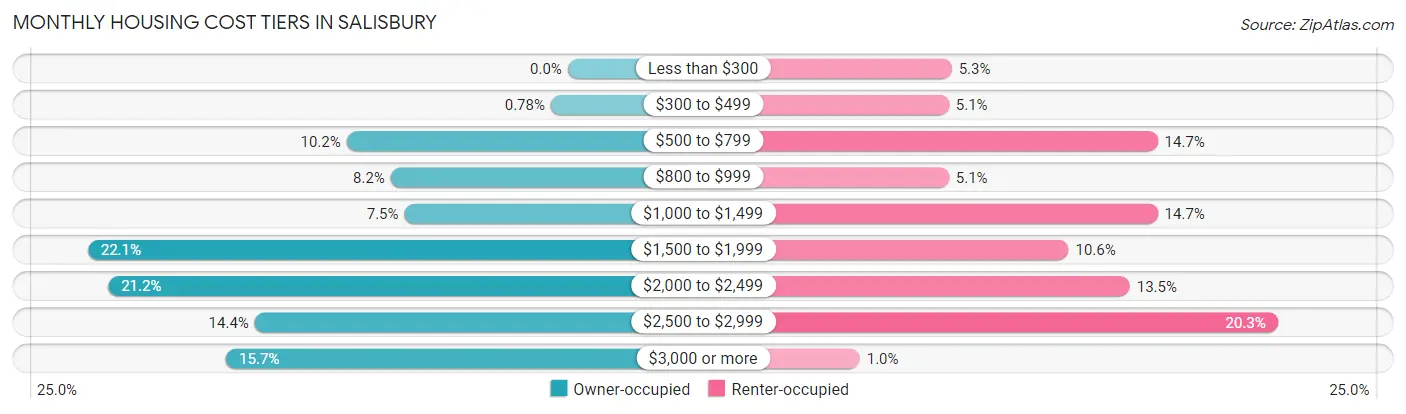
| Monthly Cost | Owner-occupied | Renter-occupied |
| Less than $300 | 0 (0.0%) | 41 (5.3%) |
| $300 to $499 | 15 (0.8%) | 40 (5.1%) |
| $500 to $799 | 195 (10.2%) | 115 (14.7%) |
| $800 to $999 | 156 (8.2%) | 40 (5.1%) |
| $1,000 to $1,499 | 144 (7.5%) | 115 (14.7%) |
| $1,500 to $1,999 | 423 (22.1%) | 83 (10.6%) |
| $2,000 to $2,499 | 405 (21.1%) | 105 (13.5%) |
| $2,500 to $2,999 | 276 (14.4%) | 158 (20.3%) |
| $3,000 or more | 301 (15.7%) | 8 (1.0%) |
| Total | 1,915 (100.0%) | 780 (100.0%) |
Physical Housing Characteristics in Salisbury
Housing Structures in Salisbury
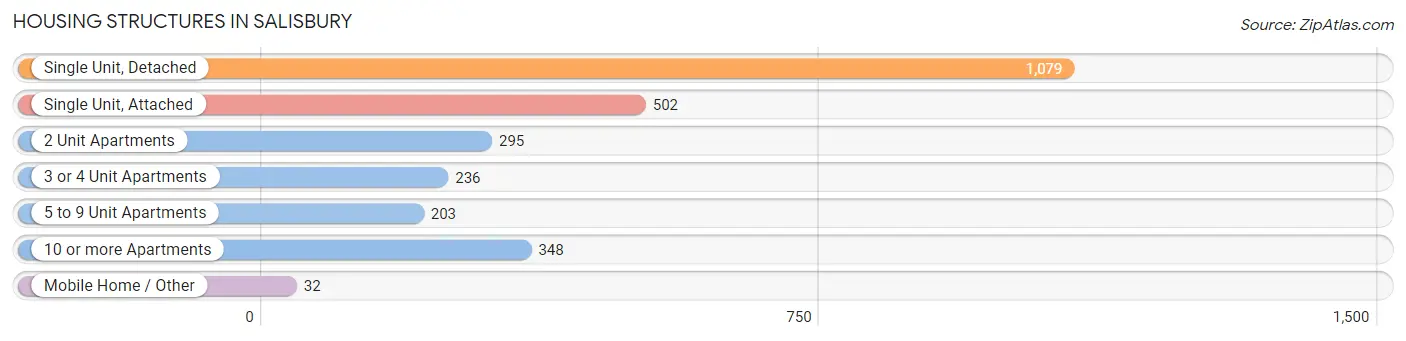
| Structure Type | # Housing Units | % Housing Units |
| Single Unit, Detached | 1,079 | 40.0% |
| Single Unit, Attached | 502 | 18.6% |
| 2 Unit Apartments | 295 | 11.0% |
| 3 or 4 Unit Apartments | 236 | 8.8% |
| 5 to 9 Unit Apartments | 203 | 7.5% |
| 10 or more Apartments | 348 | 12.9% |
| Mobile Home / Other | 32 | 1.2% |
| Total | 2,695 | 100.0% |
Housing Structures by Occupancy in Salisbury
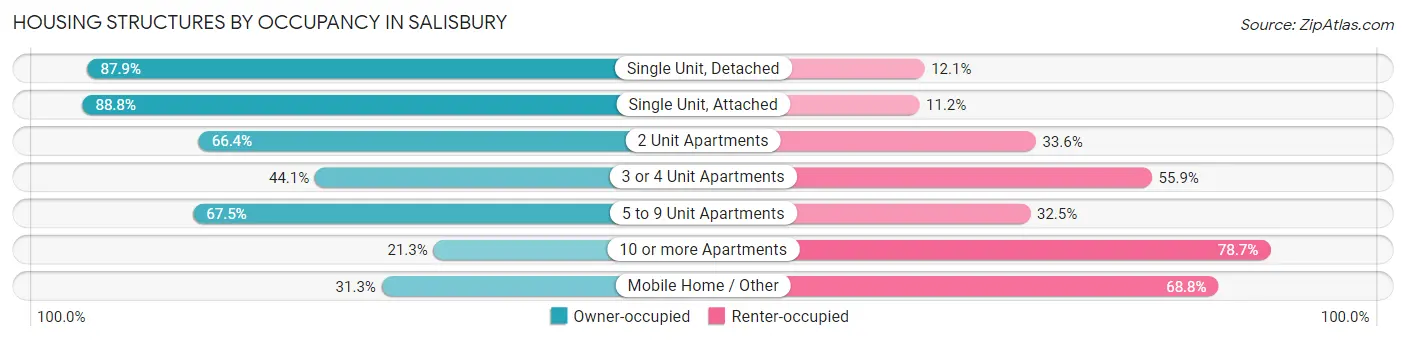
| Structure Type | Owner-occupied | Renter-occupied |
| Single Unit, Detached | 948 (87.9%) | 131 (12.1%) |
| Single Unit, Attached | 446 (88.8%) | 56 (11.2%) |
| 2 Unit Apartments | 196 (66.4%) | 99 (33.6%) |
| 3 or 4 Unit Apartments | 104 (44.1%) | 132 (55.9%) |
| 5 to 9 Unit Apartments | 137 (67.5%) | 66 (32.5%) |
| 10 or more Apartments | 74 (21.3%) | 274 (78.7%) |
| Mobile Home / Other | 10 (31.2%) | 22 (68.8%) |
| Total | 1,915 (71.1%) | 780 (28.9%) |
Housing Structures by Number of Rooms in Salisbury
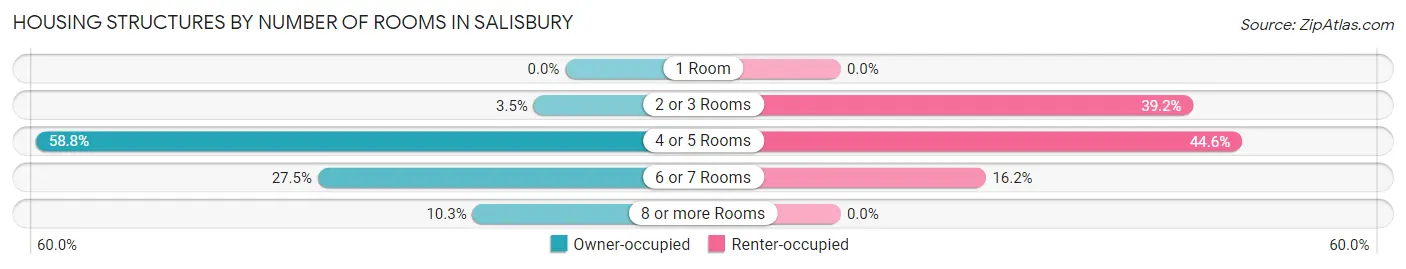
| Number of Rooms | Owner-occupied | Renter-occupied |
| 1 Room | 0 (0.0%) | 0 (0.0%) |
| 2 or 3 Rooms | 67 (3.5%) | 306 (39.2%) |
| 4 or 5 Rooms | 1,125 (58.8%) | 348 (44.6%) |
| 6 or 7 Rooms | 526 (27.5%) | 126 (16.2%) |
| 8 or more Rooms | 197 (10.3%) | 0 (0.0%) |
| Total | 1,915 (100.0%) | 780 (100.0%) |
Housing Structure by Heating Type in Salisbury
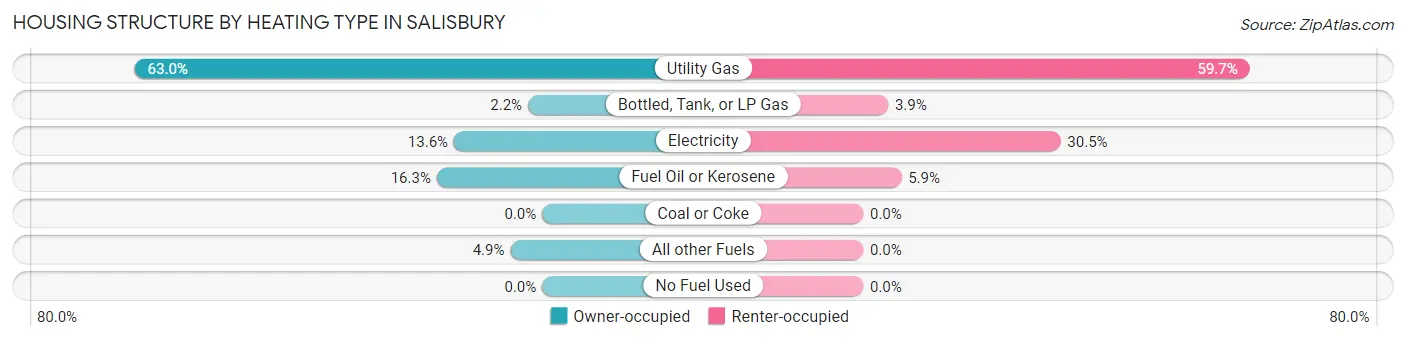
| Heating Type | Owner-occupied | Renter-occupied |
| Utility Gas | 1,206 (63.0%) | 466 (59.7%) |
| Bottled, Tank, or LP Gas | 42 (2.2%) | 30 (3.8%) |
| Electricity | 261 (13.6%) | 238 (30.5%) |
| Fuel Oil or Kerosene | 312 (16.3%) | 46 (5.9%) |
| Coal or Coke | 0 (0.0%) | 0 (0.0%) |
| All other Fuels | 94 (4.9%) | 0 (0.0%) |
| No Fuel Used | 0 (0.0%) | 0 (0.0%) |
| Total | 1,915 (100.0%) | 780 (100.0%) |
Household Vehicle Usage in Salisbury
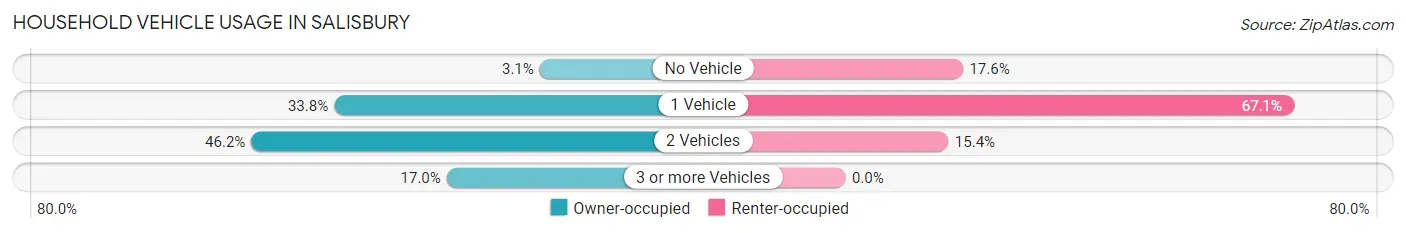
| Vehicles per Household | Owner-occupied | Renter-occupied |
| No Vehicle | 59 (3.1%) | 137 (17.6%) |
| 1 Vehicle | 647 (33.8%) | 523 (67.0%) |
| 2 Vehicles | 884 (46.2%) | 120 (15.4%) |
| 3 or more Vehicles | 325 (17.0%) | 0 (0.0%) |
| Total | 1,915 (100.0%) | 780 (100.0%) |
Real Estate & Mortgages in Salisbury
Real Estate and Mortgage Overview in Salisbury
| Characteristic | Without Mortgage | With Mortgage |
| Housing Units | 532 | 1,383 |
| Median Property Value | $415,600 | $430,400 |
| Median Household Income | $83,889 | $486 |
| Monthly Housing Costs | $908 | $273 |
| Real Estate Taxes | $4,796 | $6 |
Property Value by Mortgage Status in Salisbury
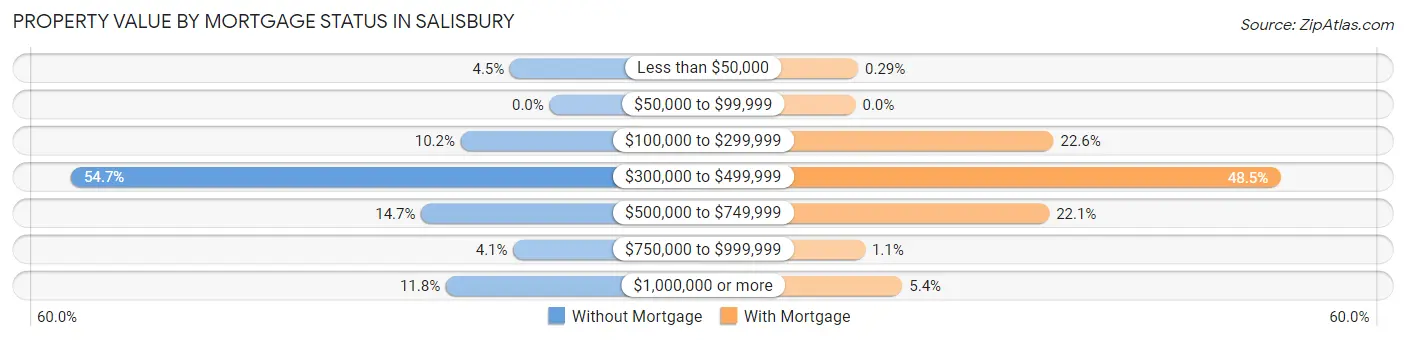
| Property Value | Without Mortgage | With Mortgage |
| Less than $50,000 | 24 (4.5%) | 4 (0.3%) |
| $50,000 to $99,999 | 0 (0.0%) | 0 (0.0%) |
| $100,000 to $299,999 | 54 (10.2%) | 313 (22.6%) |
| $300,000 to $499,999 | 291 (54.7%) | 671 (48.5%) |
| $500,000 to $749,999 | 78 (14.7%) | 306 (22.1%) |
| $750,000 to $999,999 | 22 (4.1%) | 15 (1.1%) |
| $1,000,000 or more | 63 (11.8%) | 74 (5.3%) |
| Total | 532 (100.0%) | 1,383 (100.0%) |
Household Income by Mortgage Status in Salisbury
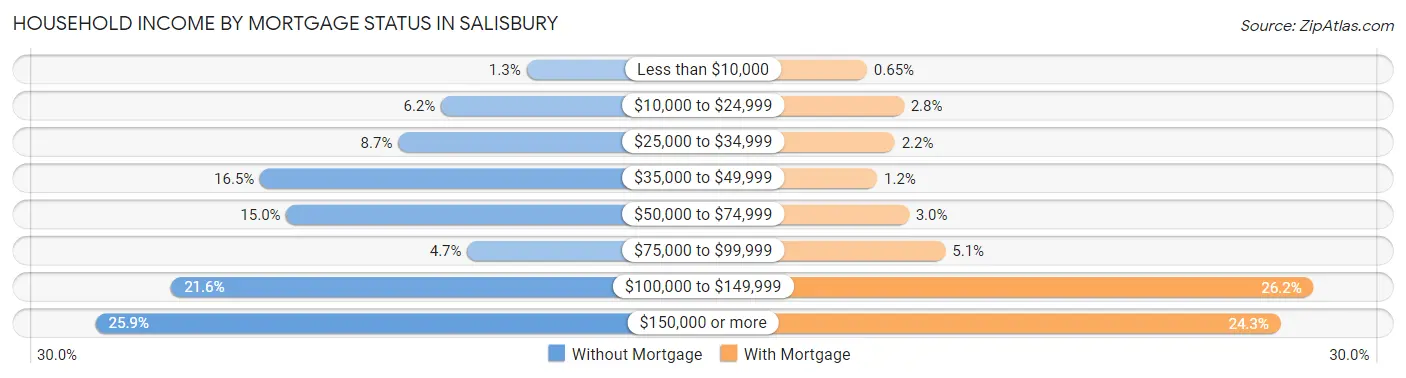
| Household Income | Without Mortgage | With Mortgage |
| Less than $10,000 | 7 (1.3%) | 9 (0.6%) |
| $10,000 to $24,999 | 33 (6.2%) | 38 (2.8%) |
| $25,000 to $34,999 | 46 (8.6%) | 31 (2.2%) |
| $35,000 to $49,999 | 88 (16.5%) | 17 (1.2%) |
| $50,000 to $74,999 | 80 (15.0%) | 42 (3.0%) |
| $75,000 to $99,999 | 25 (4.7%) | 71 (5.1%) |
| $100,000 to $149,999 | 115 (21.6%) | 362 (26.2%) |
| $150,000 or more | 138 (25.9%) | 336 (24.3%) |
| Total | 532 (100.0%) | 1,383 (100.0%) |
Property Value to Household Income Ratio in Salisbury
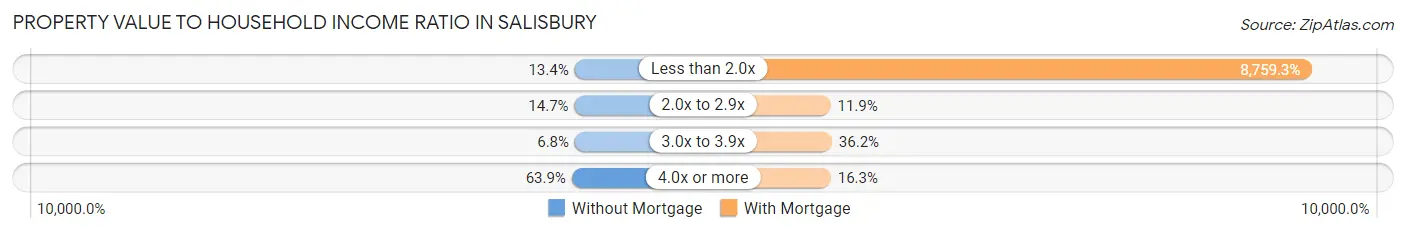
| Value-to-Income Ratio | Without Mortgage | With Mortgage |
| Less than 2.0x | 71 (13.4%) | 121,141 (8,759.3%) |
| 2.0x to 2.9x | 78 (14.7%) | 164 (11.9%) |
| 3.0x to 3.9x | 36 (6.8%) | 501 (36.2%) |
| 4.0x or more | 340 (63.9%) | 226 (16.3%) |
| Total | 532 (100.0%) | 1,383 (100.0%) |
Real Estate Taxes by Mortgage Status in Salisbury
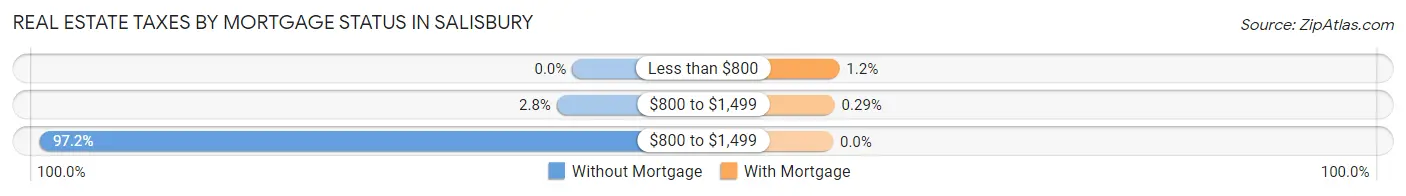
| Property Taxes | Without Mortgage | With Mortgage |
| Less than $800 | 0 (0.0%) | 16 (1.2%) |
| $800 to $1,499 | 15 (2.8%) | 4 (0.3%) |
| $800 to $1,499 | 517 (97.2%) | 0 (0.0%) |
| Total | 532 (100.0%) | 1,383 (100.0%) |
Health & Disability in Salisbury
Health Insurance Coverage by Age in Salisbury
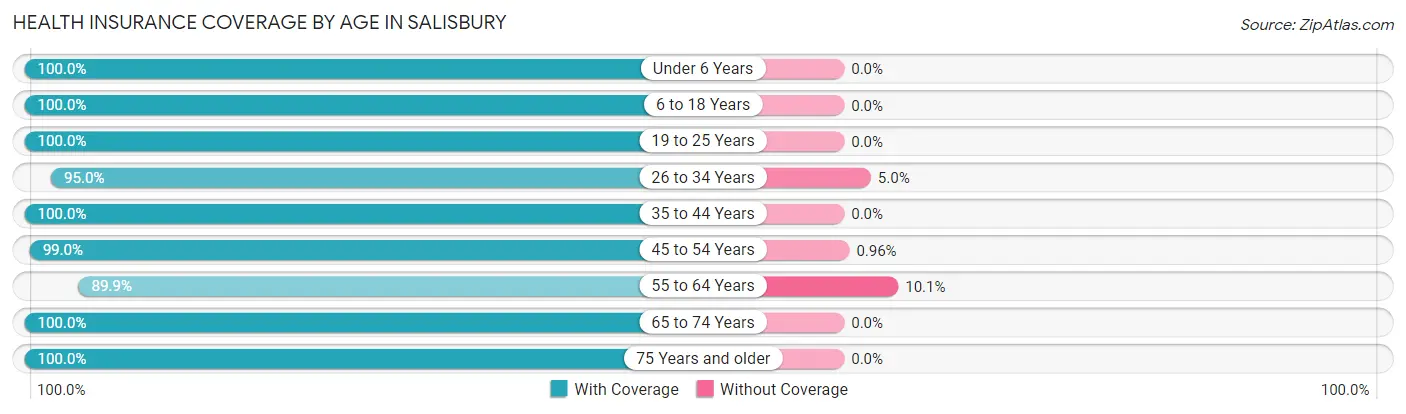
| Age Bracket | With Coverage | Without Coverage |
| Under 6 Years | 203 (100.0%) | 0 (0.0%) |
| 6 to 18 Years | 435 (100.0%) | 0 (0.0%) |
| 19 to 25 Years | 504 (100.0%) | 0 (0.0%) |
| 26 to 34 Years | 498 (95.0%) | 26 (5.0%) |
| 35 to 44 Years | 553 (100.0%) | 0 (0.0%) |
| 45 to 54 Years | 618 (99.0%) | 6 (1.0%) |
| 55 to 64 Years | 848 (89.9%) | 95 (10.1%) |
| 65 to 74 Years | 858 (100.0%) | 0 (0.0%) |
| 75 Years and older | 625 (100.0%) | 0 (0.0%) |
| Total | 5,142 (97.6%) | 127 (2.4%) |
Health Insurance Coverage by Citizenship Status in Salisbury
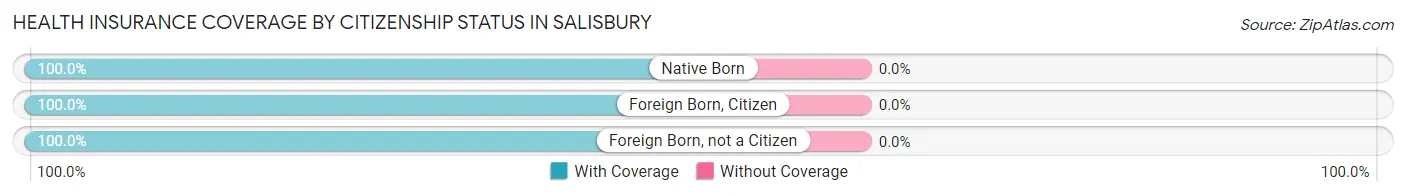
| Citizenship Status | With Coverage | Without Coverage |
| Native Born | 203 (100.0%) | 0 (0.0%) |
| Foreign Born, Citizen | 435 (100.0%) | 0 (0.0%) |
| Foreign Born, not a Citizen | 504 (100.0%) | 0 (0.0%) |
Health Insurance Coverage by Household Income in Salisbury
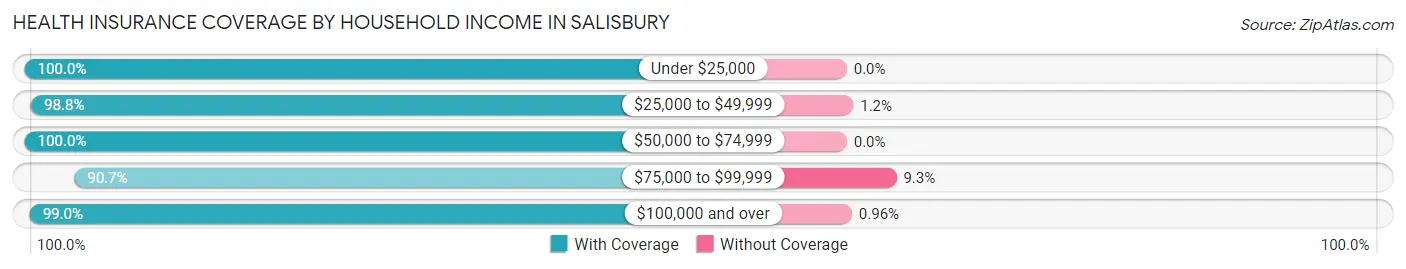
| Household Income | With Coverage | Without Coverage |
| Under $25,000 | 432 (100.0%) | 0 (0.0%) |
| $25,000 to $49,999 | 484 (98.8%) | 6 (1.2%) |
| $50,000 to $74,999 | 423 (100.0%) | 0 (0.0%) |
| $75,000 to $99,999 | 906 (90.7%) | 93 (9.3%) |
| $100,000 and over | 2,897 (99.0%) | 28 (1.0%) |
Public vs Private Health Insurance Coverage by Age in Salisbury
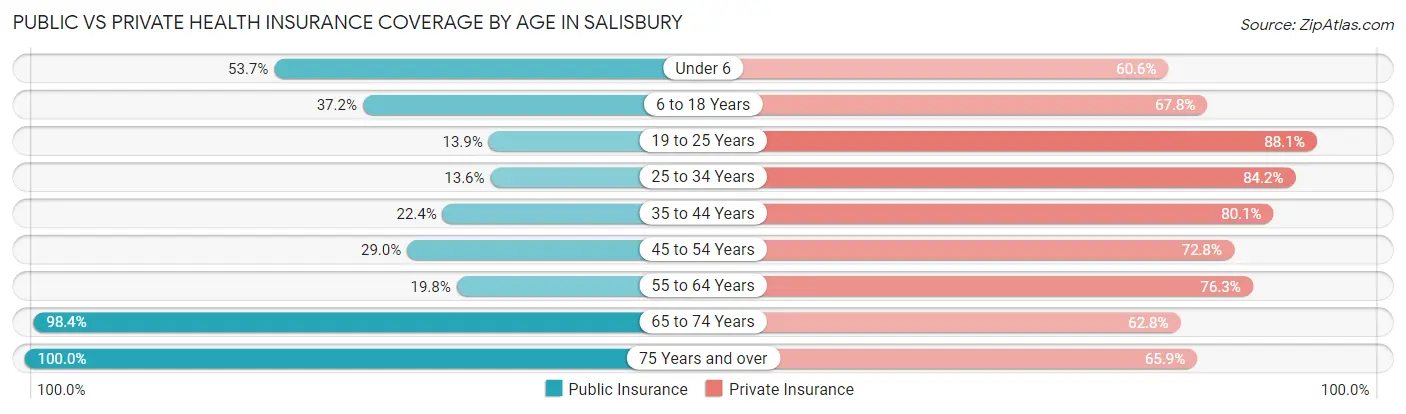
| Age Bracket | Public Insurance | Private Insurance |
| Under 6 | 109 (53.7%) | 123 (60.6%) |
| 6 to 18 Years | 162 (37.2%) | 295 (67.8%) |
| 19 to 25 Years | 70 (13.9%) | 444 (88.1%) |
| 25 to 34 Years | 71 (13.6%) | 441 (84.2%) |
| 35 to 44 Years | 124 (22.4%) | 443 (80.1%) |
| 45 to 54 Years | 181 (29.0%) | 454 (72.8%) |
| 55 to 64 Years | 187 (19.8%) | 719 (76.2%) |
| 65 to 74 Years | 844 (98.4%) | 539 (62.8%) |
| 75 Years and over | 625 (100.0%) | 412 (65.9%) |
| Total | 2,373 (45.0%) | 3,870 (73.5%) |
Disability Status by Sex by Age in Salisbury
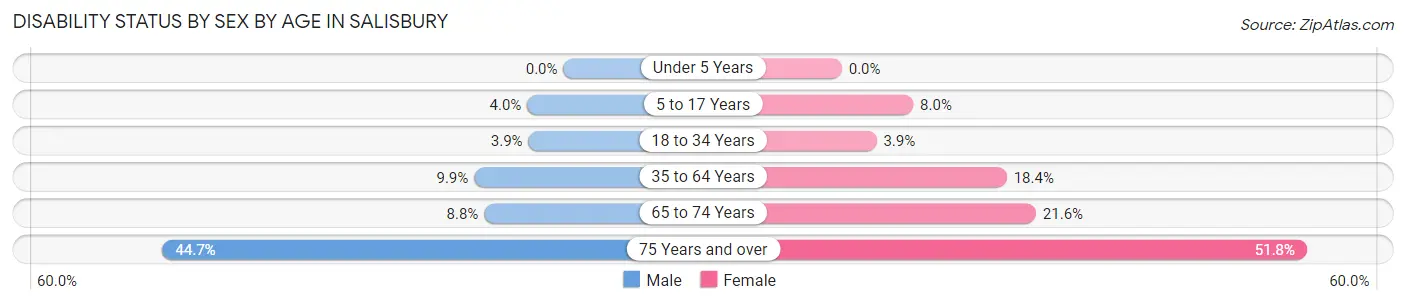
| Age Bracket | Male | Female |
| Under 5 Years | 0 (0.0%) | 0 (0.0%) |
| 5 to 17 Years | 10 (4.0%) | 14 (8.0%) |
| 18 to 34 Years | 20 (3.9%) | 21 (3.9%) |
| 35 to 64 Years | 96 (9.9%) | 212 (18.4%) |
| 65 to 74 Years | 32 (8.8%) | 107 (21.6%) |
| 75 Years and over | 142 (44.7%) | 159 (51.8%) |
Disability Class by Sex by Age in Salisbury
Disability Class: Hearing Difficulty
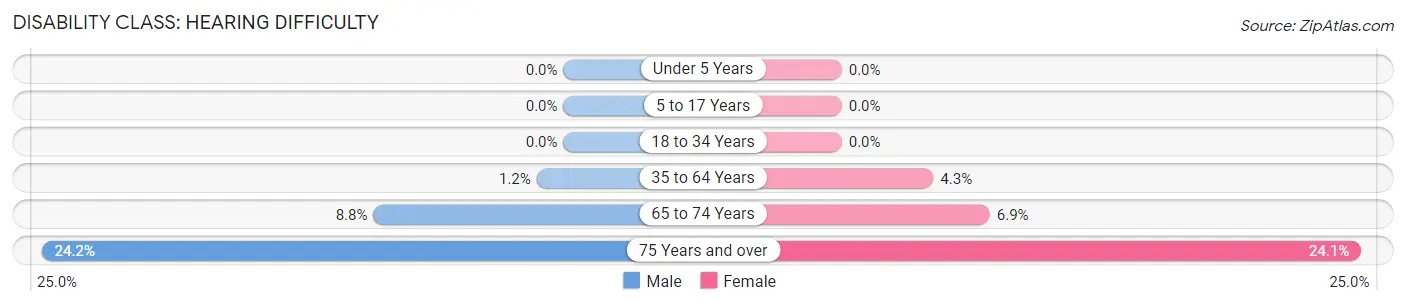
| Age Bracket | Male | Female |
| Under 5 Years | 0 (0.0%) | 0 (0.0%) |
| 5 to 17 Years | 0 (0.0%) | 0 (0.0%) |
| 18 to 34 Years | 0 (0.0%) | 0 (0.0%) |
| 35 to 64 Years | 12 (1.2%) | 49 (4.3%) |
| 65 to 74 Years | 32 (8.8%) | 34 (6.9%) |
| 75 Years and over | 77 (24.2%) | 74 (24.1%) |
Disability Class: Vision Difficulty
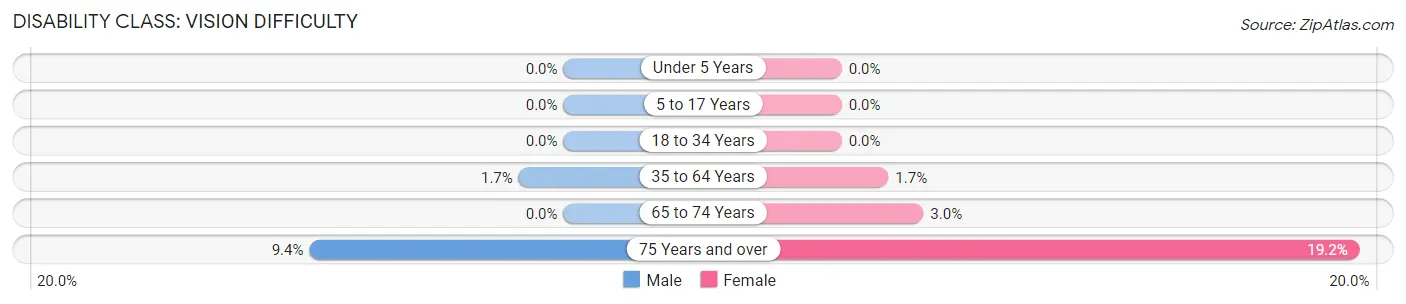
| Age Bracket | Male | Female |
| Under 5 Years | 0 (0.0%) | 0 (0.0%) |
| 5 to 17 Years | 0 (0.0%) | 0 (0.0%) |
| 18 to 34 Years | 0 (0.0%) | 0 (0.0%) |
| 35 to 64 Years | 16 (1.7%) | 20 (1.7%) |
| 65 to 74 Years | 0 (0.0%) | 15 (3.0%) |
| 75 Years and over | 30 (9.4%) | 59 (19.2%) |
Disability Class: Cognitive Difficulty
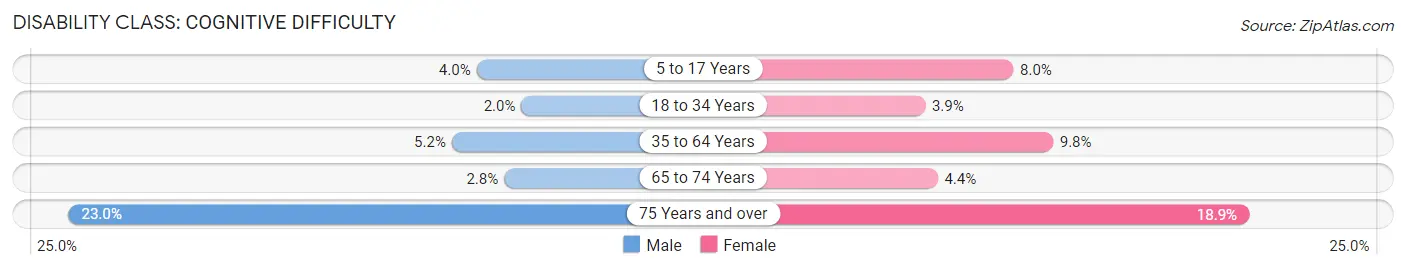
| Age Bracket | Male | Female |
| 5 to 17 Years | 10 (4.0%) | 14 (8.0%) |
| 18 to 34 Years | 10 (1.9%) | 21 (3.9%) |
| 35 to 64 Years | 50 (5.2%) | 113 (9.8%) |
| 65 to 74 Years | 10 (2.8%) | 22 (4.4%) |
| 75 Years and over | 73 (23.0%) | 58 (18.9%) |
Disability Class: Ambulatory Difficulty
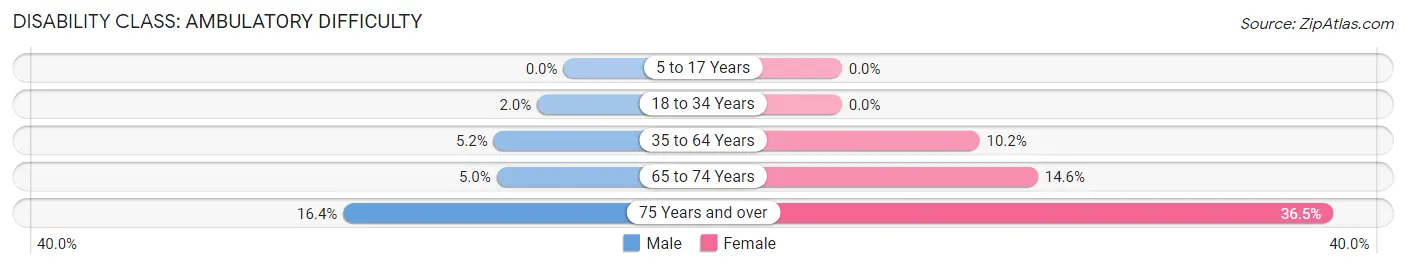
| Age Bracket | Male | Female |
| 5 to 17 Years | 0 (0.0%) | 0 (0.0%) |
| 18 to 34 Years | 10 (1.9%) | 0 (0.0%) |
| 35 to 64 Years | 50 (5.2%) | 118 (10.2%) |
| 65 to 74 Years | 18 (5.0%) | 72 (14.5%) |
| 75 Years and over | 52 (16.4%) | 112 (36.5%) |
Disability Class: Self-Care Difficulty
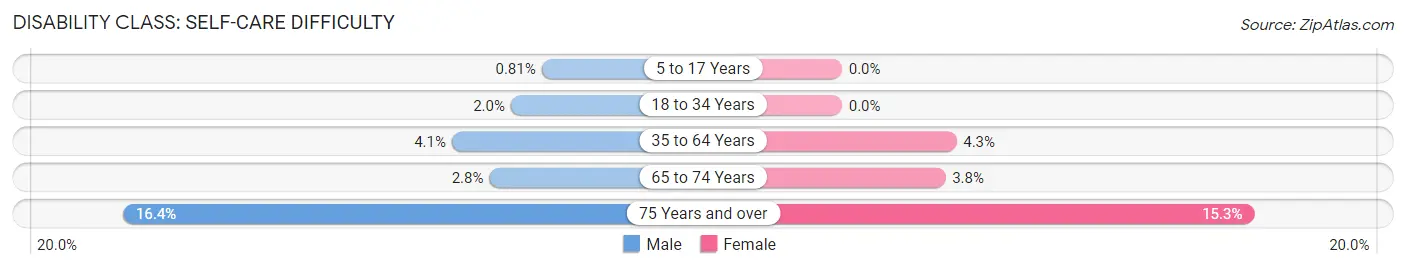
| Age Bracket | Male | Female |
| 5 to 17 Years | 2 (0.8%) | 0 (0.0%) |
| 18 to 34 Years | 10 (1.9%) | 0 (0.0%) |
| 35 to 64 Years | 40 (4.1%) | 49 (4.3%) |
| 65 to 74 Years | 10 (2.8%) | 19 (3.8%) |
| 75 Years and over | 52 (16.4%) | 47 (15.3%) |
Technology Access in Salisbury
Computing Device Access in Salisbury
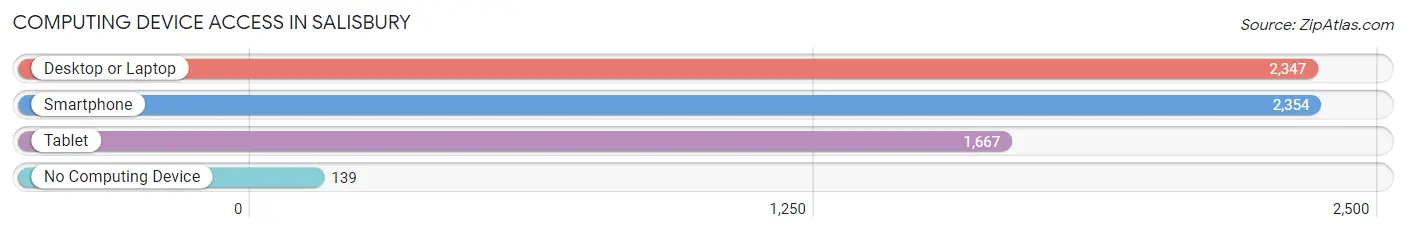
| Device Type | # Households | % Households |
| Desktop or Laptop | 2,347 | 87.1% |
| Smartphone | 2,354 | 87.4% |
| Tablet | 1,667 | 61.9% |
| No Computing Device | 139 | 5.2% |
| Total | 2,695 | 100.0% |
Internet Access in Salisbury
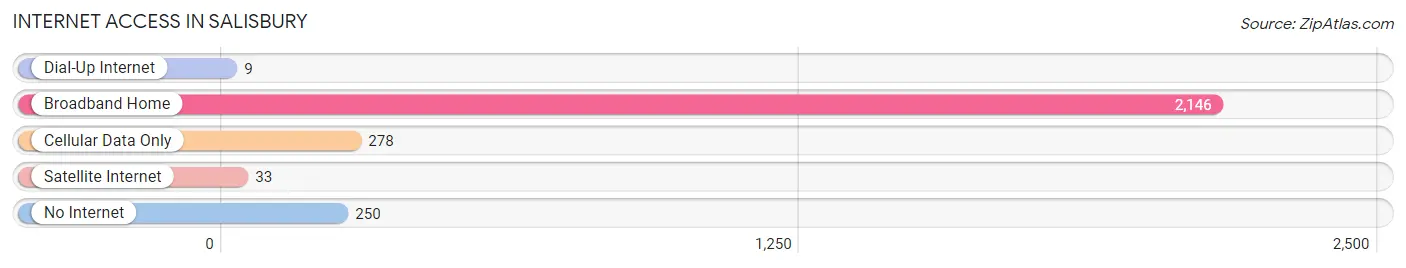
| Internet Type | # Households | % Households |
| Dial-Up Internet | 9 | 0.3% |
| Broadband Home | 2,146 | 79.6% |
| Cellular Data Only | 278 | 10.3% |
| Satellite Internet | 33 | 1.2% |
| No Internet | 250 | 9.3% |
| Total | 2,695 | 100.0% |
Salisbury Summary
Salisbury is a town located in Essex County, Massachusetts, United States. It is situated on the Atlantic Ocean, just north of the Massachusetts-New Hampshire border. The town is bordered by Amesbury to the north, Newburyport to the east, and the Atlantic Ocean to the south and west. As of the 2010 census, the town had a population of 8,283.
History
The area that is now Salisbury was originally inhabited by the Pawtucket Indians. The first European settlers arrived in 1638, and the town was officially incorporated in 1640. The town was named after Salisbury, England, and was one of the earliest settlements in the Massachusetts Bay Colony.
In the 17th and 18th centuries, Salisbury was a major fishing and trading port. The town was also home to a number of shipbuilding yards, and was a major supplier of lumber and other goods to the colonies.
In the 19th century, Salisbury became a popular summer resort destination for wealthy Bostonians. The town was home to several grand hotels, and was a popular spot for beachgoers.
Geography
Salisbury is located at 42°49′N 70°51′W (42.817, -70.851). According to the United States Census Bureau, the town has a total area of 11.2 square miles (29.0 km2), of which 10.7 square miles (27.7 km2) is land and 0.5 square miles (1.3 km2) (4.45%) is water.
The town is located on the Atlantic Ocean, and is bordered by Amesbury to the north, Newburyport to the east, and the Atlantic Ocean to the south and west.
Economy
Salisbury is a popular tourist destination, and the town's economy is largely based on tourism and hospitality. The town is home to several hotels, restaurants, and other tourist attractions.
The town is also home to a number of small businesses, including retail stores, professional services, and manufacturing.
Demographics
As of the 2010 census, there were 8,283 people, 3,521 households, and 2,092 families residing in the town. The population density was 772.3 people per square mile (298.2/km2). There were 3,845 housing units at an average density of 358.3 per square mile (138.4/km2). The racial makeup of the town was 94.2% White, 1.3% African American, 0.3% Native American, 1.2% Asian, 0.1% Pacific Islander, 1.2% from other races, and 1.7% from two or more races. Hispanic or Latino of any race were 3.2% of the population.
There were 3,521 households, out of which 28.2% had children under the age of 18 living with them, 46.2% were married couples living together, 11.2% had a female householder with no husband present, and 37.7% were non-families. 30.2% of all households were made up of individuals, and 11.2% had someone living alone who was 65 years of age or older. The average household size was 2.33 and the average family size was 2.90.
In the town, the population was spread out, with 22.3% under the age of 18, 6.2% from 18 to 24, 28.7% from 25 to 44, 27.2% from 45 to 64, and 15.6% who were 65 years of age or older. The median age was 40 years. For every 100 females, there were 93.2 males. For every 100 females age 18 and over, there were 90.2 males.
The median income for a household in the town was $50,917, and the median income for a family was $60,917. Males had a median income of $41,917 versus $31,917 for females. The per capita income for the town was $25,917. About 4.2% of families and 6.2% of the population were below the poverty line, including 8.2% of those under age 18 and 5.2% of those age 65 or over.
Common Questions
What is Per Capita Income in Salisbury?
Per Capita income in Salisbury is $62,826.
What is the Median Family Income in Salisbury?
Median Family Income in Salisbury is $119,955.
What is the Median Household income in Salisbury?
Median Household Income in Salisbury is $89,768.
What is Income or Wage Gap in Salisbury?
Income or Wage Gap in Salisbury is 25.1%.
Women in Salisbury earn 74.9 cents for every dollar earned by a man.
What is Inequality or Gini Index in Salisbury?
Inequality or Gini Index in Salisbury is 0.46.
What is the Total Population of Salisbury?
Total Population of Salisbury is 5,269.
What is the Total Male Population of Salisbury?
Total Male Population of Salisbury is 2,579.
What is the Total Female Population of Salisbury?
Total Female Population of Salisbury is 2,690.
What is the Ratio of Males per 100 Females in Salisbury?
There are 95.87 Males per 100 Females in Salisbury.
What is the Ratio of Females per 100 Males in Salisbury?
There are 104.30 Females per 100 Males in Salisbury.
What is the Median Population Age in Salisbury?
Median Population Age in Salisbury is 52.6 Years.
What is the Average Family Size in Salisbury
Average Family Size in Salisbury is 2.6 People.
What is the Average Household Size in Salisbury
Average Household Size in Salisbury is 2.0 People.
How Large is the Labor Force in Salisbury?
There are 3,057 People in the Labor Forcein in Salisbury.
What is the Percentage of People in the Labor Force in Salisbury?
64.8% of People are in the Labor Force in Salisbury.
What is the Unemployment Rate in Salisbury?
Unemployment Rate in Salisbury is 3.1%.