Webster, MA Map & Demographics
Webster Map
Webster Overview
$32,231
PER CAPITA INCOME
$70,850
AVG FAMILY INCOME
$59,375
AVG HOUSEHOLD INCOME
33.0%
WAGE / INCOME GAP [ % ]
67.0¢/ $1
WAGE / INCOME GAP [ $ ]
0.46
INEQUALITY / GINI INDEX
12,264
TOTAL POPULATION
6,016
MALE POPULATION
6,248
FEMALE POPULATION
96.29
MALES / 100 FEMALES
103.86
FEMALES / 100 MALES
37.1
MEDIAN AGE
2.9
AVG FAMILY SIZE
2.4
AVG HOUSEHOLD SIZE
6,666
LABOR FORCE [ PEOPLE ]
68.2%
PERCENT IN LABOR FORCE
9.8%
UNEMPLOYMENT RATE
Webster Zip Codes
Income in Webster
Income Overview in Webster
Per Capita Income in Webster is $32,231, while median incomes of families and households are $70,850 and $59,375 respectively.
| Characteristic | Number | Measure |
| Per Capita Income | 12,264 | $32,231 |
| Median Family Income | 2,956 | $70,850 |
| Mean Family Income | 2,956 | $92,223 |
| Median Household Income | 5,033 | $59,375 |
| Mean Household Income | 5,033 | $77,044 |
| Income Deficit | 2,956 | $0 |
| Wage / Income Gap (%) | 12,264 | 33.04% |
| Wage / Income Gap ($) | 12,264 | 66.96¢ per $1 |
| Gini / Inequality Index | 12,264 | 0.46 |
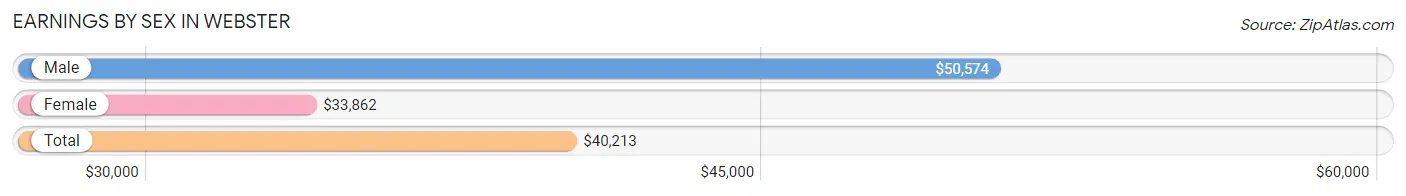
Earnings by Sex in Webster
Average Earnings in Webster are $40,213, $50,574 for men and $33,862 for women, a difference of 33.0%.
| Sex | Number | Average Earnings |
| Male | 3,098 (47.2%) | $50,574 |
| Female | 3,464 (52.8%) | $33,862 |
| Total | 6,562 (100.0%) | $40,213 |
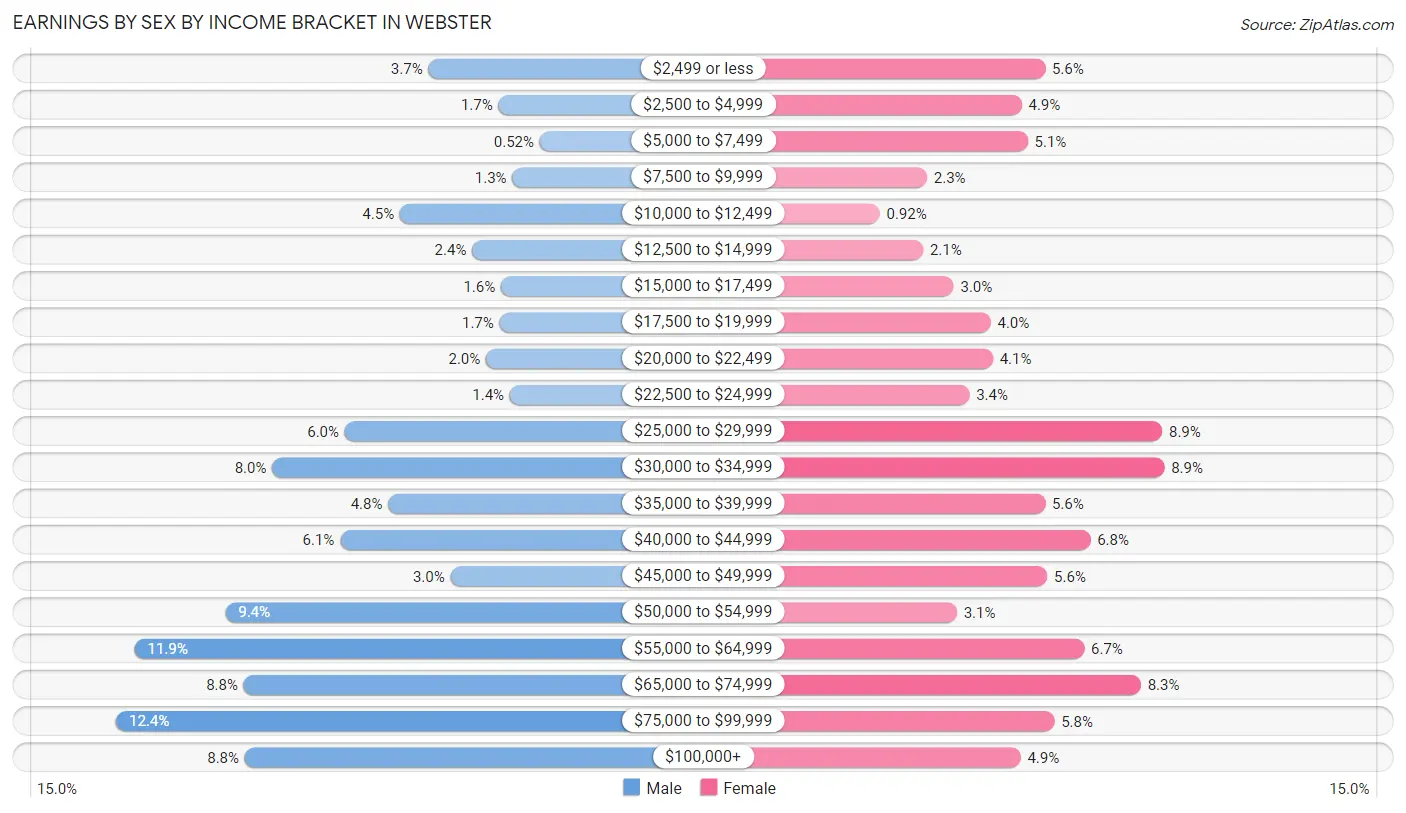
Earnings by Sex by Income Bracket in Webster
The most common earnings brackets in Webster are $75,000 to $99,999 for men (385 | 12.4%) and $30,000 to $34,999 for women (309 | 8.9%).
| Income | Male | Female |
| $2,499 or less | 113 (3.6%) | 193 (5.6%) |
| $2,500 to $4,999 | 52 (1.7%) | 170 (4.9%) |
| $5,000 to $7,499 | 16 (0.5%) | 176 (5.1%) |
| $7,500 to $9,999 | 40 (1.3%) | 78 (2.2%) |
| $10,000 to $12,499 | 138 (4.4%) | 32 (0.9%) |
| $12,500 to $14,999 | 75 (2.4%) | 74 (2.1%) |
| $15,000 to $17,499 | 50 (1.6%) | 104 (3.0%) |
| $17,500 to $19,999 | 51 (1.7%) | 140 (4.0%) |
| $20,000 to $22,499 | 63 (2.0%) | 142 (4.1%) |
| $22,500 to $24,999 | 42 (1.4%) | 119 (3.4%) |
| $25,000 to $29,999 | 186 (6.0%) | 307 (8.9%) |
| $30,000 to $34,999 | 249 (8.0%) | 309 (8.9%) |
| $35,000 to $39,999 | 148 (4.8%) | 193 (5.6%) |
| $40,000 to $44,999 | 190 (6.1%) | 237 (6.8%) |
| $45,000 to $49,999 | 94 (3.0%) | 195 (5.6%) |
| $50,000 to $54,999 | 290 (9.4%) | 107 (3.1%) |
| $55,000 to $64,999 | 369 (11.9%) | 231 (6.7%) |
| $65,000 to $74,999 | 274 (8.8%) | 286 (8.3%) |
| $75,000 to $99,999 | 385 (12.4%) | 202 (5.8%) |
| $100,000+ | 273 (8.8%) | 169 (4.9%) |
| Total | 3,098 (100.0%) | 3,464 (100.0%) |
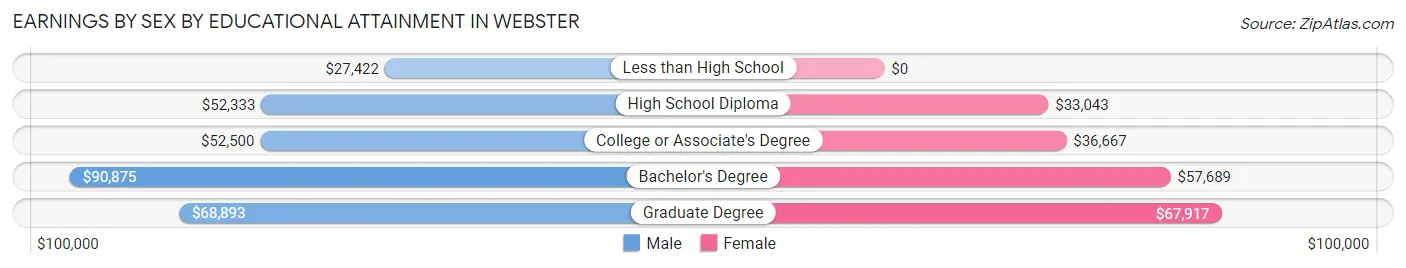
Earnings by Sex by Educational Attainment in Webster
Average earnings in Webster are $53,061 for men and $38,026 for women, a difference of 28.3%. Men with an educational attainment of bachelor's degree enjoy the highest average annual earnings of $90,875, while those with less than high school education earn the least with $27,422. Women with an educational attainment of graduate degree earn the most with the average annual earnings of $67,917, while those with high school diploma education have the smallest earnings of $33,043.
| Educational Attainment | Male Income | Female Income |
| Less than High School | $27,422 | $0 |
| High School Diploma | $52,333 | $33,043 |
| College or Associate's Degree | $52,500 | $36,667 |
| Bachelor's Degree | $90,875 | $57,689 |
| Graduate Degree | $68,893 | $67,917 |
| Total | $53,061 | $38,026 |
Family Income in Webster
Family Income Brackets in Webster
According to the Webster family income data, there are 736 families falling into the $50,000 to $74,999 income range, which is the most common income bracket and makes up 24.9% of all families. Conversely, the $10,000 to $14,999 income bracket is the least frequent group with only 92 families (3.1%) belonging to this category.
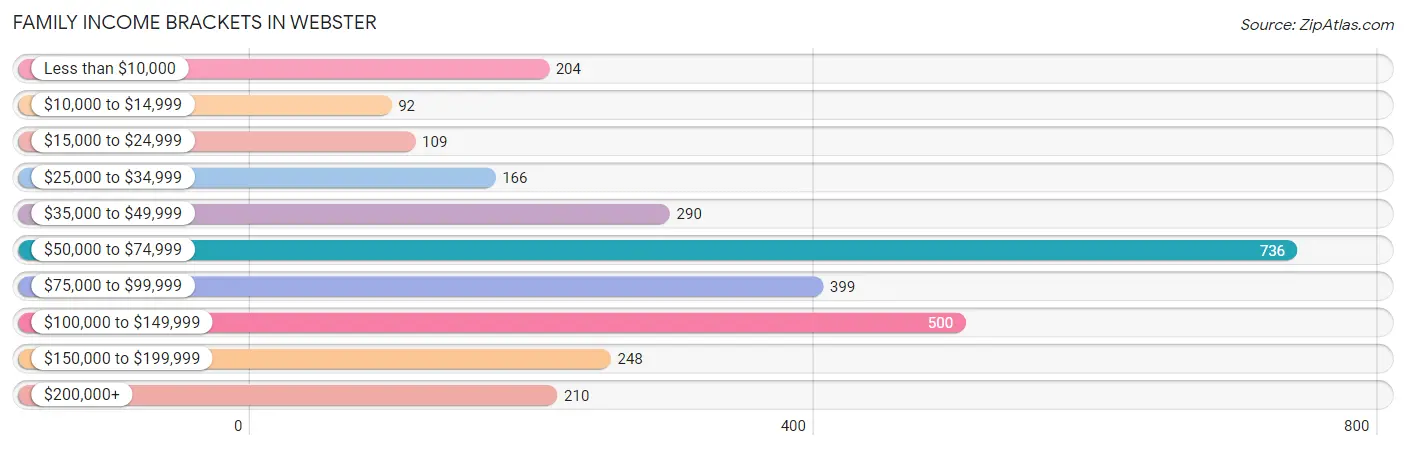
| Income Bracket | # Families | % Families |
| Less than $10,000 | 204 | 6.9% |
| $10,000 to $14,999 | 92 | 3.1% |
| $15,000 to $24,999 | 109 | 3.7% |
| $25,000 to $34,999 | 166 | 5.6% |
| $35,000 to $49,999 | 290 | 9.8% |
| $50,000 to $74,999 | 736 | 24.9% |
| $75,000 to $99,999 | 399 | 13.5% |
| $100,000 to $149,999 | 500 | 16.9% |
| $150,000 to $199,999 | 248 | 8.4% |
| $200,000+ | 210 | 7.1% |
Family Income by Famaliy Size in Webster
4-person families (671 | 22.7%) account for the highest median family income in Webster with $99,316 per family, while 2-person families (1,263 | 42.7%) have the highest median income of $32,131 per family member.
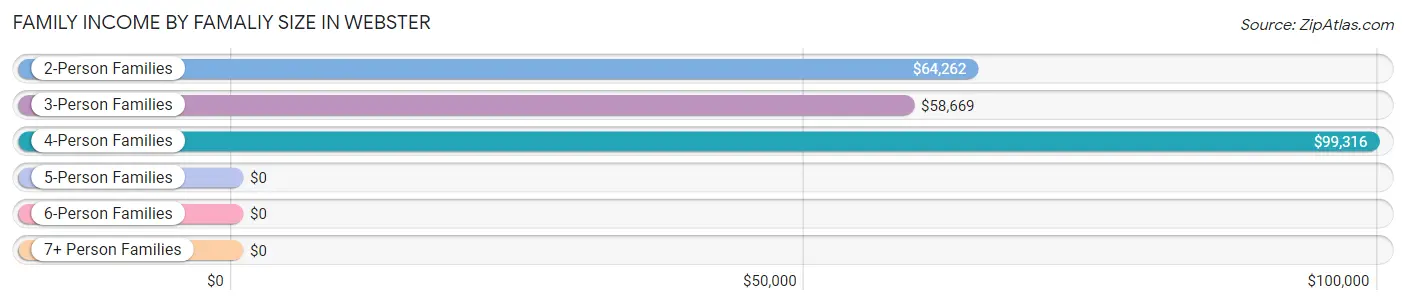
| Income Bracket | # Families | Median Income |
| 2-Person Families | 1,263 (42.7%) | $64,262 |
| 3-Person Families | 927 (31.4%) | $58,669 |
| 4-Person Families | 671 (22.7%) | $99,316 |
| 5-Person Families | 65 (2.2%) | $0 |
| 6-Person Families | 22 (0.7%) | $0 |
| 7+ Person Families | 8 (0.3%) | $0 |
| Total | 2,956 (100.0%) | $70,850 |
Family Income by Number of Earners in Webster
The median family income in Webster is $70,850, with families comprising 3+ earners (307) having the highest median family income of $166,116, while families with no earners (259) have the lowest median family income of $27,548, accounting for 10.4% and 8.8% of families, respectively.
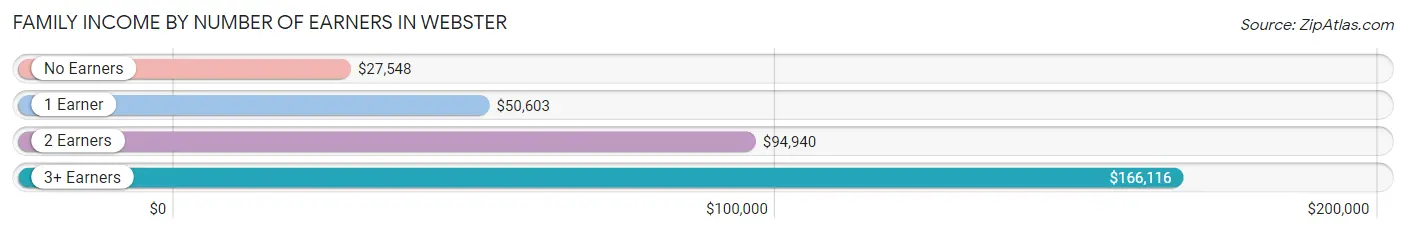
| Number of Earners | # Families | Median Income |
| No Earners | 259 (8.8%) | $27,548 |
| 1 Earner | 1,126 (38.1%) | $50,603 |
| 2 Earners | 1,264 (42.8%) | $94,940 |
| 3+ Earners | 307 (10.4%) | $166,116 |
| Total | 2,956 (100.0%) | $70,850 |
Household Income in Webster
Household Income Brackets in Webster
With 1,092 households falling in the category, the $50,000 to $74,999 income range is the most frequent in Webster, accounting for 21.7% of all households. In contrast, only 257 households (5.1%) fall into the $200,000+ income bracket, making it the least populous group.
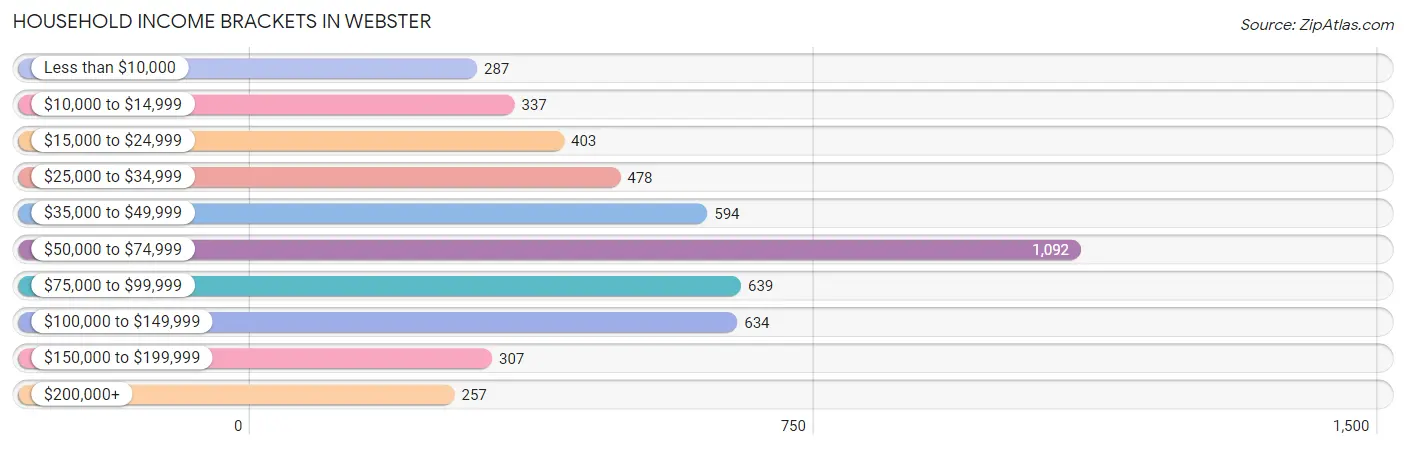
| Income Bracket | # Households | % Households |
| Less than $10,000 | 287 | 5.7% |
| $10,000 to $14,999 | 337 | 6.7% |
| $15,000 to $24,999 | 403 | 8.0% |
| $25,000 to $34,999 | 478 | 9.5% |
| $35,000 to $49,999 | 594 | 11.8% |
| $50,000 to $74,999 | 1,092 | 21.7% |
| $75,000 to $99,999 | 639 | 12.7% |
| $100,000 to $149,999 | 634 | 12.6% |
| $150,000 to $199,999 | 307 | 6.1% |
| $200,000+ | 257 | 5.1% |
Household Income by Householder Age in Webster
The median household income in Webster is $59,375, with the highest median household income of $74,208 found in the 45 to 64 years age bracket for the primary householder. A total of 1,996 households (39.7%) fall into this category. Meanwhile, the 65+ years age bracket for the primary householder has the lowest median household income of $29,313, with 1,087 households (21.6%) in this group.
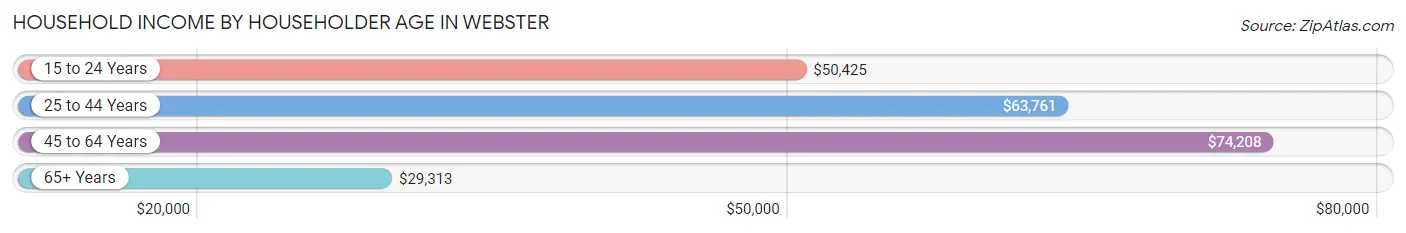
| Income Bracket | # Households | Median Income |
| 15 to 24 Years | 211 (4.2%) | $50,425 |
| 25 to 44 Years | 1,739 (34.5%) | $63,761 |
| 45 to 64 Years | 1,996 (39.7%) | $74,208 |
| 65+ Years | 1,087 (21.6%) | $29,313 |
| Total | 5,033 (100.0%) | $59,375 |
Poverty in Webster
Income Below Poverty by Sex and Age in Webster
With 14.7% poverty level for males and 21.1% for females among the residents of Webster, 75 year old and over males and 5 year old females are the most vulnerable to poverty, with 125 males (54.3%) and 36 females (100.0%) in their respective age groups living below the poverty level.
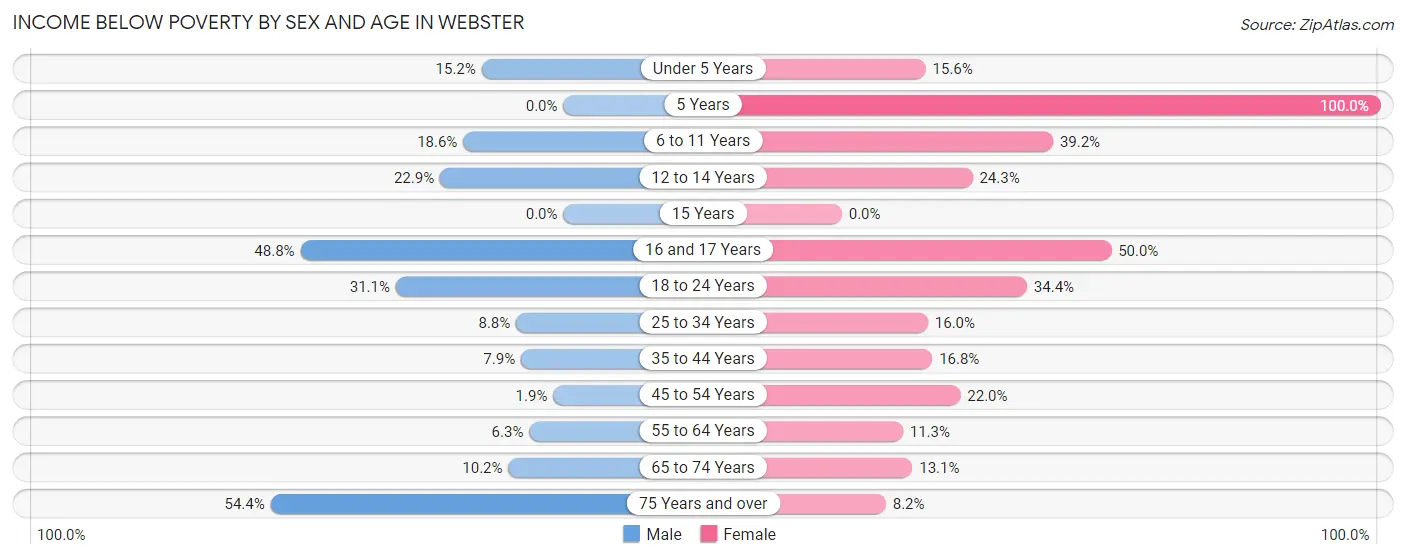
| Age Bracket | Male | Female |
| Under 5 Years | 49 (15.2%) | 47 (15.6%) |
| 5 Years | 0 (0.0%) | 36 (100.0%) |
| 6 to 11 Years | 116 (18.6%) | 223 (39.2%) |
| 12 to 14 Years | 60 (22.9%) | 33 (24.3%) |
| 15 Years | 0 (0.0%) | 0 (0.0%) |
| 16 and 17 Years | 82 (48.8%) | 91 (50.0%) |
| 18 to 24 Years | 186 (31.1%) | 189 (34.4%) |
| 25 to 34 Years | 68 (8.8%) | 159 (16.0%) |
| 35 to 44 Years | 70 (7.9%) | 142 (16.8%) |
| 45 to 54 Years | 10 (1.9%) | 182 (22.0%) |
| 55 to 64 Years | 61 (6.3%) | 79 (11.3%) |
| 65 to 74 Years | 44 (10.2%) | 61 (13.1%) |
| 75 Years and over | 125 (54.3%) | 29 (8.2%) |
| Total | 871 (14.7%) | 1,271 (21.1%) |
Income Above Poverty by Sex and Age in Webster
According to the poverty statistics in Webster, males aged 5 years and females aged 15 years are the age groups that are most secure financially, with 100.0% of males and 100.0% of females in these age groups living above the poverty line.
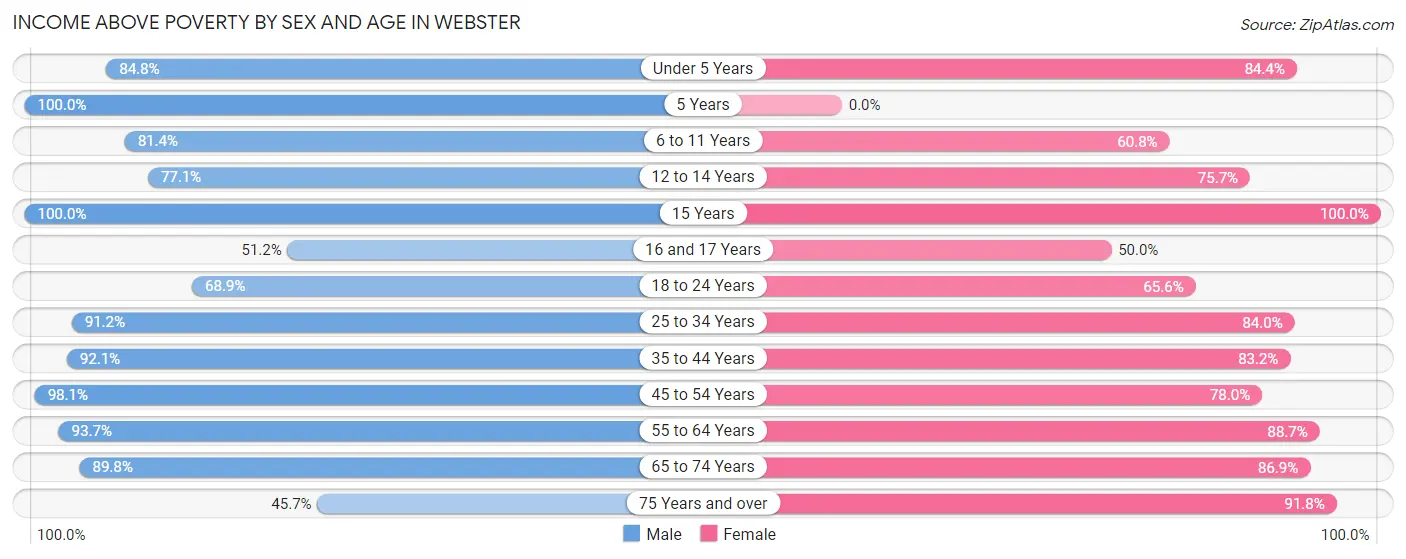
| Age Bracket | Male | Female |
| Under 5 Years | 274 (84.8%) | 255 (84.4%) |
| 5 Years | 10 (100.0%) | 0 (0.0%) |
| 6 to 11 Years | 508 (81.4%) | 346 (60.8%) |
| 12 to 14 Years | 202 (77.1%) | 103 (75.7%) |
| 15 Years | 108 (100.0%) | 54 (100.0%) |
| 16 and 17 Years | 86 (51.2%) | 91 (50.0%) |
| 18 to 24 Years | 412 (68.9%) | 361 (65.6%) |
| 25 to 34 Years | 707 (91.2%) | 836 (84.0%) |
| 35 to 44 Years | 821 (92.1%) | 704 (83.2%) |
| 45 to 54 Years | 523 (98.1%) | 645 (78.0%) |
| 55 to 64 Years | 903 (93.7%) | 619 (88.7%) |
| 65 to 74 Years | 387 (89.8%) | 405 (86.9%) |
| 75 Years and over | 105 (45.7%) | 326 (91.8%) |
| Total | 5,046 (85.3%) | 4,745 (78.9%) |
Income Below Poverty Among Married-Couple Families in Webster
The poverty statistics for married-couple families in Webster show that 0.7% or 11 of the total 1,590 families live below the poverty line. Families with 3 or 4 children have the highest poverty rate of 12.1%, comprising of 4 families. On the other hand, families with 1 or 2 children have the lowest poverty rate of 0.0%, which includes 0 families.
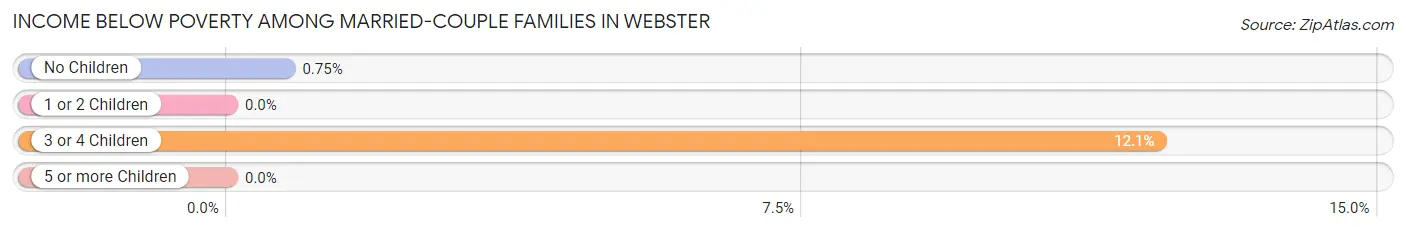
| Children | Above Poverty | Below Poverty |
| No Children | 931 (99.3%) | 7 (0.7%) |
| 1 or 2 Children | 619 (100.0%) | 0 (0.0%) |
| 3 or 4 Children | 29 (87.9%) | 4 (12.1%) |
| 5 or more Children | 0 (0.0%) | 0 (0.0%) |
| Total | 1,579 (99.3%) | 11 (0.7%) |
Income Below Poverty Among Single-Parent Households in Webster
According to the poverty data in Webster, 9.1% or 29 single-father households and 31.9% or 334 single-mother households are living below the poverty line. Among single-father households, those with 1 or 2 children have the highest poverty rate, with 29 households (15.5%) experiencing poverty. Likewise, among single-mother households, those with 1 or 2 children have the highest poverty rate, with 312 households (42.8%) falling below the poverty line.
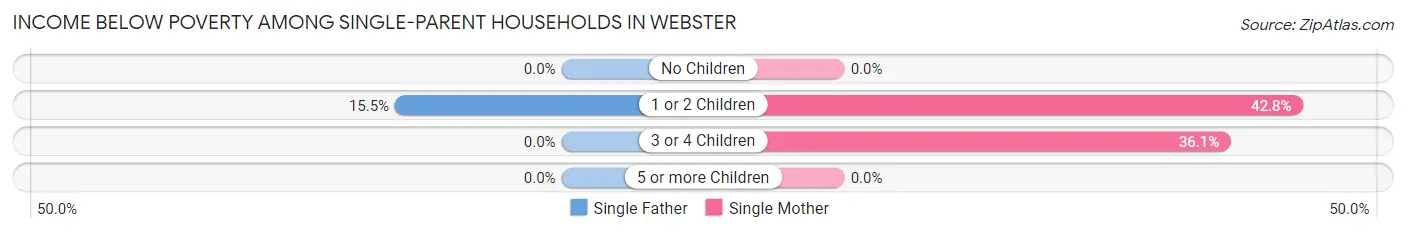
| Children | Single Father | Single Mother |
| No Children | 0 (0.0%) | 0 (0.0%) |
| 1 or 2 Children | 29 (15.5%) | 312 (42.8%) |
| 3 or 4 Children | 0 (0.0%) | 22 (36.1%) |
| 5 or more Children | 0 (0.0%) | 0 (0.0%) |
| Total | 29 (9.1%) | 334 (31.9%) |
Income Below Poverty Among Married-Couple vs Single-Parent Households in Webster
The poverty data for Webster shows that 11 of the married-couple family households (0.7%) and 363 of the single-parent households (26.6%) are living below the poverty level. Within the married-couple family households, those with 3 or 4 children have the highest poverty rate, with 4 households (12.1%) falling below the poverty line. Among the single-parent households, those with 1 or 2 children have the highest poverty rate, with 341 household (37.2%) living below poverty.
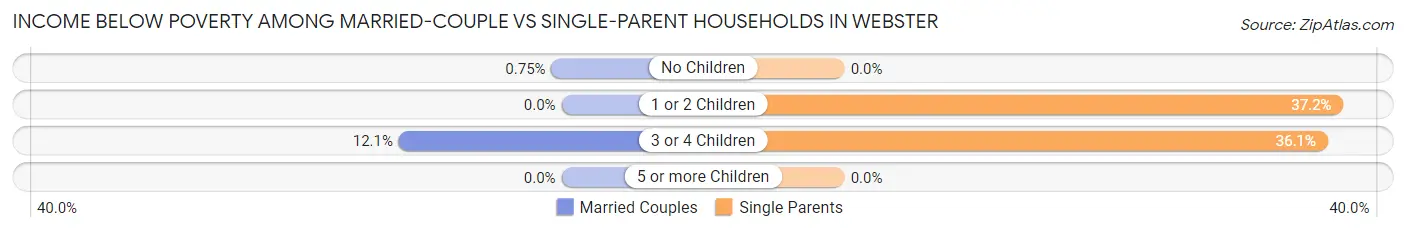
| Children | Married-Couple Families | Single-Parent Households |
| No Children | 7 (0.7%) | 0 (0.0%) |
| 1 or 2 Children | 0 (0.0%) | 341 (37.2%) |
| 3 or 4 Children | 4 (12.1%) | 22 (36.1%) |
| 5 or more Children | 0 (0.0%) | 0 (0.0%) |
| Total | 11 (0.7%) | 363 (26.6%) |
Race in Webster
The most populous races in Webster are White / Caucasian (8,723 | 71.1%), Hispanic or Latino (2,690 | 21.9%), and Some other Race (1,175 | 9.6%).
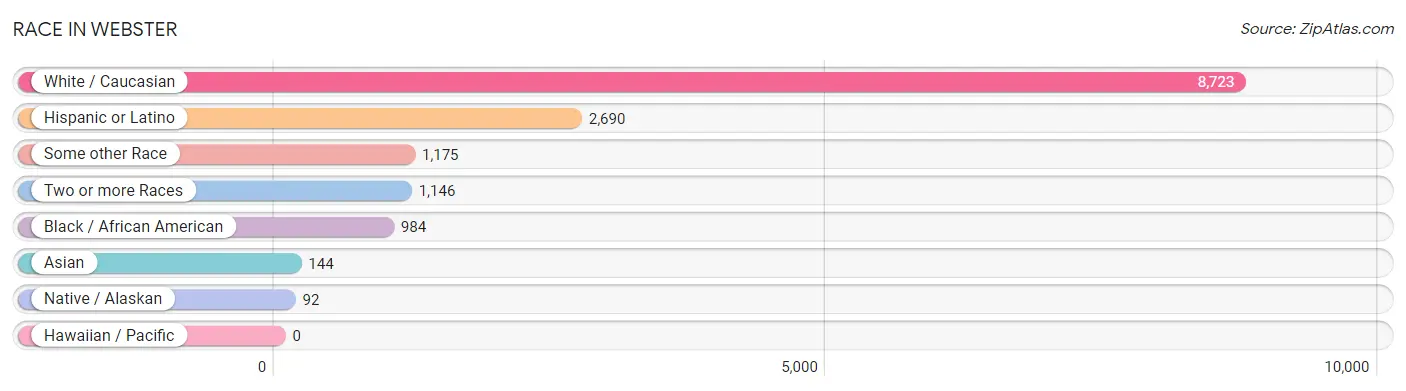
| Race | # Population | % Population |
| Asian | 144 | 1.2% |
| Black / African American | 984 | 8.0% |
| Hawaiian / Pacific | 0 | 0.0% |
| Hispanic or Latino | 2,690 | 21.9% |
| Native / Alaskan | 92 | 0.7% |
| White / Caucasian | 8,723 | 71.1% |
| Two or more Races | 1,146 | 9.3% |
| Some other Race | 1,175 | 9.6% |
| Total | 12,264 | 100.0% |
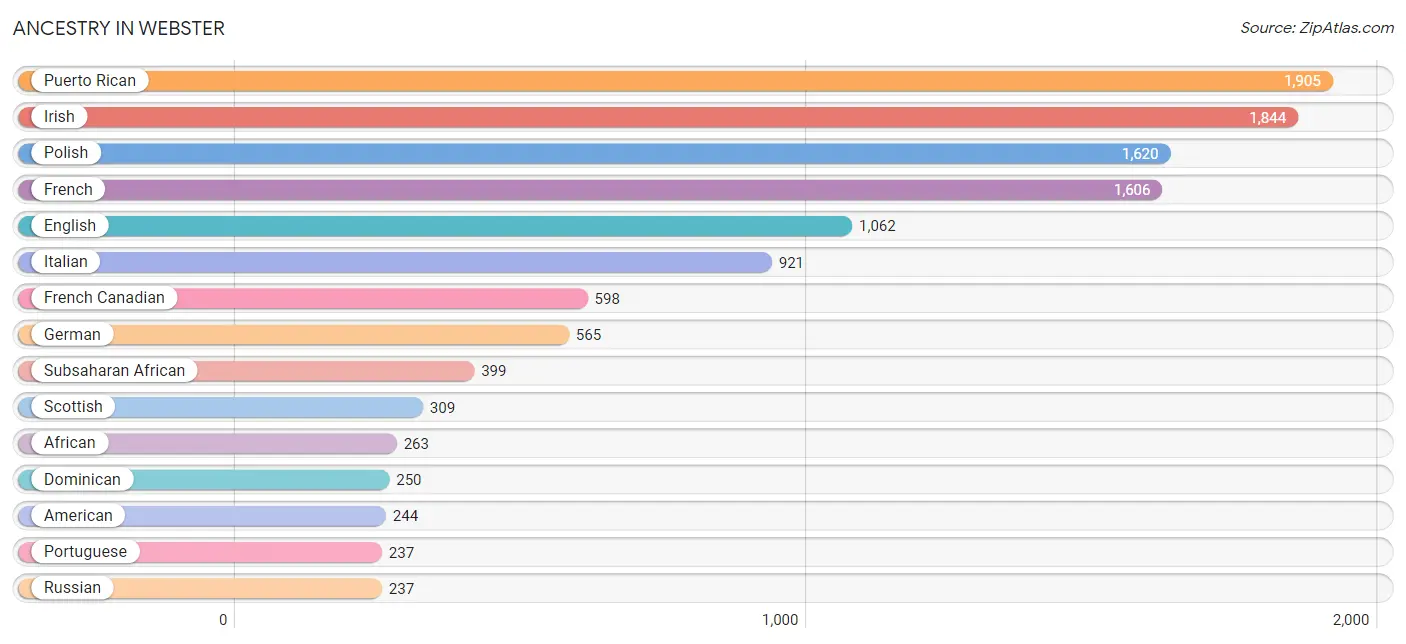
Ancestry in Webster
The most populous ancestries reported in Webster are Puerto Rican (1,905 | 15.5%), Irish (1,844 | 15.0%), Polish (1,620 | 13.2%), French (1,606 | 13.1%), and English (1,062 | 8.7%), together accounting for 65.5% of all Webster residents.
| Ancestry | # Population | % Population |
| African | 263 | 2.1% |
| Albanian | 17 | 0.1% |
| American | 244 | 2.0% |
| Apache | 21 | 0.2% |
| Arab | 230 | 1.9% |
| Belgian | 11 | 0.1% |
| Bermudan | 67 | 0.5% |
| Bhutanese | 20 | 0.2% |
| Blackfeet | 4 | 0.0% |
| Brazilian | 95 | 0.8% |
| British | 16 | 0.1% |
| Canadian | 70 | 0.6% |
| Cape Verdean | 24 | 0.2% |
| Central American | 202 | 1.7% |
| Colombian | 10 | 0.1% |
| Cuban | 182 | 1.5% |
| Czech | 7 | 0.1% |
| Czechoslovakian | 29 | 0.2% |
| Dominican | 250 | 2.0% |
| Dutch | 38 | 0.3% |
| Egyptian | 40 | 0.3% |
| English | 1,062 | 8.7% |
| European | 159 | 1.3% |
| Finnish | 10 | 0.1% |
| French | 1,606 | 13.1% |
| French American Indian | 2 | 0.0% |
| French Canadian | 598 | 4.9% |
| German | 565 | 4.6% |
| Ghanaian | 51 | 0.4% |
| Greek | 84 | 0.7% |
| Haitian | 98 | 0.8% |
| Honduran | 28 | 0.2% |
| Hungarian | 7 | 0.1% |
| Indian (Asian) | 47 | 0.4% |
| Indonesian | 12 | 0.1% |
| Iraqi | 5 | 0.0% |
| Irish | 1,844 | 15.0% |
| Italian | 921 | 7.5% |
| Jamaican | 136 | 1.1% |
| Korean | 18 | 0.2% |
| Latvian | 11 | 0.1% |
| Lebanese | 34 | 0.3% |
| Lithuanian | 106 | 0.9% |
| Malaysian | 11 | 0.1% |
| Native Hawaiian | 9 | 0.1% |
| Nicaraguan | 27 | 0.2% |
| Nigerian | 14 | 0.1% |
| Norwegian | 3 | 0.0% |
| Panamanian | 64 | 0.5% |
| Peruvian | 99 | 0.8% |
| Polish | 1,620 | 13.2% |
| Portuguese | 237 | 1.9% |
| Puerto Rican | 1,905 | 15.5% |
| Russian | 237 | 1.9% |
| Salvadoran | 83 | 0.7% |
| Scandinavian | 8 | 0.1% |
| Scotch-Irish | 34 | 0.3% |
| Scottish | 309 | 2.5% |
| Slovak | 50 | 0.4% |
| South American | 119 | 1.0% |
| Spaniard | 9 | 0.1% |
| Sri Lankan | 51 | 0.4% |
| Subsaharan African | 399 | 3.3% |
| Swedish | 156 | 1.3% |
| Syrian | 47 | 0.4% |
| Venezuelan | 10 | 0.1% |
| Welsh | 18 | 0.2% | View All 67 Rows |
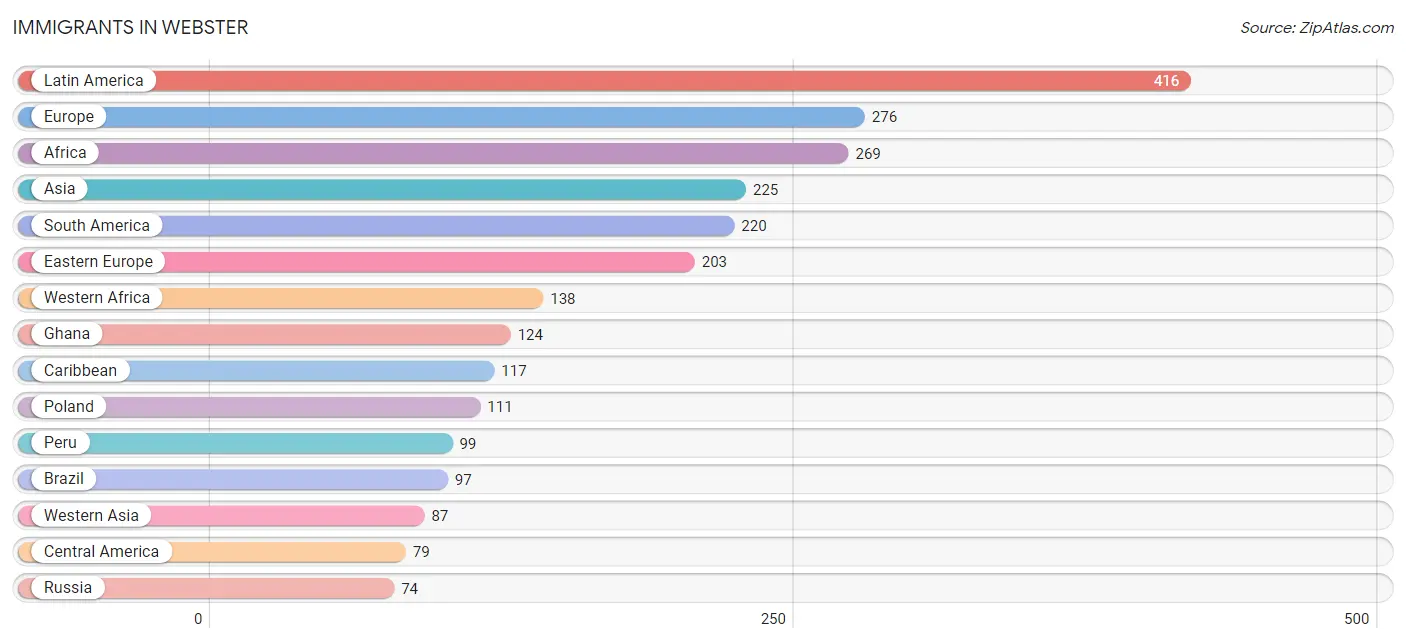
Immigrants in Webster
The most numerous immigrant groups reported in Webster came from Latin America (416 | 3.4%), Europe (276 | 2.2%), Africa (269 | 2.2%), Asia (225 | 1.8%), and South America (220 | 1.8%), together accounting for 11.4% of all Webster residents.
| Immigration Origin | # Population | % Population |
| Africa | 269 | 2.2% |
| Asia | 225 | 1.8% |
| Brazil | 97 | 0.8% |
| Canada | 20 | 0.2% |
| Caribbean | 117 | 0.9% |
| Central America | 79 | 0.6% |
| China | 47 | 0.4% |
| Colombia | 10 | 0.1% |
| Cuba | 31 | 0.3% |
| Dominican Republic | 63 | 0.5% |
| Eastern Africa | 59 | 0.5% |
| Eastern Asia | 58 | 0.5% |
| Eastern Europe | 203 | 1.7% |
| Egypt | 53 | 0.4% |
| El Salvador | 70 | 0.6% |
| Europe | 276 | 2.2% |
| Germany | 26 | 0.2% |
| Ghana | 124 | 1.0% |
| Greece | 14 | 0.1% |
| Haiti | 9 | 0.1% |
| India | 15 | 0.1% |
| Iraq | 58 | 0.5% |
| Italy | 28 | 0.2% |
| Jamaica | 14 | 0.1% |
| Japan | 11 | 0.1% |
| Kenya | 59 | 0.5% |
| Laos | 5 | 0.0% |
| Latin America | 416 | 3.4% |
| Lebanon | 29 | 0.2% |
| Lithuania | 18 | 0.2% |
| Nicaragua | 9 | 0.1% |
| Nigeria | 14 | 0.1% |
| Northern Africa | 53 | 0.4% |
| Northern Europe | 5 | 0.0% |
| Peru | 99 | 0.8% |
| Poland | 111 | 0.9% |
| Russia | 74 | 0.6% |
| Scotland | 5 | 0.0% |
| South America | 220 | 1.8% |
| South Central Asia | 24 | 0.2% |
| South Eastern Asia | 56 | 0.5% |
| Southern Europe | 42 | 0.3% |
| Taiwan | 47 | 0.4% |
| Venezuela | 10 | 0.1% |
| Vietnam | 51 | 0.4% |
| Western Africa | 138 | 1.1% |
| Western Asia | 87 | 0.7% |
| Western Europe | 26 | 0.2% | View All 48 Rows |
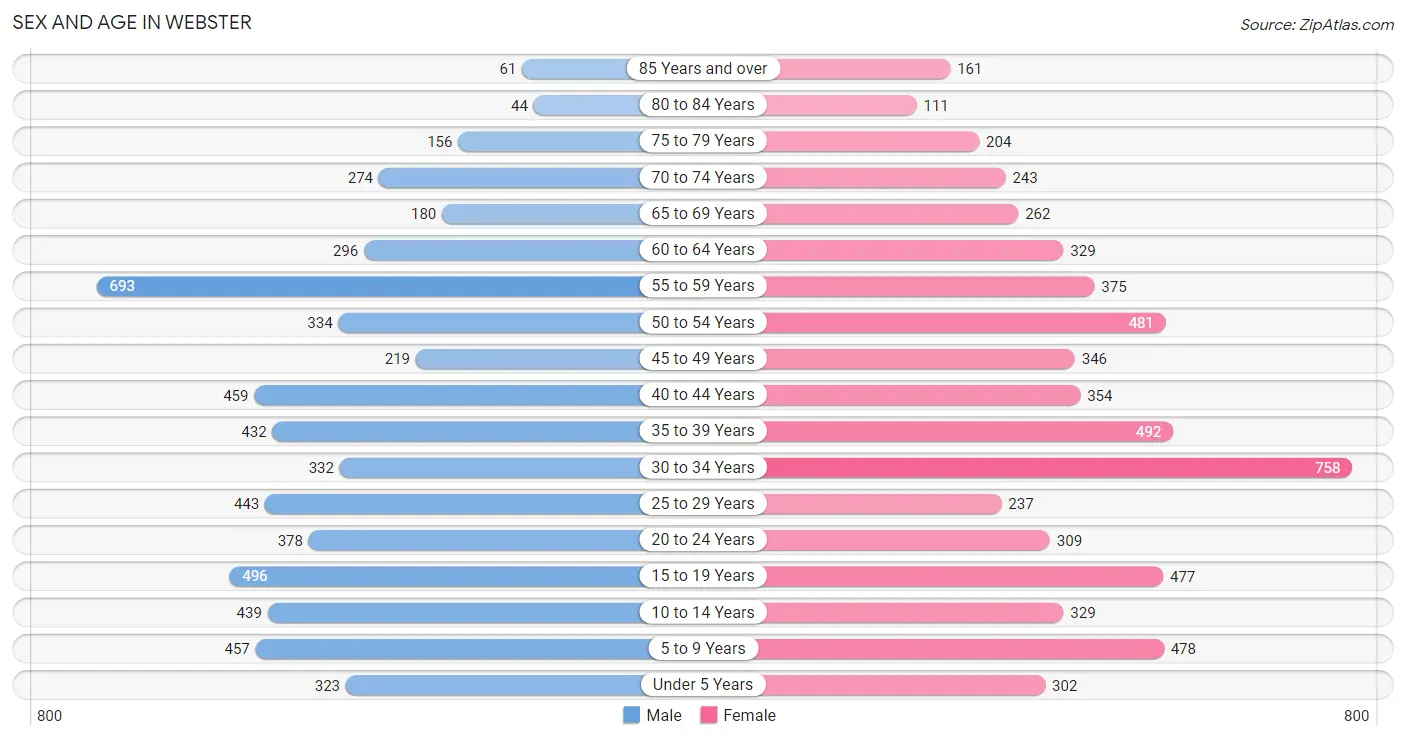
Sex and Age in Webster
Sex and Age in Webster
The most populous age groups in Webster are 55 to 59 Years (693 | 11.5%) for men and 30 to 34 Years (758 | 12.1%) for women.
| Age Bracket | Male | Female |
| Under 5 Years | 323 (5.4%) | 302 (4.8%) |
| 5 to 9 Years | 457 (7.6%) | 478 (7.6%) |
| 10 to 14 Years | 439 (7.3%) | 329 (5.3%) |
| 15 to 19 Years | 496 (8.2%) | 477 (7.6%) |
| 20 to 24 Years | 378 (6.3%) | 309 (5.0%) |
| 25 to 29 Years | 443 (7.4%) | 237 (3.8%) |
| 30 to 34 Years | 332 (5.5%) | 758 (12.1%) |
| 35 to 39 Years | 432 (7.2%) | 492 (7.9%) |
| 40 to 44 Years | 459 (7.6%) | 354 (5.7%) |
| 45 to 49 Years | 219 (3.6%) | 346 (5.5%) |
| 50 to 54 Years | 334 (5.6%) | 481 (7.7%) |
| 55 to 59 Years | 693 (11.5%) | 375 (6.0%) |
| 60 to 64 Years | 296 (4.9%) | 329 (5.3%) |
| 65 to 69 Years | 180 (3.0%) | 262 (4.2%) |
| 70 to 74 Years | 274 (4.5%) | 243 (3.9%) |
| 75 to 79 Years | 156 (2.6%) | 204 (3.3%) |
| 80 to 84 Years | 44 (0.7%) | 111 (1.8%) |
| 85 Years and over | 61 (1.0%) | 161 (2.6%) |
| Total | 6,016 (100.0%) | 6,248 (100.0%) |
Families and Households in Webster
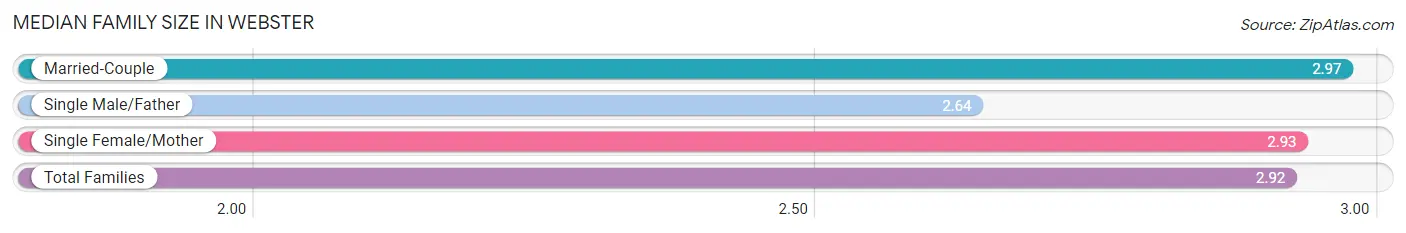
Median Family Size in Webster
The median family size in Webster is 2.92 persons per family, with married-couple families (1,590 | 53.8%) accounting for the largest median family size of 2.97 persons per family. On the other hand, single male/father families (318 | 10.8%) represent the smallest median family size with 2.64 persons per family.
| Family Type | # Families | Family Size |
| Married-Couple | 1,590 (53.8%) | 2.97 |
| Single Male/Father | 318 (10.8%) | 2.64 |
| Single Female/Mother | 1,048 (35.4%) | 2.93 |
| Total Families | 2,956 (100.0%) | 2.92 |
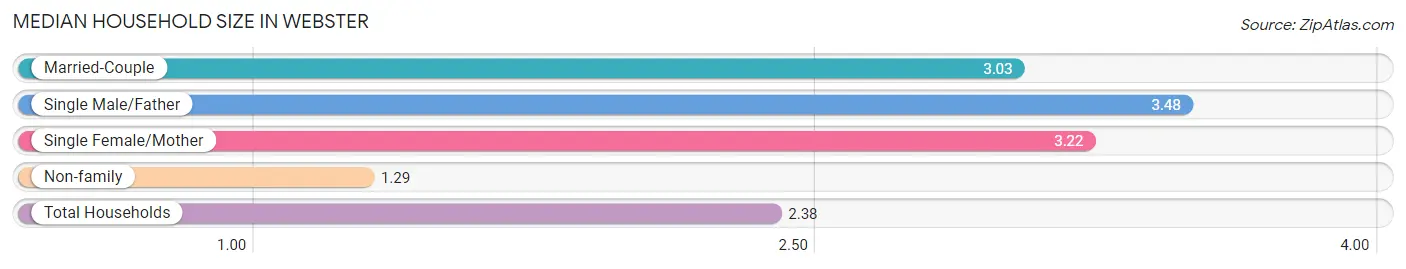
Median Household Size in Webster
The median household size in Webster is 2.38 persons per household, with single male/father households (318 | 6.3%) accounting for the largest median household size of 3.48 persons per household. non-family households (2,077 | 41.3%) represent the smallest median household size with 1.29 persons per household.
| Household Type | # Households | Household Size |
| Married-Couple | 1,590 (31.6%) | 3.03 |
| Single Male/Father | 318 (6.3%) | 3.48 |
| Single Female/Mother | 1,048 (20.8%) | 3.22 |
| Non-family | 2,077 (41.3%) | 1.29 |
| Total Households | 5,033 (100.0%) | 2.38 |
Household Size by Marriage Status in Webster
Out of a total of 5,033 households in Webster, 2,956 (58.7%) are family households, while 2,077 (41.3%) are nonfamily households. The most numerous type of family households are 2-person households, comprising 1,087, and the most common type of nonfamily households are 1-person households, comprising 1,635.
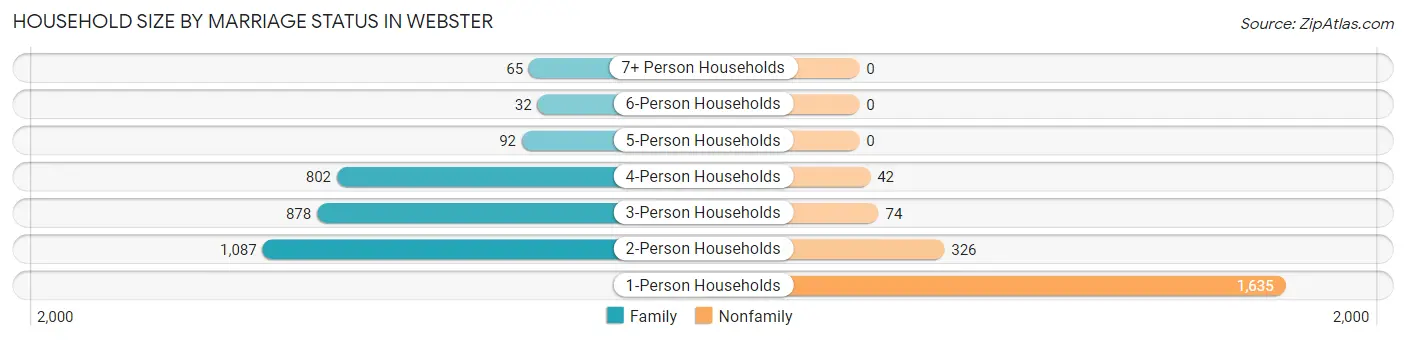
| Household Size | Family Households | Nonfamily Households |
| 1-Person Households | - | 1,635 (32.5%) |
| 2-Person Households | 1,087 (21.6%) | 326 (6.5%) |
| 3-Person Households | 878 (17.4%) | 74 (1.5%) |
| 4-Person Households | 802 (15.9%) | 42 (0.8%) |
| 5-Person Households | 92 (1.8%) | 0 (0.0%) |
| 6-Person Households | 32 (0.6%) | 0 (0.0%) |
| 7+ Person Households | 65 (1.3%) | 0 (0.0%) |
| Total | 2,956 (58.7%) | 2,077 (41.3%) |
Female Fertility in Webster
Fertility by Age in Webster
Average fertility rate in Webster is 23.0 births per 1,000 women. Women in the age bracket of 20 to 34 years have the highest fertility rate with 46.0 births per 1,000 women. Women in the age bracket of 20 to 34 years acount for 85.7% of all women with births.
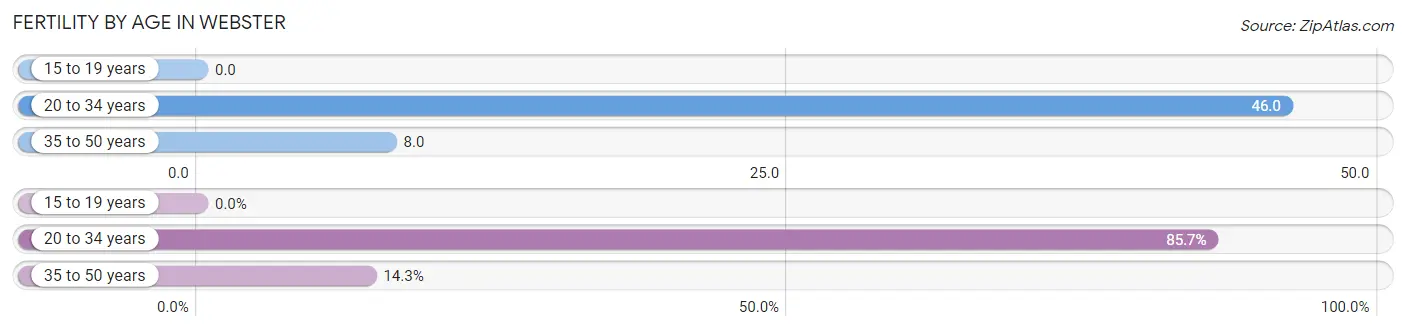
| Age Bracket | Women with Births | Births / 1,000 Women |
| 15 to 19 years | 0 (0.0%) | 0.0 |
| 20 to 34 years | 60 (85.7%) | 46.0 |
| 35 to 50 years | 10 (14.3%) | 8.0 |
| Total | 70 (100.0%) | 23.0 |
Fertility by Age by Marriage Status in Webster
90.0% of women with births (70) in Webster are married. The highest percentage of unmarried women with births falls into 20 to 34 years age bracket with 11.7% of them unmarried at the time of birth, while the lowest percentage of unmarried women with births belong to 35 to 50 years age bracket with 0.0% of them unmarried.
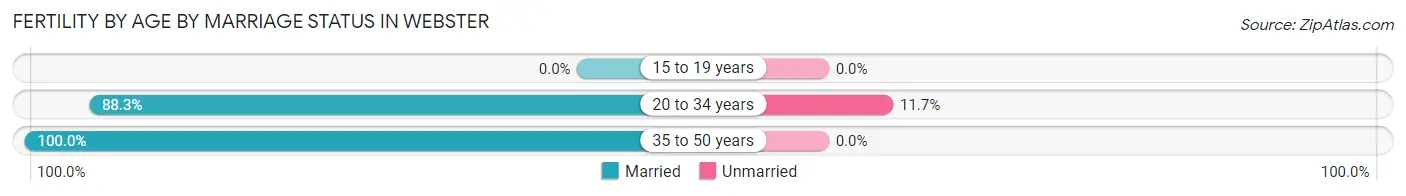
| Age Bracket | Married | Unmarried |
| 15 to 19 years | 0 (0.0%) | 0 (0.0%) |
| 20 to 34 years | 53 (88.3%) | 7 (11.7%) |
| 35 to 50 years | 10 (100.0%) | 0 (0.0%) |
| Total | 63 (90.0%) | 7 (10.0%) |
Fertility by Education in Webster
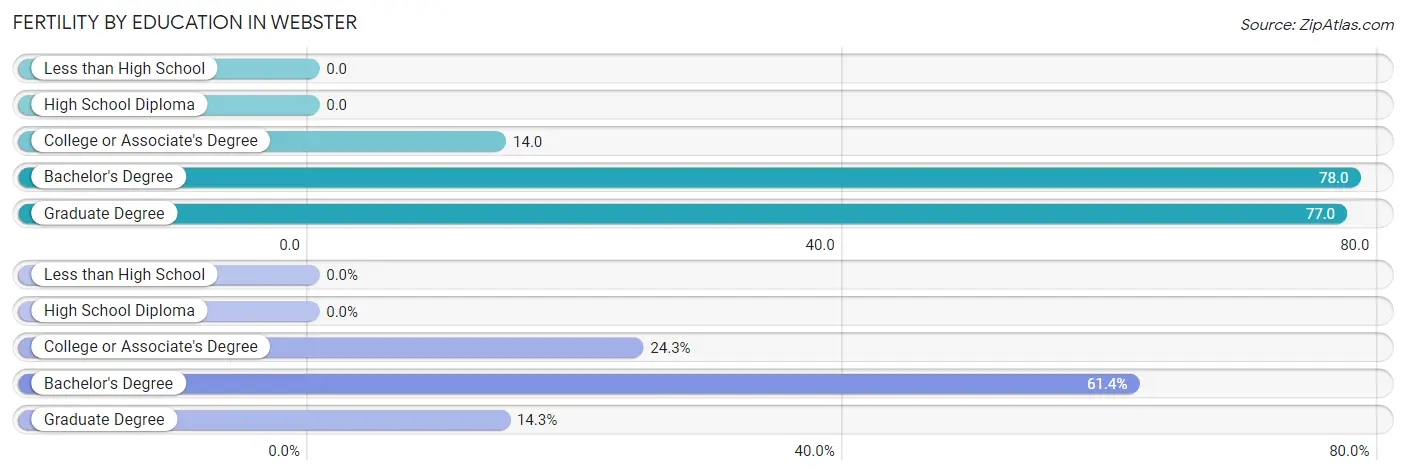
| Educational Attainment | Women with Births | Births / 1,000 Women |
| Less than High School | 0 (0.0%) | 0.0 |
| High School Diploma | 0 (0.0%) | 0.0 |
| College or Associate's Degree | 17 (24.3%) | 14.0 |
| Bachelor's Degree | 43 (61.4%) | 78.0 |
| Graduate Degree | 10 (14.3%) | 77.0 |
| Total | 70 (100.0%) | 23.0 |
Fertility by Education by Marriage Status in Webster
10.0% of women with births in Webster are unmarried. Women with the educational attainment of bachelor's degree are most likely to be married with 100.0% of them married at childbirth, while women with the educational attainment of college or associate's degree are least likely to be married with 41.2% of them unmarried at childbirth.
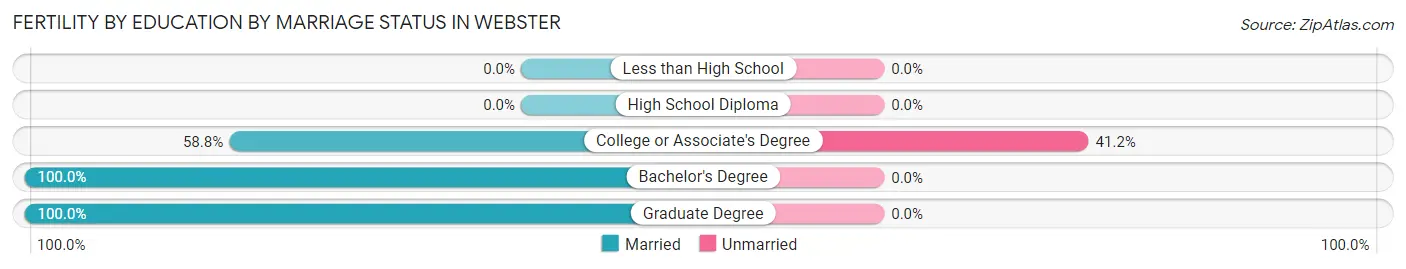
| Educational Attainment | Married | Unmarried |
| Less than High School | 0 (0.0%) | 0 (0.0%) |
| High School Diploma | 0 (0.0%) | 0 (0.0%) |
| College or Associate's Degree | 10 (58.8%) | 7 (41.2%) |
| Bachelor's Degree | 43 (100.0%) | 0 (0.0%) |
| Graduate Degree | 10 (100.0%) | 0 (0.0%) |
| Total | 63 (90.0%) | 7 (10.0%) |
Employment Characteristics in Webster
Employment by Class of Employer in Webster
Among the 5,712 employed individuals in Webster, private company employees (4,124 | 72.2%), not-for-profit organizations (467 | 8.2%), and state government employees (347 | 6.1%) make up the most common classes of employment.
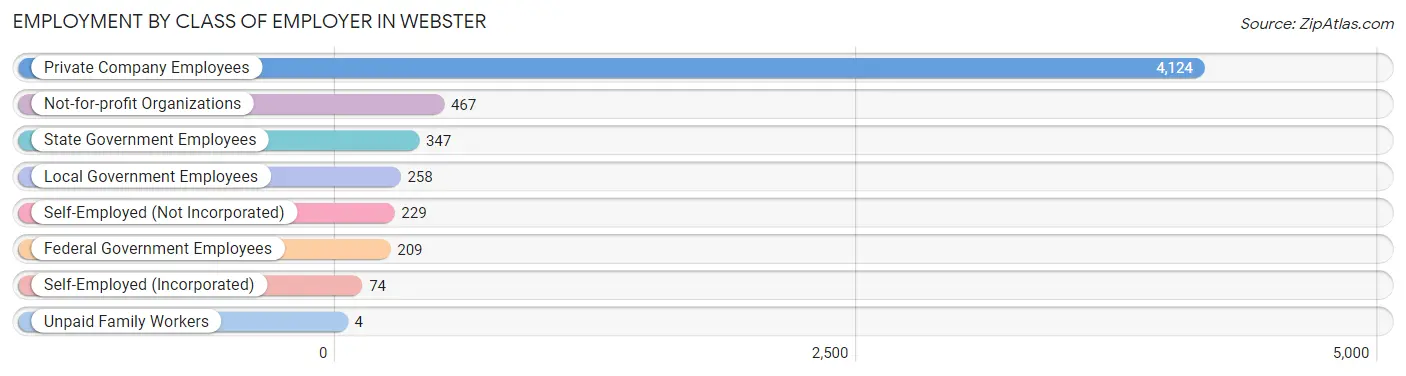
| Employer Class | # Employees | % Employees |
| Private Company Employees | 4,124 | 72.2% |
| Self-Employed (Incorporated) | 74 | 1.3% |
| Self-Employed (Not Incorporated) | 229 | 4.0% |
| Not-for-profit Organizations | 467 | 8.2% |
| Local Government Employees | 258 | 4.5% |
| State Government Employees | 347 | 6.1% |
| Federal Government Employees | 209 | 3.7% |
| Unpaid Family Workers | 4 | 0.1% |
| Total | 5,712 | 100.0% |
Employment Status by Age in Webster
According to the labor force statistics for Webster, out of the total population over 16 years of age (9,774), 68.2% or 6,666 individuals are in the labor force, with 9.8% or 653 of them unemployed. The age group with the highest labor force participation rate is 25 to 29 years, with 94.3% or 641 individuals in the labor force. Within the labor force, the 20 to 24 years age range has the highest percentage of unemployed individuals, with 30.9% or 180 of them being unemployed.
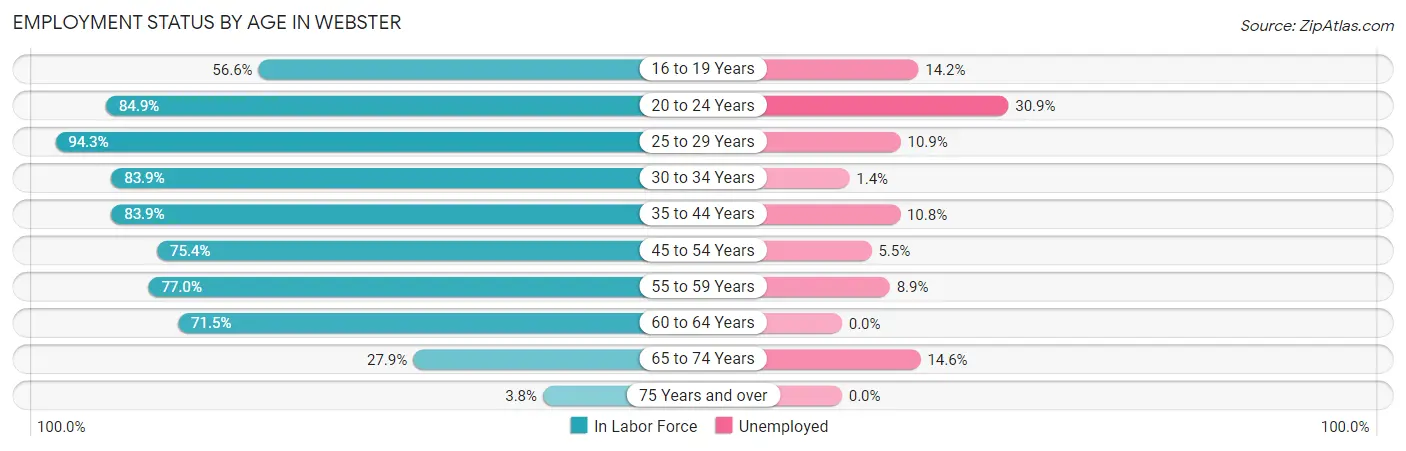
| Age Bracket | In Labor Force | Unemployed |
| 16 to 19 Years | 459 (56.6%) | 65 (14.2%) |
| 20 to 24 Years | 583 (84.9%) | 180 (30.9%) |
| 25 to 29 Years | 641 (94.3%) | 70 (10.9%) |
| 30 to 34 Years | 915 (83.9%) | 13 (1.4%) |
| 35 to 44 Years | 1,457 (83.9%) | 157 (10.8%) |
| 45 to 54 Years | 1,041 (75.4%) | 57 (5.5%) |
| 55 to 59 Years | 822 (77.0%) | 73 (8.9%) |
| 60 to 64 Years | 447 (71.5%) | 0 (0.0%) |
| 65 to 74 Years | 268 (27.9%) | 39 (14.6%) |
| 75 Years and over | 28 (3.8%) | 0 (0.0%) |
| Total | 6,666 (68.2%) | 653 (9.8%) |
Employment Status by Educational Attainment in Webster
According to labor force statistics for Webster, 80.9% of individuals (5,323) out of the total population between 25 and 64 years of age (6,580) are in the labor force, with 6.9% or 367 of them being unemployed. The group with the highest labor force participation rate are those with the educational attainment of bachelor's degree or higher, with 90.9% or 1,309 individuals in the labor force. Within the labor force, individuals with college / associate degree education have the highest percentage of unemployment, with 9.1% or 174 of them being unemployed.
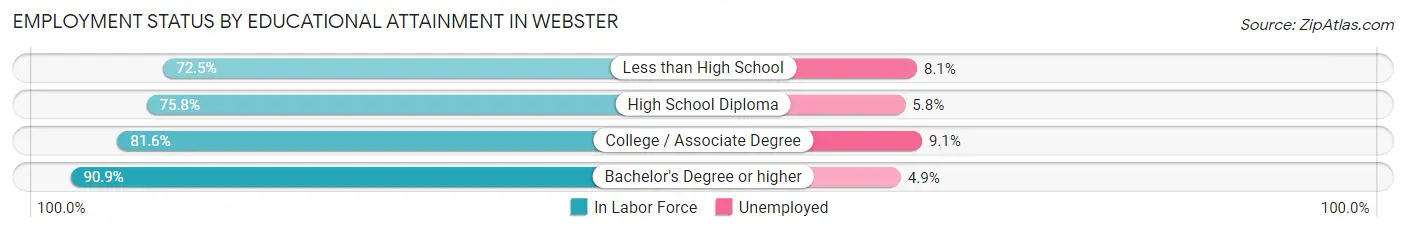
| Educational Attainment | In Labor Force | Unemployed |
| Less than High School | 359 (72.5%) | 40 (8.1%) |
| High School Diploma | 1,749 (75.8%) | 134 (5.8%) |
| College / Associate Degree | 1,907 (81.6%) | 213 (9.1%) |
| Bachelor's Degree or higher | 1,309 (90.9%) | 71 (4.9%) |
| Total | 5,323 (80.9%) | 454 (6.9%) |
Employment Occupations by Sex in Webster
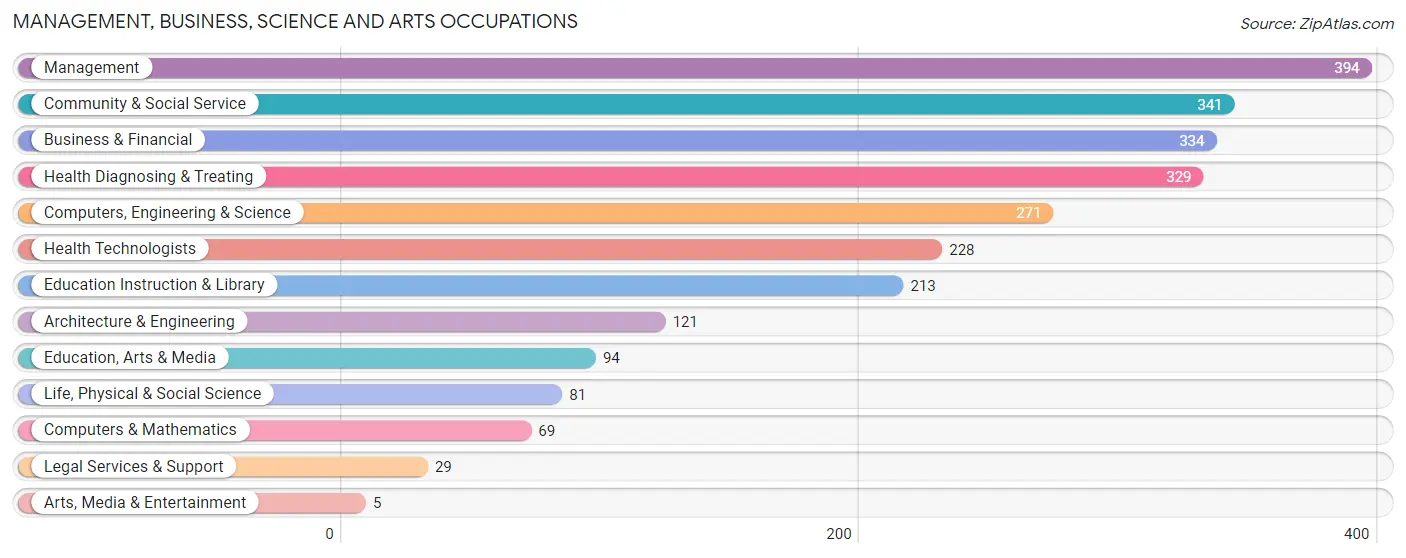
Management, Business, Science and Arts Occupations
The most common Management, Business, Science and Arts occupations in Webster are Management (394 | 6.7%), Community & Social Service (341 | 5.8%), Business & Financial (334 | 5.6%), Health Diagnosing & Treating (329 | 5.6%), and Computers, Engineering & Science (271 | 4.6%).
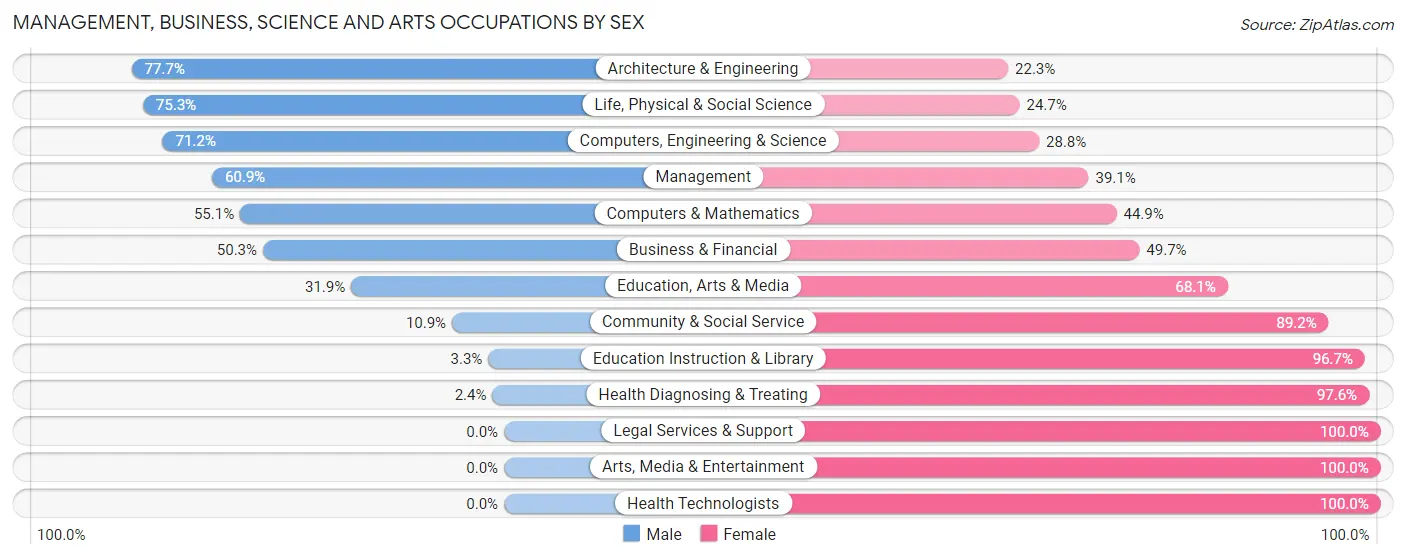
Management, Business, Science and Arts Occupations by Sex
Within the Management, Business, Science and Arts occupations in Webster, the most male-oriented occupations are Architecture & Engineering (77.7%), Life, Physical & Social Science (75.3%), and Computers, Engineering & Science (71.2%), while the most female-oriented occupations are Legal Services & Support (100.0%), Arts, Media & Entertainment (100.0%), and Health Technologists (100.0%).
| Occupation | Male | Female |
| Management | 240 (60.9%) | 154 (39.1%) |
| Business & Financial | 168 (50.3%) | 166 (49.7%) |
| Computers, Engineering & Science | 193 (71.2%) | 78 (28.8%) |
| Computers & Mathematics | 38 (55.1%) | 31 (44.9%) |
| Architecture & Engineering | 94 (77.7%) | 27 (22.3%) |
| Life, Physical & Social Science | 61 (75.3%) | 20 (24.7%) |
| Community & Social Service | 37 (10.8%) | 304 (89.1%) |
| Education, Arts & Media | 30 (31.9%) | 64 (68.1%) |
| Legal Services & Support | 0 (0.0%) | 29 (100.0%) |
| Education Instruction & Library | 7 (3.3%) | 206 (96.7%) |
| Arts, Media & Entertainment | 0 (0.0%) | 5 (100.0%) |
| Health Diagnosing & Treating | 8 (2.4%) | 321 (97.6%) |
| Health Technologists | 0 (0.0%) | 228 (100.0%) |
| Total (Category) | 646 (38.7%) | 1,023 (61.3%) |
| Total (Overall) | 2,934 (49.6%) | 2,985 (50.4%) |
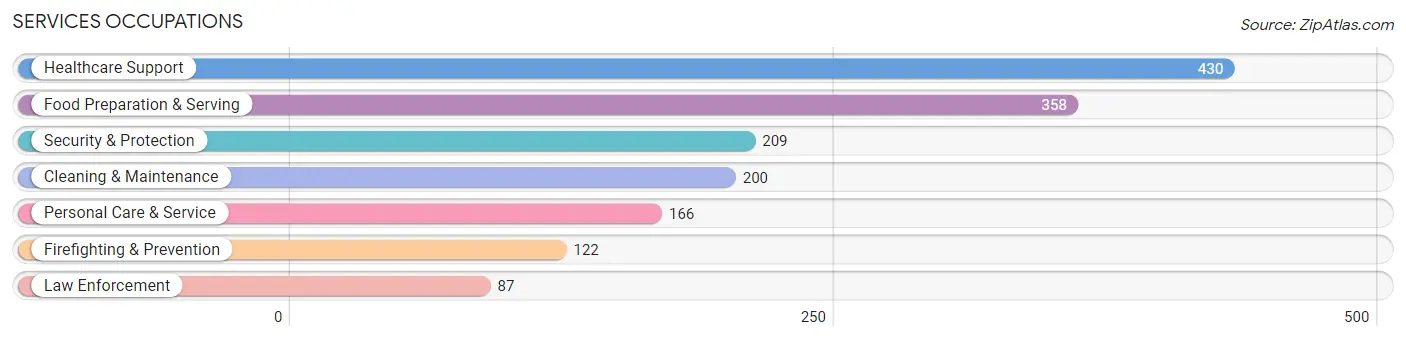
Services Occupations
The most common Services occupations in Webster are Healthcare Support (430 | 7.3%), Food Preparation & Serving (358 | 6.0%), Security & Protection (209 | 3.5%), Cleaning & Maintenance (200 | 3.4%), and Personal Care & Service (166 | 2.8%).
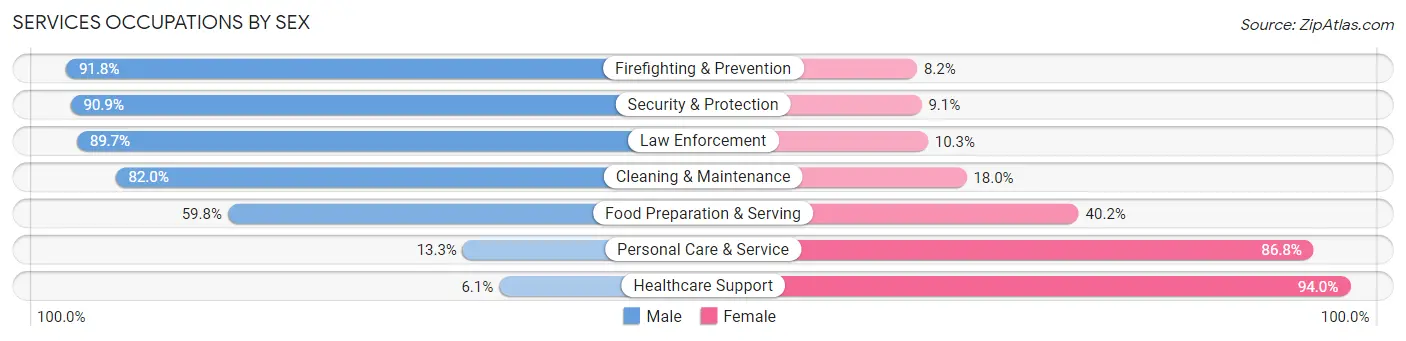
Services Occupations by Sex
Within the Services occupations in Webster, the most male-oriented occupations are Firefighting & Prevention (91.8%), Security & Protection (90.9%), and Law Enforcement (89.7%), while the most female-oriented occupations are Healthcare Support (94.0%), Personal Care & Service (86.8%), and Food Preparation & Serving (40.2%).
| Occupation | Male | Female |
| Healthcare Support | 26 (6.0%) | 404 (94.0%) |
| Security & Protection | 190 (90.9%) | 19 (9.1%) |
| Firefighting & Prevention | 112 (91.8%) | 10 (8.2%) |
| Law Enforcement | 78 (89.7%) | 9 (10.3%) |
| Food Preparation & Serving | 214 (59.8%) | 144 (40.2%) |
| Cleaning & Maintenance | 164 (82.0%) | 36 (18.0%) |
| Personal Care & Service | 22 (13.3%) | 144 (86.8%) |
| Total (Category) | 616 (45.2%) | 747 (54.8%) |
| Total (Overall) | 2,934 (49.6%) | 2,985 (50.4%) |
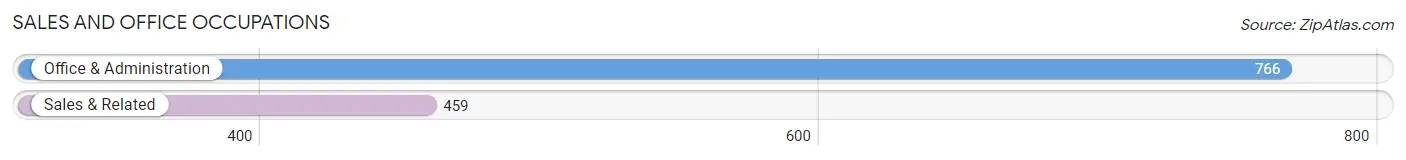
Sales and Office Occupations
The most common Sales and Office occupations in Webster are Office & Administration (766 | 12.9%), and Sales & Related (459 | 7.7%).
Sales and Office Occupations by Sex

| Occupation | Male | Female |
| Sales & Related | 142 (30.9%) | 317 (69.1%) |
| Office & Administration | 98 (12.8%) | 668 (87.2%) |
| Total (Category) | 240 (19.6%) | 985 (80.4%) |
| Total (Overall) | 2,934 (49.6%) | 2,985 (50.4%) |
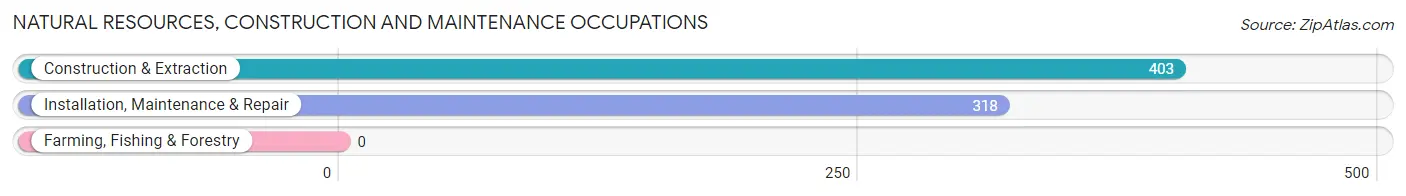
Natural Resources, Construction and Maintenance Occupations
The most common Natural Resources, Construction and Maintenance occupations in Webster are Construction & Extraction (403 | 6.8%), and Installation, Maintenance & Repair (318 | 5.4%).
Natural Resources, Construction and Maintenance Occupations by Sex
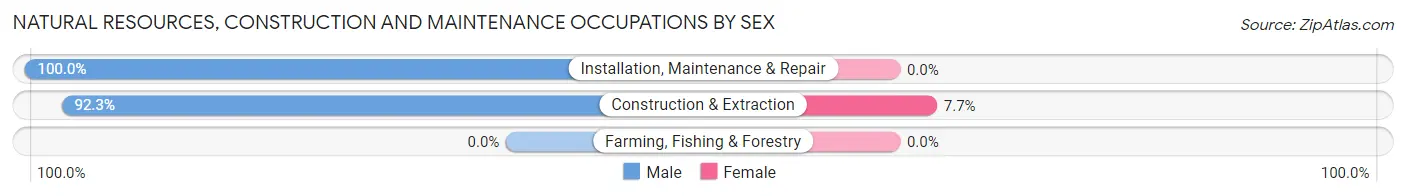
| Occupation | Male | Female |
| Farming, Fishing & Forestry | 0 (0.0%) | 0 (0.0%) |
| Construction & Extraction | 372 (92.3%) | 31 (7.7%) |
| Installation, Maintenance & Repair | 318 (100.0%) | 0 (0.0%) |
| Total (Category) | 690 (95.7%) | 31 (4.3%) |
| Total (Overall) | 2,934 (49.6%) | 2,985 (50.4%) |
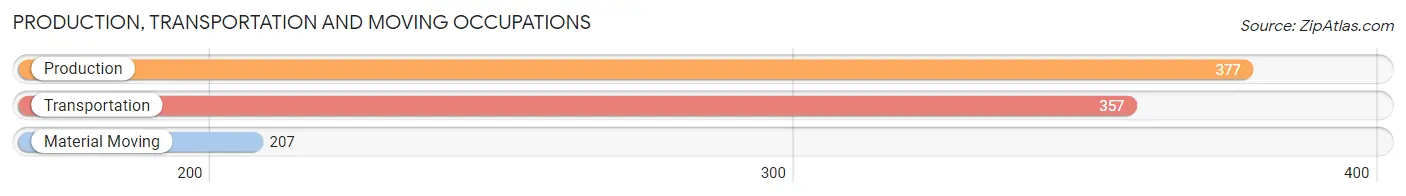
Production, Transportation and Moving Occupations
The most common Production, Transportation and Moving occupations in Webster are Production (377 | 6.4%), Transportation (357 | 6.0%), and Material Moving (207 | 3.5%).
Production, Transportation and Moving Occupations by Sex
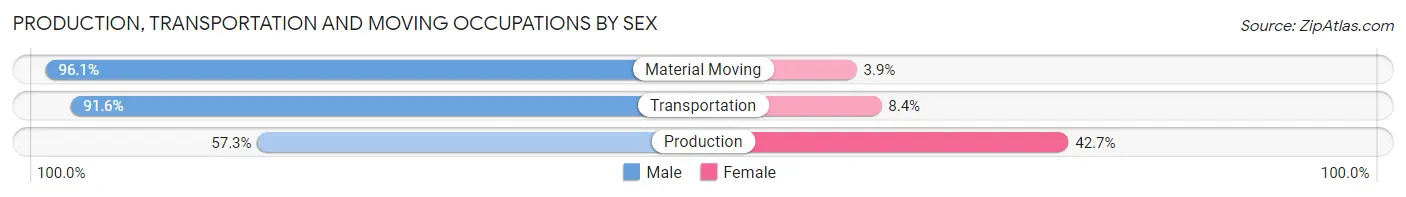
| Occupation | Male | Female |
| Production | 216 (57.3%) | 161 (42.7%) |
| Transportation | 327 (91.6%) | 30 (8.4%) |
| Material Moving | 199 (96.1%) | 8 (3.9%) |
| Total (Category) | 742 (78.8%) | 199 (21.1%) |
| Total (Overall) | 2,934 (49.6%) | 2,985 (50.4%) |
Employment Industries by Sex in Webster
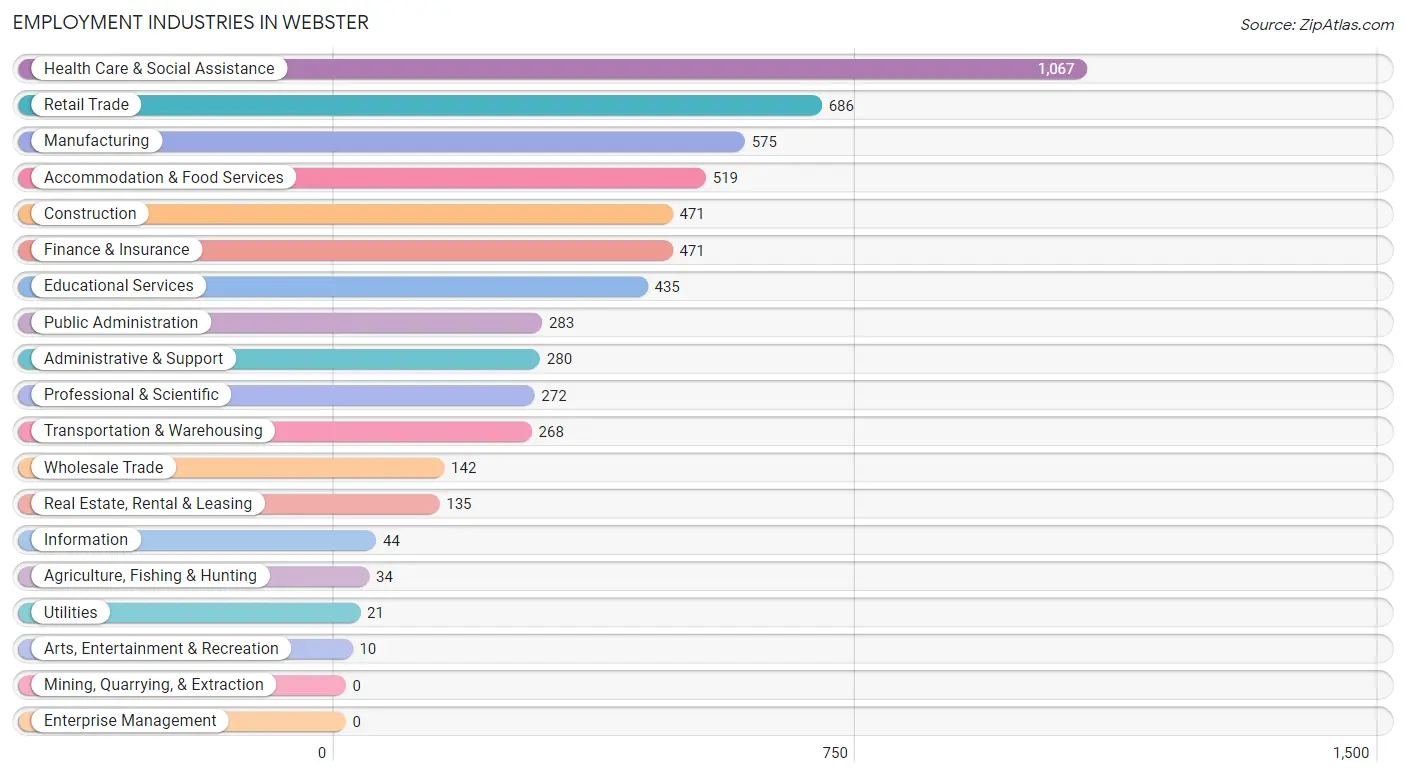
Employment Industries in Webster
The major employment industries in Webster include Health Care & Social Assistance (1,067 | 18.0%), Retail Trade (686 | 11.6%), Manufacturing (575 | 9.7%), Accommodation & Food Services (519 | 8.8%), and Construction (471 | 8.0%).
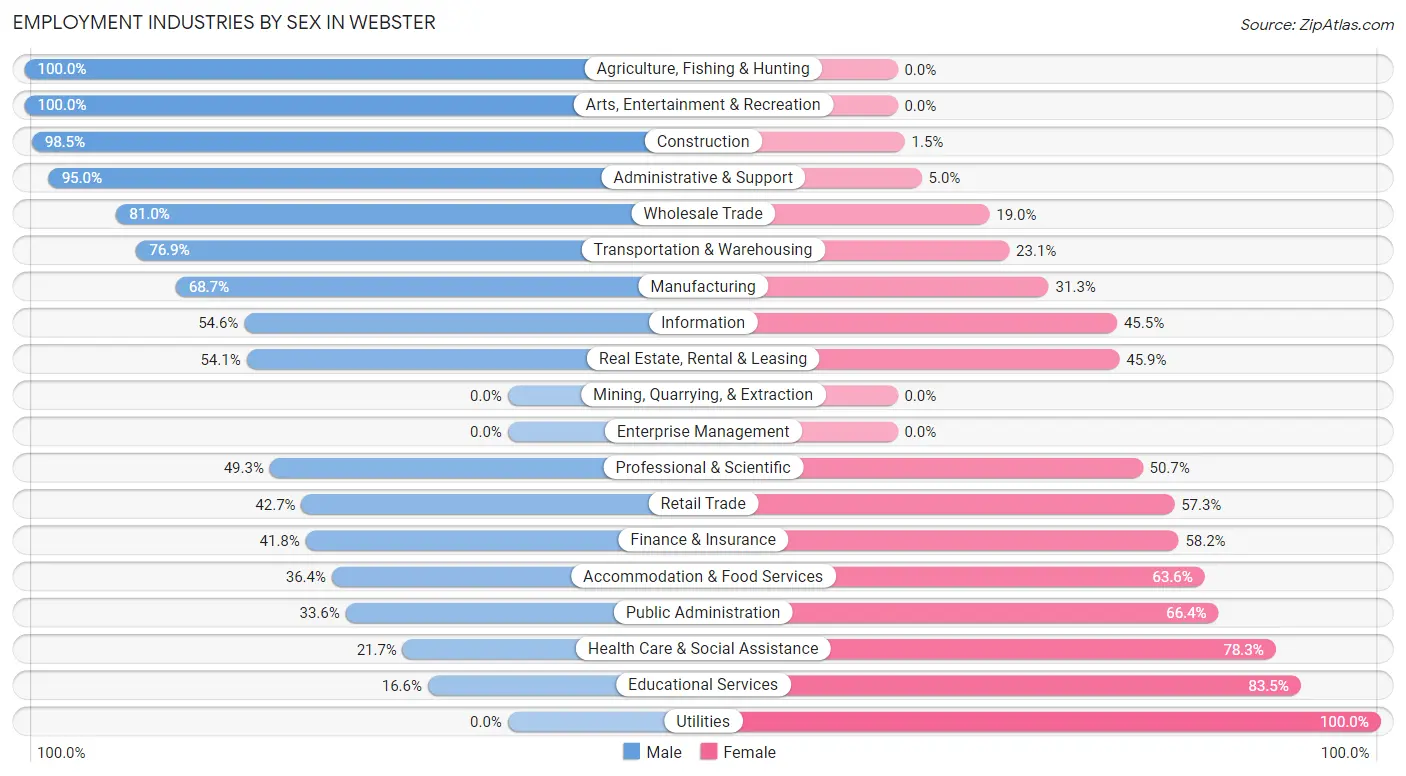
Employment Industries by Sex in Webster
The Webster industries that see more men than women are Agriculture, Fishing & Hunting (100.0%), Arts, Entertainment & Recreation (100.0%), and Construction (98.5%), whereas the industries that tend to have a higher number of women are Utilities (100.0%), Educational Services (83.5%), and Health Care & Social Assistance (78.3%).
| Industry | Male | Female |
| Agriculture, Fishing & Hunting | 34 (100.0%) | 0 (0.0%) |
| Mining, Quarrying, & Extraction | 0 (0.0%) | 0 (0.0%) |
| Construction | 464 (98.5%) | 7 (1.5%) |
| Manufacturing | 395 (68.7%) | 180 (31.3%) |
| Wholesale Trade | 115 (81.0%) | 27 (19.0%) |
| Retail Trade | 293 (42.7%) | 393 (57.3%) |
| Transportation & Warehousing | 206 (76.9%) | 62 (23.1%) |
| Utilities | 0 (0.0%) | 21 (100.0%) |
| Information | 24 (54.5%) | 20 (45.5%) |
| Finance & Insurance | 197 (41.8%) | 274 (58.2%) |
| Real Estate, Rental & Leasing | 73 (54.1%) | 62 (45.9%) |
| Professional & Scientific | 134 (49.3%) | 138 (50.7%) |
| Enterprise Management | 0 (0.0%) | 0 (0.0%) |
| Administrative & Support | 266 (95.0%) | 14 (5.0%) |
| Educational Services | 72 (16.6%) | 363 (83.5%) |
| Health Care & Social Assistance | 232 (21.7%) | 835 (78.3%) |
| Arts, Entertainment & Recreation | 10 (100.0%) | 0 (0.0%) |
| Accommodation & Food Services | 189 (36.4%) | 330 (63.6%) |
| Public Administration | 95 (33.6%) | 188 (66.4%) |
| Total | 2,934 (49.6%) | 2,985 (50.4%) |
Education in Webster
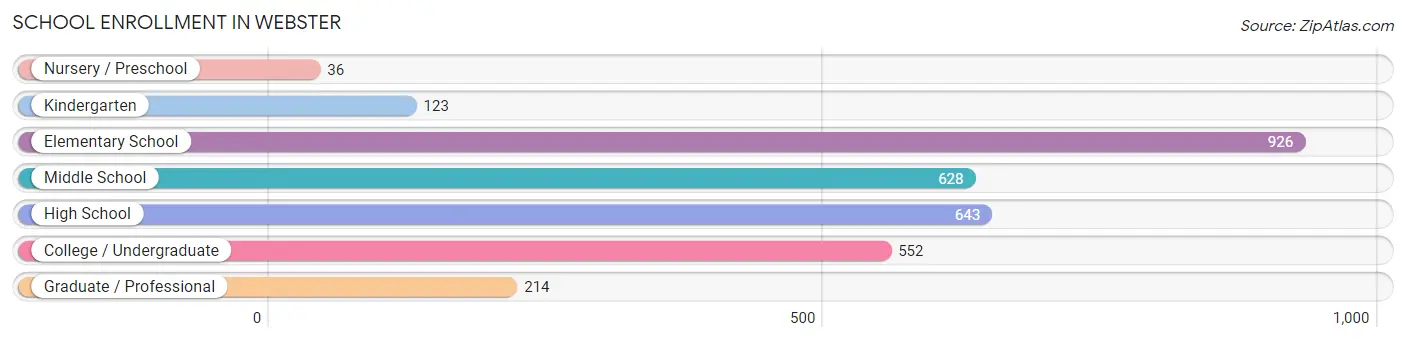
School Enrollment in Webster
The most common levels of schooling among the 3,122 students in Webster are elementary school (926 | 29.7%), high school (643 | 20.6%), and middle school (628 | 20.1%).
| School Level | # Students | % Students |
| Nursery / Preschool | 36 | 1.1% |
| Kindergarten | 123 | 3.9% |
| Elementary School | 926 | 29.7% |
| Middle School | 628 | 20.1% |
| High School | 643 | 20.6% |
| College / Undergraduate | 552 | 17.7% |
| Graduate / Professional | 214 | 6.9% |
| Total | 3,122 | 100.0% |
School Enrollment by Age by Funding Source in Webster
Out of a total of 3,122 students who are enrolled in schools in Webster, 556 (17.8%) attend a private institution, while the remaining 2,566 (82.2%) are enrolled in public schools. The age group of 3 to 4 year olds has the highest likelihood of being enrolled in private schools, with 26 (72.2% in the age bracket) enrolled. Conversely, the age group of 18 to 19 year olds has the lowest likelihood of being enrolled in a private school, with 248 (100.0% in the age bracket) attending a public institution.
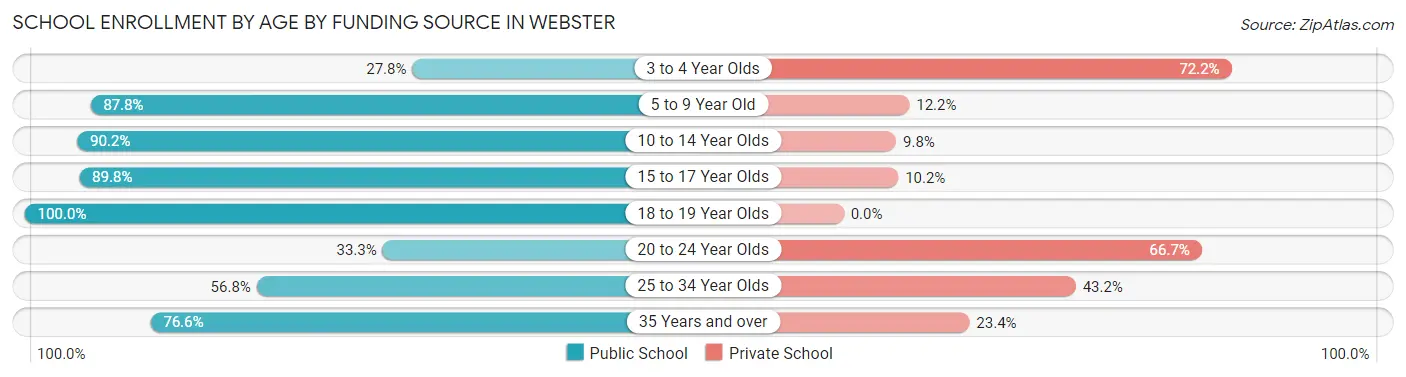
| Age Bracket | Public School | Private School |
| 3 to 4 Year Olds | 10 (27.8%) | 26 (72.2%) |
| 5 to 9 Year Old | 812 (87.8%) | 113 (12.2%) |
| 10 to 14 Year Olds | 693 (90.2%) | 75 (9.8%) |
| 15 to 17 Year Olds | 460 (89.8%) | 52 (10.2%) |
| 18 to 19 Year Olds | 248 (100.0%) | 0 (0.0%) |
| 20 to 24 Year Olds | 56 (33.3%) | 112 (66.7%) |
| 25 to 34 Year Olds | 201 (56.8%) | 153 (43.2%) |
| 35 Years and over | 85 (76.6%) | 26 (23.4%) |
| Total | 2,566 (82.2%) | 556 (17.8%) |
Educational Attainment by Field of Study in Webster
Business (355 | 19.8%), science & technology (329 | 18.3%), arts & humanities (220 | 12.2%), education (170 | 9.5%), and psychology (169 | 9.4%) are the most common fields of study among 1,796 individuals in Webster who have obtained a bachelor's degree or higher.
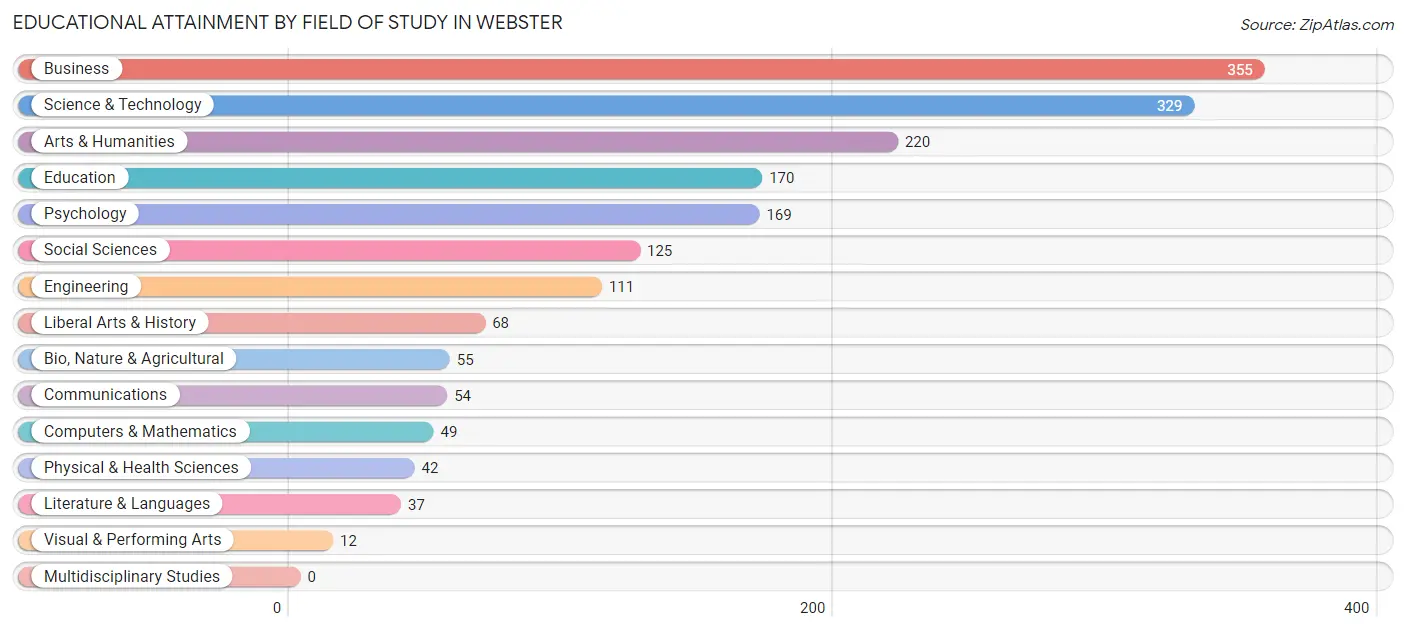
| Field of Study | # Graduates | % Graduates |
| Computers & Mathematics | 49 | 2.7% |
| Bio, Nature & Agricultural | 55 | 3.1% |
| Physical & Health Sciences | 42 | 2.3% |
| Psychology | 169 | 9.4% |
| Social Sciences | 125 | 7.0% |
| Engineering | 111 | 6.2% |
| Multidisciplinary Studies | 0 | 0.0% |
| Science & Technology | 329 | 18.3% |
| Business | 355 | 19.8% |
| Education | 170 | 9.5% |
| Literature & Languages | 37 | 2.1% |
| Liberal Arts & History | 68 | 3.8% |
| Visual & Performing Arts | 12 | 0.7% |
| Communications | 54 | 3.0% |
| Arts & Humanities | 220 | 12.2% |
| Total | 1,796 | 100.0% |
Transportation & Commute in Webster
Vehicle Availability by Sex in Webster
The most prevalent vehicle ownership categories in Webster are males with 2 vehicles (1,194, accounting for 43.2%) and females with 2 vehicles (1,268, making up 40.6%).
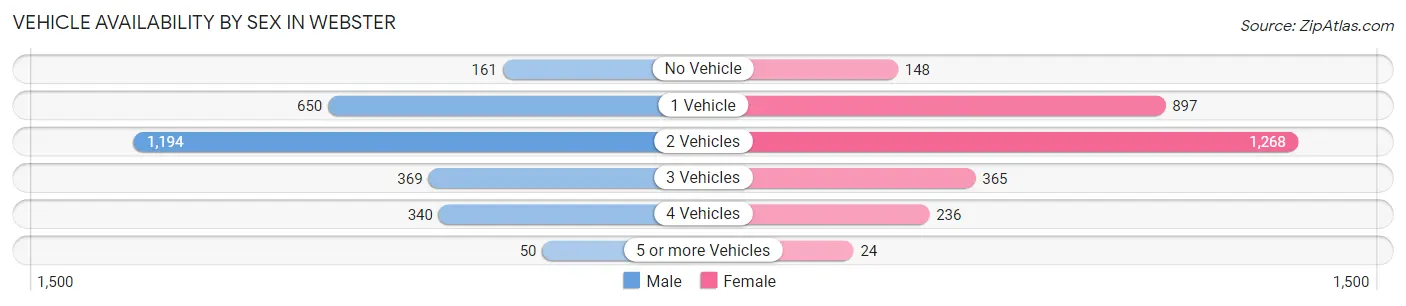
| Vehicles Available | Male | Female |
| No Vehicle | 161 (5.8%) | 148 (5.0%) |
| 1 Vehicle | 650 (23.5%) | 897 (30.5%) |
| 2 Vehicles | 1,194 (43.2%) | 1,268 (43.2%) |
| 3 Vehicles | 369 (13.4%) | 365 (12.4%) |
| 4 Vehicles | 340 (12.3%) | 236 (8.0%) |
| 5 or more Vehicles | 50 (1.8%) | 24 (0.8%) |
| Total | 2,764 (100.0%) | 2,938 (100.0%) |
Commute Time in Webster
The most frequently occuring commute durations in Webster are 30 to 34 minutes (913 commuters, 17.1%), 5 to 9 minutes (806 commuters, 15.1%), and 60 to 89 minutes (660 commuters, 12.4%).
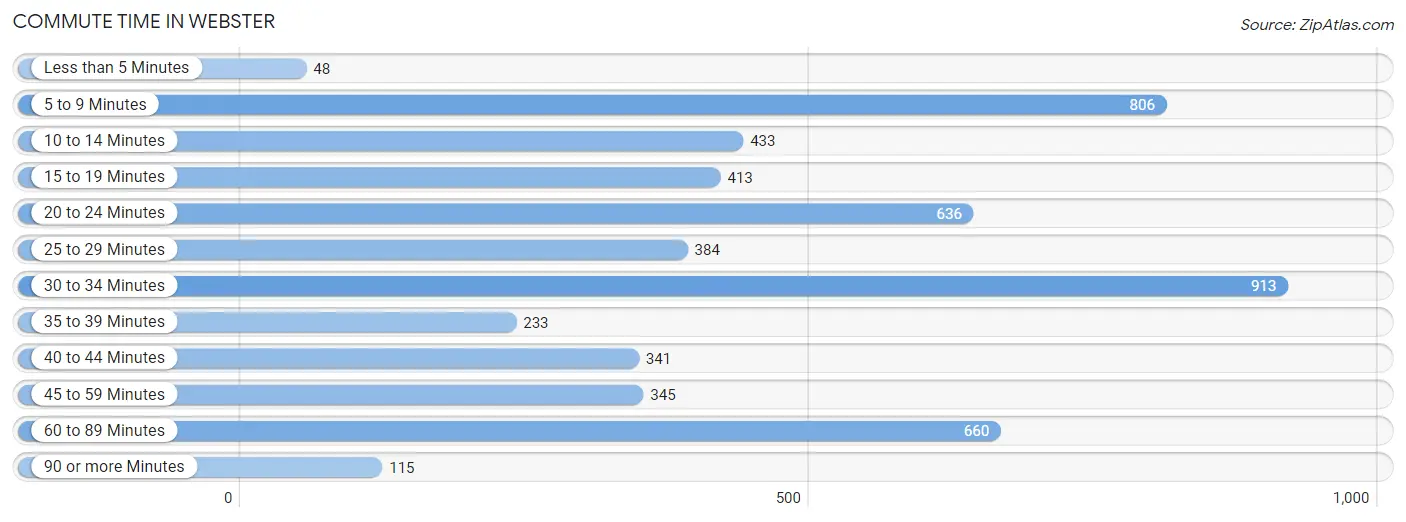
| Commute Time | # Commuters | % Commuters |
| Less than 5 Minutes | 48 | 0.9% |
| 5 to 9 Minutes | 806 | 15.1% |
| 10 to 14 Minutes | 433 | 8.1% |
| 15 to 19 Minutes | 413 | 7.7% |
| 20 to 24 Minutes | 636 | 11.9% |
| 25 to 29 Minutes | 384 | 7.2% |
| 30 to 34 Minutes | 913 | 17.1% |
| 35 to 39 Minutes | 233 | 4.4% |
| 40 to 44 Minutes | 341 | 6.4% |
| 45 to 59 Minutes | 345 | 6.5% |
| 60 to 89 Minutes | 660 | 12.4% |
| 90 or more Minutes | 115 | 2.2% |
Commute Time by Sex in Webster
The most common commute times in Webster are 60 to 89 minutes (503 commuters, 19.5%) for males and 5 to 9 minutes (537 commuters, 19.6%) for females.
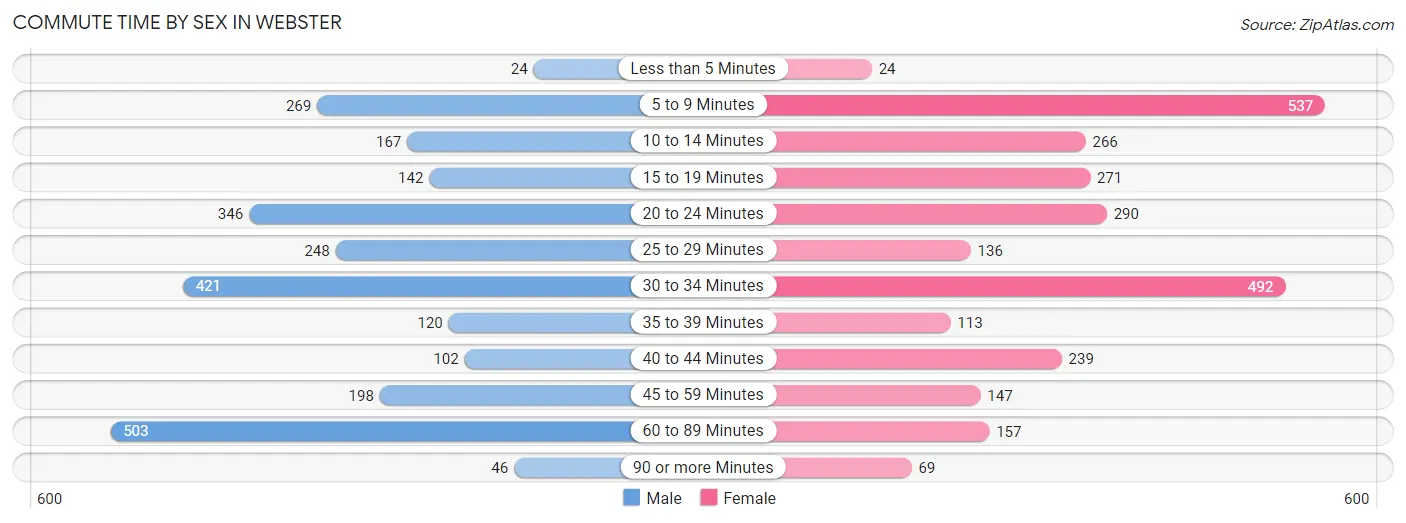
| Commute Time | Male | Female |
| Less than 5 Minutes | 24 (0.9%) | 24 (0.9%) |
| 5 to 9 Minutes | 269 (10.4%) | 537 (19.6%) |
| 10 to 14 Minutes | 167 (6.5%) | 266 (9.7%) |
| 15 to 19 Minutes | 142 (5.5%) | 271 (9.9%) |
| 20 to 24 Minutes | 346 (13.4%) | 290 (10.6%) |
| 25 to 29 Minutes | 248 (9.6%) | 136 (5.0%) |
| 30 to 34 Minutes | 421 (16.3%) | 492 (17.9%) |
| 35 to 39 Minutes | 120 (4.6%) | 113 (4.1%) |
| 40 to 44 Minutes | 102 (3.9%) | 239 (8.7%) |
| 45 to 59 Minutes | 198 (7.7%) | 147 (5.4%) |
| 60 to 89 Minutes | 503 (19.5%) | 157 (5.7%) |
| 90 or more Minutes | 46 (1.8%) | 69 (2.5%) |
Time of Departure to Work by Sex in Webster
The most frequent times of departure to work in Webster are 6:00 AM to 6:29 AM (307, 11.9%) for males and 7:00 AM to 7:29 AM (572, 20.9%) for females.
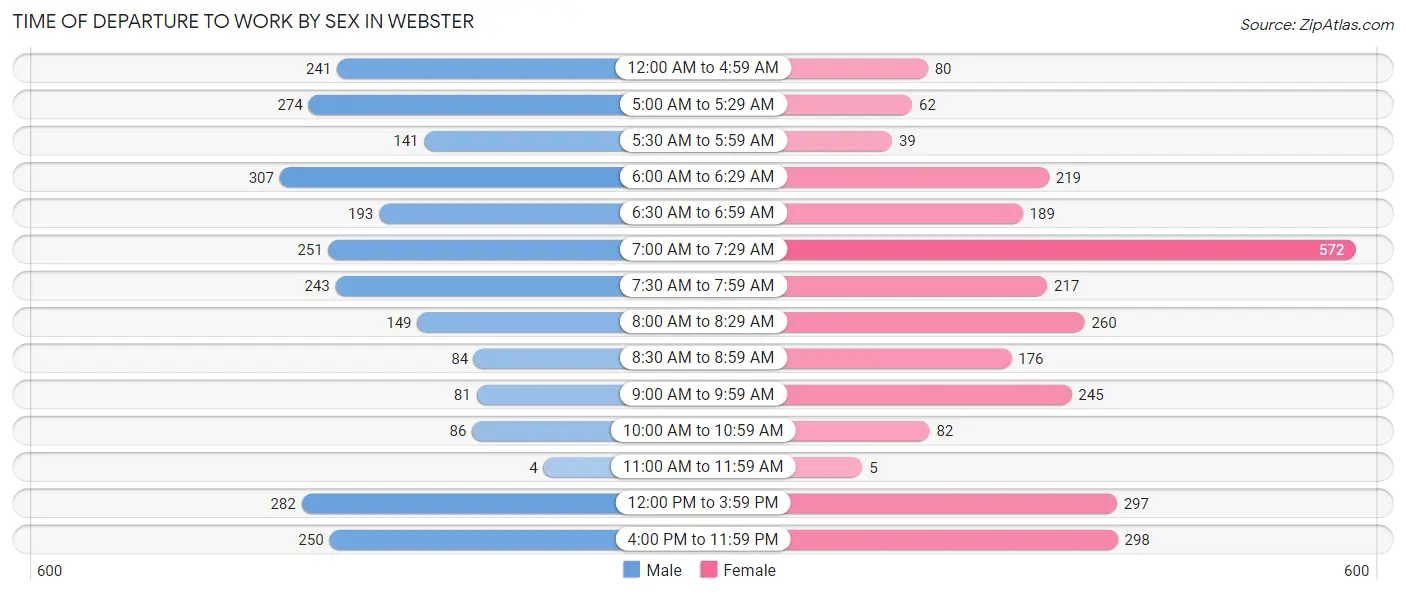
| Time of Departure | Male | Female |
| 12:00 AM to 4:59 AM | 241 (9.3%) | 80 (2.9%) |
| 5:00 AM to 5:29 AM | 274 (10.6%) | 62 (2.3%) |
| 5:30 AM to 5:59 AM | 141 (5.4%) | 39 (1.4%) |
| 6:00 AM to 6:29 AM | 307 (11.9%) | 219 (8.0%) |
| 6:30 AM to 6:59 AM | 193 (7.5%) | 189 (6.9%) |
| 7:00 AM to 7:29 AM | 251 (9.7%) | 572 (20.9%) |
| 7:30 AM to 7:59 AM | 243 (9.4%) | 217 (7.9%) |
| 8:00 AM to 8:29 AM | 149 (5.8%) | 260 (9.5%) |
| 8:30 AM to 8:59 AM | 84 (3.3%) | 176 (6.4%) |
| 9:00 AM to 9:59 AM | 81 (3.1%) | 245 (8.9%) |
| 10:00 AM to 10:59 AM | 86 (3.3%) | 82 (3.0%) |
| 11:00 AM to 11:59 AM | 4 (0.2%) | 5 (0.2%) |
| 12:00 PM to 3:59 PM | 282 (10.9%) | 297 (10.8%) |
| 4:00 PM to 11:59 PM | 250 (9.7%) | 298 (10.9%) |
| Total | 2,586 (100.0%) | 2,741 (100.0%) |
Housing Occupancy in Webster
Occupancy by Ownership in Webster
Of the total 5,033 dwellings in Webster, owner-occupied units account for 2,253 (44.8%), while renter-occupied units make up 2,780 (55.2%).
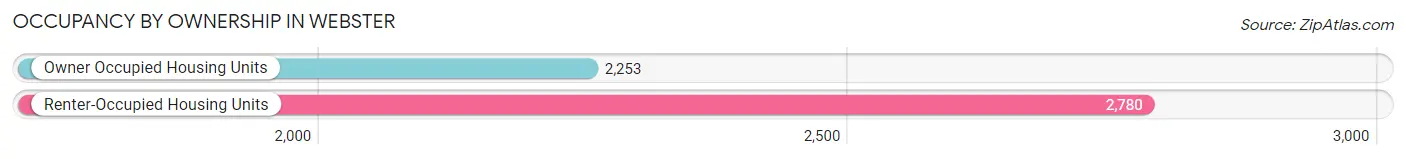
| Occupancy | # Housing Units | % Housing Units |
| Owner Occupied Housing Units | 2,253 | 44.8% |
| Renter-Occupied Housing Units | 2,780 | 55.2% |
| Total Occupied Housing Units | 5,033 | 100.0% |
Occupancy by Household Size in Webster
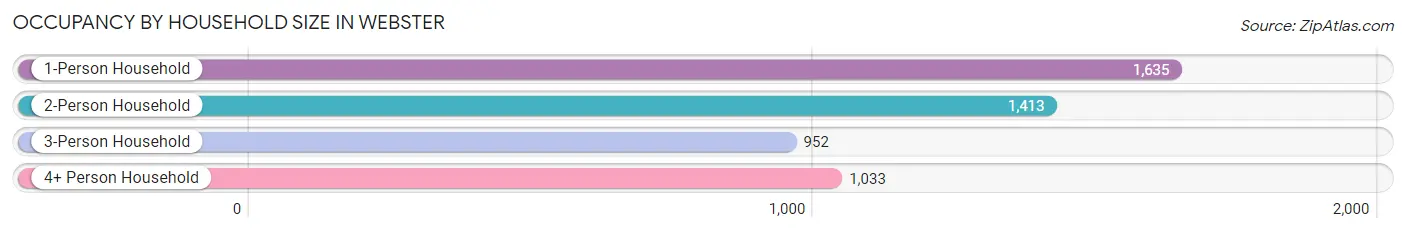
| Household Size | # Housing Units | % Housing Units |
| 1-Person Household | 1,635 | 32.5% |
| 2-Person Household | 1,413 | 28.1% |
| 3-Person Household | 952 | 18.9% |
| 4+ Person Household | 1,033 | 20.5% |
| Total Housing Units | 5,033 | 100.0% |
Occupancy by Ownership by Household Size in Webster
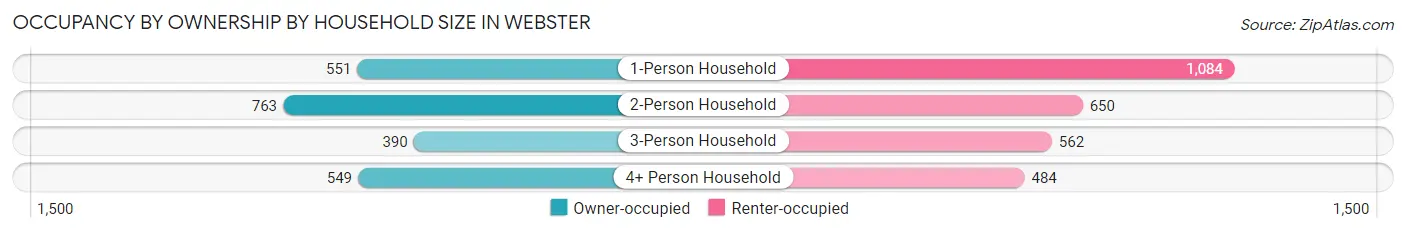
| Household Size | Owner-occupied | Renter-occupied |
| 1-Person Household | 551 (33.7%) | 1,084 (66.3%) |
| 2-Person Household | 763 (54.0%) | 650 (46.0%) |
| 3-Person Household | 390 (41.0%) | 562 (59.0%) |
| 4+ Person Household | 549 (53.1%) | 484 (46.9%) |
| Total Housing Units | 2,253 (44.8%) | 2,780 (55.2%) |
Occupancy by Educational Attainment in Webster
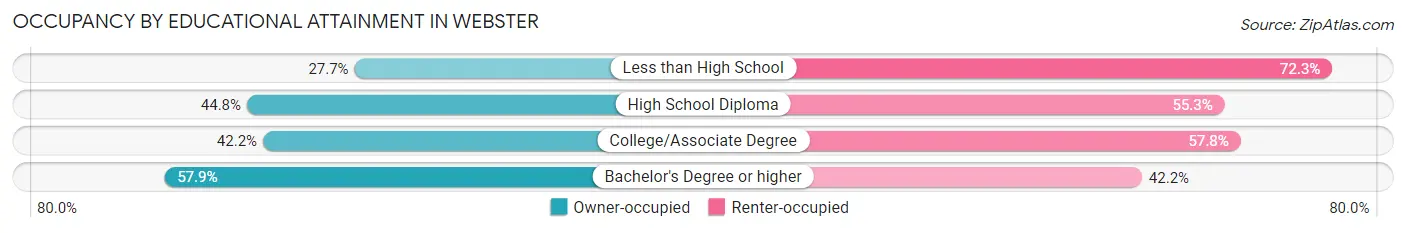
| Household Size | Owner-occupied | Renter-occupied |
| Less than High School | 106 (27.7%) | 277 (72.3%) |
| High School Diploma | 755 (44.8%) | 932 (55.2%) |
| College/Associate Degree | 869 (42.2%) | 1,190 (57.8%) |
| Bachelor's Degree or higher | 523 (57.9%) | 381 (42.1%) |
Occupancy by Age of Householder in Webster
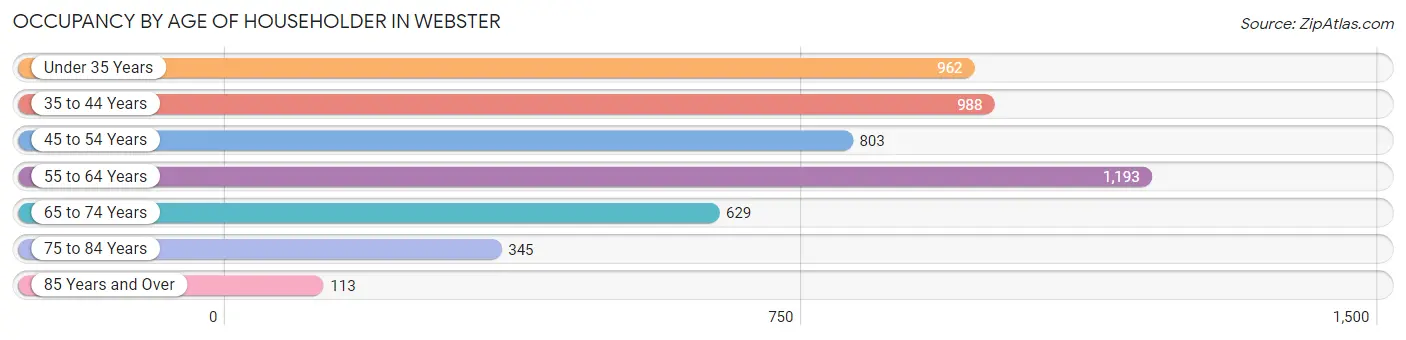
| Age Bracket | # Households | % Households |
| Under 35 Years | 962 | 19.1% |
| 35 to 44 Years | 988 | 19.6% |
| 45 to 54 Years | 803 | 16.0% |
| 55 to 64 Years | 1,193 | 23.7% |
| 65 to 74 Years | 629 | 12.5% |
| 75 to 84 Years | 345 | 6.9% |
| 85 Years and Over | 113 | 2.2% |
| Total | 5,033 | 100.0% |
Housing Finances in Webster
Median Income by Occupancy in Webster
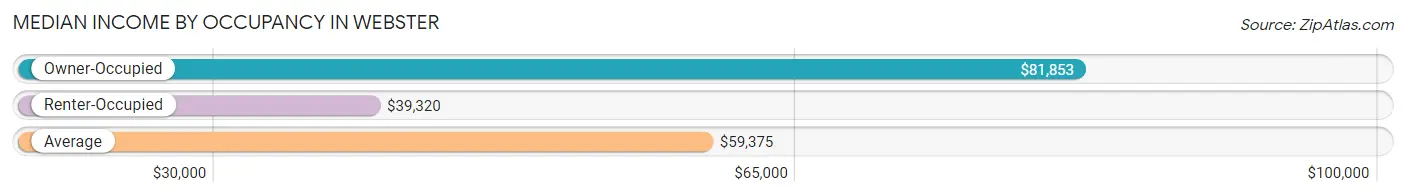
| Occupancy Type | # Households | Median Income |
| Owner-Occupied | 2,253 (44.8%) | $81,853 |
| Renter-Occupied | 2,780 (55.2%) | $39,320 |
| Average | 5,033 (100.0%) | $59,375 |
Occupancy by Householder Income Bracket in Webster
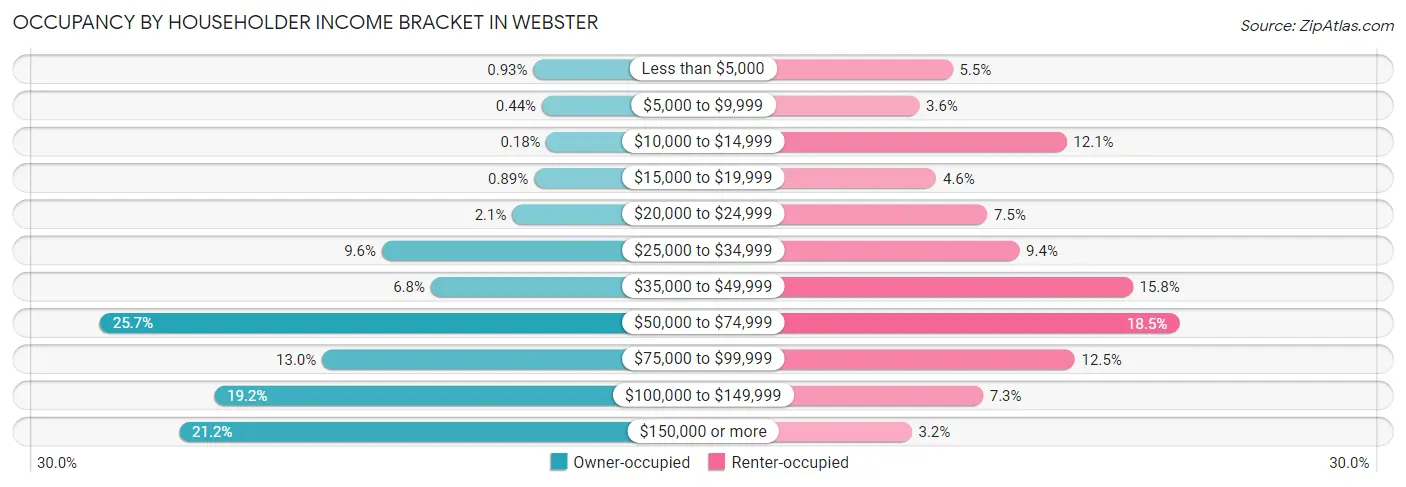
| Income Bracket | Owner-occupied | Renter-occupied |
| Less than $5,000 | 21 (0.9%) | 154 (5.5%) |
| $5,000 to $9,999 | 10 (0.4%) | 101 (3.6%) |
| $10,000 to $14,999 | 4 (0.2%) | 335 (12.0%) |
| $15,000 to $19,999 | 20 (0.9%) | 128 (4.6%) |
| $20,000 to $24,999 | 48 (2.1%) | 209 (7.5%) |
| $25,000 to $34,999 | 216 (9.6%) | 260 (9.3%) |
| $35,000 to $49,999 | 153 (6.8%) | 440 (15.8%) |
| $50,000 to $74,999 | 579 (25.7%) | 514 (18.5%) |
| $75,000 to $99,999 | 293 (13.0%) | 348 (12.5%) |
| $100,000 to $149,999 | 432 (19.2%) | 202 (7.3%) |
| $150,000 or more | 477 (21.2%) | 89 (3.2%) |
| Total | 2,253 (100.0%) | 2,780 (100.0%) |
Monthly Housing Cost Tiers in Webster
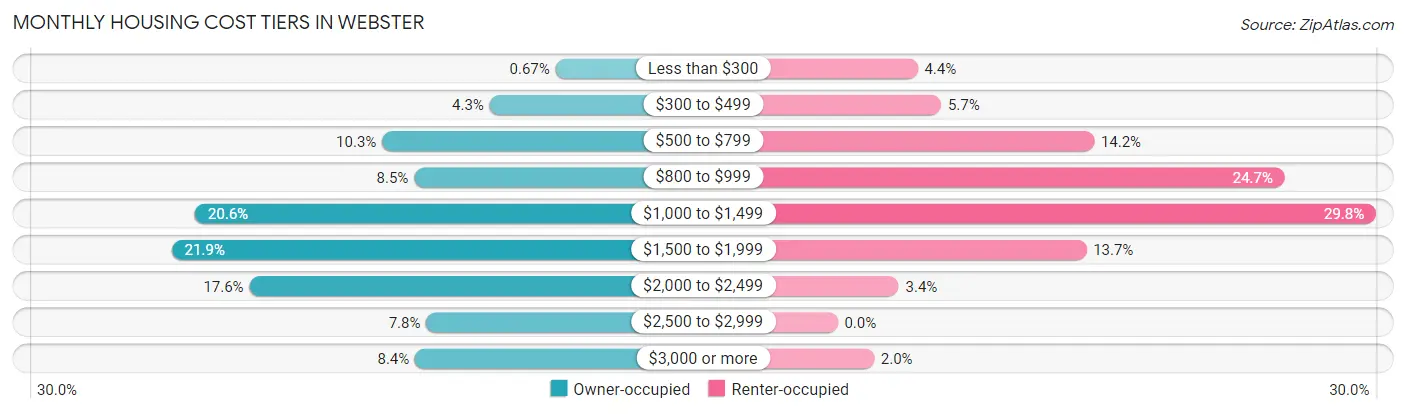
| Monthly Cost | Owner-occupied | Renter-occupied |
| Less than $300 | 15 (0.7%) | 123 (4.4%) |
| $300 to $499 | 97 (4.3%) | 159 (5.7%) |
| $500 to $799 | 231 (10.2%) | 394 (14.2%) |
| $800 to $999 | 191 (8.5%) | 687 (24.7%) |
| $1,000 to $1,499 | 464 (20.6%) | 827 (29.7%) |
| $1,500 to $1,999 | 493 (21.9%) | 382 (13.7%) |
| $2,000 to $2,499 | 396 (17.6%) | 94 (3.4%) |
| $2,500 to $2,999 | 176 (7.8%) | 0 (0.0%) |
| $3,000 or more | 190 (8.4%) | 56 (2.0%) |
| Total | 2,253 (100.0%) | 2,780 (100.0%) |
Physical Housing Characteristics in Webster
Housing Structures in Webster
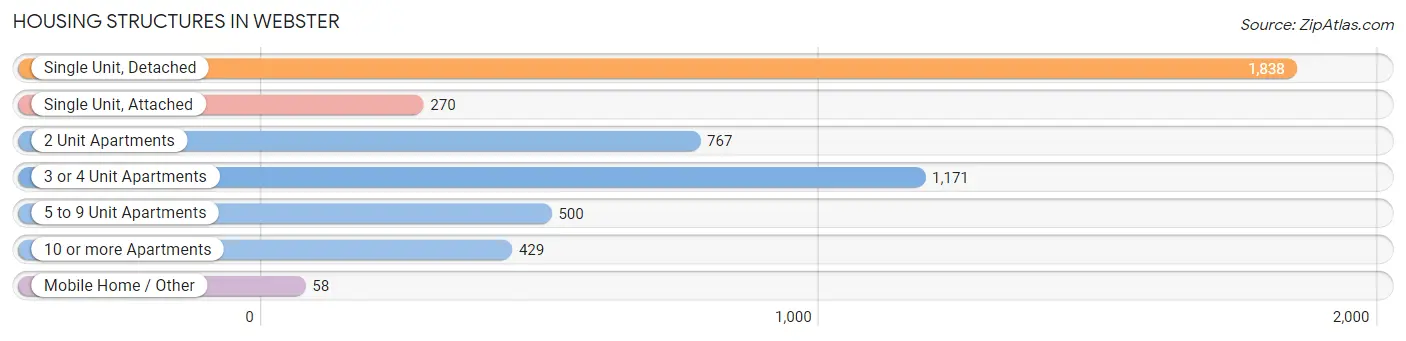
| Structure Type | # Housing Units | % Housing Units |
| Single Unit, Detached | 1,838 | 36.5% |
| Single Unit, Attached | 270 | 5.4% |
| 2 Unit Apartments | 767 | 15.2% |
| 3 or 4 Unit Apartments | 1,171 | 23.3% |
| 5 to 9 Unit Apartments | 500 | 9.9% |
| 10 or more Apartments | 429 | 8.5% |
| Mobile Home / Other | 58 | 1.1% |
| Total | 5,033 | 100.0% |
Housing Structures by Occupancy in Webster
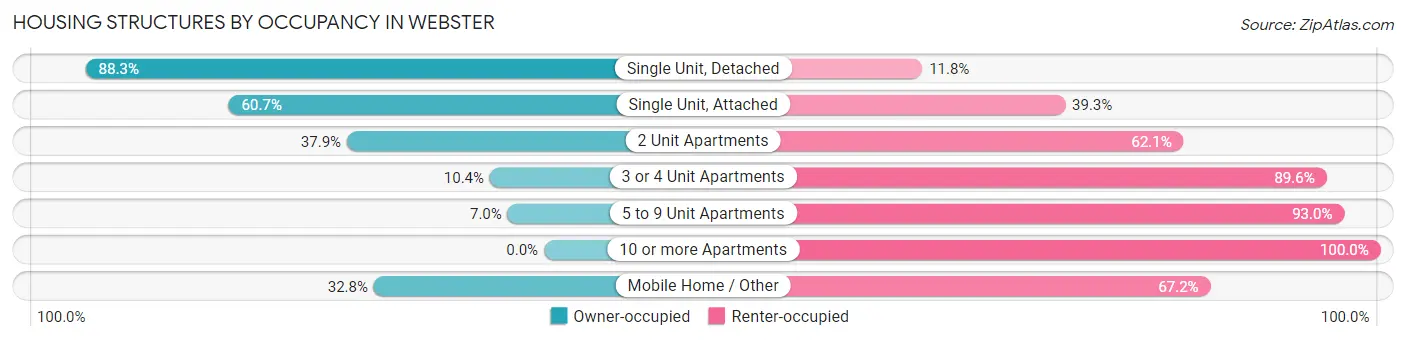
| Structure Type | Owner-occupied | Renter-occupied |
| Single Unit, Detached | 1,622 (88.2%) | 216 (11.7%) |
| Single Unit, Attached | 164 (60.7%) | 106 (39.3%) |
| 2 Unit Apartments | 291 (37.9%) | 476 (62.1%) |
| 3 or 4 Unit Apartments | 122 (10.4%) | 1,049 (89.6%) |
| 5 to 9 Unit Apartments | 35 (7.0%) | 465 (93.0%) |
| 10 or more Apartments | 0 (0.0%) | 429 (100.0%) |
| Mobile Home / Other | 19 (32.8%) | 39 (67.2%) |
| Total | 2,253 (44.8%) | 2,780 (55.2%) |
Housing Structures by Number of Rooms in Webster
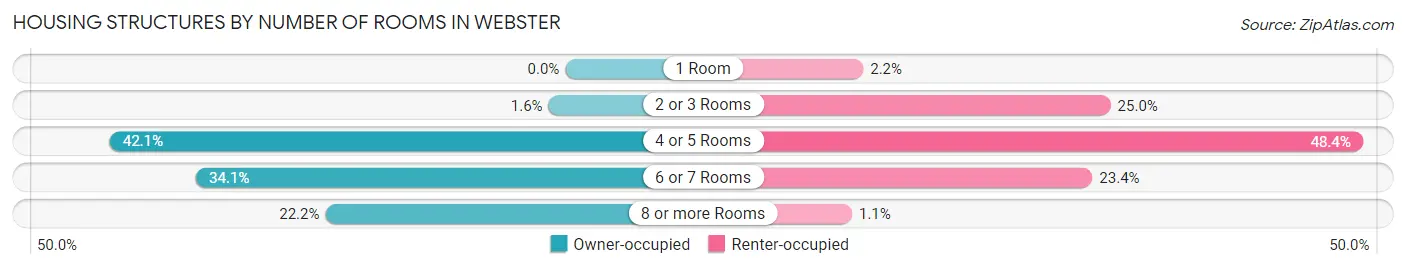
| Number of Rooms | Owner-occupied | Renter-occupied |
| 1 Room | 0 (0.0%) | 60 (2.2%) |
| 2 or 3 Rooms | 35 (1.5%) | 696 (25.0%) |
| 4 or 5 Rooms | 949 (42.1%) | 1,344 (48.3%) |
| 6 or 7 Rooms | 769 (34.1%) | 649 (23.4%) |
| 8 or more Rooms | 500 (22.2%) | 31 (1.1%) |
| Total | 2,253 (100.0%) | 2,780 (100.0%) |
Housing Structure by Heating Type in Webster
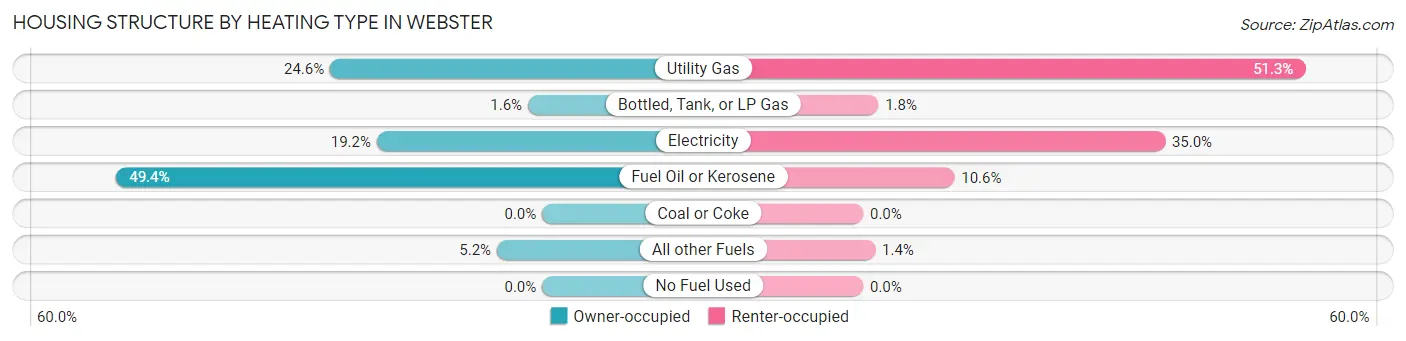
| Heating Type | Owner-occupied | Renter-occupied |
| Utility Gas | 554 (24.6%) | 1,425 (51.3%) |
| Bottled, Tank, or LP Gas | 37 (1.6%) | 49 (1.8%) |
| Electricity | 432 (19.2%) | 973 (35.0%) |
| Fuel Oil or Kerosene | 1,112 (49.4%) | 294 (10.6%) |
| Coal or Coke | 0 (0.0%) | 0 (0.0%) |
| All other Fuels | 118 (5.2%) | 39 (1.4%) |
| No Fuel Used | 0 (0.0%) | 0 (0.0%) |
| Total | 2,253 (100.0%) | 2,780 (100.0%) |
Household Vehicle Usage in Webster
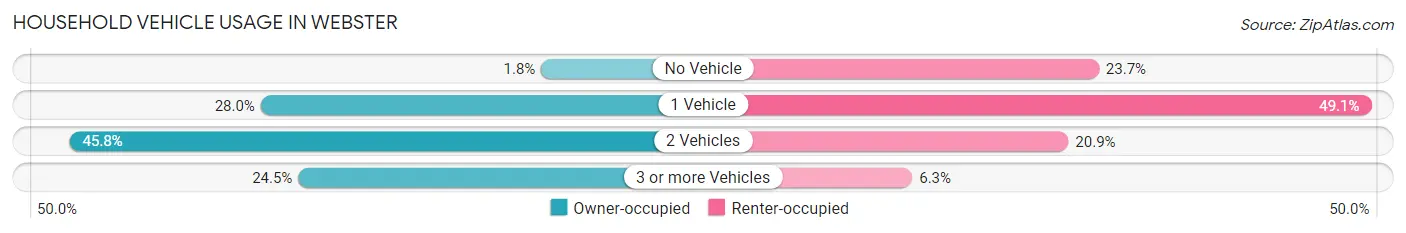
| Vehicles per Household | Owner-occupied | Renter-occupied |
| No Vehicle | 40 (1.8%) | 659 (23.7%) |
| 1 Vehicle | 630 (28.0%) | 1,366 (49.1%) |
| 2 Vehicles | 1,032 (45.8%) | 580 (20.9%) |
| 3 or more Vehicles | 551 (24.5%) | 175 (6.3%) |
| Total | 2,253 (100.0%) | 2,780 (100.0%) |
Real Estate & Mortgages in Webster
Real Estate and Mortgage Overview in Webster
| Characteristic | Without Mortgage | With Mortgage |
| Housing Units | 504 | 1,749 |
| Median Property Value | $268,900 | $275,500 |
| Median Household Income | $55,278 | $380 |
| Monthly Housing Costs | $662 | $190 |
| Real Estate Taxes | $2,603 | $0 |
Property Value by Mortgage Status in Webster
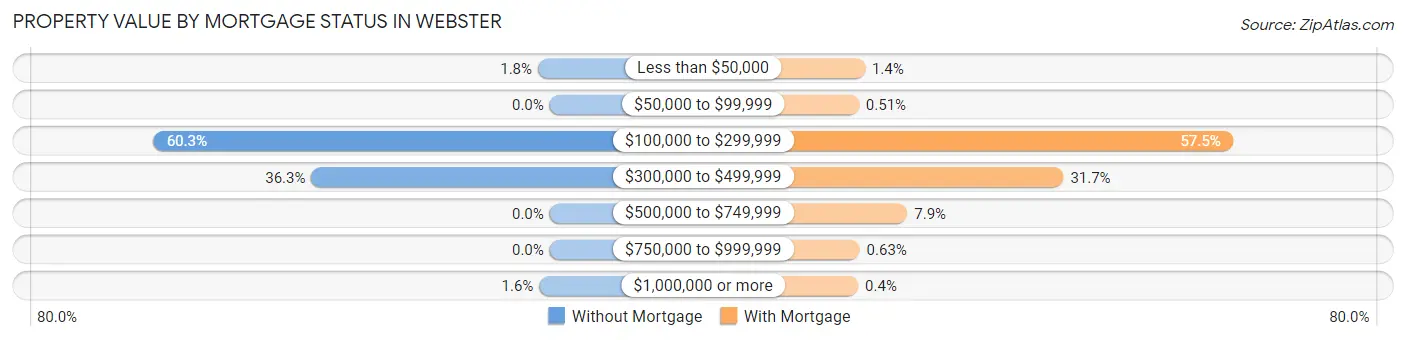
| Property Value | Without Mortgage | With Mortgage |
| Less than $50,000 | 9 (1.8%) | 25 (1.4%) |
| $50,000 to $99,999 | 0 (0.0%) | 9 (0.5%) |
| $100,000 to $299,999 | 304 (60.3%) | 1,005 (57.5%) |
| $300,000 to $499,999 | 183 (36.3%) | 554 (31.7%) |
| $500,000 to $749,999 | 0 (0.0%) | 138 (7.9%) |
| $750,000 to $999,999 | 0 (0.0%) | 11 (0.6%) |
| $1,000,000 or more | 8 (1.6%) | 7 (0.4%) |
| Total | 504 (100.0%) | 1,749 (100.0%) |
Household Income by Mortgage Status in Webster
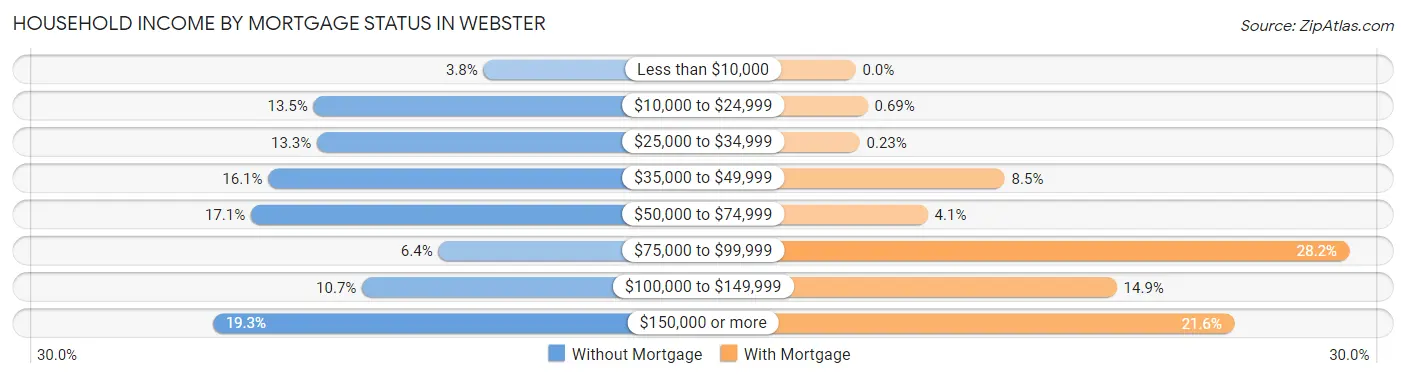
| Household Income | Without Mortgage | With Mortgage |
| Less than $10,000 | 19 (3.8%) | 0 (0.0%) |
| $10,000 to $24,999 | 68 (13.5%) | 12 (0.7%) |
| $25,000 to $34,999 | 67 (13.3%) | 4 (0.2%) |
| $35,000 to $49,999 | 81 (16.1%) | 149 (8.5%) |
| $50,000 to $74,999 | 86 (17.1%) | 72 (4.1%) |
| $75,000 to $99,999 | 32 (6.4%) | 493 (28.2%) |
| $100,000 to $149,999 | 54 (10.7%) | 261 (14.9%) |
| $150,000 or more | 97 (19.3%) | 378 (21.6%) |
| Total | 504 (100.0%) | 1,749 (100.0%) |
Property Value to Household Income Ratio in Webster
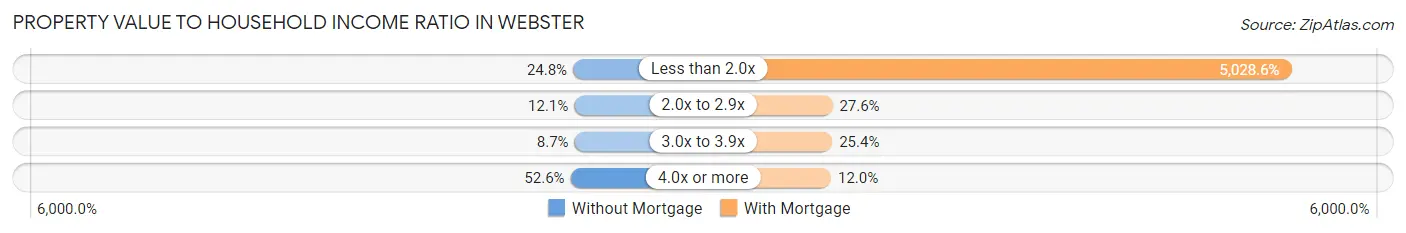
| Value-to-Income Ratio | Without Mortgage | With Mortgage |
| Less than 2.0x | 125 (24.8%) | 87,950 (5,028.6%) |
| 2.0x to 2.9x | 61 (12.1%) | 483 (27.6%) |
| 3.0x to 3.9x | 44 (8.7%) | 444 (25.4%) |
| 4.0x or more | 265 (52.6%) | 209 (11.9%) |
| Total | 504 (100.0%) | 1,749 (100.0%) |
Real Estate Taxes by Mortgage Status in Webster
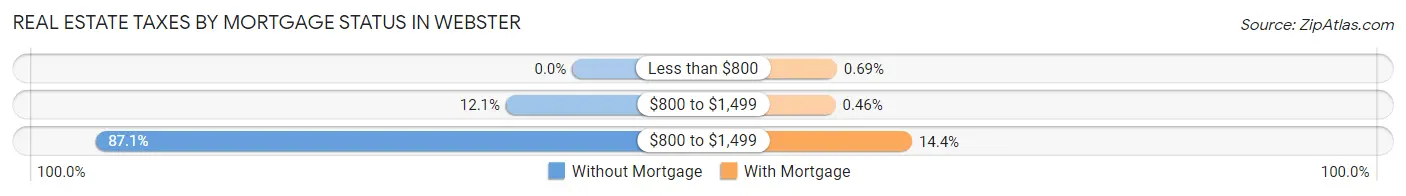
| Property Taxes | Without Mortgage | With Mortgage |
| Less than $800 | 0 (0.0%) | 12 (0.7%) |
| $800 to $1,499 | 61 (12.1%) | 8 (0.5%) |
| $800 to $1,499 | 439 (87.1%) | 252 (14.4%) |
| Total | 504 (100.0%) | 1,749 (100.0%) |
Health & Disability in Webster
Health Insurance Coverage by Age in Webster
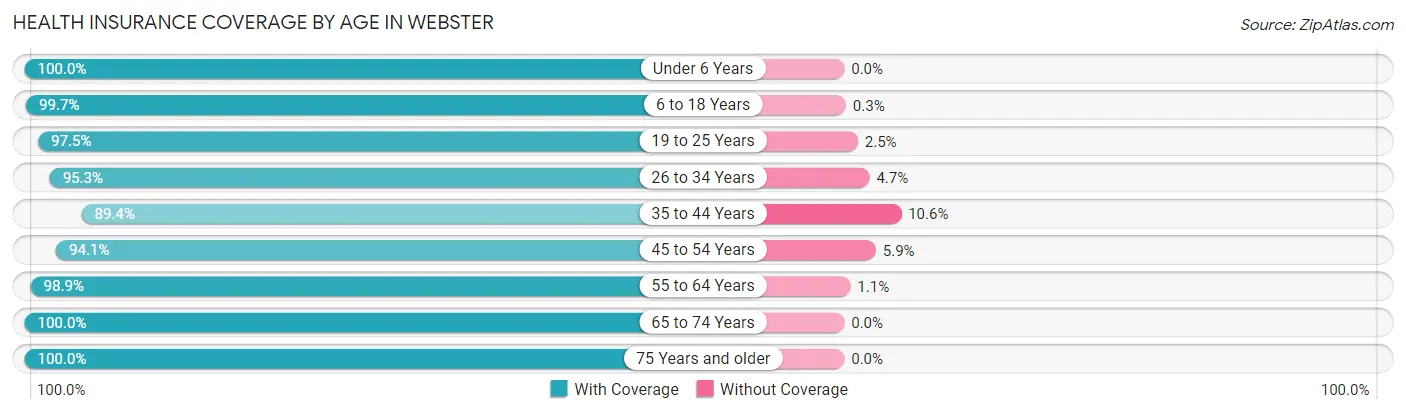
| Age Bracket | With Coverage | Without Coverage |
| Under 6 Years | 671 (100.0%) | 0 (0.0%) |
| 6 to 18 Years | 2,300 (99.7%) | 7 (0.3%) |
| 19 to 25 Years | 1,194 (97.5%) | 31 (2.5%) |
| 26 to 34 Years | 1,482 (95.3%) | 73 (4.7%) |
| 35 to 44 Years | 1,464 (89.4%) | 174 (10.6%) |
| 45 to 54 Years | 1,280 (94.1%) | 80 (5.9%) |
| 55 to 64 Years | 1,643 (98.9%) | 19 (1.1%) |
| 65 to 74 Years | 897 (100.0%) | 0 (0.0%) |
| 75 Years and older | 585 (100.0%) | 0 (0.0%) |
| Total | 11,516 (96.8%) | 384 (3.2%) |
Health Insurance Coverage by Citizenship Status in Webster
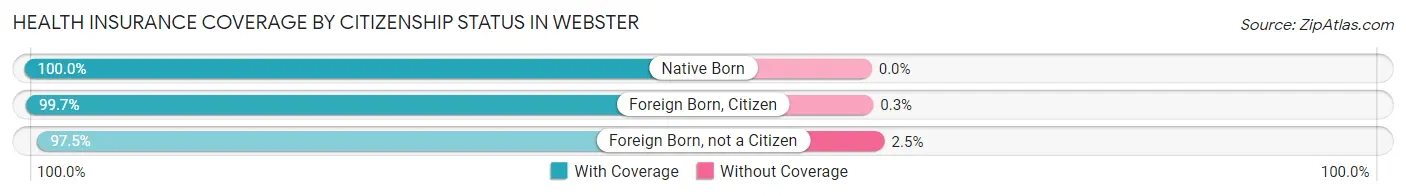
| Citizenship Status | With Coverage | Without Coverage |
| Native Born | 671 (100.0%) | 0 (0.0%) |
| Foreign Born, Citizen | 2,300 (99.7%) | 7 (0.3%) |
| Foreign Born, not a Citizen | 1,194 (97.5%) | 31 (2.5%) |
Health Insurance Coverage by Household Income in Webster
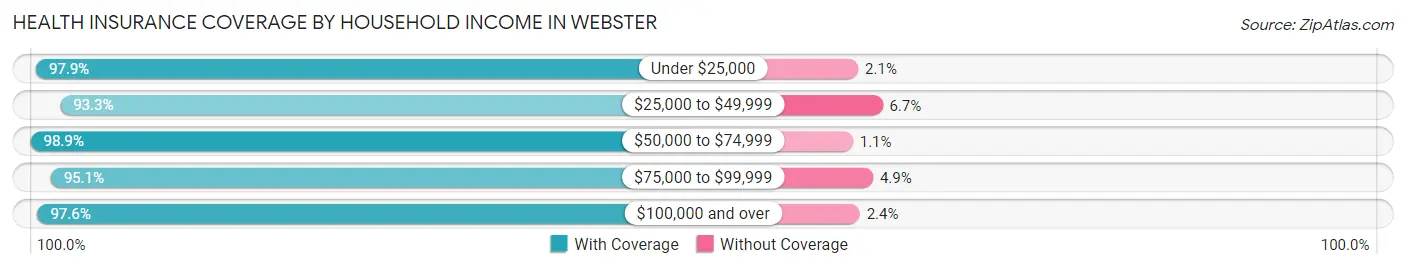
| Household Income | With Coverage | Without Coverage |
| Under $25,000 | 1,699 (97.9%) | 37 (2.1%) |
| $25,000 to $49,999 | 1,857 (93.3%) | 133 (6.7%) |
| $50,000 to $74,999 | 2,376 (98.9%) | 27 (1.1%) |
| $75,000 to $99,999 | 1,843 (95.1%) | 95 (4.9%) |
| $100,000 and over | 3,713 (97.6%) | 92 (2.4%) |
Public vs Private Health Insurance Coverage by Age in Webster
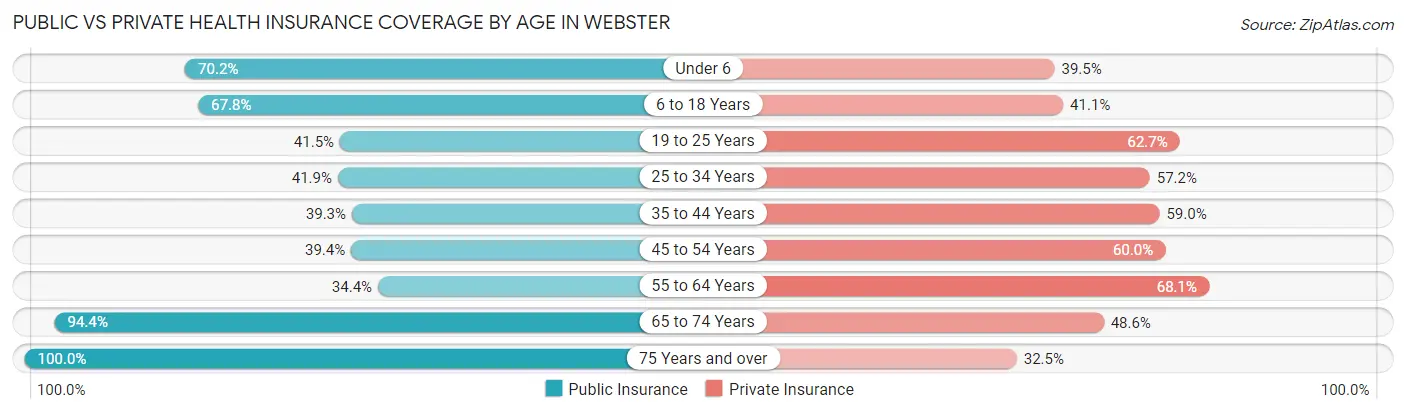
| Age Bracket | Public Insurance | Private Insurance |
| Under 6 | 471 (70.2%) | 265 (39.5%) |
| 6 to 18 Years | 1,564 (67.8%) | 948 (41.1%) |
| 19 to 25 Years | 508 (41.5%) | 768 (62.7%) |
| 25 to 34 Years | 651 (41.9%) | 889 (57.2%) |
| 35 to 44 Years | 643 (39.3%) | 966 (59.0%) |
| 45 to 54 Years | 536 (39.4%) | 816 (60.0%) |
| 55 to 64 Years | 572 (34.4%) | 1,132 (68.1%) |
| 65 to 74 Years | 847 (94.4%) | 436 (48.6%) |
| 75 Years and over | 585 (100.0%) | 190 (32.5%) |
| Total | 6,377 (53.6%) | 6,410 (53.9%) |
Disability Status by Sex by Age in Webster
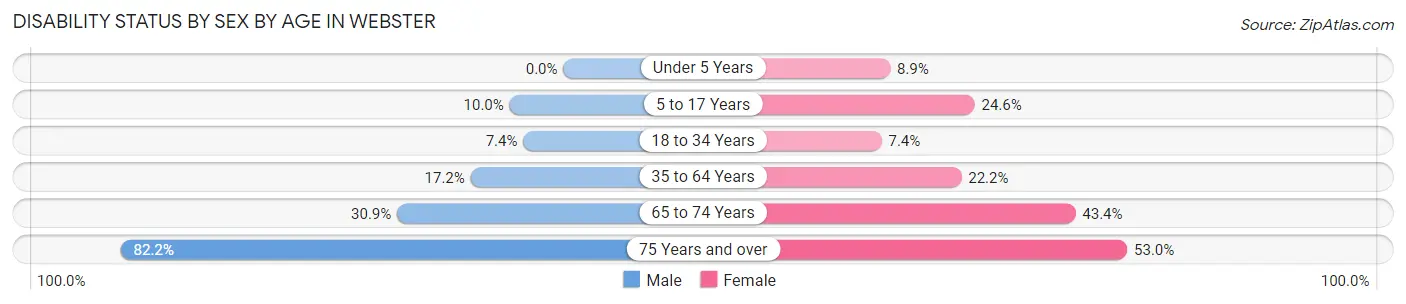
| Age Bracket | Male | Female |
| Under 5 Years | 0 (0.0%) | 27 (8.9%) |
| 5 to 17 Years | 117 (10.0%) | 257 (24.6%) |
| 18 to 34 Years | 102 (7.4%) | 114 (7.4%) |
| 35 to 64 Years | 411 (17.2%) | 504 (22.2%) |
| 65 to 74 Years | 133 (30.9%) | 202 (43.3%) |
| 75 Years and over | 189 (82.2%) | 188 (53.0%) |
Disability Class by Sex by Age in Webster
Disability Class: Hearing Difficulty
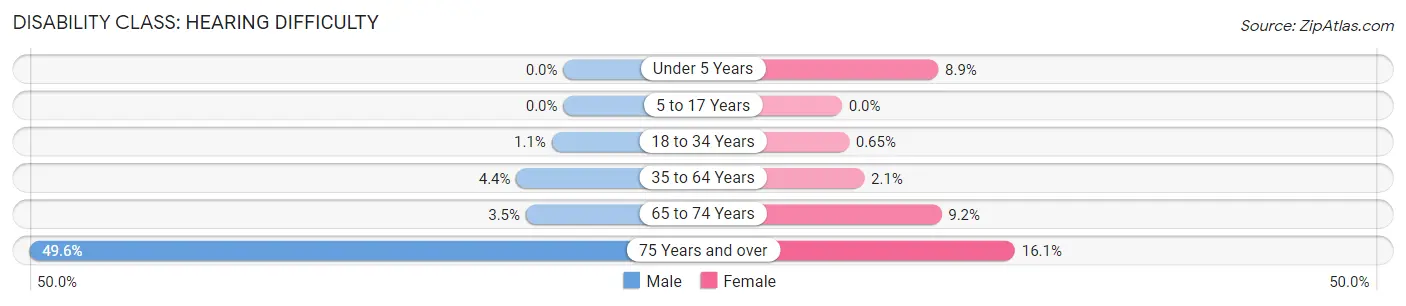
| Age Bracket | Male | Female |
| Under 5 Years | 0 (0.0%) | 27 (8.9%) |
| 5 to 17 Years | 0 (0.0%) | 0 (0.0%) |
| 18 to 34 Years | 15 (1.1%) | 10 (0.6%) |
| 35 to 64 Years | 104 (4.4%) | 47 (2.1%) |
| 65 to 74 Years | 15 (3.5%) | 43 (9.2%) |
| 75 Years and over | 114 (49.6%) | 57 (16.1%) |
Disability Class: Vision Difficulty
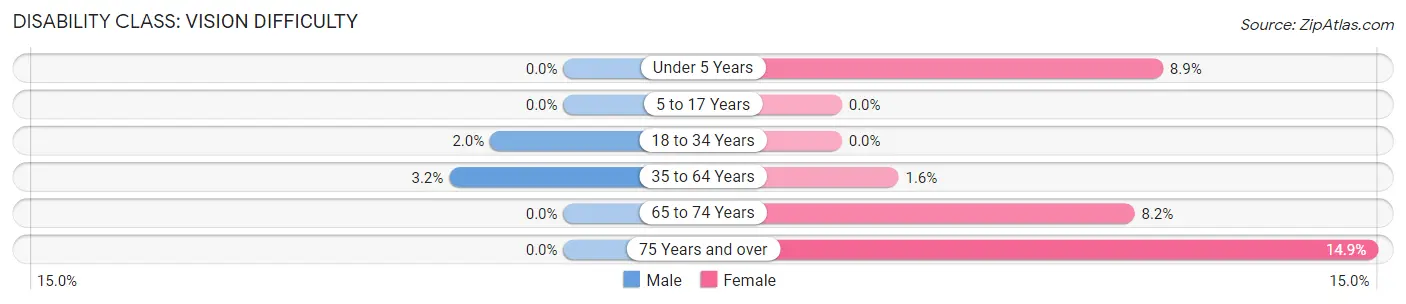
| Age Bracket | Male | Female |
| Under 5 Years | 0 (0.0%) | 27 (8.9%) |
| 5 to 17 Years | 0 (0.0%) | 0 (0.0%) |
| 18 to 34 Years | 28 (2.0%) | 0 (0.0%) |
| 35 to 64 Years | 76 (3.2%) | 36 (1.6%) |
| 65 to 74 Years | 0 (0.0%) | 38 (8.2%) |
| 75 Years and over | 0 (0.0%) | 53 (14.9%) |
Disability Class: Cognitive Difficulty
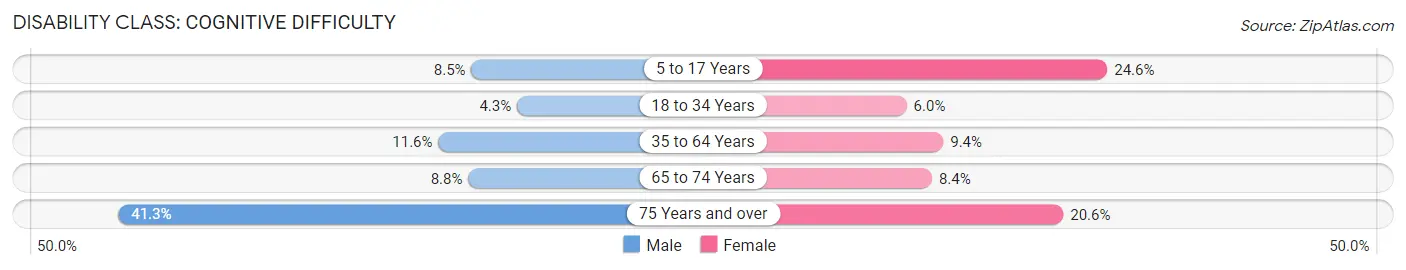
| Age Bracket | Male | Female |
| 5 to 17 Years | 100 (8.5%) | 257 (24.6%) |
| 18 to 34 Years | 59 (4.3%) | 93 (6.0%) |
| 35 to 64 Years | 277 (11.6%) | 214 (9.4%) |
| 65 to 74 Years | 38 (8.8%) | 39 (8.4%) |
| 75 Years and over | 95 (41.3%) | 73 (20.6%) |
Disability Class: Ambulatory Difficulty
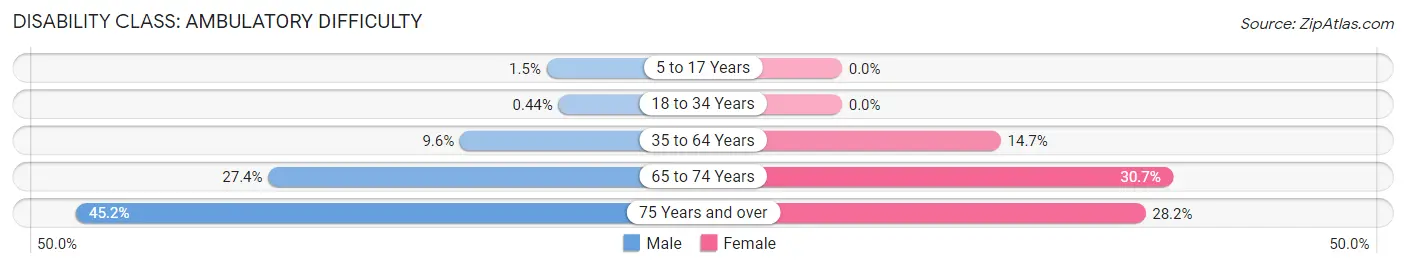
| Age Bracket | Male | Female |
| 5 to 17 Years | 18 (1.5%) | 0 (0.0%) |
| 18 to 34 Years | 6 (0.4%) | 0 (0.0%) |
| 35 to 64 Years | 229 (9.6%) | 335 (14.7%) |
| 65 to 74 Years | 118 (27.4%) | 143 (30.7%) |
| 75 Years and over | 104 (45.2%) | 100 (28.2%) |
Disability Class: Self-Care Difficulty
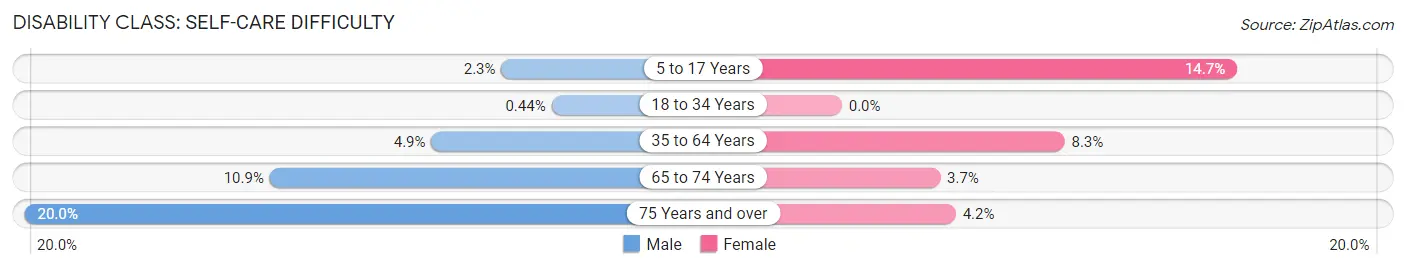
| Age Bracket | Male | Female |
| 5 to 17 Years | 27 (2.3%) | 153 (14.7%) |
| 18 to 34 Years | 6 (0.4%) | 0 (0.0%) |
| 35 to 64 Years | 117 (4.9%) | 188 (8.3%) |
| 65 to 74 Years | 47 (10.9%) | 17 (3.6%) |
| 75 Years and over | 46 (20.0%) | 15 (4.2%) |
Technology Access in Webster
Computing Device Access in Webster
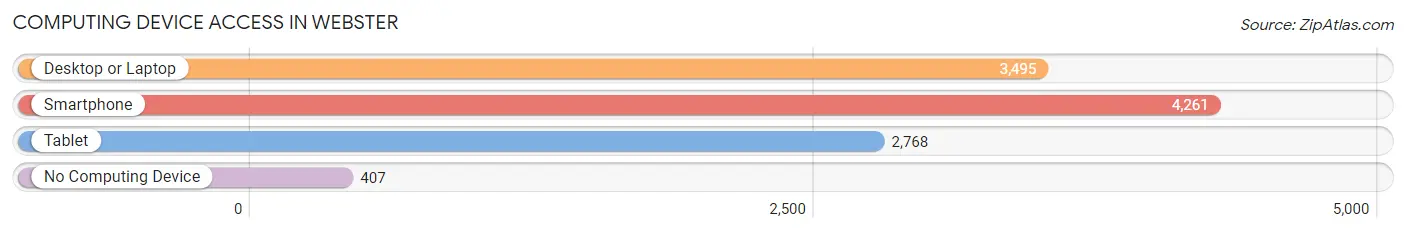
| Device Type | # Households | % Households |
| Desktop or Laptop | 3,495 | 69.4% |
| Smartphone | 4,261 | 84.7% |
| Tablet | 2,768 | 55.0% |
| No Computing Device | 407 | 8.1% |
| Total | 5,033 | 100.0% |
Internet Access in Webster
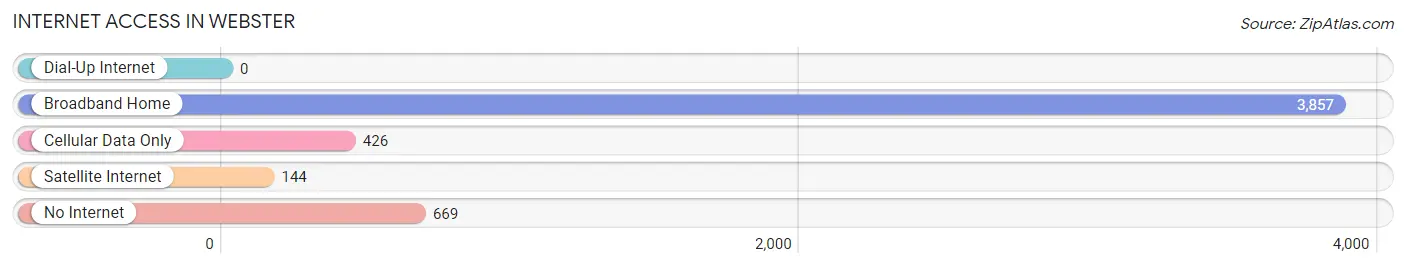
| Internet Type | # Households | % Households |
| Dial-Up Internet | 0 | 0.0% |
| Broadband Home | 3,857 | 76.6% |
| Cellular Data Only | 426 | 8.5% |
| Satellite Internet | 144 | 2.9% |
| No Internet | 669 | 13.3% |
| Total | 5,033 | 100.0% |
Webster Summary
Webster, Massachusetts is a small town located in Worcester County, in the central part of the state. It is bordered by the towns of Dudley, Oxford, Thompson, and Douglas. The town has a population of 16,919, according to the 2010 census.
History
Webster was first settled in 1713 and was officially incorporated in 1832. The town was named after Daniel Webster, a prominent statesman and orator from Massachusetts. The town was originally part of the town of Dudley, but was separated in 1832 due to the growing population.
The town was primarily an agricultural community until the mid-19th century, when the Blackstone Canal was built. The canal connected Worcester to Providence, Rhode Island, and allowed for the transportation of goods and people. This led to the development of the town’s industrial sector, which included the manufacture of textiles, paper, and other goods.
The town was also home to a number of mills, including the Webster Manufacturing Company, which was founded in 1845. The company was one of the first to produce cotton cloth in the United States. The company was eventually sold to the American Woolen Company in the early 20th century.
Geography
Webster is located in central Massachusetts, in Worcester County. It is bordered by the towns of Dudley, Oxford, Thompson, and Douglas. The town is located on the Blackstone River, which flows through the town and is a major source of water for the area.
The town is mostly flat, with some hills in the northern part of town. The highest point in the town is the summit of Webster Hill, which is located in the northern part of town and has an elevation of 590 feet.
The town has a total area of 16.7 square miles, of which 16.3 square miles is land and 0.4 square miles is water.
Economy
The economy of Webster is largely based on manufacturing and retail. The town is home to a number of manufacturing companies, including the American Woolen Company, which produces woolen fabrics. The town is also home to a number of retail stores, including a Walmart Supercenter and a Target.
The town is also home to a number of small businesses, including restaurants, cafes, and other retail stores.
Demographics
According to the 2010 census, the population of Webster was 16,919. The racial makeup of the town was 94.3% White, 1.7% African American, 0.3% Native American, 1.2% Asian, 0.1% Pacific Islander, 1.2% from other races, and 1.4% from two or more races. Hispanic or Latino of any race were 3.2% of the population.
The median income for a household in the town was $50,945, and the median income for a family was $60,945. The per capita income for the town was $24,945. About 5.3% of families and 7.2% of the population were below the poverty line, including 8.3% of those under age 18 and 6.2% of those age 65 or over.
Common Questions
What is Per Capita Income in Webster?
Per Capita income in Webster is $32,231.
What is the Median Family Income in Webster?
Median Family Income in Webster is $70,850.
What is the Median Household income in Webster?
Median Household Income in Webster is $59,375.
What is Income or Wage Gap in Webster?
Income or Wage Gap in Webster is 33.0%.
Women in Webster earn 67.0 cents for every dollar earned by a man.
What is Inequality or Gini Index in Webster?
Inequality or Gini Index in Webster is 0.46.
What is the Total Population of Webster?
Total Population of Webster is 12,264.
What is the Total Male Population of Webster?
Total Male Population of Webster is 6,016.
What is the Total Female Population of Webster?
Total Female Population of Webster is 6,248.
What is the Ratio of Males per 100 Females in Webster?
There are 96.29 Males per 100 Females in Webster.
What is the Ratio of Females per 100 Males in Webster?
There are 103.86 Females per 100 Males in Webster.
What is the Median Population Age in Webster?
Median Population Age in Webster is 37.1 Years.
What is the Average Family Size in Webster
Average Family Size in Webster is 2.9 People.
What is the Average Household Size in Webster
Average Household Size in Webster is 2.4 People.
How Large is the Labor Force in Webster?
There are 6,666 People in the Labor Forcein in Webster.
What is the Percentage of People in the Labor Force in Webster?
68.2% of People are in the Labor Force in Webster.
What is the Unemployment Rate in Webster?
Unemployment Rate in Webster is 9.8%.