Wilmington, MA Map & Demographics
Wilmington Map
Wilmington Overview
$58,224
PER CAPITA INCOME
$175,094
AVG FAMILY INCOME
$151,034
AVG HOUSEHOLD INCOME
25.7%
WAGE / INCOME GAP [ % ]
74.3¢/ $1
WAGE / INCOME GAP [ $ ]
0.37
INEQUALITY / GINI INDEX
23,191
TOTAL POPULATION
12,154
MALE POPULATION
11,037
FEMALE POPULATION
110.12
MALES / 100 FEMALES
90.81
FEMALES / 100 MALES
42.1
MEDIAN AGE
3.3
AVG FAMILY SIZE
2.9
AVG HOUSEHOLD SIZE
13,474
LABOR FORCE [ PEOPLE ]
71.9%
PERCENT IN LABOR FORCE
4.4%
UNEMPLOYMENT RATE
Wilmington Zip Codes
Wilmington Area Codes
Income in Wilmington
Income Overview in Wilmington
Per Capita Income in Wilmington is $58,224, while median incomes of families and households are $175,094 and $151,034 respectively.
| Characteristic | Number | Measure |
| Per Capita Income | 23,191 | $58,224 |
| Median Family Income | 6,140 | $175,094 |
| Mean Family Income | 6,140 | $189,116 |
| Median Household Income | 7,925 | $151,034 |
| Mean Household Income | 7,925 | $169,417 |
| Income Deficit | 6,140 | $0 |
| Wage / Income Gap (%) | 23,191 | 25.71% |
| Wage / Income Gap ($) | 23,191 | 74.29¢ per $1 |
| Gini / Inequality Index | 23,191 | 0.37 |
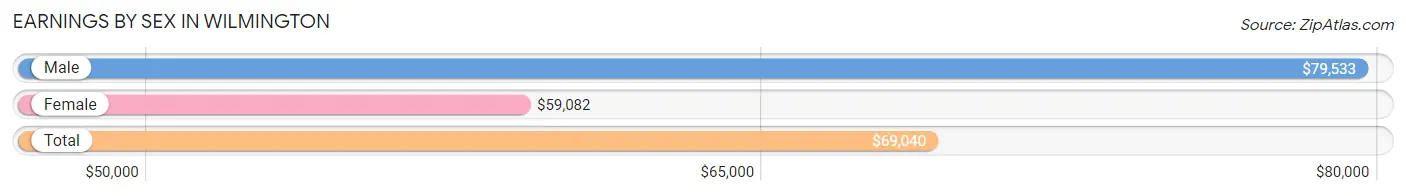
Earnings by Sex in Wilmington
Average Earnings in Wilmington are $69,040, $79,533 for men and $59,082 for women, a difference of 25.7%.
| Sex | Number | Average Earnings |
| Male | 7,400 (53.8%) | $79,533 |
| Female | 6,361 (46.2%) | $59,082 |
| Total | 13,761 (100.0%) | $69,040 |
Earnings by Sex by Income Bracket in Wilmington
The most common earnings brackets in Wilmington are $100,000+ for men (2,815 | 38.0%) and $100,000+ for women (1,444 | 22.7%).

| Income | Male | Female |
| $2,499 or less | 453 (6.1%) | 198 (3.1%) |
| $2,500 to $4,999 | 120 (1.6%) | 192 (3.0%) |
| $5,000 to $7,499 | 183 (2.5%) | 133 (2.1%) |
| $7,500 to $9,999 | 96 (1.3%) | 184 (2.9%) |
| $10,000 to $12,499 | 216 (2.9%) | 104 (1.6%) |
| $12,500 to $14,999 | 28 (0.4%) | 59 (0.9%) |
| $15,000 to $17,499 | 69 (0.9%) | 70 (1.1%) |
| $17,500 to $19,999 | 55 (0.7%) | 54 (0.9%) |
| $20,000 to $22,499 | 53 (0.7%) | 223 (3.5%) |
| $22,500 to $24,999 | 117 (1.6%) | 118 (1.9%) |
| $25,000 to $29,999 | 179 (2.4%) | 306 (4.8%) |
| $30,000 to $34,999 | 326 (4.4%) | 215 (3.4%) |
| $35,000 to $39,999 | 106 (1.4%) | 180 (2.8%) |
| $40,000 to $44,999 | 303 (4.1%) | 338 (5.3%) |
| $45,000 to $49,999 | 101 (1.4%) | 303 (4.8%) |
| $50,000 to $54,999 | 332 (4.5%) | 203 (3.2%) |
| $55,000 to $64,999 | 362 (4.9%) | 606 (9.5%) |
| $65,000 to $74,999 | 425 (5.7%) | 314 (4.9%) |
| $75,000 to $99,999 | 1,061 (14.3%) | 1,117 (17.6%) |
| $100,000+ | 2,815 (38.0%) | 1,444 (22.7%) |
| Total | 7,400 (100.0%) | 6,361 (100.0%) |
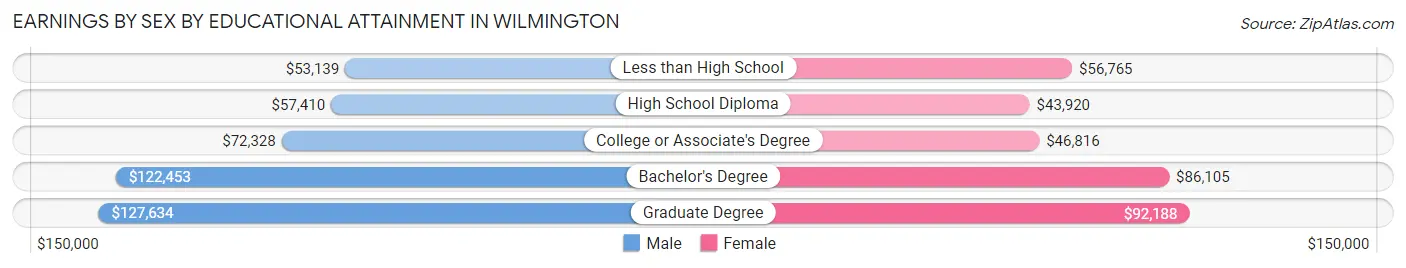
Earnings by Sex by Educational Attainment in Wilmington
Average earnings in Wilmington are $91,345 for men and $68,938 for women, a difference of 24.5%. Men with an educational attainment of graduate degree enjoy the highest average annual earnings of $127,634, while those with less than high school education earn the least with $53,139. Women with an educational attainment of graduate degree earn the most with the average annual earnings of $92,188, while those with high school diploma education have the smallest earnings of $43,920.
| Educational Attainment | Male Income | Female Income |
| Less than High School | $53,139 | $56,765 |
| High School Diploma | $57,410 | $43,920 |
| College or Associate's Degree | $72,328 | $46,816 |
| Bachelor's Degree | $122,453 | $86,105 |
| Graduate Degree | $127,634 | $92,188 |
| Total | $91,345 | $68,938 |
Family Income in Wilmington
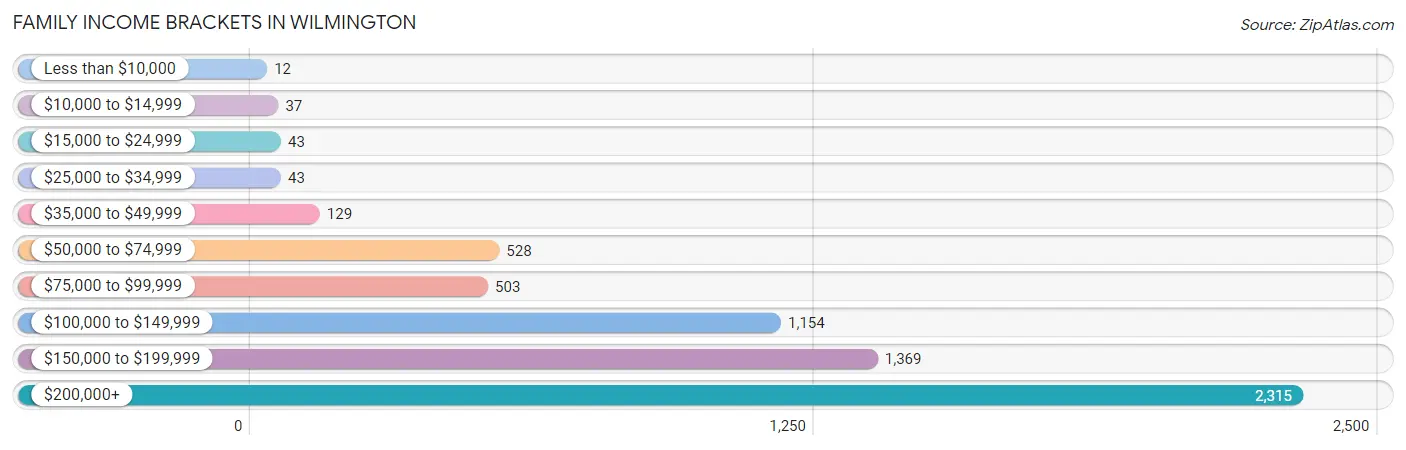
Family Income Brackets in Wilmington
According to the Wilmington family income data, there are 2,315 families falling into the $200,000+ income range, which is the most common income bracket and makes up 37.7% of all families. Conversely, the less than $10,000 income bracket is the least frequent group with only 12 families (0.2%) belonging to this category.
| Income Bracket | # Families | % Families |
| Less than $10,000 | 12 | 0.2% |
| $10,000 to $14,999 | 37 | 0.6% |
| $15,000 to $24,999 | 43 | 0.7% |
| $25,000 to $34,999 | 43 | 0.7% |
| $35,000 to $49,999 | 129 | 2.1% |
| $50,000 to $74,999 | 528 | 8.6% |
| $75,000 to $99,999 | 503 | 8.2% |
| $100,000 to $149,999 | 1,154 | 18.8% |
| $150,000 to $199,999 | 1,369 | 22.3% |
| $200,000+ | 2,315 | 37.7% |
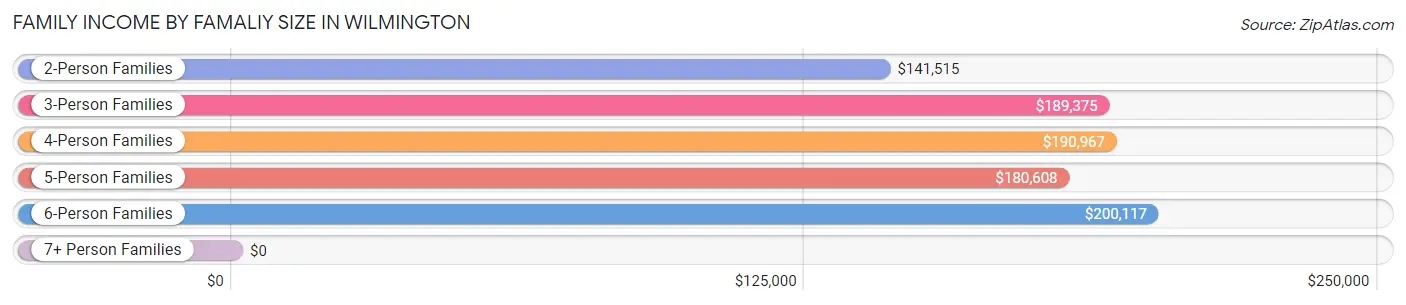
Family Income by Famaliy Size in Wilmington
6-person families (205 | 3.3%) account for the highest median family income in Wilmington with $200,117 per family, while 2-person families (2,150 | 35.0%) have the highest median income of $70,758 per family member.
| Income Bracket | # Families | Median Income |
| 2-Person Families | 2,150 (35.0%) | $141,515 |
| 3-Person Families | 1,625 (26.5%) | $189,375 |
| 4-Person Families | 1,631 (26.6%) | $190,967 |
| 5-Person Families | 426 (6.9%) | $180,608 |
| 6-Person Families | 205 (3.3%) | $200,117 |
| 7+ Person Families | 103 (1.7%) | $0 |
| Total | 6,140 (100.0%) | $175,094 |
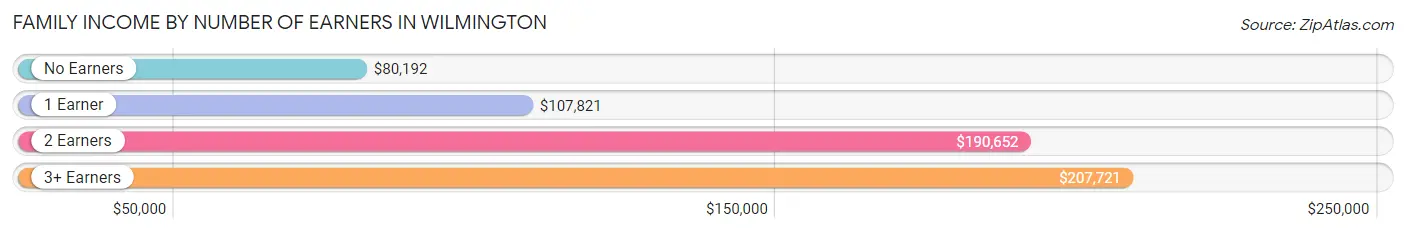
Family Income by Number of Earners in Wilmington
The median family income in Wilmington is $175,094, with families comprising 3+ earners (1,201) having the highest median family income of $207,721, while families with no earners (512) have the lowest median family income of $80,192, accounting for 19.6% and 8.3% of families, respectively.
| Number of Earners | # Families | Median Income |
| No Earners | 512 (8.3%) | $80,192 |
| 1 Earner | 1,156 (18.8%) | $107,821 |
| 2 Earners | 3,271 (53.3%) | $190,652 |
| 3+ Earners | 1,201 (19.6%) | $207,721 |
| Total | 6,140 (100.0%) | $175,094 |
Household Income in Wilmington
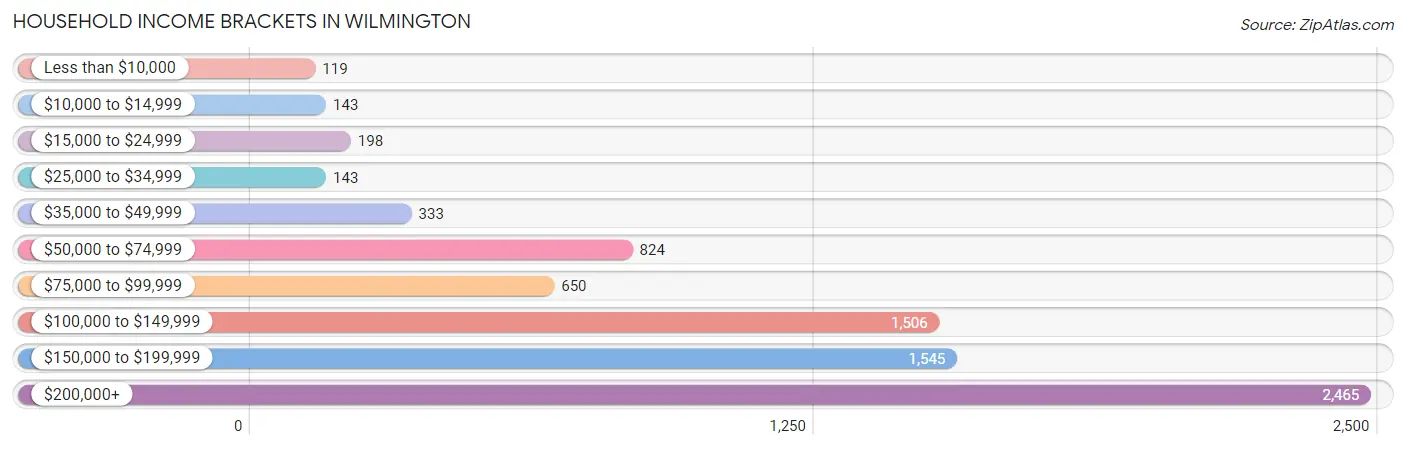
Household Income Brackets in Wilmington
With 2,465 households falling in the category, the $200,000+ income range is the most frequent in Wilmington, accounting for 31.1% of all households. In contrast, only 119 households (1.5%) fall into the less than $10,000 income bracket, making it the least populous group.
| Income Bracket | # Households | % Households |
| Less than $10,000 | 119 | 1.5% |
| $10,000 to $14,999 | 143 | 1.8% |
| $15,000 to $24,999 | 198 | 2.5% |
| $25,000 to $34,999 | 143 | 1.8% |
| $35,000 to $49,999 | 333 | 4.2% |
| $50,000 to $74,999 | 824 | 10.4% |
| $75,000 to $99,999 | 650 | 8.2% |
| $100,000 to $149,999 | 1,506 | 19.0% |
| $150,000 to $199,999 | 1,545 | 19.5% |
| $200,000+ | 2,465 | 31.1% |
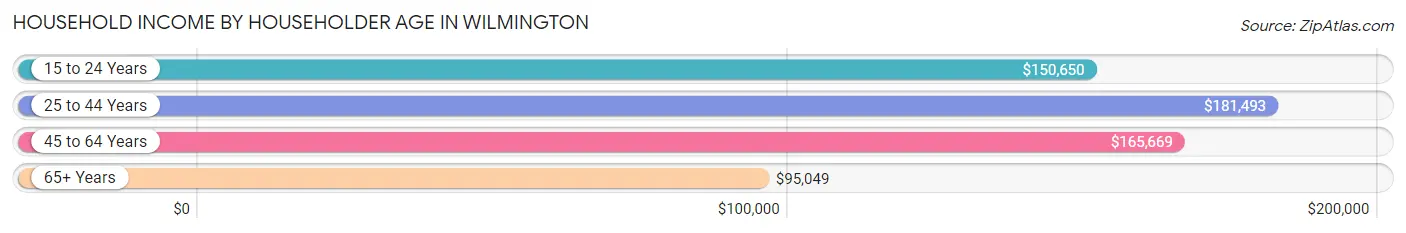
Household Income by Householder Age in Wilmington
The median household income in Wilmington is $151,034, with the highest median household income of $181,493 found in the 25 to 44 years age bracket for the primary householder. A total of 2,170 households (27.4%) fall into this category. Meanwhile, the 65+ years age bracket for the primary householder has the lowest median household income of $95,049, with 1,966 households (24.8%) in this group.
| Income Bracket | # Households | Median Income |
| 15 to 24 Years | 73 (0.9%) | $150,650 |
| 25 to 44 Years | 2,170 (27.4%) | $181,493 |
| 45 to 64 Years | 3,716 (46.9%) | $165,669 |
| 65+ Years | 1,966 (24.8%) | $95,049 |
| Total | 7,925 (100.0%) | $151,034 |
Poverty in Wilmington
Income Below Poverty by Sex and Age in Wilmington
With 2.3% poverty level for males and 2.7% for females among the residents of Wilmington, 15 year old males and 15 year old females are the most vulnerable to poverty, with 28 males (16.0%) and 13 females (7.3%) in their respective age groups living below the poverty level.
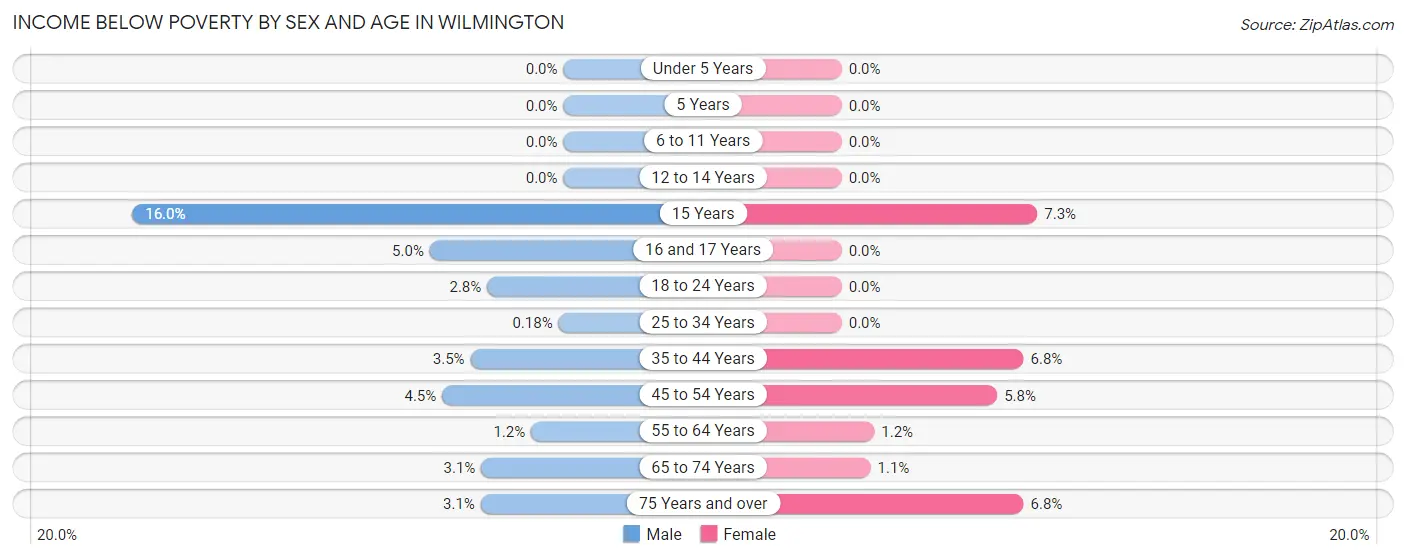
| Age Bracket | Male | Female |
| Under 5 Years | 0 (0.0%) | 0 (0.0%) |
| 5 Years | 0 (0.0%) | 0 (0.0%) |
| 6 to 11 Years | 0 (0.0%) | 0 (0.0%) |
| 12 to 14 Years | 0 (0.0%) | 0 (0.0%) |
| 15 Years | 28 (16.0%) | 13 (7.3%) |
| 16 and 17 Years | 14 (5.0%) | 0 (0.0%) |
| 18 to 24 Years | 38 (2.8%) | 0 (0.0%) |
| 25 to 34 Years | 2 (0.2%) | 0 (0.0%) |
| 35 to 44 Years | 50 (3.5%) | 101 (6.8%) |
| 45 to 54 Years | 69 (4.5%) | 109 (5.8%) |
| 55 to 64 Years | 25 (1.2%) | 22 (1.2%) |
| 65 to 74 Years | 27 (3.0%) | 12 (1.1%) |
| 75 Years and over | 23 (3.1%) | 39 (6.8%) |
| Total | 276 (2.3%) | 296 (2.7%) |
Income Above Poverty by Sex and Age in Wilmington
According to the poverty statistics in Wilmington, males aged under 5 years and females aged under 5 years are the age groups that are most secure financially, with 100.0% of males and 100.0% of females in these age groups living above the poverty line.
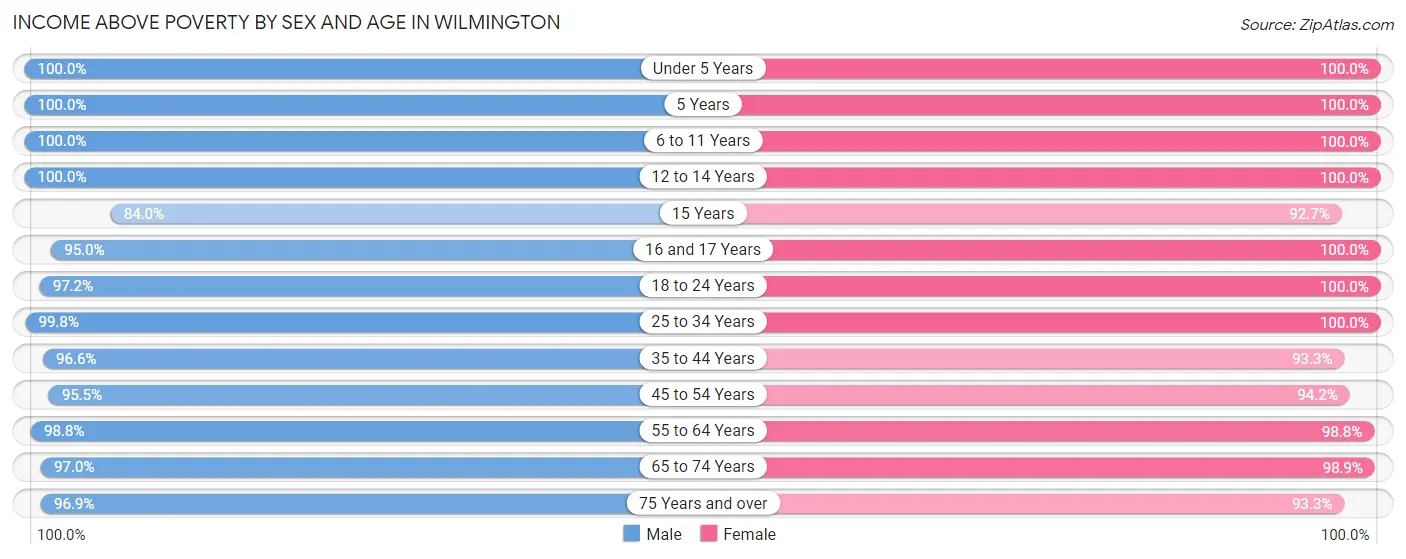
| Age Bracket | Male | Female |
| Under 5 Years | 777 (100.0%) | 532 (100.0%) |
| 5 Years | 66 (100.0%) | 55 (100.0%) |
| 6 to 11 Years | 956 (100.0%) | 729 (100.0%) |
| 12 to 14 Years | 598 (100.0%) | 209 (100.0%) |
| 15 Years | 147 (84.0%) | 166 (92.7%) |
| 16 and 17 Years | 268 (95.0%) | 379 (100.0%) |
| 18 to 24 Years | 1,303 (97.2%) | 770 (100.0%) |
| 25 to 34 Years | 1,099 (99.8%) | 1,033 (100.0%) |
| 35 to 44 Years | 1,401 (96.6%) | 1,396 (93.2%) |
| 45 to 54 Years | 1,463 (95.5%) | 1,780 (94.2%) |
| 55 to 64 Years | 2,067 (98.8%) | 1,796 (98.8%) |
| 65 to 74 Years | 859 (97.0%) | 1,114 (98.9%) |
| 75 Years and over | 725 (96.9%) | 539 (93.2%) |
| Total | 11,729 (97.7%) | 10,498 (97.3%) |
Income Below Poverty Among Married-Couple Families in Wilmington
The poverty statistics for married-couple families in Wilmington show that 0.5% or 25 of the total 5,214 families live below the poverty line. Families with no children have the highest poverty rate of 0.8%, comprising of 25 families. On the other hand, families with 1 or 2 children have the lowest poverty rate of 0.0%, which includes 0 families.
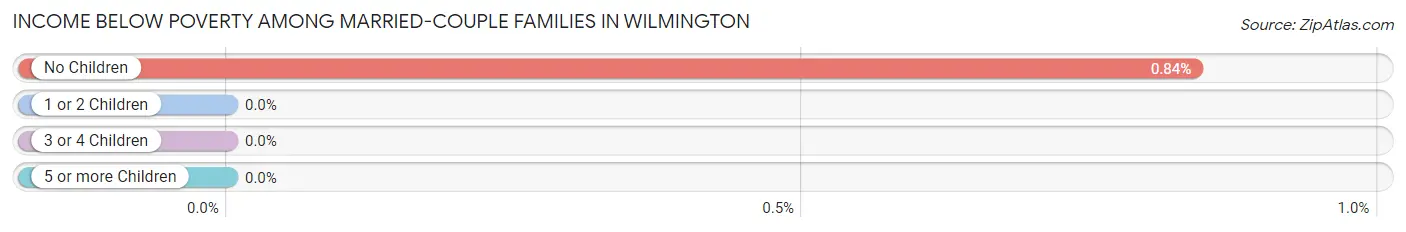
| Children | Above Poverty | Below Poverty |
| No Children | 2,955 (99.2%) | 25 (0.8%) |
| 1 or 2 Children | 1,907 (100.0%) | 0 (0.0%) |
| 3 or 4 Children | 327 (100.0%) | 0 (0.0%) |
| 5 or more Children | 0 (0.0%) | 0 (0.0%) |
| Total | 5,189 (99.5%) | 25 (0.5%) |
Income Below Poverty Among Single-Parent Households in Wilmington
According to the poverty data in Wilmington, 11.7% or 29 single-father households and 3.8% or 26 single-mother households are living below the poverty line. Among single-father households, those with no children have the highest poverty rate, with 29 households (14.6%) experiencing poverty. Likewise, among single-mother households, those with 1 or 2 children have the highest poverty rate, with 26 households (7.9%) falling below the poverty line.
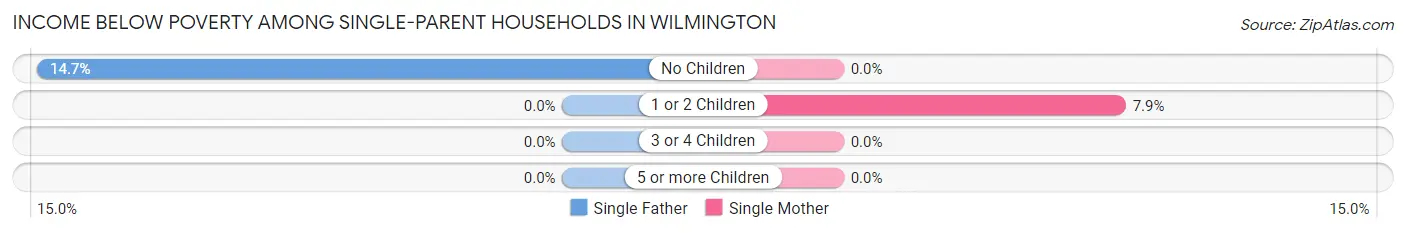
| Children | Single Father | Single Mother |
| No Children | 29 (14.6%) | 0 (0.0%) |
| 1 or 2 Children | 0 (0.0%) | 26 (7.9%) |
| 3 or 4 Children | 0 (0.0%) | 0 (0.0%) |
| 5 or more Children | 0 (0.0%) | 0 (0.0%) |
| Total | 29 (11.7%) | 26 (3.8%) |
Income Below Poverty Among Married-Couple vs Single-Parent Households in Wilmington
The poverty data for Wilmington shows that 25 of the married-couple family households (0.5%) and 55 of the single-parent households (5.9%) are living below the poverty level. Within the married-couple family households, those with no children have the highest poverty rate, with 25 households (0.8%) falling below the poverty line. Among the single-parent households, those with 1 or 2 children have the highest poverty rate, with 26 household (6.8%) living below poverty.
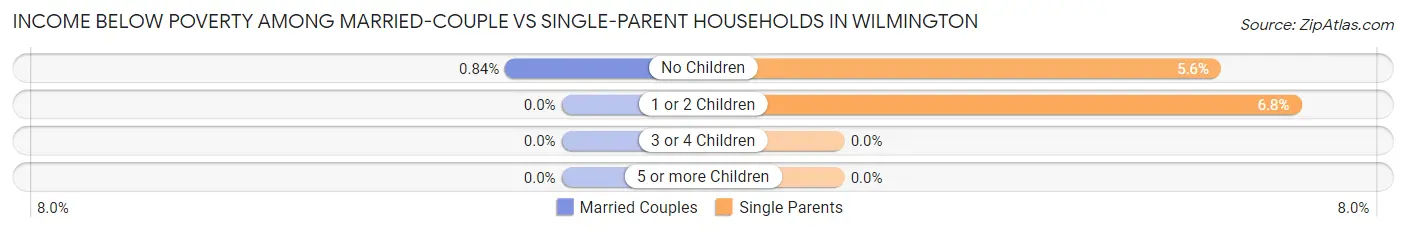
| Children | Married-Couple Families | Single-Parent Households |
| No Children | 25 (0.8%) | 29 (5.6%) |
| 1 or 2 Children | 0 (0.0%) | 26 (6.8%) |
| 3 or 4 Children | 0 (0.0%) | 0 (0.0%) |
| 5 or more Children | 0 (0.0%) | 0 (0.0%) |
| Total | 25 (0.5%) | 55 (5.9%) |
Race in Wilmington
The most populous races in Wilmington are White / Caucasian (20,256 | 87.3%), Two or more Races (1,295 | 5.6%), and Asian (1,197 | 5.2%).
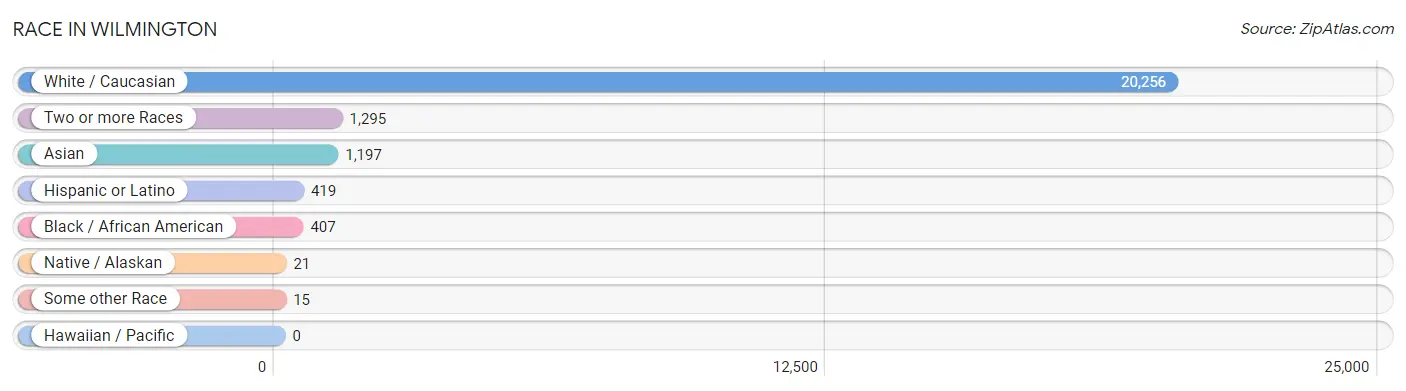
| Race | # Population | % Population |
| Asian | 1,197 | 5.2% |
| Black / African American | 407 | 1.8% |
| Hawaiian / Pacific | 0 | 0.0% |
| Hispanic or Latino | 419 | 1.8% |
| Native / Alaskan | 21 | 0.1% |
| White / Caucasian | 20,256 | 87.3% |
| Two or more Races | 1,295 | 5.6% |
| Some other Race | 15 | 0.1% |
| Total | 23,191 | 100.0% |
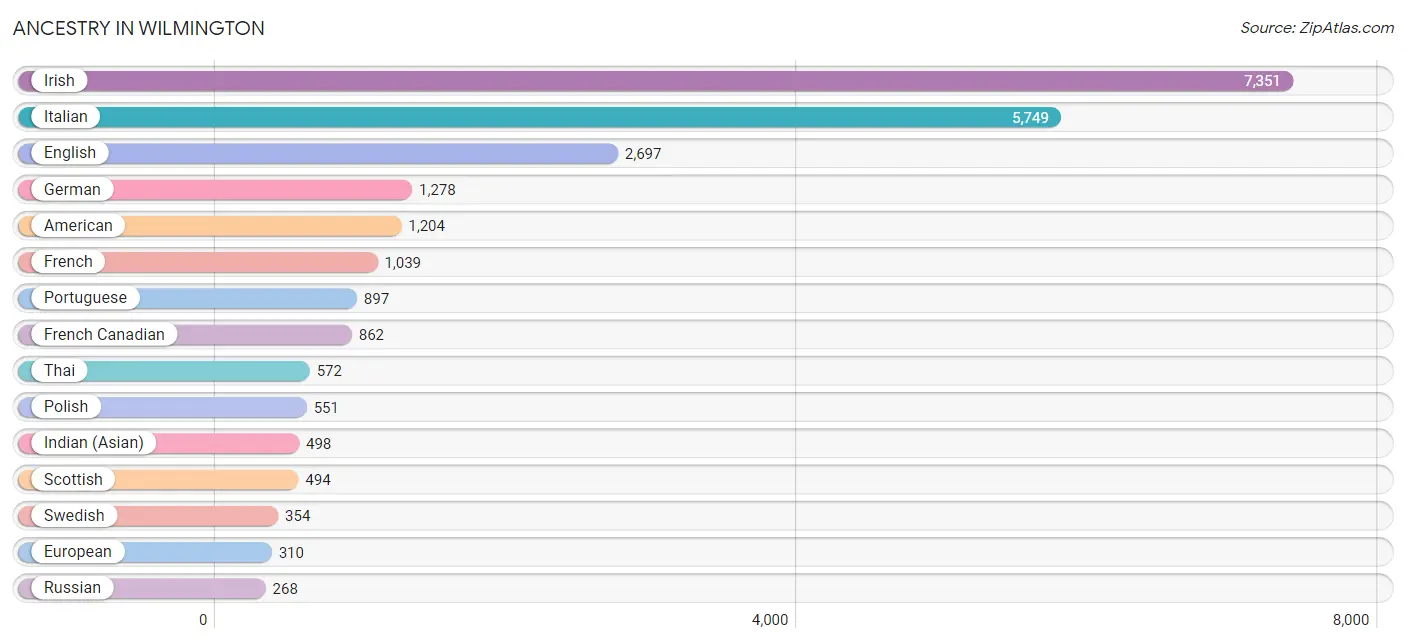
Ancestry in Wilmington
The most populous ancestries reported in Wilmington are Irish (7,351 | 31.7%), Italian (5,749 | 24.8%), English (2,697 | 11.6%), German (1,278 | 5.5%), and American (1,204 | 5.2%), together accounting for 78.8% of all Wilmington residents.
| Ancestry | # Population | % Population |
| American | 1,204 | 5.2% |
| Apache | 21 | 0.1% |
| Arab | 175 | 0.7% |
| Armenian | 57 | 0.3% |
| Austrian | 15 | 0.1% |
| Barbadian | 16 | 0.1% |
| Bhutanese | 49 | 0.2% |
| Brazilian | 37 | 0.2% |
| Burmese | 30 | 0.1% |
| Cajun | 19 | 0.1% |
| Canadian | 108 | 0.5% |
| Central American | 11 | 0.1% |
| Cherokee | 8 | 0.0% |
| Cuban | 22 | 0.1% |
| Czechoslovakian | 19 | 0.1% |
| Dominican | 1 | 0.0% |
| Dutch | 205 | 0.9% |
| Eastern European | 30 | 0.1% |
| Ecuadorian | 17 | 0.1% |
| Egyptian | 45 | 0.2% |
| English | 2,697 | 11.6% |
| European | 310 | 1.3% |
| Finnish | 5 | 0.0% |
| French | 1,039 | 4.5% |
| French Canadian | 862 | 3.7% |
| German | 1,278 | 5.5% |
| Greek | 131 | 0.6% |
| Guatemalan | 3 | 0.0% |
| Haitian | 234 | 1.0% |
| Hungarian | 91 | 0.4% |
| Indian (Asian) | 498 | 2.1% |
| Iranian | 22 | 0.1% |
| Irish | 7,351 | 31.7% |
| Israeli | 42 | 0.2% |
| Italian | 5,749 | 24.8% |
| Jamaican | 15 | 0.1% |
| Japanese | 16 | 0.1% |
| Korean | 35 | 0.2% |
| Lebanese | 29 | 0.1% |
| Lithuanian | 90 | 0.4% |
| Mexican | 96 | 0.4% |
| Nicaraguan | 8 | 0.0% |
| Northern European | 78 | 0.3% |
| Norwegian | 46 | 0.2% |
| Polish | 551 | 2.4% |
| Portuguese | 897 | 3.9% |
| Puerto Rican | 126 | 0.5% |
| Romanian | 9 | 0.0% |
| Russian | 268 | 1.2% |
| Samoan | 16 | 0.1% |
| Scandinavian | 13 | 0.1% |
| Scotch-Irish | 162 | 0.7% |
| Scottish | 494 | 2.1% |
| Slovak | 5 | 0.0% |
| South African | 23 | 0.1% |
| South American | 39 | 0.2% |
| South American Indian | 17 | 0.1% |
| Spaniard | 46 | 0.2% |
| Spanish | 26 | 0.1% |
| Sri Lankan | 72 | 0.3% |
| Subsaharan African | 23 | 0.1% |
| Swedish | 354 | 1.5% |
| Syrian | 12 | 0.1% |
| Thai | 572 | 2.5% |
| Trinidadian and Tobagonian | 21 | 0.1% |
| Ukrainian | 124 | 0.5% |
| Venezuelan | 22 | 0.1% |
| Welsh | 57 | 0.3% |
| West Indian | 14 | 0.1% | View All 69 Rows |
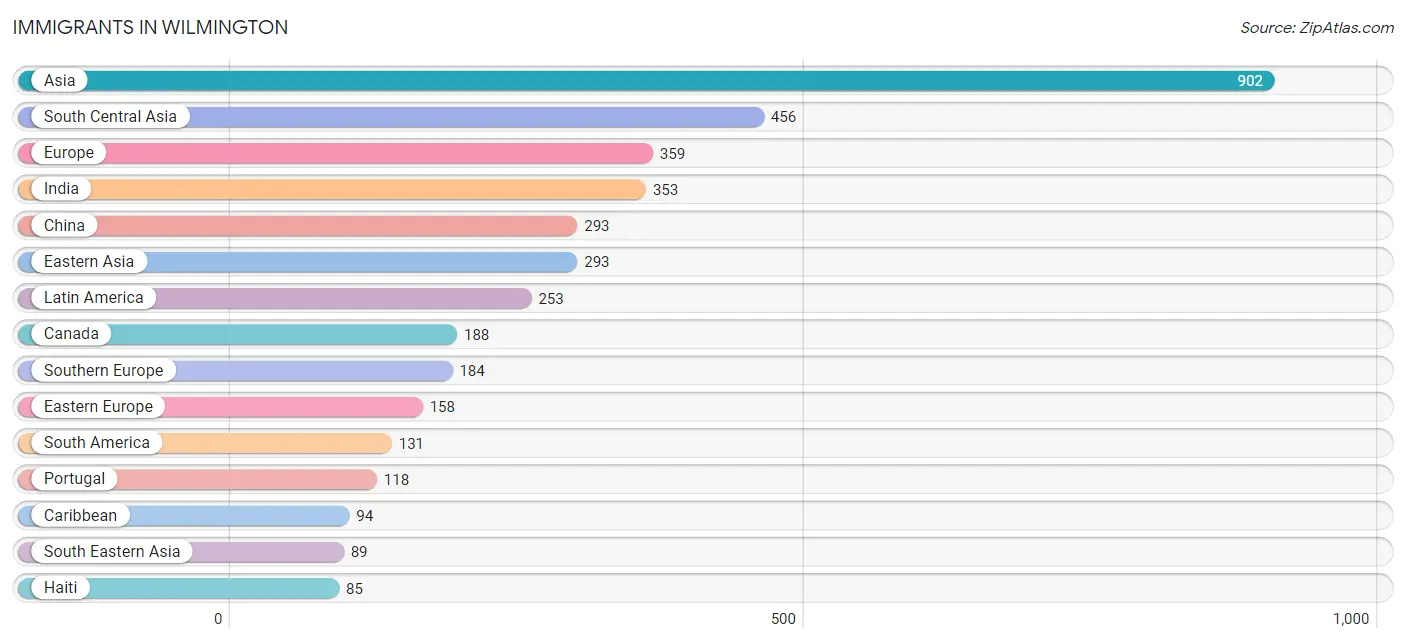
Immigrants in Wilmington
The most numerous immigrant groups reported in Wilmington came from Asia (902 | 3.9%), South Central Asia (456 | 2.0%), Europe (359 | 1.5%), India (353 | 1.5%), and China (293 | 1.3%), together accounting for 10.2% of all Wilmington residents.
| Immigration Origin | # Population | % Population |
| Africa | 72 | 0.3% |
| Asia | 902 | 3.9% |
| Azores | 7 | 0.0% |
| Belarus | 52 | 0.2% |
| Brazil | 69 | 0.3% |
| Canada | 188 | 0.8% |
| Caribbean | 94 | 0.4% |
| Central America | 28 | 0.1% |
| China | 293 | 1.3% |
| Dominican Republic | 1 | 0.0% |
| Eastern Asia | 293 | 1.3% |
| Eastern Europe | 158 | 0.7% |
| Ecuador | 17 | 0.1% |
| England | 10 | 0.0% |
| Europe | 359 | 1.5% |
| Guatemala | 3 | 0.0% |
| Haiti | 85 | 0.4% |
| India | 353 | 1.5% |
| Iran | 7 | 0.0% |
| Israel | 42 | 0.2% |
| Italy | 55 | 0.2% |
| Jamaica | 1 | 0.0% |
| Latin America | 253 | 1.1% |
| Lebanon | 10 | 0.0% |
| Liberia | 17 | 0.1% |
| Mexico | 25 | 0.1% |
| Nepal | 15 | 0.1% |
| Northern Africa | 32 | 0.1% |
| Northern Europe | 17 | 0.1% |
| Pakistan | 18 | 0.1% |
| Philippines | 17 | 0.1% |
| Poland | 26 | 0.1% |
| Portugal | 118 | 0.5% |
| Romania | 45 | 0.2% |
| Russia | 9 | 0.0% |
| South Africa | 23 | 0.1% |
| South America | 131 | 0.6% |
| South Central Asia | 456 | 2.0% |
| South Eastern Asia | 89 | 0.4% |
| Southern Europe | 184 | 0.8% |
| Spain | 11 | 0.1% |
| Sri Lanka | 63 | 0.3% |
| Ukraine | 26 | 0.1% |
| Venezuela | 45 | 0.2% |
| Vietnam | 72 | 0.3% |
| Western Africa | 17 | 0.1% |
| Western Asia | 64 | 0.3% | View All 47 Rows |
Sex and Age in Wilmington
Sex and Age in Wilmington
The most populous age groups in Wilmington are 55 to 59 Years (1,376 | 11.3%) for men and 50 to 54 Years (1,027 | 9.3%) for women.
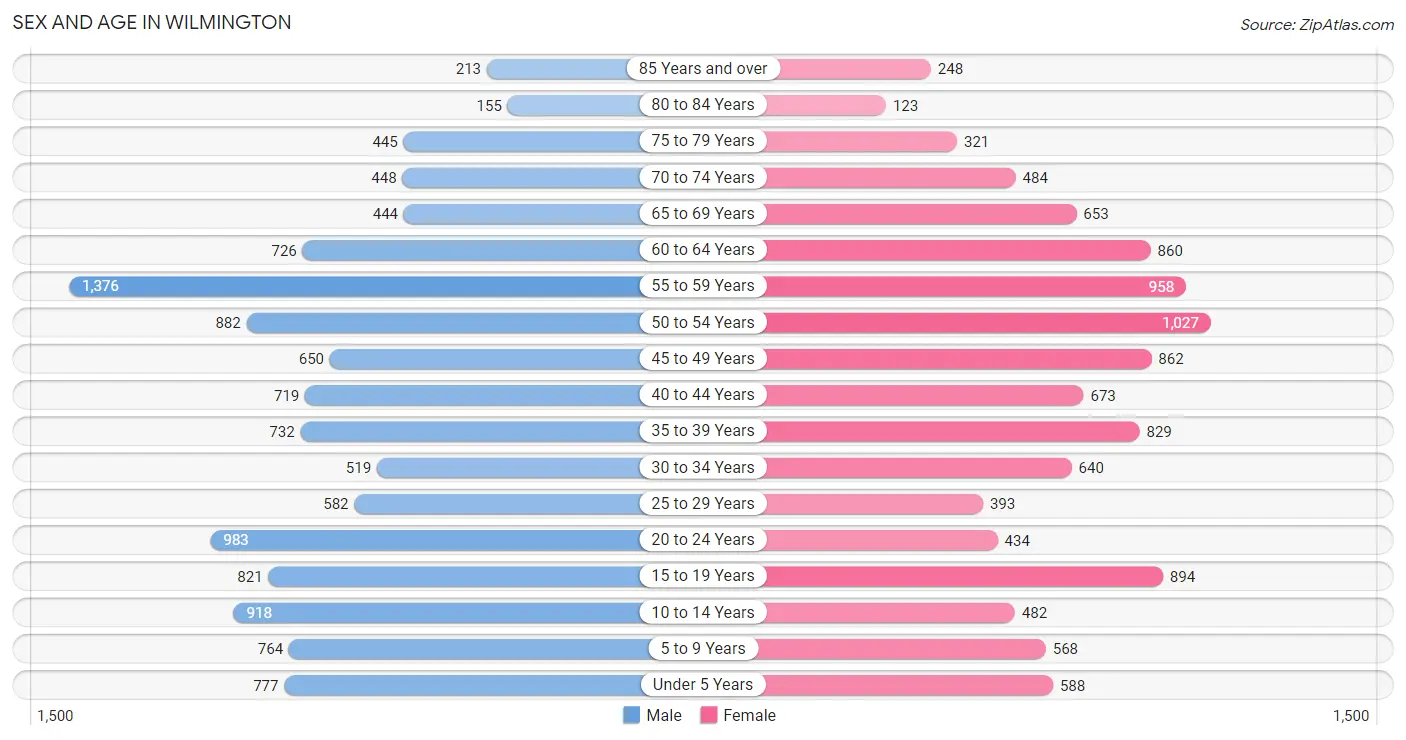
| Age Bracket | Male | Female |
| Under 5 Years | 777 (6.4%) | 588 (5.3%) |
| 5 to 9 Years | 764 (6.3%) | 568 (5.1%) |
| 10 to 14 Years | 918 (7.5%) | 482 (4.4%) |
| 15 to 19 Years | 821 (6.8%) | 894 (8.1%) |
| 20 to 24 Years | 983 (8.1%) | 434 (3.9%) |
| 25 to 29 Years | 582 (4.8%) | 393 (3.6%) |
| 30 to 34 Years | 519 (4.3%) | 640 (5.8%) |
| 35 to 39 Years | 732 (6.0%) | 829 (7.5%) |
| 40 to 44 Years | 719 (5.9%) | 673 (6.1%) |
| 45 to 49 Years | 650 (5.3%) | 862 (7.8%) |
| 50 to 54 Years | 882 (7.3%) | 1,027 (9.3%) |
| 55 to 59 Years | 1,376 (11.3%) | 958 (8.7%) |
| 60 to 64 Years | 726 (6.0%) | 860 (7.8%) |
| 65 to 69 Years | 444 (3.6%) | 653 (5.9%) |
| 70 to 74 Years | 448 (3.7%) | 484 (4.4%) |
| 75 to 79 Years | 445 (3.7%) | 321 (2.9%) |
| 80 to 84 Years | 155 (1.3%) | 123 (1.1%) |
| 85 Years and over | 213 (1.8%) | 248 (2.2%) |
| Total | 12,154 (100.0%) | 11,037 (100.0%) |
Families and Households in Wilmington
Median Family Size in Wilmington
The median family size in Wilmington is 3.29 persons per family, with married-couple families (5,214 | 84.9%) accounting for the largest median family size of 3.33 persons per family. On the other hand, single male/father families (249 | 4.1%) represent the smallest median family size with 2.98 persons per family.
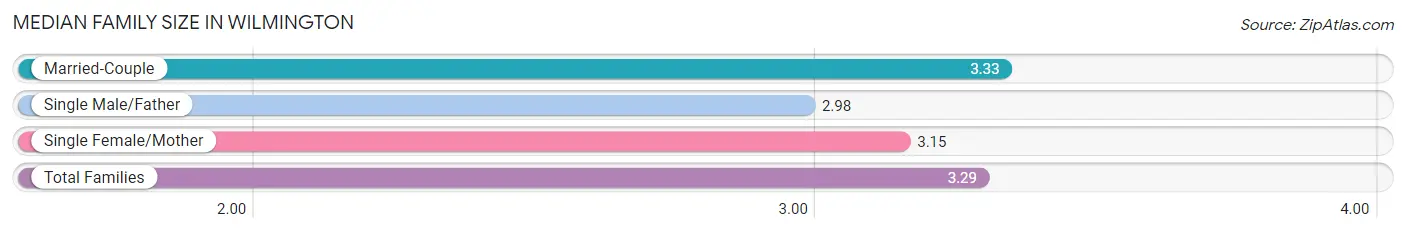
| Family Type | # Families | Family Size |
| Married-Couple | 5,214 (84.9%) | 3.33 |
| Single Male/Father | 249 (4.1%) | 2.98 |
| Single Female/Mother | 677 (11.0%) | 3.15 |
| Total Families | 6,140 (100.0%) | 3.29 |
Median Household Size in Wilmington
The median household size in Wilmington is 2.89 persons per household, with married-couple households (5,214 | 65.8%) accounting for the largest median household size of 3.39 persons per household. non-family households (1,785 | 22.5%) represent the smallest median household size with 1.30 persons per household.
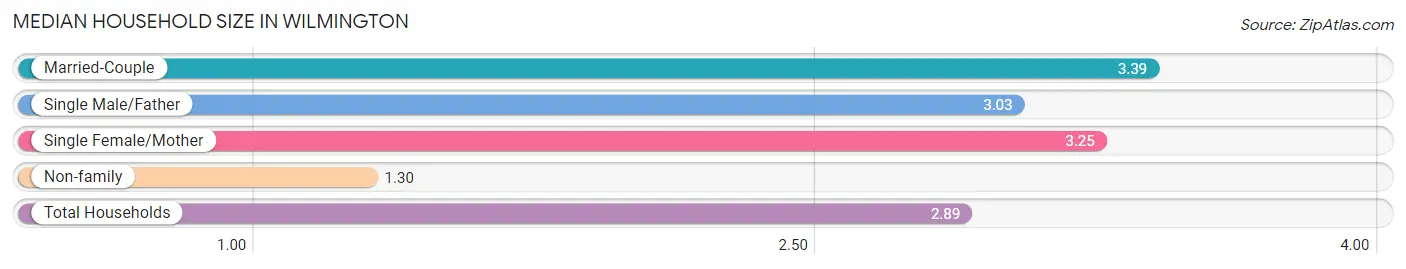
| Household Type | # Households | Household Size |
| Married-Couple | 5,214 (65.8%) | 3.39 |
| Single Male/Father | 249 (3.1%) | 3.03 |
| Single Female/Mother | 677 (8.5%) | 3.25 |
| Non-family | 1,785 (22.5%) | 1.30 |
| Total Households | 7,925 (100.0%) | 2.89 |
Household Size by Marriage Status in Wilmington
Out of a total of 7,925 households in Wilmington, 6,140 (77.5%) are family households, while 1,785 (22.5%) are nonfamily households. The most numerous type of family households are 2-person households, comprising 2,036, and the most common type of nonfamily households are 1-person households, comprising 1,353.
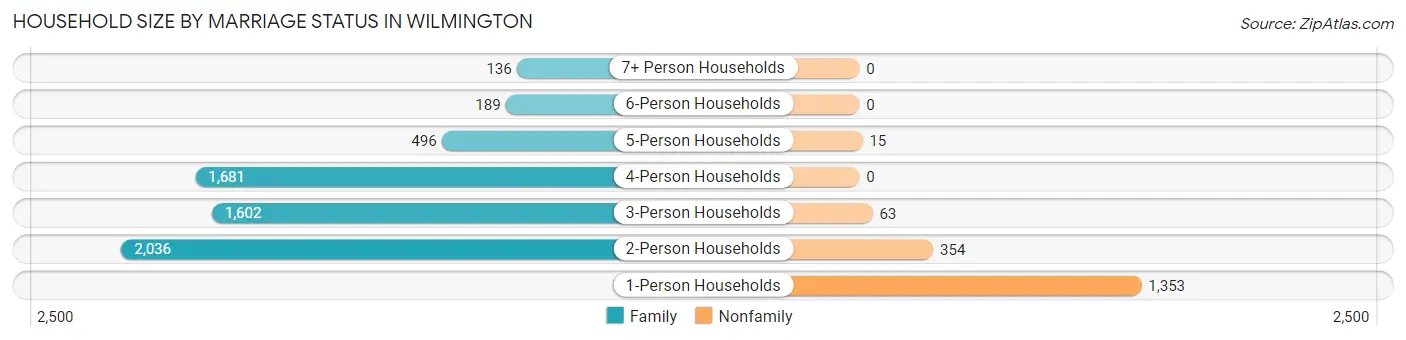
| Household Size | Family Households | Nonfamily Households |
| 1-Person Households | - | 1,353 (17.1%) |
| 2-Person Households | 2,036 (25.7%) | 354 (4.5%) |
| 3-Person Households | 1,602 (20.2%) | 63 (0.8%) |
| 4-Person Households | 1,681 (21.2%) | 0 (0.0%) |
| 5-Person Households | 496 (6.3%) | 15 (0.2%) |
| 6-Person Households | 189 (2.4%) | 0 (0.0%) |
| 7+ Person Households | 136 (1.7%) | 0 (0.0%) |
| Total | 6,140 (77.5%) | 1,785 (22.5%) |
Female Fertility in Wilmington
Fertility by Age in Wilmington
Average fertility rate in Wilmington is 36.0 births per 1,000 women. Women in the age bracket of 20 to 34 years have the highest fertility rate with 74.0 births per 1,000 women. Women in the age bracket of 20 to 34 years acount for 58.7% of all women with births.
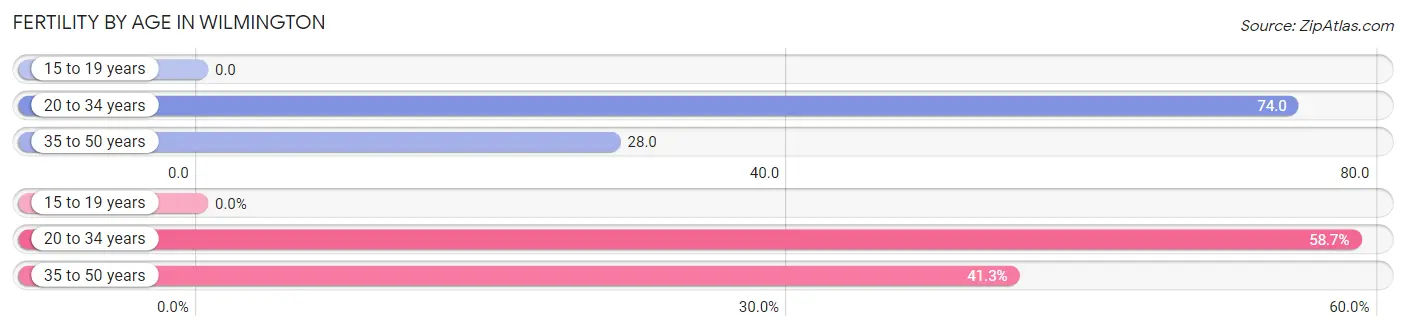
| Age Bracket | Women with Births | Births / 1,000 Women |
| 15 to 19 years | 0 (0.0%) | 0.0 |
| 20 to 34 years | 108 (58.7%) | 74.0 |
| 35 to 50 years | 76 (41.3%) | 28.0 |
| Total | 184 (100.0%) | 36.0 |
Fertility by Age by Marriage Status in Wilmington
95.1% of women with births (184) in Wilmington are married. The highest percentage of unmarried women with births falls into 35 to 50 years age bracket with 11.8% of them unmarried at the time of birth, while the lowest percentage of unmarried women with births belong to 20 to 34 years age bracket with 0.0% of them unmarried.
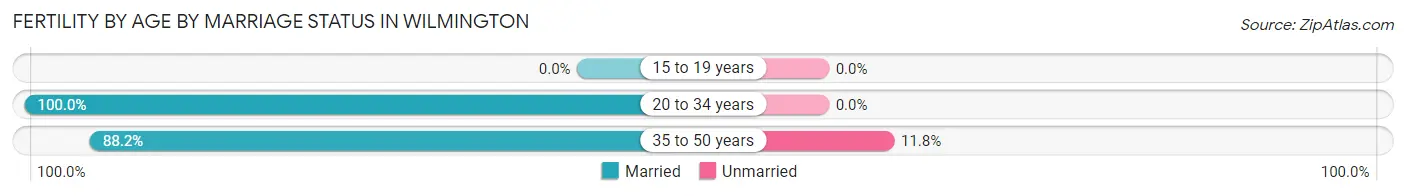
| Age Bracket | Married | Unmarried |
| 15 to 19 years | 0 (0.0%) | 0 (0.0%) |
| 20 to 34 years | 108 (100.0%) | 0 (0.0%) |
| 35 to 50 years | 67 (88.2%) | 9 (11.8%) |
| Total | 175 (95.1%) | 9 (4.9%) |
Fertility by Education in Wilmington
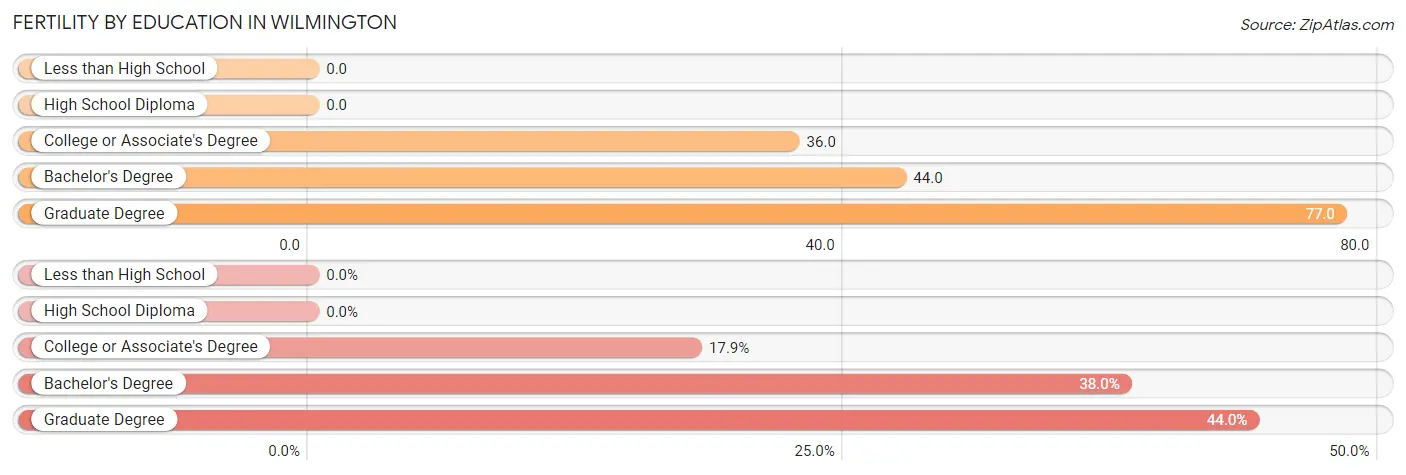
| Educational Attainment | Women with Births | Births / 1,000 Women |
| Less than High School | 0 (0.0%) | 0.0 |
| High School Diploma | 0 (0.0%) | 0.0 |
| College or Associate's Degree | 33 (17.9%) | 36.0 |
| Bachelor's Degree | 70 (38.0%) | 44.0 |
| Graduate Degree | 81 (44.0%) | 77.0 |
| Total | 184 (100.0%) | 36.0 |
Fertility by Education by Marriage Status in Wilmington
4.9% of women with births in Wilmington are unmarried. Women with the educational attainment of bachelor's degree are most likely to be married with 100.0% of them married at childbirth, while women with the educational attainment of college or associate's degree are least likely to be married with 27.3% of them unmarried at childbirth.
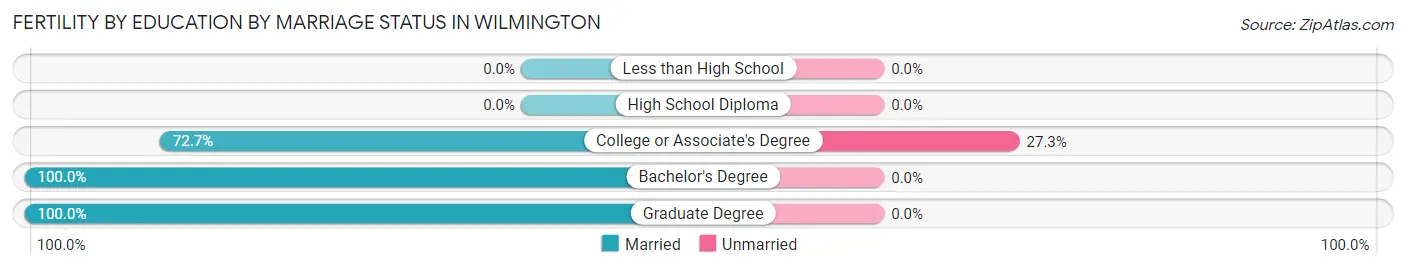
| Educational Attainment | Married | Unmarried |
| Less than High School | 0 (0.0%) | 0 (0.0%) |
| High School Diploma | 0 (0.0%) | 0 (0.0%) |
| College or Associate's Degree | 24 (72.7%) | 9 (27.3%) |
| Bachelor's Degree | 70 (100.0%) | 0 (0.0%) |
| Graduate Degree | 81 (100.0%) | 0 (0.0%) |
| Total | 175 (95.1%) | 9 (4.9%) |
Employment Characteristics in Wilmington
Employment by Class of Employer in Wilmington
Among the 12,662 employed individuals in Wilmington, private company employees (9,007 | 71.1%), not-for-profit organizations (1,260 | 10.0%), and local government employees (842 | 6.7%) make up the most common classes of employment.
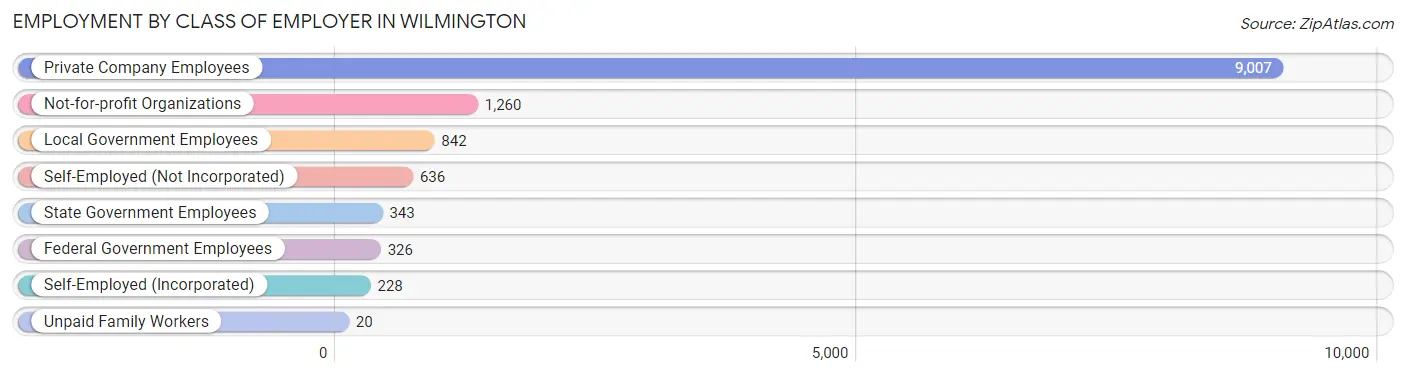
| Employer Class | # Employees | % Employees |
| Private Company Employees | 9,007 | 71.1% |
| Self-Employed (Incorporated) | 228 | 1.8% |
| Self-Employed (Not Incorporated) | 636 | 5.0% |
| Not-for-profit Organizations | 1,260 | 10.0% |
| Local Government Employees | 842 | 6.7% |
| State Government Employees | 343 | 2.7% |
| Federal Government Employees | 326 | 2.6% |
| Unpaid Family Workers | 20 | 0.2% |
| Total | 12,662 | 100.0% |
Employment Status by Age in Wilmington
According to the labor force statistics for Wilmington, out of the total population over 16 years of age (18,740), 71.9% or 13,474 individuals are in the labor force, with 4.4% or 593 of them unemployed. The age group with the highest labor force participation rate is 25 to 29 years, with 90.6% or 883 individuals in the labor force. Within the labor force, the 45 to 54 years age range has the highest percentage of unemployed individuals, with 9.9% or 299 of them being unemployed.
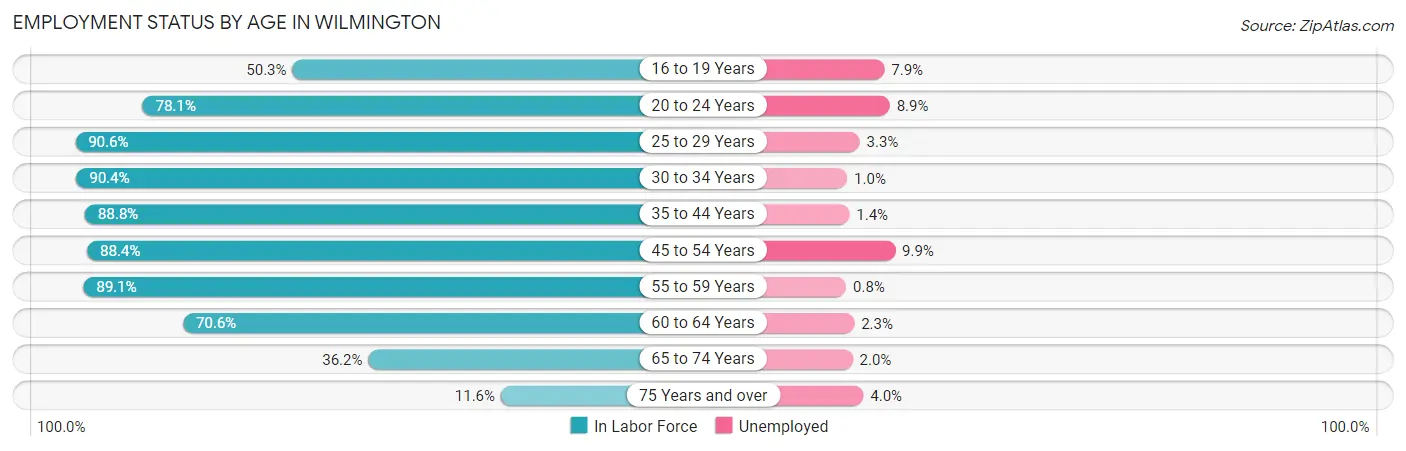
| Age Bracket | In Labor Force | Unemployed |
| 16 to 19 Years | 685 (50.3%) | 54 (7.9%) |
| 20 to 24 Years | 1,107 (78.1%) | 99 (8.9%) |
| 25 to 29 Years | 883 (90.6%) | 29 (3.3%) |
| 30 to 34 Years | 1,048 (90.4%) | 10 (1.0%) |
| 35 to 44 Years | 2,622 (88.8%) | 37 (1.4%) |
| 45 to 54 Years | 3,024 (88.4%) | 299 (9.9%) |
| 55 to 59 Years | 2,080 (89.1%) | 17 (0.8%) |
| 60 to 64 Years | 1,120 (70.6%) | 26 (2.3%) |
| 65 to 74 Years | 734 (36.2%) | 15 (2.0%) |
| 75 Years and over | 175 (11.6%) | 7 (4.0%) |
| Total | 13,474 (71.9%) | 593 (4.4%) |
Employment Status by Educational Attainment in Wilmington
According to labor force statistics for Wilmington, 86.7% of individuals (10,775) out of the total population between 25 and 64 years of age (12,428) are in the labor force, with 3.9% or 420 of them being unemployed. The group with the highest labor force participation rate are those with the educational attainment of bachelor's degree or higher, with 91.4% or 6,159 individuals in the labor force. Within the labor force, individuals with high school diploma education have the highest percentage of unemployment, with 5.1% or 102 of them being unemployed.
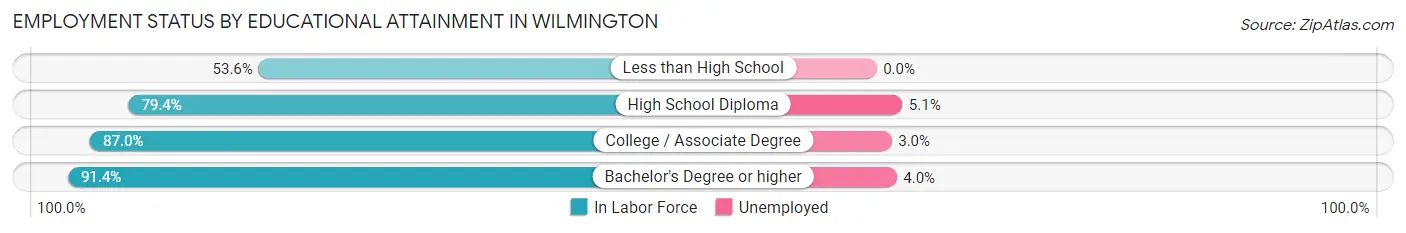
| Educational Attainment | In Labor Force | Unemployed |
| Less than High School | 229 (53.6%) | 0 (0.0%) |
| High School Diploma | 2,006 (79.4%) | 129 (5.1%) |
| College / Associate Degree | 2,381 (87.0%) | 82 (3.0%) |
| Bachelor's Degree or higher | 6,159 (91.4%) | 270 (4.0%) |
| Total | 10,775 (86.7%) | 485 (3.9%) |
Employment Occupations by Sex in Wilmington
Management, Business, Science and Arts Occupations
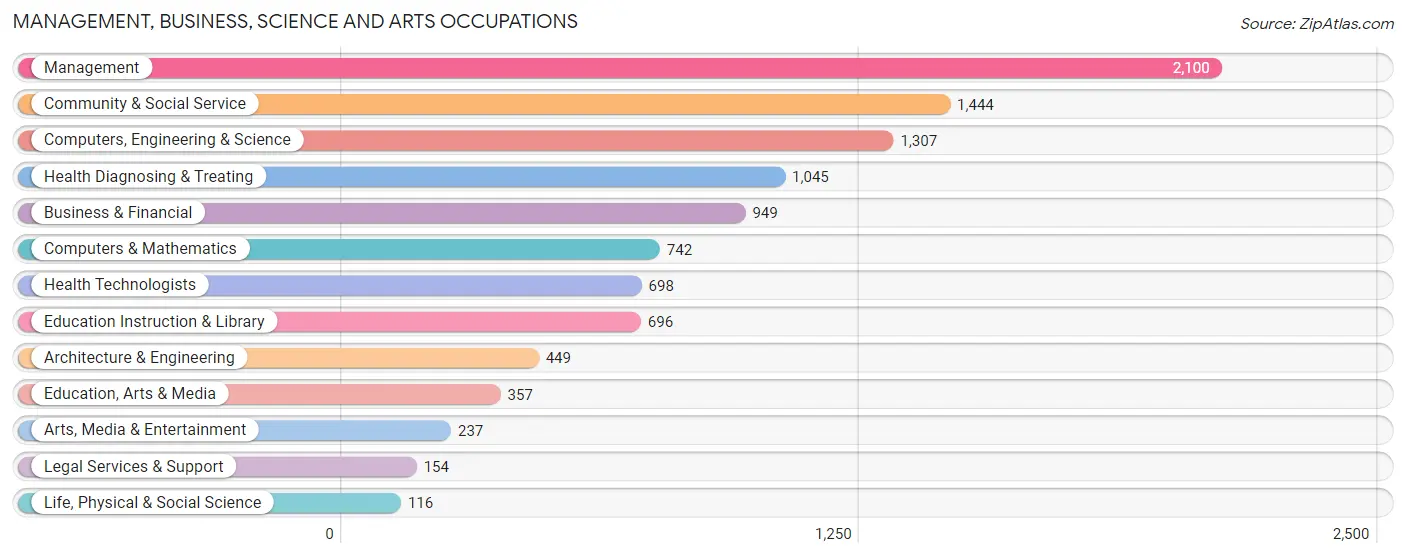
The most common Management, Business, Science and Arts occupations in Wilmington are Management (2,100 | 16.3%), Community & Social Service (1,444 | 11.2%), Computers, Engineering & Science (1,307 | 10.2%), Health Diagnosing & Treating (1,045 | 8.1%), and Business & Financial (949 | 7.4%).
Management, Business, Science and Arts Occupations by Sex
Within the Management, Business, Science and Arts occupations in Wilmington, the most male-oriented occupations are Architecture & Engineering (91.3%), Computers, Engineering & Science (80.3%), and Computers & Mathematics (79.0%), while the most female-oriented occupations are Health Diagnosing & Treating (94.6%), Health Technologists (91.8%), and Education Instruction & Library (78.4%).
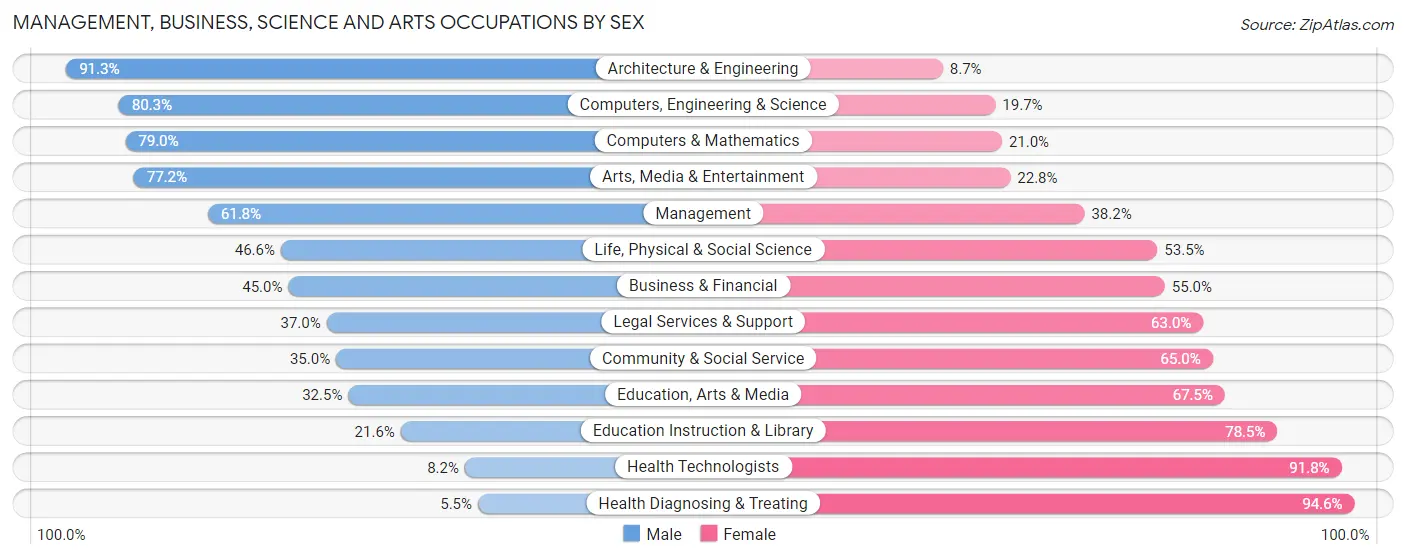
| Occupation | Male | Female |
| Management | 1,297 (61.8%) | 803 (38.2%) |
| Business & Financial | 427 (45.0%) | 522 (55.0%) |
| Computers, Engineering & Science | 1,050 (80.3%) | 257 (19.7%) |
| Computers & Mathematics | 586 (79.0%) | 156 (21.0%) |
| Architecture & Engineering | 410 (91.3%) | 39 (8.7%) |
| Life, Physical & Social Science | 54 (46.6%) | 62 (53.4%) |
| Community & Social Service | 506 (35.0%) | 938 (65.0%) |
| Education, Arts & Media | 116 (32.5%) | 241 (67.5%) |
| Legal Services & Support | 57 (37.0%) | 97 (63.0%) |
| Education Instruction & Library | 150 (21.5%) | 546 (78.4%) |
| Arts, Media & Entertainment | 183 (77.2%) | 54 (22.8%) |
| Health Diagnosing & Treating | 57 (5.4%) | 988 (94.6%) |
| Health Technologists | 57 (8.2%) | 641 (91.8%) |
| Total (Category) | 3,337 (48.7%) | 3,508 (51.2%) |
| Total (Overall) | 7,007 (54.5%) | 5,856 (45.5%) |
Services Occupations
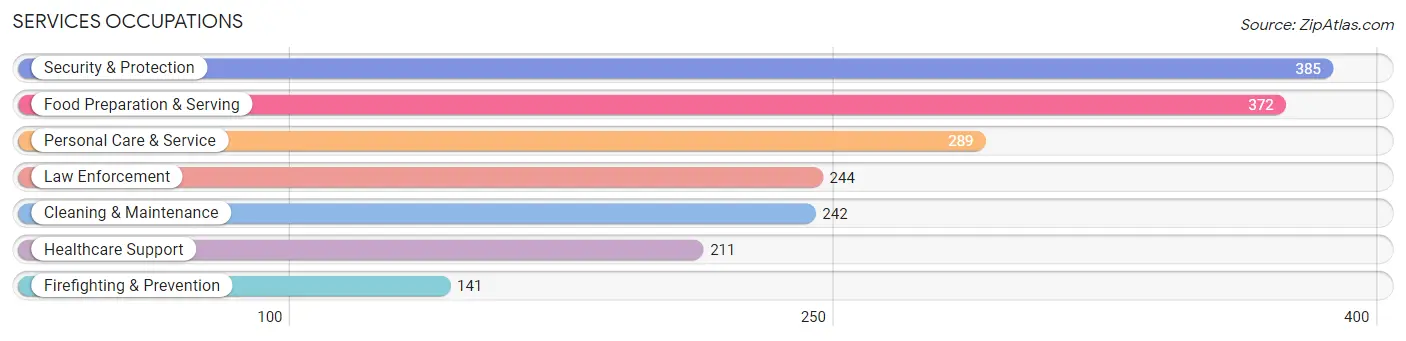
The most common Services occupations in Wilmington are Security & Protection (385 | 3.0%), Food Preparation & Serving (372 | 2.9%), Personal Care & Service (289 | 2.2%), Law Enforcement (244 | 1.9%), and Cleaning & Maintenance (242 | 1.9%).
Services Occupations by Sex
Within the Services occupations in Wilmington, the most male-oriented occupations are Cleaning & Maintenance (91.7%), Firefighting & Prevention (83.0%), and Food Preparation & Serving (64.5%), while the most female-oriented occupations are Healthcare Support (86.3%), Personal Care & Service (69.2%), and Law Enforcement (50.0%).
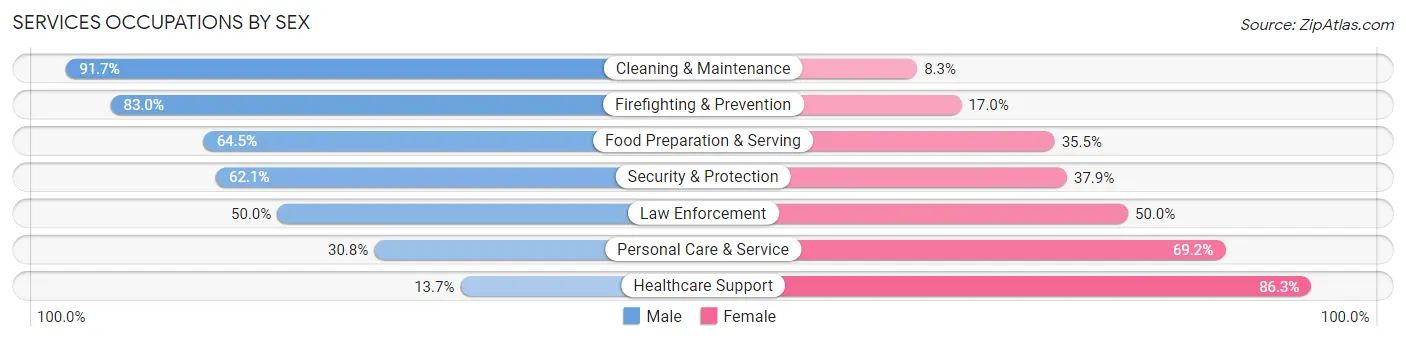
| Occupation | Male | Female |
| Healthcare Support | 29 (13.7%) | 182 (86.3%) |
| Security & Protection | 239 (62.1%) | 146 (37.9%) |
| Firefighting & Prevention | 117 (83.0%) | 24 (17.0%) |
| Law Enforcement | 122 (50.0%) | 122 (50.0%) |
| Food Preparation & Serving | 240 (64.5%) | 132 (35.5%) |
| Cleaning & Maintenance | 222 (91.7%) | 20 (8.3%) |
| Personal Care & Service | 89 (30.8%) | 200 (69.2%) |
| Total (Category) | 819 (54.6%) | 680 (45.4%) |
| Total (Overall) | 7,007 (54.5%) | 5,856 (45.5%) |
Sales and Office Occupations
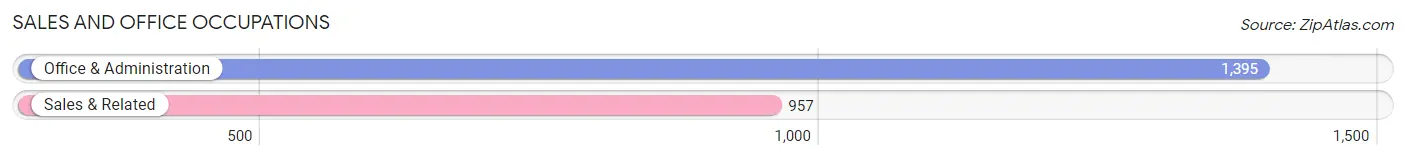
The most common Sales and Office occupations in Wilmington are Office & Administration (1,395 | 10.8%), and Sales & Related (957 | 7.4%).
Sales and Office Occupations by Sex
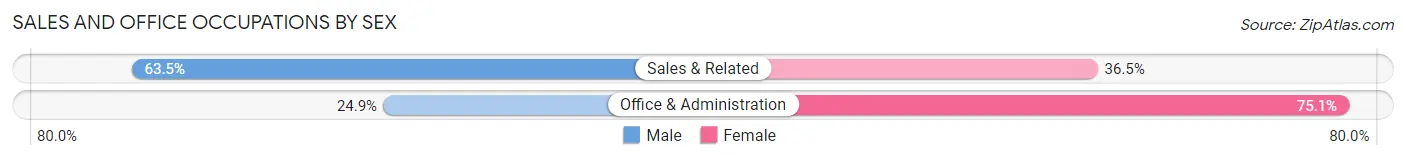
| Occupation | Male | Female |
| Sales & Related | 608 (63.5%) | 349 (36.5%) |
| Office & Administration | 347 (24.9%) | 1,048 (75.1%) |
| Total (Category) | 955 (40.6%) | 1,397 (59.4%) |
| Total (Overall) | 7,007 (54.5%) | 5,856 (45.5%) |
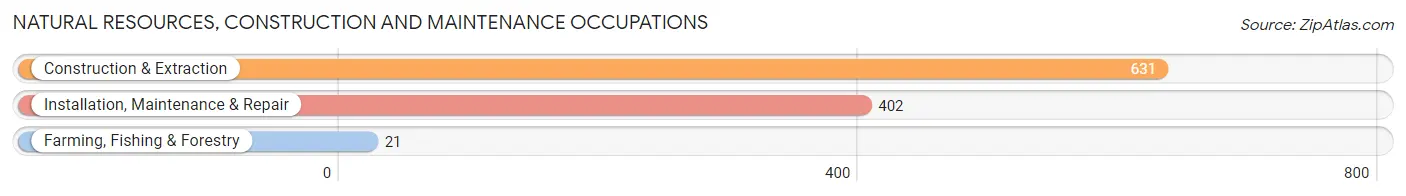
Natural Resources, Construction and Maintenance Occupations
The most common Natural Resources, Construction and Maintenance occupations in Wilmington are Construction & Extraction (631 | 4.9%), Installation, Maintenance & Repair (402 | 3.1%), and Farming, Fishing & Forestry (21 | 0.2%).
Natural Resources, Construction and Maintenance Occupations by Sex
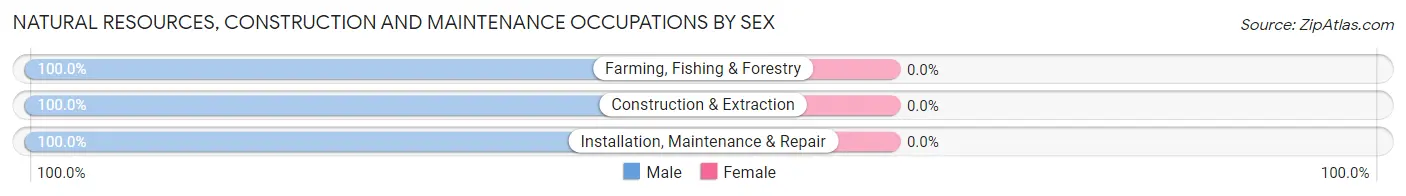
| Occupation | Male | Female |
| Farming, Fishing & Forestry | 21 (100.0%) | 0 (0.0%) |
| Construction & Extraction | 631 (100.0%) | 0 (0.0%) |
| Installation, Maintenance & Repair | 402 (100.0%) | 0 (0.0%) |
| Total (Category) | 1,054 (100.0%) | 0 (0.0%) |
| Total (Overall) | 7,007 (54.5%) | 5,856 (45.5%) |
Production, Transportation and Moving Occupations
The most common Production, Transportation and Moving occupations in Wilmington are Transportation (421 | 3.3%), Material Moving (391 | 3.0%), and Production (301 | 2.3%).
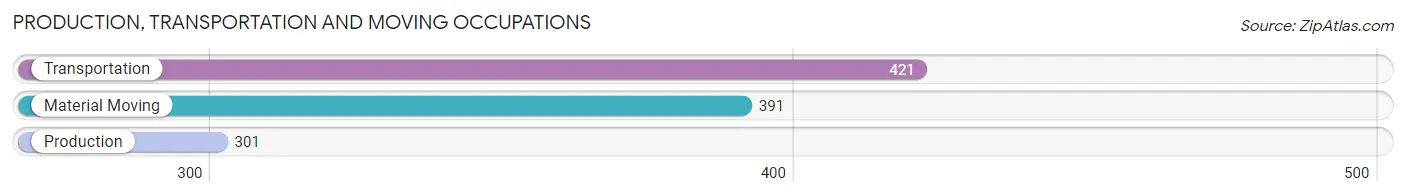
Production, Transportation and Moving Occupations by Sex
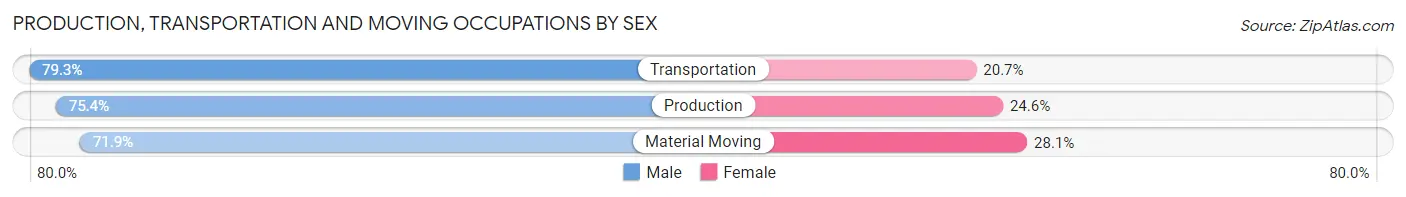
| Occupation | Male | Female |
| Production | 227 (75.4%) | 74 (24.6%) |
| Transportation | 334 (79.3%) | 87 (20.7%) |
| Material Moving | 281 (71.9%) | 110 (28.1%) |
| Total (Category) | 842 (75.6%) | 271 (24.3%) |
| Total (Overall) | 7,007 (54.5%) | 5,856 (45.5%) |
Employment Industries by Sex in Wilmington
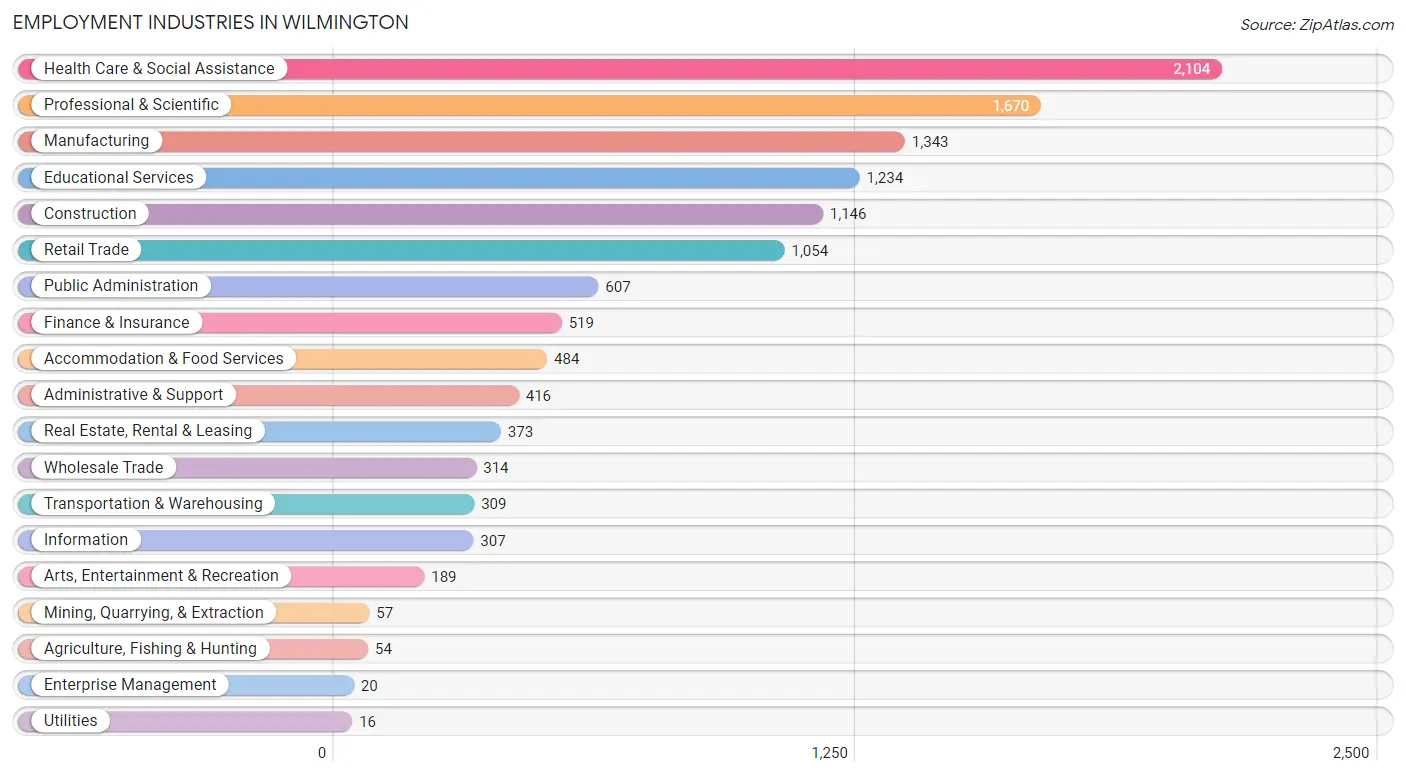
Employment Industries in Wilmington
The major employment industries in Wilmington include Health Care & Social Assistance (2,104 | 16.4%), Professional & Scientific (1,670 | 13.0%), Manufacturing (1,343 | 10.4%), Educational Services (1,234 | 9.6%), and Construction (1,146 | 8.9%).
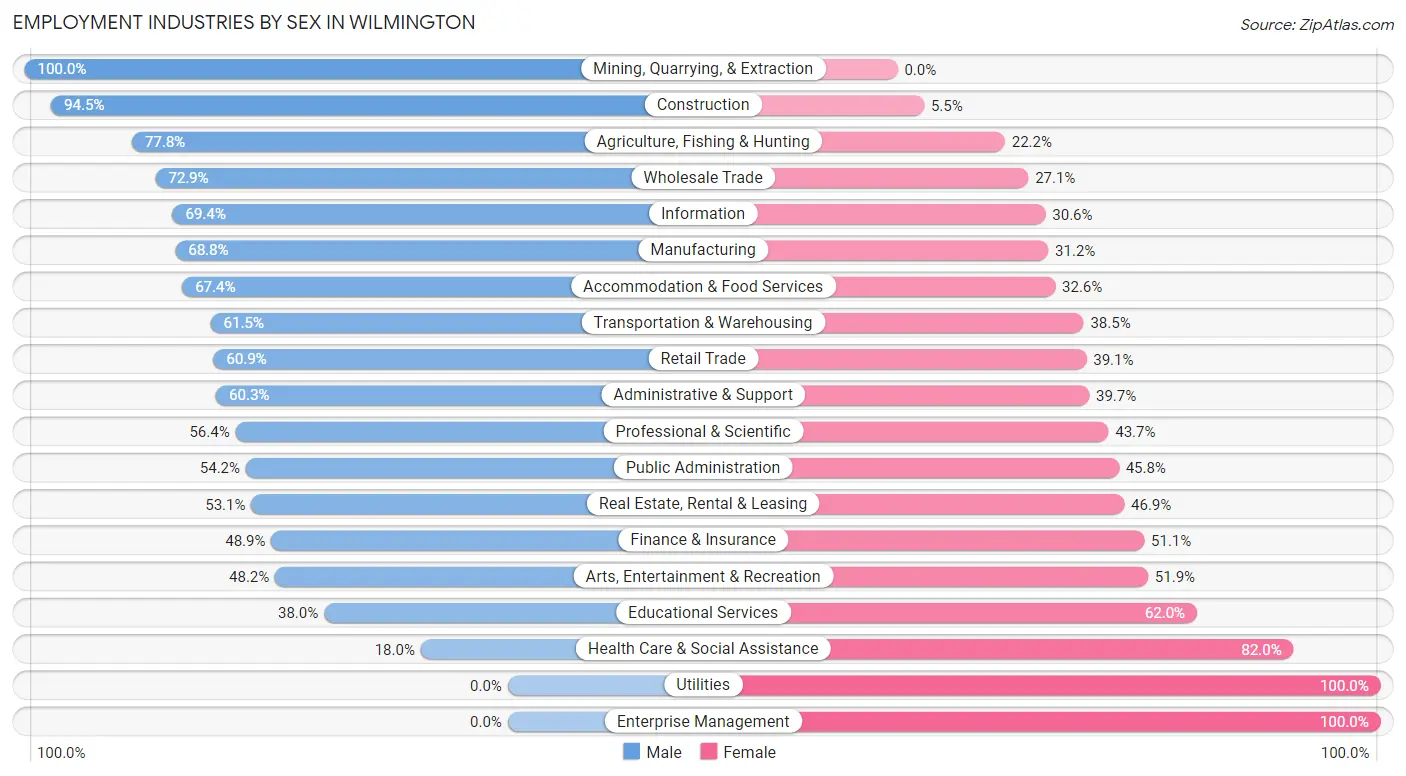
Employment Industries by Sex in Wilmington
The Wilmington industries that see more men than women are Mining, Quarrying, & Extraction (100.0%), Construction (94.5%), and Agriculture, Fishing & Hunting (77.8%), whereas the industries that tend to have a higher number of women are Utilities (100.0%), Enterprise Management (100.0%), and Health Care & Social Assistance (82.0%).
| Industry | Male | Female |
| Agriculture, Fishing & Hunting | 42 (77.8%) | 12 (22.2%) |
| Mining, Quarrying, & Extraction | 57 (100.0%) | 0 (0.0%) |
| Construction | 1,083 (94.5%) | 63 (5.5%) |
| Manufacturing | 924 (68.8%) | 419 (31.2%) |
| Wholesale Trade | 229 (72.9%) | 85 (27.1%) |
| Retail Trade | 642 (60.9%) | 412 (39.1%) |
| Transportation & Warehousing | 190 (61.5%) | 119 (38.5%) |
| Utilities | 0 (0.0%) | 16 (100.0%) |
| Information | 213 (69.4%) | 94 (30.6%) |
| Finance & Insurance | 254 (48.9%) | 265 (51.1%) |
| Real Estate, Rental & Leasing | 198 (53.1%) | 175 (46.9%) |
| Professional & Scientific | 941 (56.4%) | 729 (43.6%) |
| Enterprise Management | 0 (0.0%) | 20 (100.0%) |
| Administrative & Support | 251 (60.3%) | 165 (39.7%) |
| Educational Services | 469 (38.0%) | 765 (62.0%) |
| Health Care & Social Assistance | 379 (18.0%) | 1,725 (82.0%) |
| Arts, Entertainment & Recreation | 91 (48.1%) | 98 (51.8%) |
| Accommodation & Food Services | 326 (67.4%) | 158 (32.6%) |
| Public Administration | 329 (54.2%) | 278 (45.8%) |
| Total | 7,007 (54.5%) | 5,856 (45.5%) |
Education in Wilmington
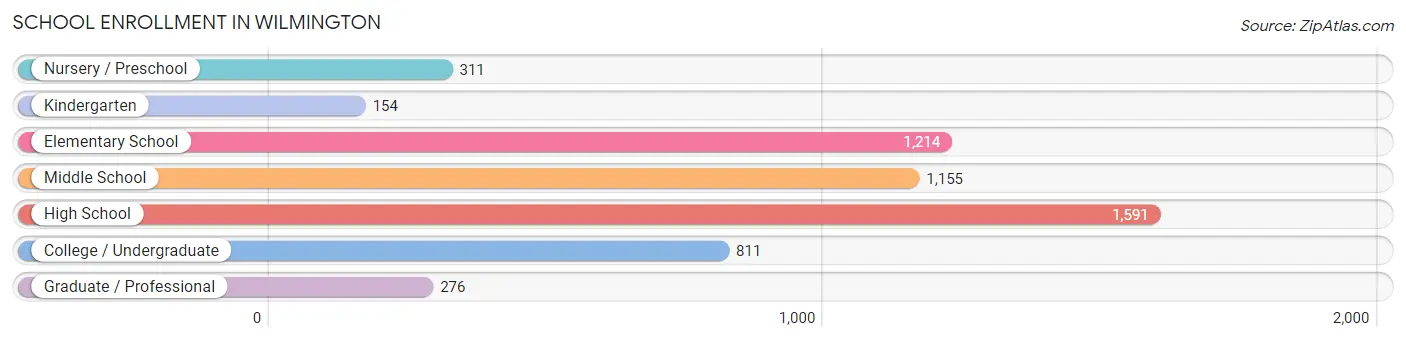
School Enrollment in Wilmington
The most common levels of schooling among the 5,512 students in Wilmington are high school (1,591 | 28.9%), elementary school (1,214 | 22.0%), and middle school (1,155 | 20.9%).
| School Level | # Students | % Students |
| Nursery / Preschool | 311 | 5.6% |
| Kindergarten | 154 | 2.8% |
| Elementary School | 1,214 | 22.0% |
| Middle School | 1,155 | 20.9% |
| High School | 1,591 | 28.9% |
| College / Undergraduate | 811 | 14.7% |
| Graduate / Professional | 276 | 5.0% |
| Total | 5,512 | 100.0% |
School Enrollment by Age by Funding Source in Wilmington
Out of a total of 5,512 students who are enrolled in schools in Wilmington, 1,273 (23.1%) attend a private institution, while the remaining 4,239 (76.9%) are enrolled in public schools. The age group of 35 years and over has the highest likelihood of being enrolled in private schools, with 180 (87.0% in the age bracket) enrolled. Conversely, the age group of 5 to 9 year old has the lowest likelihood of being enrolled in a private school, with 1,251 (97.2% in the age bracket) attending a public institution.
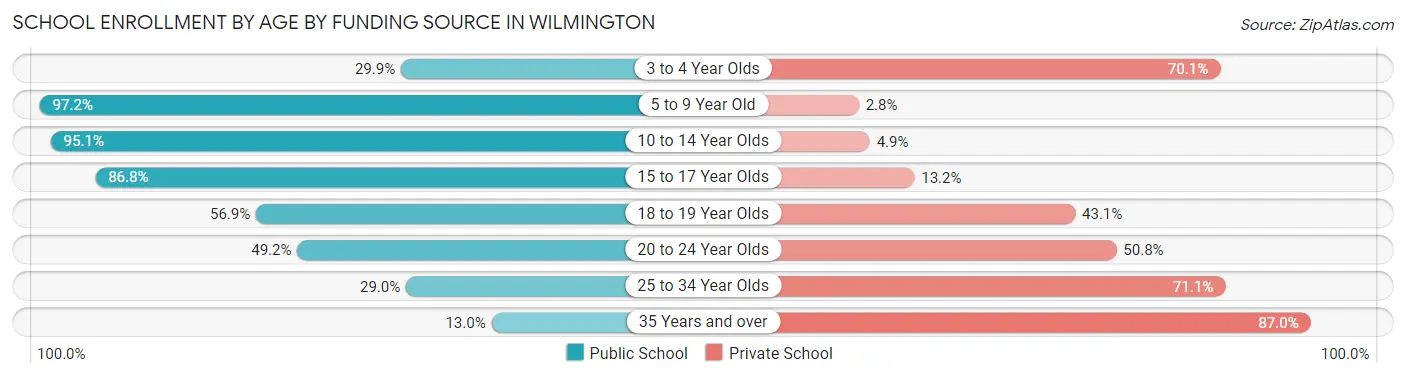
| Age Bracket | Public School | Private School |
| 3 to 4 Year Olds | 84 (29.9%) | 197 (70.1%) |
| 5 to 9 Year Old | 1,251 (97.2%) | 36 (2.8%) |
| 10 to 14 Year Olds | 1,332 (95.1%) | 68 (4.9%) |
| 15 to 17 Year Olds | 851 (86.8%) | 129 (13.2%) |
| 18 to 19 Year Olds | 351 (56.9%) | 266 (43.1%) |
| 20 to 24 Year Olds | 308 (49.2%) | 318 (50.8%) |
| 25 to 34 Year Olds | 33 (28.9%) | 81 (71.1%) |
| 35 Years and over | 27 (13.0%) | 180 (87.0%) |
| Total | 4,239 (76.9%) | 1,273 (23.1%) |
Educational Attainment by Field of Study in Wilmington
Business (1,882 | 22.6%), engineering (903 | 10.8%), education (800 | 9.6%), computers & mathematics (783 | 9.4%), and science & technology (722 | 8.6%) are the most common fields of study among 8,342 individuals in Wilmington who have obtained a bachelor's degree or higher.
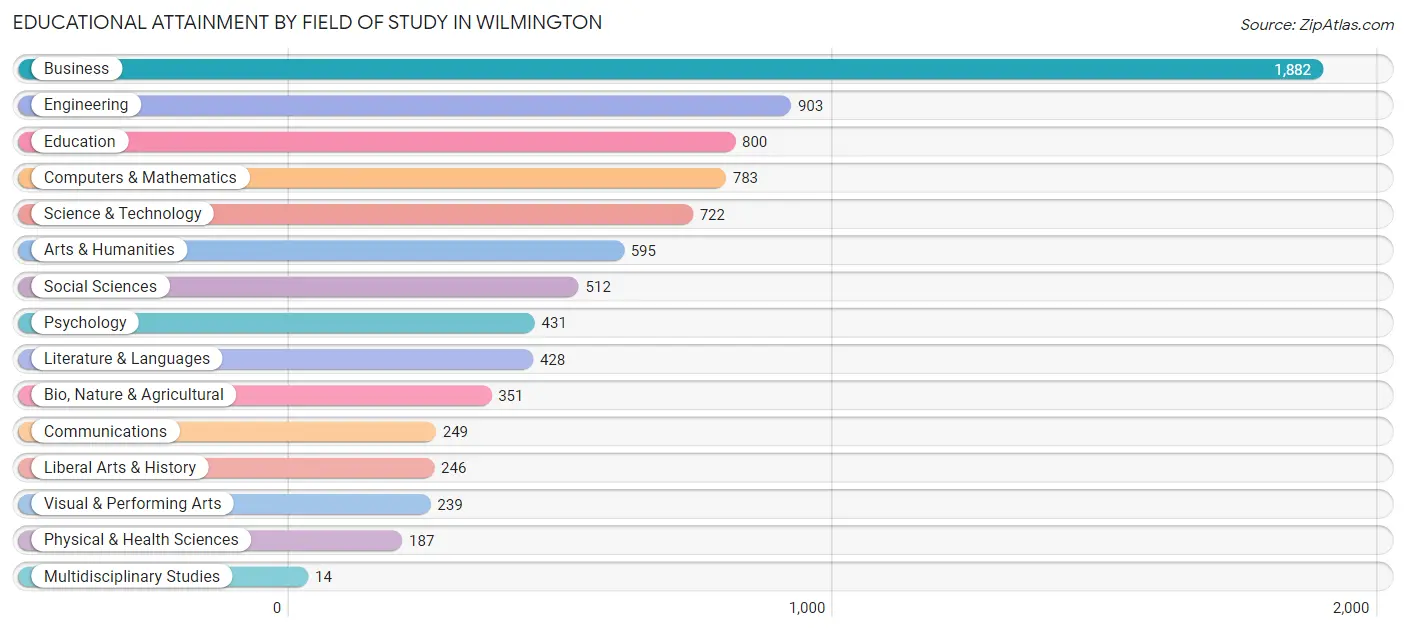
| Field of Study | # Graduates | % Graduates |
| Computers & Mathematics | 783 | 9.4% |
| Bio, Nature & Agricultural | 351 | 4.2% |
| Physical & Health Sciences | 187 | 2.2% |
| Psychology | 431 | 5.2% |
| Social Sciences | 512 | 6.1% |
| Engineering | 903 | 10.8% |
| Multidisciplinary Studies | 14 | 0.2% |
| Science & Technology | 722 | 8.6% |
| Business | 1,882 | 22.6% |
| Education | 800 | 9.6% |
| Literature & Languages | 428 | 5.1% |
| Liberal Arts & History | 246 | 2.9% |
| Visual & Performing Arts | 239 | 2.9% |
| Communications | 249 | 3.0% |
| Arts & Humanities | 595 | 7.1% |
| Total | 8,342 | 100.0% |
Transportation & Commute in Wilmington
Vehicle Availability by Sex in Wilmington
The most prevalent vehicle ownership categories in Wilmington are males with 2 vehicles (3,326, accounting for 48.2%) and females with 2 vehicles (2,573, making up 57.7%).
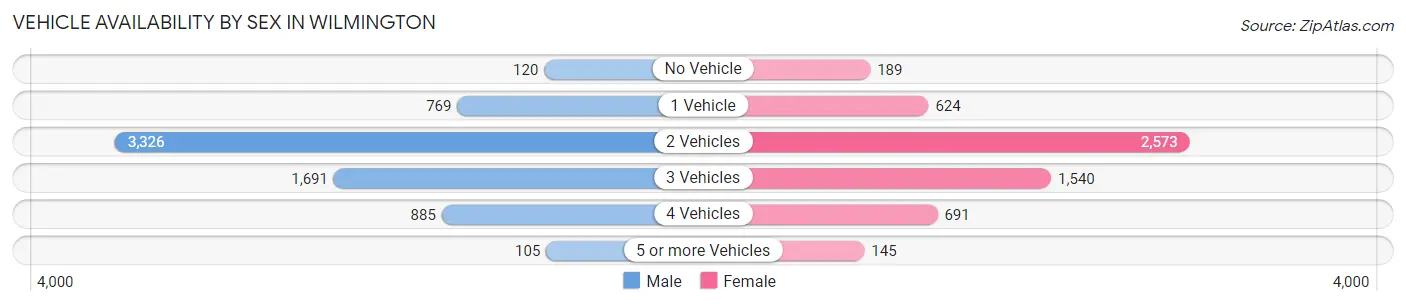
| Vehicles Available | Male | Female |
| No Vehicle | 120 (1.7%) | 189 (3.3%) |
| 1 Vehicle | 769 (11.2%) | 624 (10.8%) |
| 2 Vehicles | 3,326 (48.2%) | 2,573 (44.7%) |
| 3 Vehicles | 1,691 (24.5%) | 1,540 (26.7%) |
| 4 Vehicles | 885 (12.8%) | 691 (12.0%) |
| 5 or more Vehicles | 105 (1.5%) | 145 (2.5%) |
| Total | 6,896 (100.0%) | 5,762 (100.0%) |
Commute Time in Wilmington
The most frequently occuring commute durations in Wilmington are 30 to 34 minutes (2,033 commuters, 18.6%), 15 to 19 minutes (1,509 commuters, 13.8%), and 20 to 24 minutes (1,364 commuters, 12.5%).
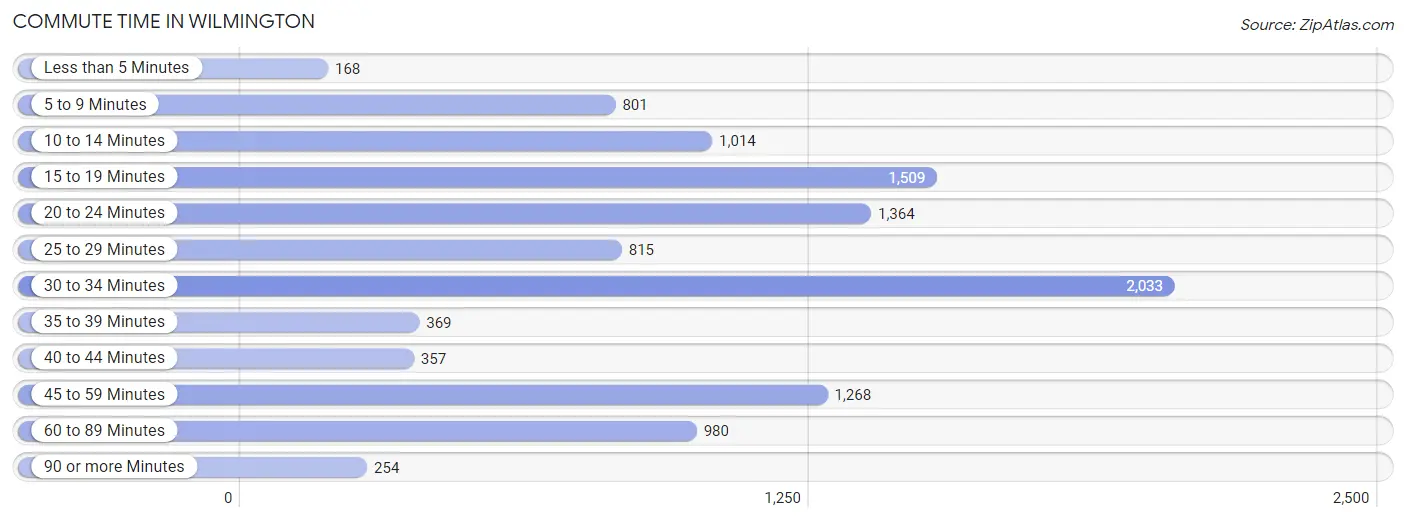
| Commute Time | # Commuters | % Commuters |
| Less than 5 Minutes | 168 | 1.5% |
| 5 to 9 Minutes | 801 | 7.3% |
| 10 to 14 Minutes | 1,014 | 9.3% |
| 15 to 19 Minutes | 1,509 | 13.8% |
| 20 to 24 Minutes | 1,364 | 12.5% |
| 25 to 29 Minutes | 815 | 7.5% |
| 30 to 34 Minutes | 2,033 | 18.6% |
| 35 to 39 Minutes | 369 | 3.4% |
| 40 to 44 Minutes | 357 | 3.3% |
| 45 to 59 Minutes | 1,268 | 11.6% |
| 60 to 89 Minutes | 980 | 9.0% |
| 90 or more Minutes | 254 | 2.3% |
Commute Time by Sex in Wilmington
The most common commute times in Wilmington are 30 to 34 minutes (1,130 commuters, 18.5%) for males and 30 to 34 minutes (903 commuters, 18.8%) for females.
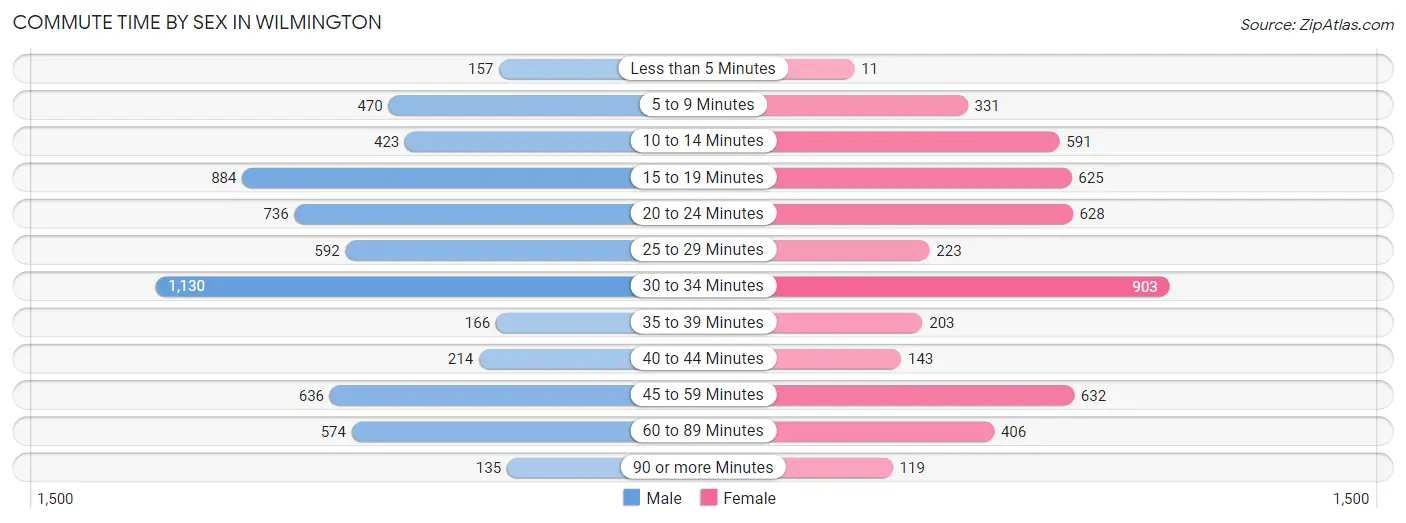
| Commute Time | Male | Female |
| Less than 5 Minutes | 157 (2.6%) | 11 (0.2%) |
| 5 to 9 Minutes | 470 (7.7%) | 331 (6.9%) |
| 10 to 14 Minutes | 423 (6.9%) | 591 (12.3%) |
| 15 to 19 Minutes | 884 (14.4%) | 625 (13.0%) |
| 20 to 24 Minutes | 736 (12.0%) | 628 (13.0%) |
| 25 to 29 Minutes | 592 (9.7%) | 223 (4.6%) |
| 30 to 34 Minutes | 1,130 (18.5%) | 903 (18.8%) |
| 35 to 39 Minutes | 166 (2.7%) | 203 (4.2%) |
| 40 to 44 Minutes | 214 (3.5%) | 143 (3.0%) |
| 45 to 59 Minutes | 636 (10.4%) | 632 (13.1%) |
| 60 to 89 Minutes | 574 (9.4%) | 406 (8.4%) |
| 90 or more Minutes | 135 (2.2%) | 119 (2.5%) |
Time of Departure to Work by Sex in Wilmington
The most frequent times of departure to work in Wilmington are 6:30 AM to 6:59 AM (886, 14.5%) for males and 7:00 AM to 7:29 AM (758, 15.7%) for females.
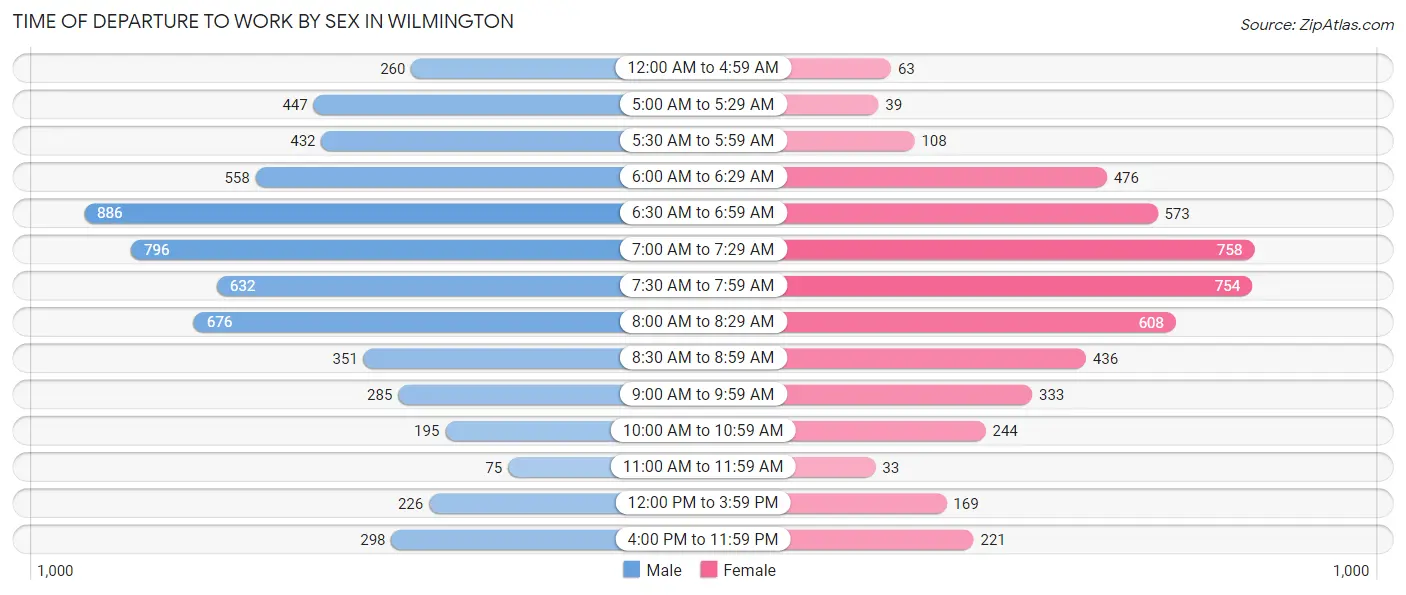
| Time of Departure | Male | Female |
| 12:00 AM to 4:59 AM | 260 (4.3%) | 63 (1.3%) |
| 5:00 AM to 5:29 AM | 447 (7.3%) | 39 (0.8%) |
| 5:30 AM to 5:59 AM | 432 (7.1%) | 108 (2.2%) |
| 6:00 AM to 6:29 AM | 558 (9.1%) | 476 (9.9%) |
| 6:30 AM to 6:59 AM | 886 (14.5%) | 573 (11.9%) |
| 7:00 AM to 7:29 AM | 796 (13.0%) | 758 (15.7%) |
| 7:30 AM to 7:59 AM | 632 (10.3%) | 754 (15.7%) |
| 8:00 AM to 8:29 AM | 676 (11.1%) | 608 (12.6%) |
| 8:30 AM to 8:59 AM | 351 (5.7%) | 436 (9.1%) |
| 9:00 AM to 9:59 AM | 285 (4.7%) | 333 (6.9%) |
| 10:00 AM to 10:59 AM | 195 (3.2%) | 244 (5.1%) |
| 11:00 AM to 11:59 AM | 75 (1.2%) | 33 (0.7%) |
| 12:00 PM to 3:59 PM | 226 (3.7%) | 169 (3.5%) |
| 4:00 PM to 11:59 PM | 298 (4.9%) | 221 (4.6%) |
| Total | 6,117 (100.0%) | 4,815 (100.0%) |
Housing Occupancy in Wilmington
Occupancy by Ownership in Wilmington
Of the total 7,925 dwellings in Wilmington, owner-occupied units account for 6,800 (85.8%), while renter-occupied units make up 1,125 (14.2%).
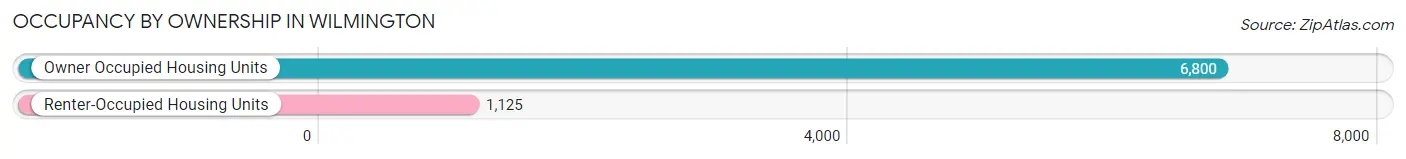
| Occupancy | # Housing Units | % Housing Units |
| Owner Occupied Housing Units | 6,800 | 85.8% |
| Renter-Occupied Housing Units | 1,125 | 14.2% |
| Total Occupied Housing Units | 7,925 | 100.0% |
Occupancy by Household Size in Wilmington
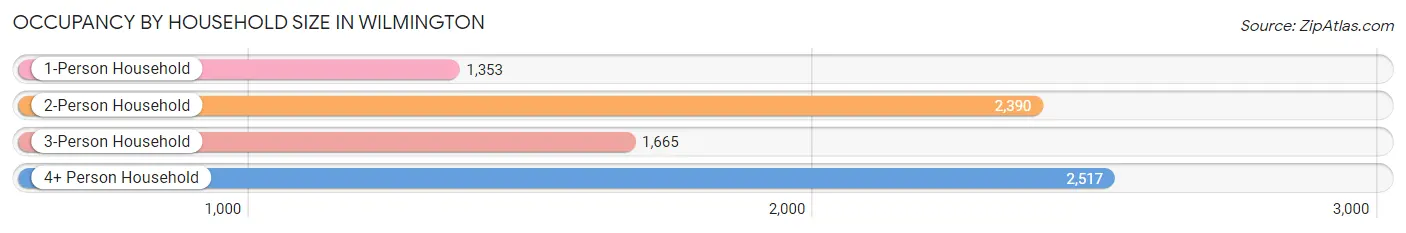
| Household Size | # Housing Units | % Housing Units |
| 1-Person Household | 1,353 | 17.1% |
| 2-Person Household | 2,390 | 30.2% |
| 3-Person Household | 1,665 | 21.0% |
| 4+ Person Household | 2,517 | 31.8% |
| Total Housing Units | 7,925 | 100.0% |
Occupancy by Ownership by Household Size in Wilmington
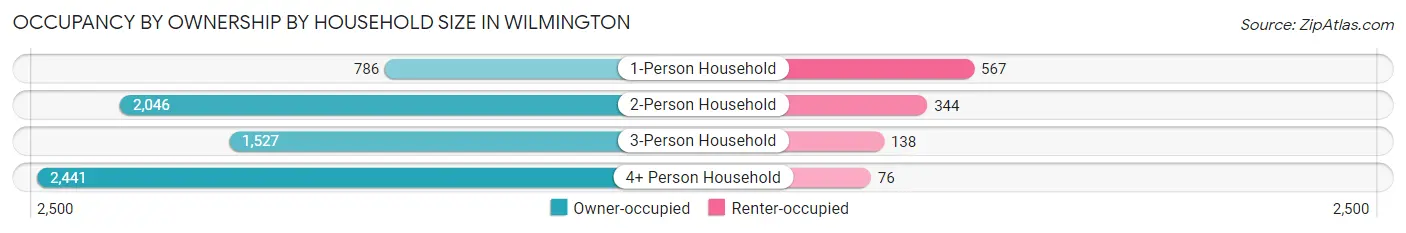
| Household Size | Owner-occupied | Renter-occupied |
| 1-Person Household | 786 (58.1%) | 567 (41.9%) |
| 2-Person Household | 2,046 (85.6%) | 344 (14.4%) |
| 3-Person Household | 1,527 (91.7%) | 138 (8.3%) |
| 4+ Person Household | 2,441 (97.0%) | 76 (3.0%) |
| Total Housing Units | 6,800 (85.8%) | 1,125 (14.2%) |
Occupancy by Educational Attainment in Wilmington
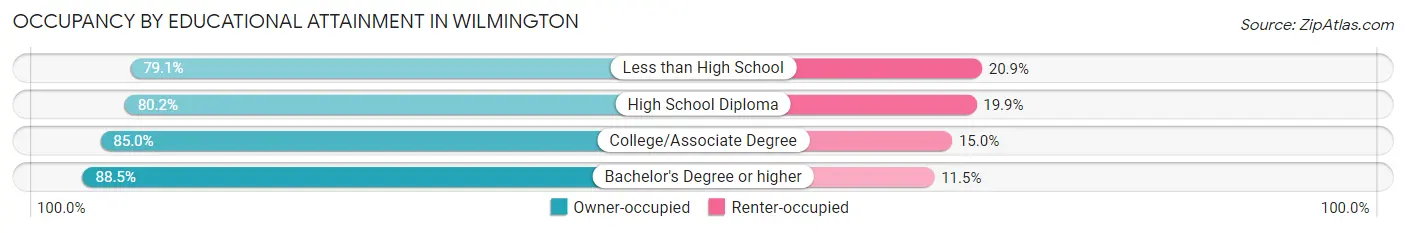
| Household Size | Owner-occupied | Renter-occupied |
| Less than High School | 151 (79.1%) | 40 (20.9%) |
| High School Diploma | 1,175 (80.1%) | 291 (19.9%) |
| College/Associate Degree | 1,752 (85.0%) | 310 (15.0%) |
| Bachelor's Degree or higher | 3,722 (88.5%) | 484 (11.5%) |
Occupancy by Age of Householder in Wilmington
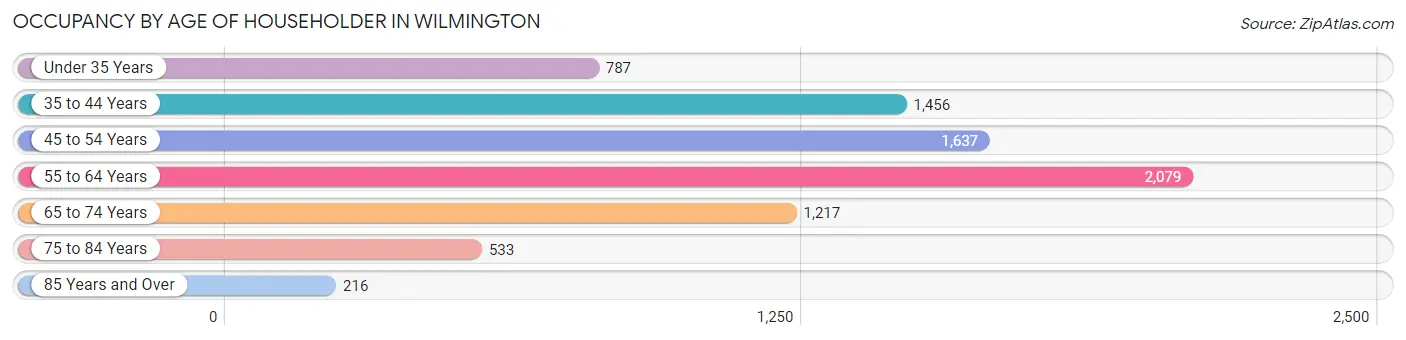
| Age Bracket | # Households | % Households |
| Under 35 Years | 787 | 9.9% |
| 35 to 44 Years | 1,456 | 18.4% |
| 45 to 54 Years | 1,637 | 20.7% |
| 55 to 64 Years | 2,079 | 26.2% |
| 65 to 74 Years | 1,217 | 15.4% |
| 75 to 84 Years | 533 | 6.7% |
| 85 Years and Over | 216 | 2.7% |
| Total | 7,925 | 100.0% |
Housing Finances in Wilmington
Median Income by Occupancy in Wilmington
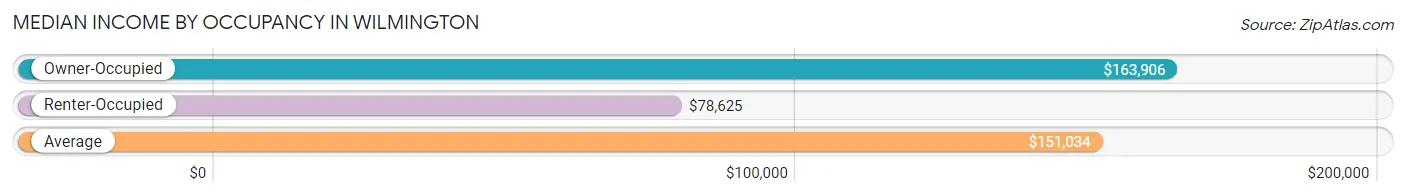
| Occupancy Type | # Households | Median Income |
| Owner-Occupied | 6,800 (85.8%) | $163,906 |
| Renter-Occupied | 1,125 (14.2%) | $78,625 |
| Average | 7,925 (100.0%) | $151,034 |
Occupancy by Householder Income Bracket in Wilmington
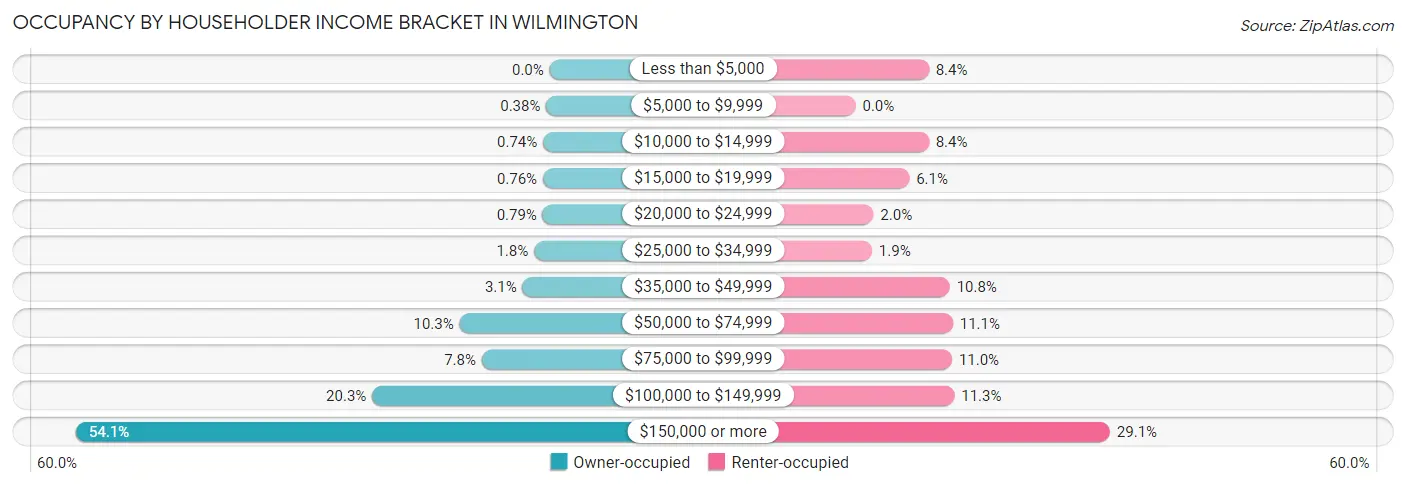
| Income Bracket | Owner-occupied | Renter-occupied |
| Less than $5,000 | 0 (0.0%) | 94 (8.4%) |
| $5,000 to $9,999 | 26 (0.4%) | 0 (0.0%) |
| $10,000 to $14,999 | 50 (0.7%) | 94 (8.4%) |
| $15,000 to $19,999 | 52 (0.8%) | 69 (6.1%) |
| $20,000 to $24,999 | 54 (0.8%) | 23 (2.0%) |
| $25,000 to $34,999 | 121 (1.8%) | 21 (1.9%) |
| $35,000 to $49,999 | 210 (3.1%) | 121 (10.8%) |
| $50,000 to $74,999 | 700 (10.3%) | 125 (11.1%) |
| $75,000 to $99,999 | 527 (7.7%) | 124 (11.0%) |
| $100,000 to $149,999 | 1,379 (20.3%) | 127 (11.3%) |
| $150,000 or more | 3,681 (54.1%) | 327 (29.1%) |
| Total | 6,800 (100.0%) | 1,125 (100.0%) |
Monthly Housing Cost Tiers in Wilmington
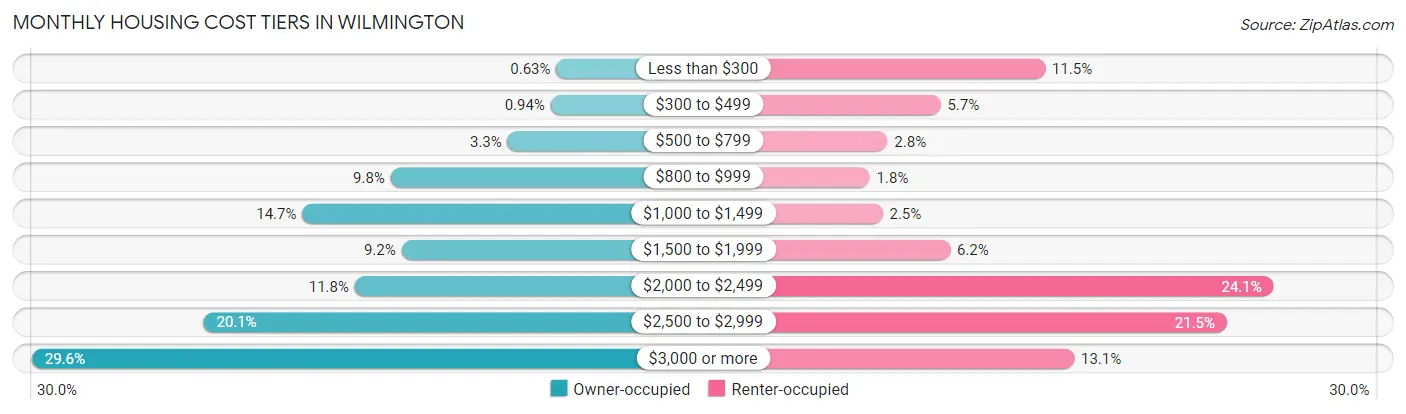
| Monthly Cost | Owner-occupied | Renter-occupied |
| Less than $300 | 43 (0.6%) | 129 (11.5%) |
| $300 to $499 | 64 (0.9%) | 64 (5.7%) |
| $500 to $799 | 226 (3.3%) | 31 (2.8%) |
| $800 to $999 | 665 (9.8%) | 20 (1.8%) |
| $1,000 to $1,499 | 997 (14.7%) | 28 (2.5%) |
| $1,500 to $1,999 | 624 (9.2%) | 70 (6.2%) |
| $2,000 to $2,499 | 800 (11.8%) | 271 (24.1%) |
| $2,500 to $2,999 | 1,368 (20.1%) | 242 (21.5%) |
| $3,000 or more | 2,013 (29.6%) | 147 (13.1%) |
| Total | 6,800 (100.0%) | 1,125 (100.0%) |
Physical Housing Characteristics in Wilmington
Housing Structures in Wilmington
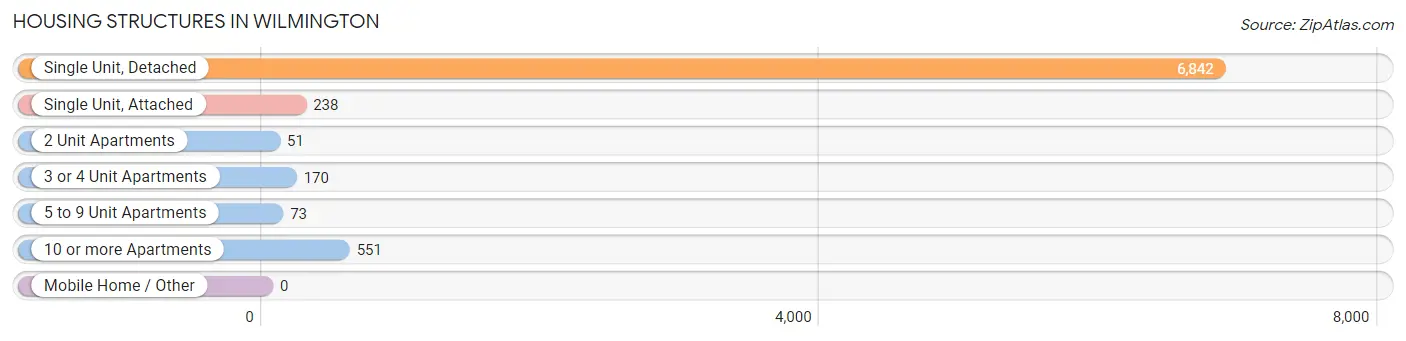
| Structure Type | # Housing Units | % Housing Units |
| Single Unit, Detached | 6,842 | 86.3% |
| Single Unit, Attached | 238 | 3.0% |
| 2 Unit Apartments | 51 | 0.6% |
| 3 or 4 Unit Apartments | 170 | 2.1% |
| 5 to 9 Unit Apartments | 73 | 0.9% |
| 10 or more Apartments | 551 | 7.0% |
| Mobile Home / Other | 0 | 0.0% |
| Total | 7,925 | 100.0% |
Housing Structures by Occupancy in Wilmington
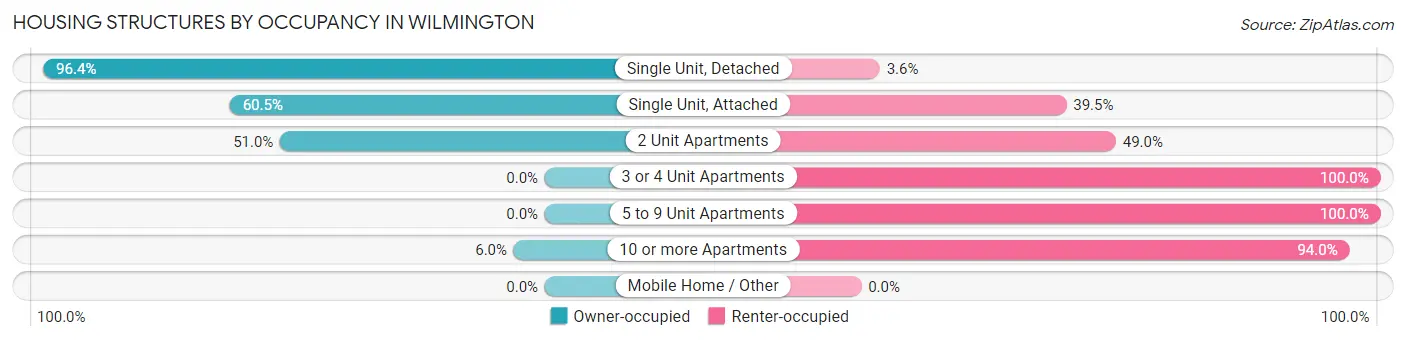
| Structure Type | Owner-occupied | Renter-occupied |
| Single Unit, Detached | 6,597 (96.4%) | 245 (3.6%) |
| Single Unit, Attached | 144 (60.5%) | 94 (39.5%) |
| 2 Unit Apartments | 26 (51.0%) | 25 (49.0%) |
| 3 or 4 Unit Apartments | 0 (0.0%) | 170 (100.0%) |
| 5 to 9 Unit Apartments | 0 (0.0%) | 73 (100.0%) |
| 10 or more Apartments | 33 (6.0%) | 518 (94.0%) |
| Mobile Home / Other | 0 (0.0%) | 0 (0.0%) |
| Total | 6,800 (85.8%) | 1,125 (14.2%) |
Housing Structures by Number of Rooms in Wilmington
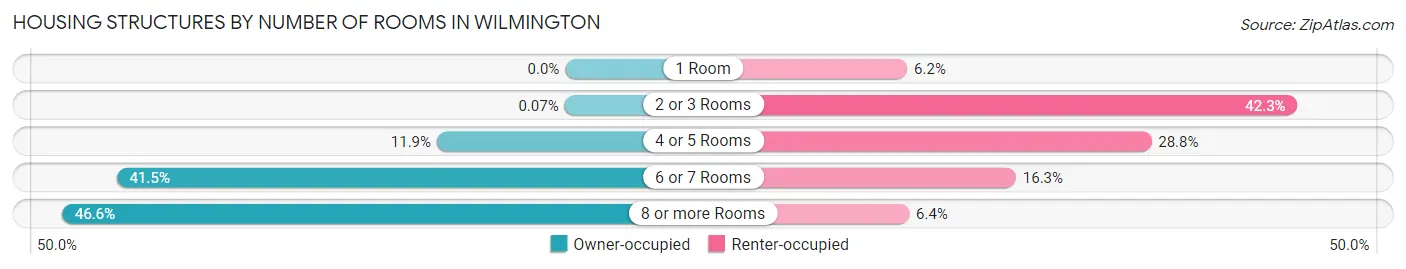
| Number of Rooms | Owner-occupied | Renter-occupied |
| 1 Room | 0 (0.0%) | 70 (6.2%) |
| 2 or 3 Rooms | 5 (0.1%) | 476 (42.3%) |
| 4 or 5 Rooms | 807 (11.9%) | 324 (28.8%) |
| 6 or 7 Rooms | 2,822 (41.5%) | 183 (16.3%) |
| 8 or more Rooms | 3,166 (46.6%) | 72 (6.4%) |
| Total | 6,800 (100.0%) | 1,125 (100.0%) |
Housing Structure by Heating Type in Wilmington
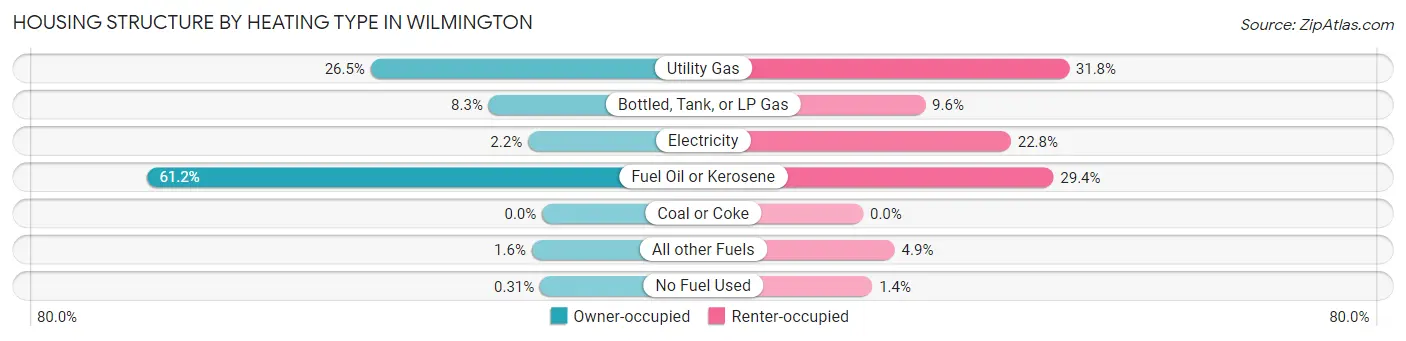
| Heating Type | Owner-occupied | Renter-occupied |
| Utility Gas | 1,802 (26.5%) | 358 (31.8%) |
| Bottled, Tank, or LP Gas | 561 (8.3%) | 108 (9.6%) |
| Electricity | 148 (2.2%) | 257 (22.8%) |
| Fuel Oil or Kerosene | 4,159 (61.2%) | 331 (29.4%) |
| Coal or Coke | 0 (0.0%) | 0 (0.0%) |
| All other Fuels | 109 (1.6%) | 55 (4.9%) |
| No Fuel Used | 21 (0.3%) | 16 (1.4%) |
| Total | 6,800 (100.0%) | 1,125 (100.0%) |
Household Vehicle Usage in Wilmington
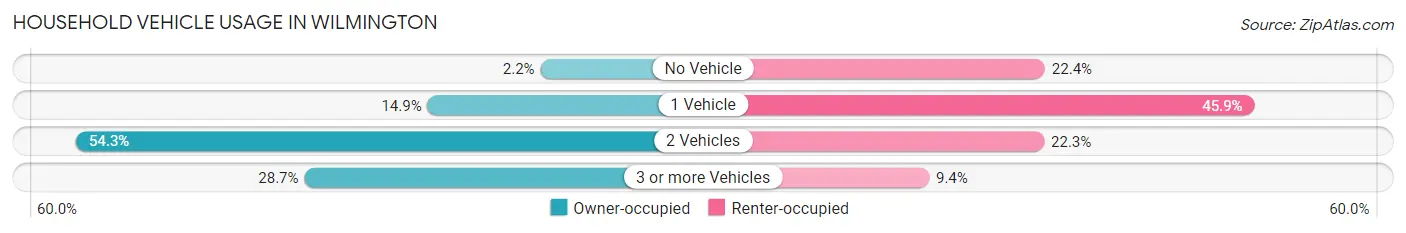
| Vehicles per Household | Owner-occupied | Renter-occupied |
| No Vehicle | 151 (2.2%) | 252 (22.4%) |
| 1 Vehicle | 1,011 (14.9%) | 516 (45.9%) |
| 2 Vehicles | 3,689 (54.2%) | 251 (22.3%) |
| 3 or more Vehicles | 1,949 (28.7%) | 106 (9.4%) |
| Total | 6,800 (100.0%) | 1,125 (100.0%) |
Real Estate & Mortgages in Wilmington
Real Estate and Mortgage Overview in Wilmington
| Characteristic | Without Mortgage | With Mortgage |
| Housing Units | 1,956 | 4,844 |
| Median Property Value | $595,900 | $622,400 |
| Median Household Income | $158,182 | $2,676 |
| Monthly Housing Costs | $1,048 | $2,013 |
| Real Estate Taxes | $7,001 | $15 |
Property Value by Mortgage Status in Wilmington
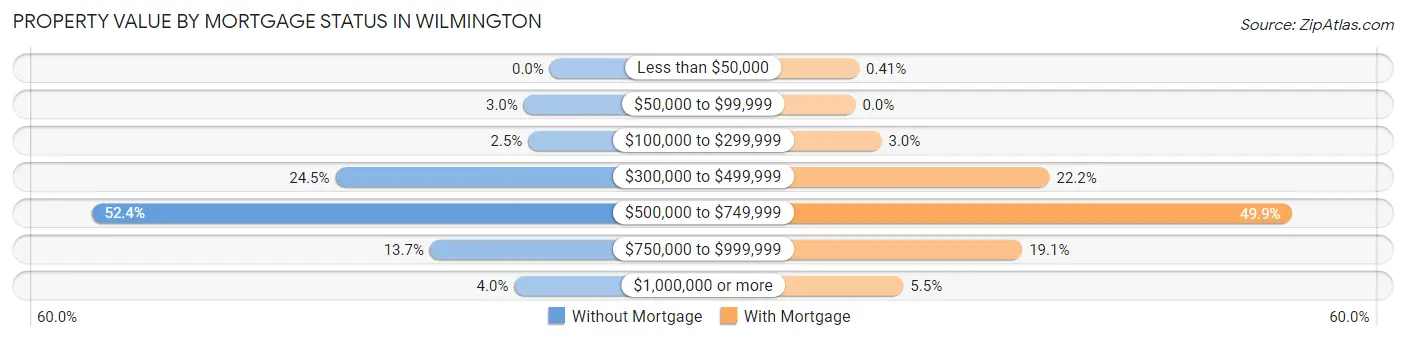
| Property Value | Without Mortgage | With Mortgage |
| Less than $50,000 | 0 (0.0%) | 20 (0.4%) |
| $50,000 to $99,999 | 58 (3.0%) | 0 (0.0%) |
| $100,000 to $299,999 | 48 (2.5%) | 144 (3.0%) |
| $300,000 to $499,999 | 479 (24.5%) | 1,074 (22.2%) |
| $500,000 to $749,999 | 1,024 (52.3%) | 2,418 (49.9%) |
| $750,000 to $999,999 | 268 (13.7%) | 923 (19.1%) |
| $1,000,000 or more | 79 (4.0%) | 265 (5.5%) |
| Total | 1,956 (100.0%) | 4,844 (100.0%) |
Household Income by Mortgage Status in Wilmington
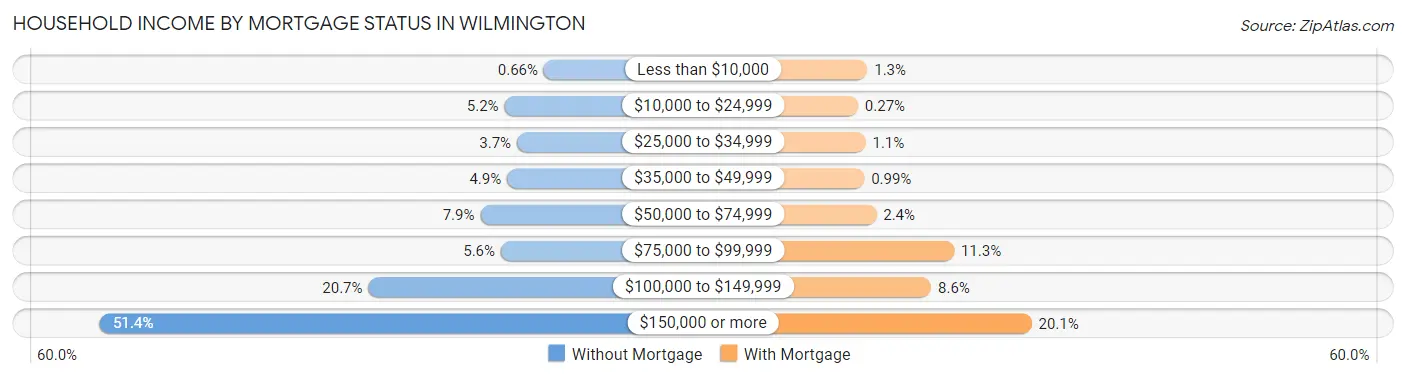
| Household Income | Without Mortgage | With Mortgage |
| Less than $10,000 | 13 (0.7%) | 65 (1.3%) |
| $10,000 to $24,999 | 101 (5.2%) | 13 (0.3%) |
| $25,000 to $34,999 | 73 (3.7%) | 55 (1.1%) |
| $35,000 to $49,999 | 95 (4.9%) | 48 (1.0%) |
| $50,000 to $74,999 | 155 (7.9%) | 115 (2.4%) |
| $75,000 to $99,999 | 109 (5.6%) | 545 (11.3%) |
| $100,000 to $149,999 | 405 (20.7%) | 418 (8.6%) |
| $150,000 or more | 1,005 (51.4%) | 974 (20.1%) |
| Total | 1,956 (100.0%) | 4,844 (100.0%) |
Property Value to Household Income Ratio in Wilmington
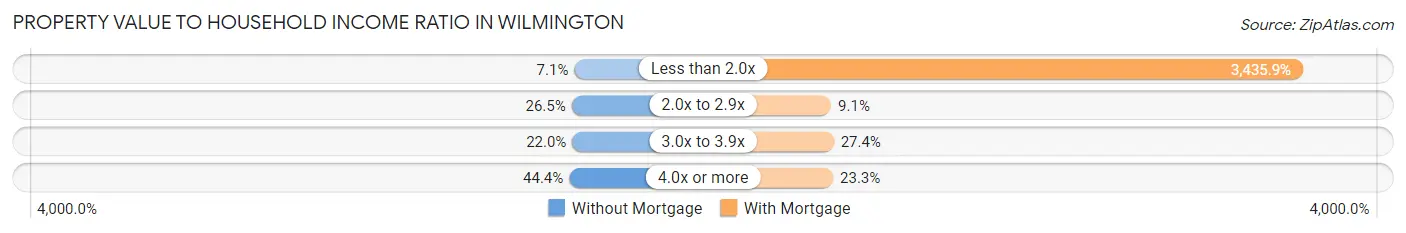
| Value-to-Income Ratio | Without Mortgage | With Mortgage |
| Less than 2.0x | 138 (7.1%) | 166,434 (3,435.9%) |
| 2.0x to 2.9x | 518 (26.5%) | 440 (9.1%) |
| 3.0x to 3.9x | 431 (22.0%) | 1,326 (27.4%) |
| 4.0x or more | 869 (44.4%) | 1,127 (23.3%) |
| Total | 1,956 (100.0%) | 4,844 (100.0%) |
Real Estate Taxes by Mortgage Status in Wilmington
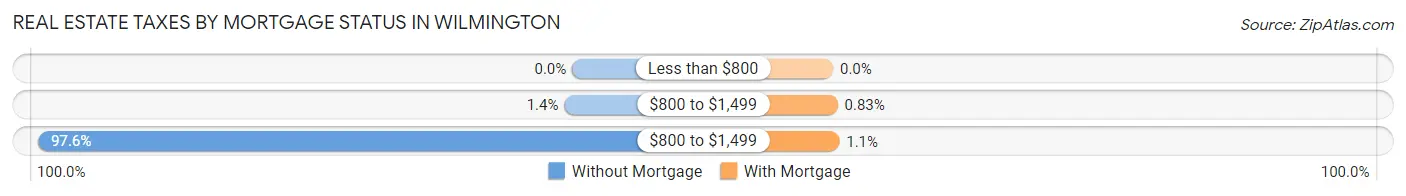
| Property Taxes | Without Mortgage | With Mortgage |
| Less than $800 | 0 (0.0%) | 0 (0.0%) |
| $800 to $1,499 | 28 (1.4%) | 40 (0.8%) |
| $800 to $1,499 | 1,908 (97.6%) | 55 (1.1%) |
| Total | 1,956 (100.0%) | 4,844 (100.0%) |
Health & Disability in Wilmington
Health Insurance Coverage by Age in Wilmington
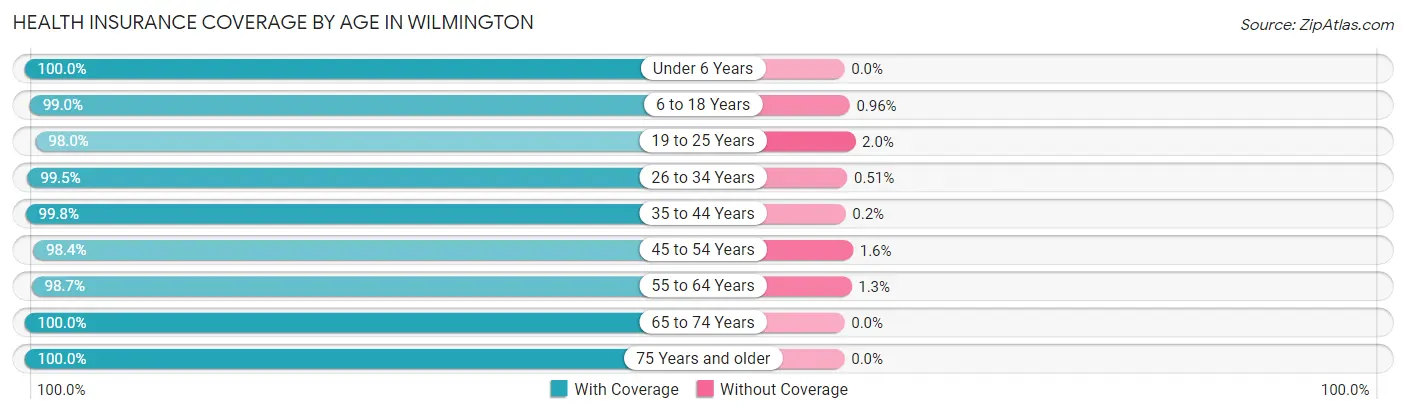
| Age Bracket | With Coverage | Without Coverage |
| Under 6 Years | 1,486 (100.0%) | 0 (0.0%) |
| 6 to 18 Years | 4,113 (99.0%) | 40 (1.0%) |
| 19 to 25 Years | 1,700 (98.0%) | 35 (2.0%) |
| 26 to 34 Years | 1,949 (99.5%) | 10 (0.5%) |
| 35 to 44 Years | 2,942 (99.8%) | 6 (0.2%) |
| 45 to 54 Years | 3,367 (98.4%) | 54 (1.6%) |
| 55 to 64 Years | 3,859 (98.7%) | 51 (1.3%) |
| 65 to 74 Years | 2,012 (100.0%) | 0 (0.0%) |
| 75 Years and older | 1,326 (100.0%) | 0 (0.0%) |
| Total | 22,754 (99.2%) | 196 (0.9%) |
Health Insurance Coverage by Citizenship Status in Wilmington
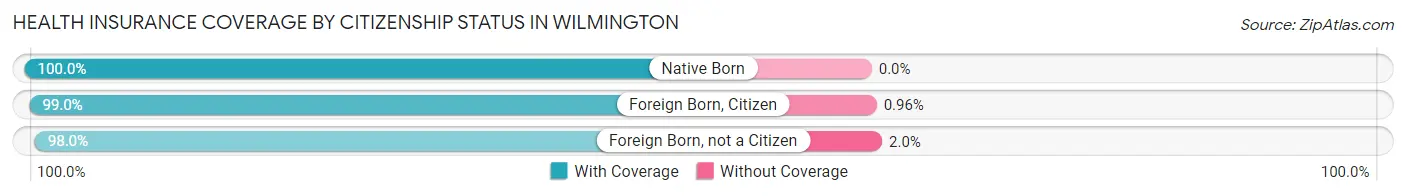
| Citizenship Status | With Coverage | Without Coverage |
| Native Born | 1,486 (100.0%) | 0 (0.0%) |
| Foreign Born, Citizen | 4,113 (99.0%) | 40 (1.0%) |
| Foreign Born, not a Citizen | 1,700 (98.0%) | 35 (2.0%) |
Health Insurance Coverage by Household Income in Wilmington
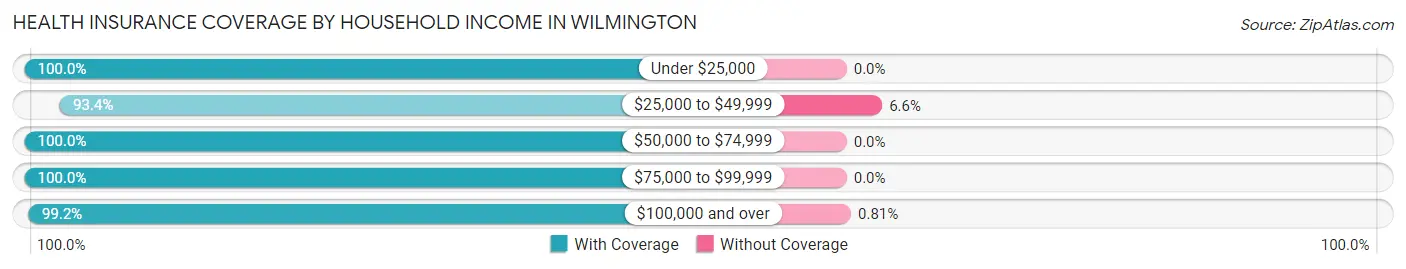
| Household Income | With Coverage | Without Coverage |
| Under $25,000 | 611 (100.0%) | 0 (0.0%) |
| $25,000 to $49,999 | 717 (93.4%) | 51 (6.6%) |
| $50,000 to $74,999 | 2,027 (100.0%) | 0 (0.0%) |
| $75,000 to $99,999 | 1,689 (100.0%) | 0 (0.0%) |
| $100,000 and over | 17,682 (99.2%) | 145 (0.8%) |
Public vs Private Health Insurance Coverage by Age in Wilmington
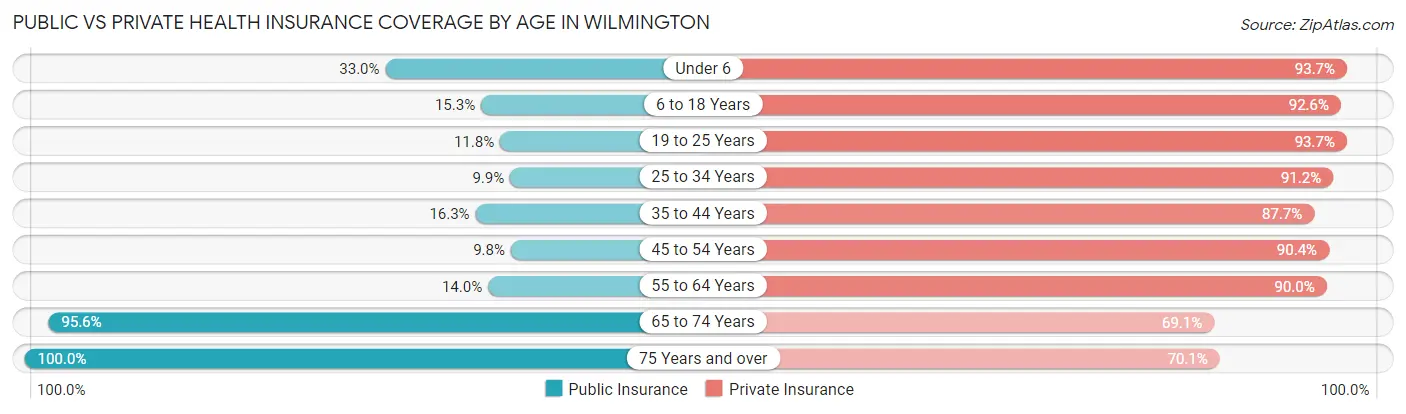
| Age Bracket | Public Insurance | Private Insurance |
| Under 6 | 491 (33.0%) | 1,393 (93.7%) |
| 6 to 18 Years | 635 (15.3%) | 3,846 (92.6%) |
| 19 to 25 Years | 204 (11.8%) | 1,626 (93.7%) |
| 25 to 34 Years | 194 (9.9%) | 1,786 (91.2%) |
| 35 to 44 Years | 481 (16.3%) | 2,584 (87.6%) |
| 45 to 54 Years | 334 (9.8%) | 3,093 (90.4%) |
| 55 to 64 Years | 547 (14.0%) | 3,518 (90.0%) |
| 65 to 74 Years | 1,923 (95.6%) | 1,390 (69.1%) |
| 75 Years and over | 1,326 (100.0%) | 930 (70.1%) |
| Total | 6,135 (26.7%) | 20,166 (87.9%) |
Disability Status by Sex by Age in Wilmington
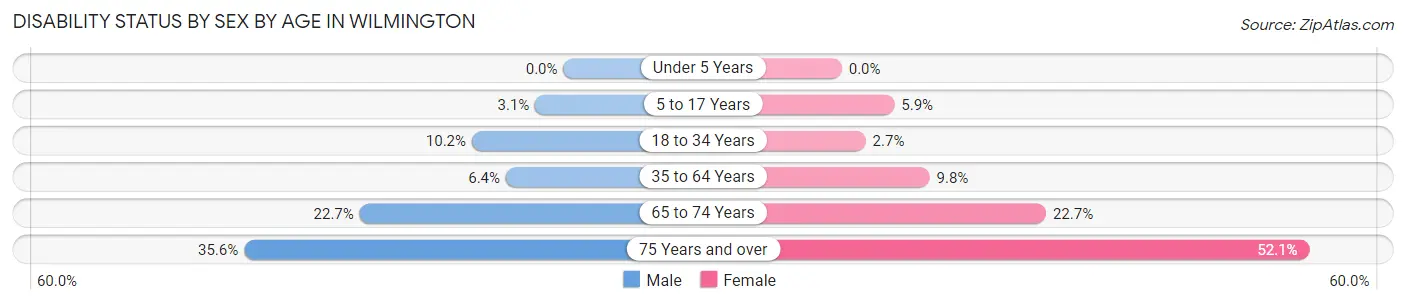
| Age Bracket | Male | Female |
| Under 5 Years | 0 (0.0%) | 0 (0.0%) |
| 5 to 17 Years | 67 (3.1%) | 94 (5.9%) |
| 18 to 34 Years | 247 (10.2%) | 48 (2.7%) |
| 35 to 64 Years | 325 (6.4%) | 509 (9.8%) |
| 65 to 74 Years | 201 (22.7%) | 256 (22.7%) |
| 75 Years and over | 266 (35.6%) | 301 (52.1%) |
Disability Class by Sex by Age in Wilmington
Disability Class: Hearing Difficulty
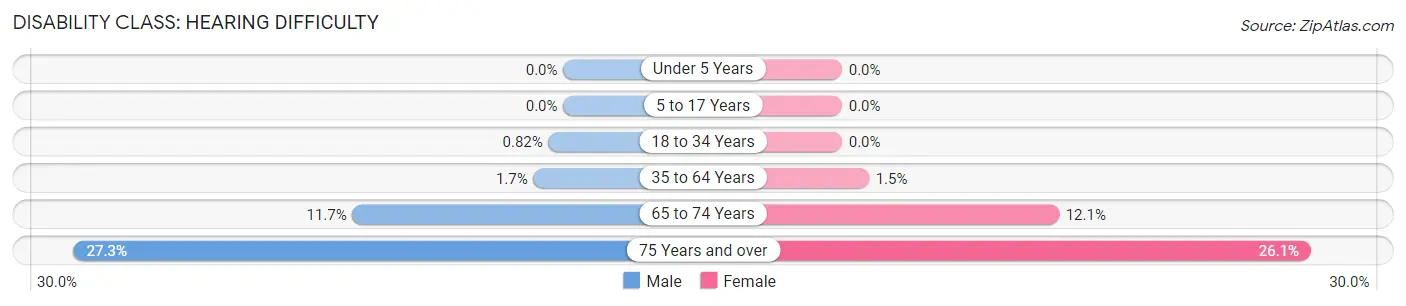
| Age Bracket | Male | Female |
| Under 5 Years | 0 (0.0%) | 0 (0.0%) |
| 5 to 17 Years | 0 (0.0%) | 0 (0.0%) |
| 18 to 34 Years | 20 (0.8%) | 0 (0.0%) |
| 35 to 64 Years | 84 (1.7%) | 78 (1.5%) |
| 65 to 74 Years | 104 (11.7%) | 136 (12.1%) |
| 75 Years and over | 204 (27.3%) | 151 (26.1%) |
Disability Class: Vision Difficulty
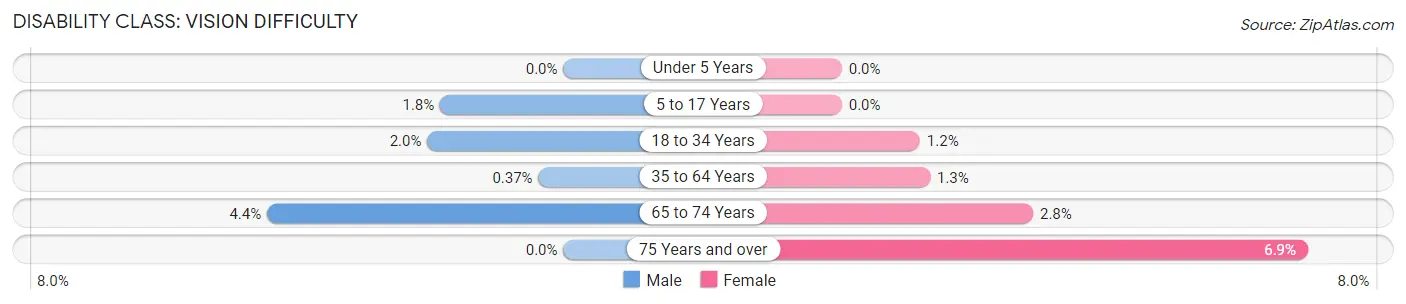
| Age Bracket | Male | Female |
| Under 5 Years | 0 (0.0%) | 0 (0.0%) |
| 5 to 17 Years | 39 (1.8%) | 0 (0.0%) |
| 18 to 34 Years | 49 (2.0%) | 21 (1.2%) |
| 35 to 64 Years | 19 (0.4%) | 68 (1.3%) |
| 65 to 74 Years | 39 (4.4%) | 32 (2.8%) |
| 75 Years and over | 0 (0.0%) | 40 (6.9%) |
Disability Class: Cognitive Difficulty
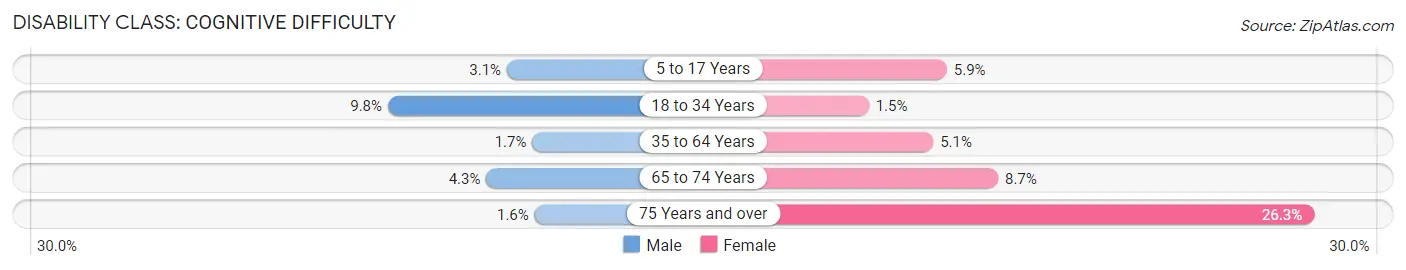
| Age Bracket | Male | Female |
| 5 to 17 Years | 67 (3.1%) | 94 (5.9%) |
| 18 to 34 Years | 237 (9.8%) | 27 (1.5%) |
| 35 to 64 Years | 88 (1.7%) | 265 (5.1%) |
| 65 to 74 Years | 38 (4.3%) | 98 (8.7%) |
| 75 Years and over | 12 (1.6%) | 152 (26.3%) |
Disability Class: Ambulatory Difficulty
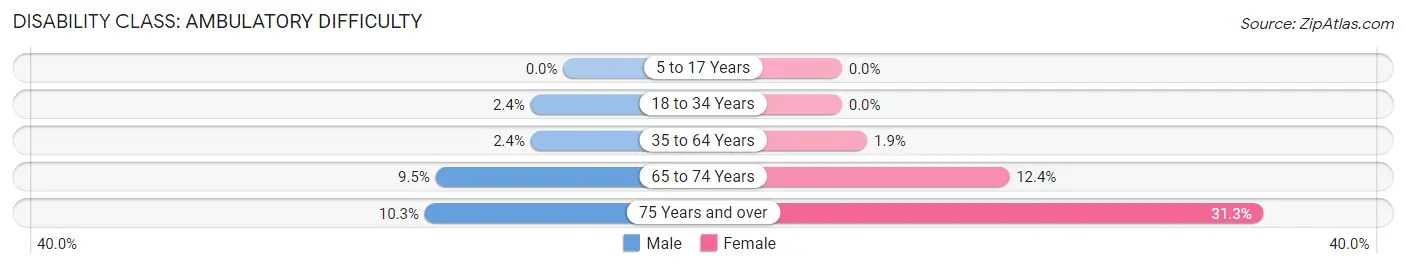
| Age Bracket | Male | Female |
| 5 to 17 Years | 0 (0.0%) | 0 (0.0%) |
| 18 to 34 Years | 59 (2.4%) | 0 (0.0%) |
| 35 to 64 Years | 123 (2.4%) | 98 (1.9%) |
| 65 to 74 Years | 84 (9.5%) | 140 (12.4%) |
| 75 Years and over | 77 (10.3%) | 181 (31.3%) |
Disability Class: Self-Care Difficulty
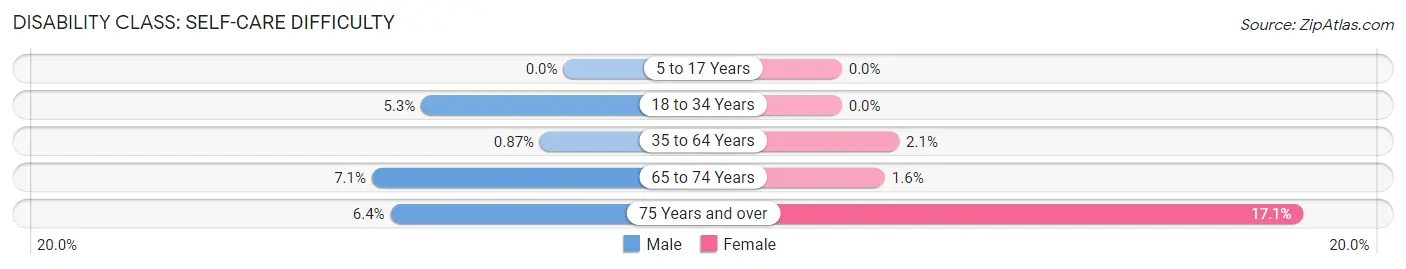
| Age Bracket | Male | Female |
| 5 to 17 Years | 0 (0.0%) | 0 (0.0%) |
| 18 to 34 Years | 128 (5.3%) | 0 (0.0%) |
| 35 to 64 Years | 44 (0.9%) | 111 (2.1%) |
| 65 to 74 Years | 63 (7.1%) | 18 (1.6%) |
| 75 Years and over | 48 (6.4%) | 99 (17.1%) |
Technology Access in Wilmington
Computing Device Access in Wilmington
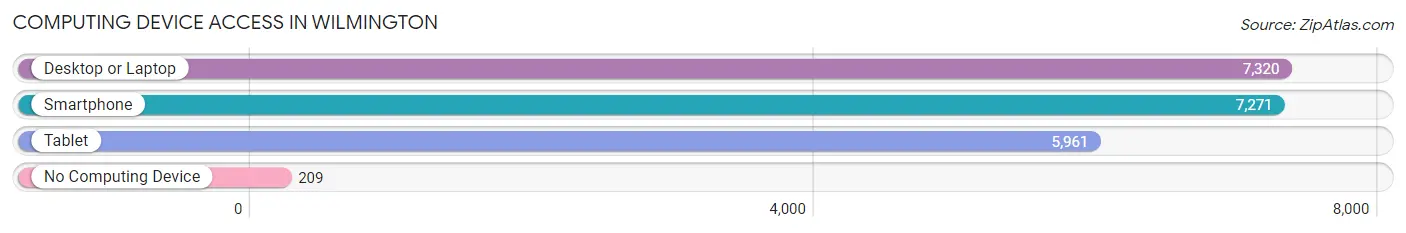
| Device Type | # Households | % Households |
| Desktop or Laptop | 7,320 | 92.4% |
| Smartphone | 7,271 | 91.7% |
| Tablet | 5,961 | 75.2% |
| No Computing Device | 209 | 2.6% |
| Total | 7,925 | 100.0% |
Internet Access in Wilmington
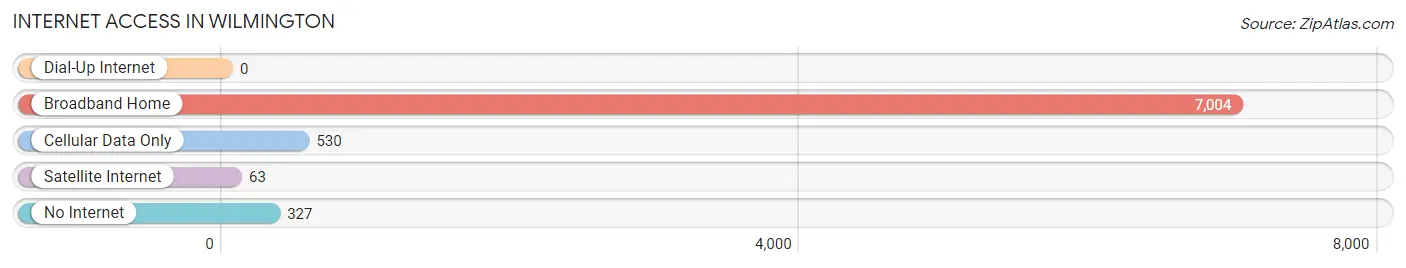
| Internet Type | # Households | % Households |
| Dial-Up Internet | 0 | 0.0% |
| Broadband Home | 7,004 | 88.4% |
| Cellular Data Only | 530 | 6.7% |
| Satellite Internet | 63 | 0.8% |
| No Internet | 327 | 4.1% |
| Total | 7,925 | 100.0% |
Wilmington Summary
Wilmington, Massachusetts is a town located in Middlesex County, Massachusetts, United States. It is located approximately 22 miles north of Boston and is part of the Greater Boston metropolitan area. The town was incorporated in 1730 and is home to a population of 22,325 as of the 2010 census.
History
The area that is now Wilmington was originally inhabited by the Pawtucket Indians, a tribe of the Massachusett people. The first European settlers arrived in the area in 1665 and the town was officially incorporated in 1730. The town was named after Spencer Compton, the Earl of Wilmington, who was a friend of the first settlers.
In the late 18th century, Wilmington was a major center for the production of shoes and leather goods. The town was also home to several mills, including a paper mill, a grist mill, and a saw mill. The town was also home to a number of farms, which provided food for the local population.
In the 19th century, Wilmington became a popular summer resort destination for wealthy Bostonians. The town was home to several large estates, including the estate of John Winthrop, the first governor of the Massachusetts Bay Colony.
Geography
Wilmington is located in eastern Massachusetts, approximately 22 miles north of Boston. The town is bordered by the towns of Woburn to the north, Reading to the east, North Reading to the southeast, and Billerica to the south. The town is also bordered by the Merrimack River to the west.
The town has a total area of 15.2 square miles, of which 14.9 square miles is land and 0.3 square miles is water. The town is located in the Merrimack Valley region of Massachusetts and is part of the Greater Boston metropolitan area.
Economy
Wilmington is home to a number of businesses and industries. The town is home to several large companies, including Raytheon, a defense contractor, and EMC Corporation, a data storage company. The town is also home to a number of smaller businesses, including several restaurants, retail stores, and professional services.
The town is also home to a number of manufacturing companies, including a paper mill, a printing company, and a plastics manufacturer. The town is also home to a number of technology companies, including a software company and a telecommunications company.
Demographics
As of the 2010 census, there were 22,325 people, 8,541 households, and 6,072 families residing in the town. The population density was 1,491.3 people per square mile. The racial makeup of the town was 94.2% White, 1.3% African American, 0.3% Native American, 2.2% Asian, 0.1% Pacific Islander, 0.7% from other races, and 1.4% from two or more races. Hispanic or Latino of any race were 2.7% of the population.
The median income for a household in the town was $81,837 and the median income for a family was $97,917. The per capita income for the town was $37,945. About 2.7% of families and 3.7% of the population were below the poverty line, including 4.2% of those under age 18 and 4.2% of those age 65 or over.
Common Questions
What is Per Capita Income in Wilmington?
Per Capita income in Wilmington is $58,224.
What is the Median Family Income in Wilmington?
Median Family Income in Wilmington is $175,094.
What is the Median Household income in Wilmington?
Median Household Income in Wilmington is $151,034.
What is Income or Wage Gap in Wilmington?
Income or Wage Gap in Wilmington is 25.7%.
Women in Wilmington earn 74.3 cents for every dollar earned by a man.
What is Inequality or Gini Index in Wilmington?
Inequality or Gini Index in Wilmington is 0.37.
What is the Total Population of Wilmington?
Total Population of Wilmington is 23,191.
What is the Total Male Population of Wilmington?
Total Male Population of Wilmington is 12,154.
What is the Total Female Population of Wilmington?
Total Female Population of Wilmington is 11,037.
What is the Ratio of Males per 100 Females in Wilmington?
There are 110.12 Males per 100 Females in Wilmington.
What is the Ratio of Females per 100 Males in Wilmington?
There are 90.81 Females per 100 Males in Wilmington.
What is the Median Population Age in Wilmington?
Median Population Age in Wilmington is 42.1 Years.
What is the Average Family Size in Wilmington
Average Family Size in Wilmington is 3.3 People.
What is the Average Household Size in Wilmington
Average Household Size in Wilmington is 2.9 People.
How Large is the Labor Force in Wilmington?
There are 13,474 People in the Labor Forcein in Wilmington.
What is the Percentage of People in the Labor Force in Wilmington?
71.9% of People are in the Labor Force in Wilmington.
What is the Unemployment Rate in Wilmington?
Unemployment Rate in Wilmington is 4.4%.