Mchenry, IL Map & Demographics
Mchenry Map
Mchenry Overview
$45,241
PER CAPITA INCOME
$112,024
AVG FAMILY INCOME
$83,651
AVG HOUSEHOLD INCOME
34.3%
WAGE / INCOME GAP [ % ]
65.7¢/ $1
WAGE / INCOME GAP [ $ ]
0.41
INEQUALITY / GINI INDEX
27,493
TOTAL POPULATION
13,525
MALE POPULATION
13,968
FEMALE POPULATION
96.83
MALES / 100 FEMALES
103.28
FEMALES / 100 MALES
43.1
MEDIAN AGE
3.0
AVG FAMILY SIZE
2.4
AVG HOUSEHOLD SIZE
15,776
LABOR FORCE [ PEOPLE ]
69.9%
PERCENT IN LABOR FORCE
4.3%
UNEMPLOYMENT RATE
Income in Mchenry
Income Overview in Mchenry
Per Capita Income in Mchenry is $45,241, while median incomes of families and households are $112,024 and $83,651 respectively.
| Characteristic | Number | Measure |
| Per Capita Income | 27,493 | $45,241 |
| Median Family Income | 7,372 | $112,024 |
| Mean Family Income | 7,372 | $131,060 |
| Median Household Income | 11,228 | $83,651 |
| Mean Household Income | 11,228 | $108,433 |
| Income Deficit | 7,372 | $0 |
| Wage / Income Gap (%) | 27,493 | 34.34% |
| Wage / Income Gap ($) | 27,493 | 65.66¢ per $1 |
| Gini / Inequality Index | 27,493 | 0.41 |
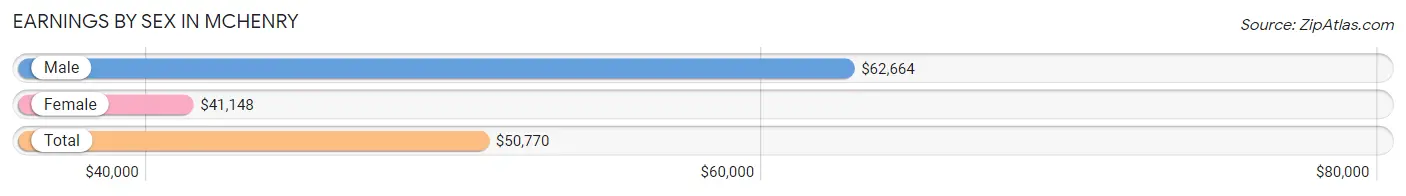
Earnings by Sex in Mchenry
Average Earnings in Mchenry are $50,770, $62,664 for men and $41,148 for women, a difference of 34.3%.
| Sex | Number | Average Earnings |
| Male | 8,536 (53.1%) | $62,664 |
| Female | 7,543 (46.9%) | $41,148 |
| Total | 16,079 (100.0%) | $50,770 |
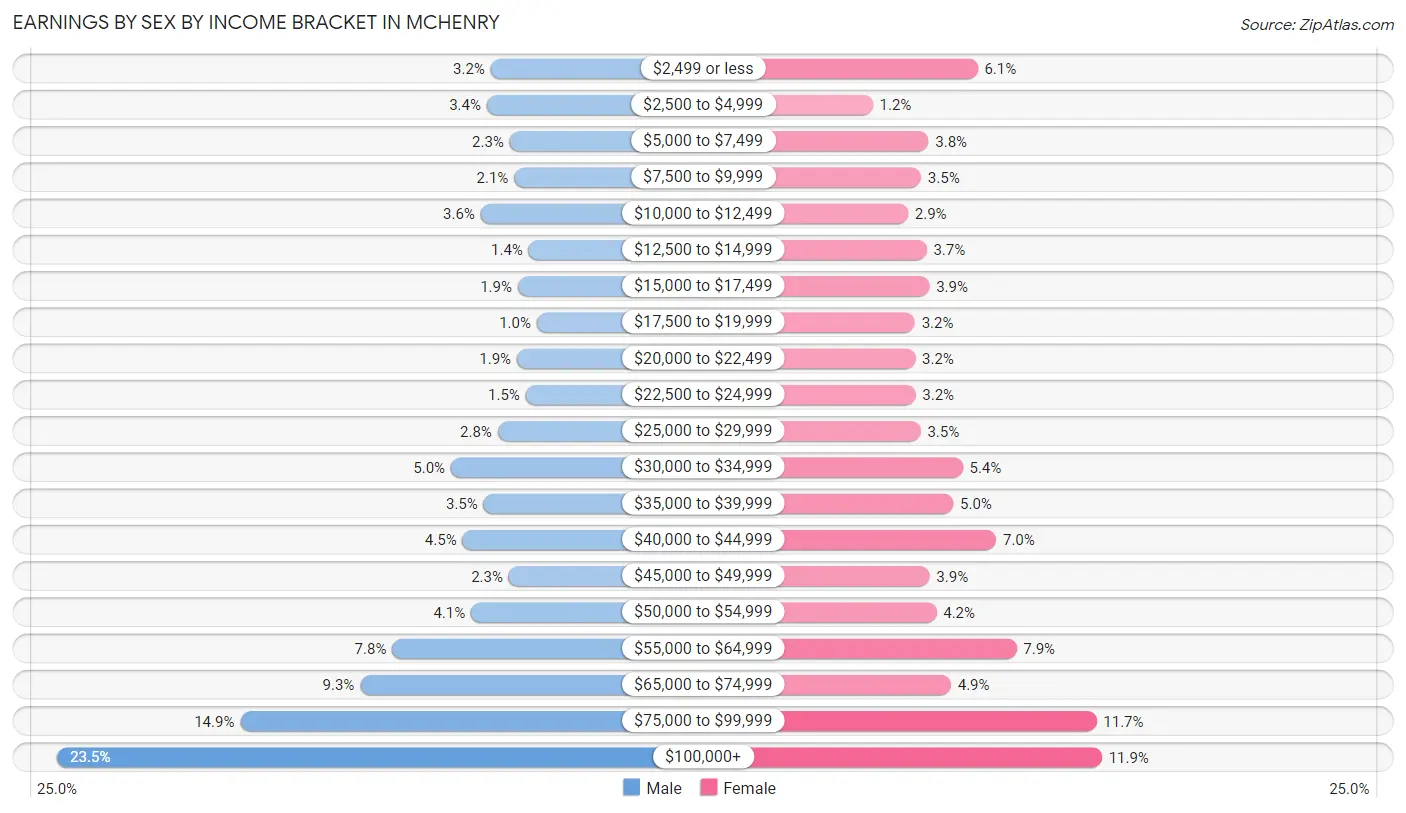
Earnings by Sex by Income Bracket in Mchenry
The most common earnings brackets in Mchenry are $100,000+ for men (2,004 | 23.5%) and $100,000+ for women (901 | 11.9%).
| Income | Male | Female |
| $2,499 or less | 271 (3.2%) | 462 (6.1%) |
| $2,500 to $4,999 | 286 (3.4%) | 91 (1.2%) |
| $5,000 to $7,499 | 195 (2.3%) | 288 (3.8%) |
| $7,500 to $9,999 | 177 (2.1%) | 262 (3.5%) |
| $10,000 to $12,499 | 311 (3.6%) | 216 (2.9%) |
| $12,500 to $14,999 | 119 (1.4%) | 281 (3.7%) |
| $15,000 to $17,499 | 162 (1.9%) | 291 (3.9%) |
| $17,500 to $19,999 | 86 (1.0%) | 240 (3.2%) |
| $20,000 to $22,499 | 166 (1.9%) | 241 (3.2%) |
| $22,500 to $24,999 | 131 (1.5%) | 242 (3.2%) |
| $25,000 to $29,999 | 242 (2.8%) | 260 (3.5%) |
| $30,000 to $34,999 | 429 (5.0%) | 409 (5.4%) |
| $35,000 to $39,999 | 299 (3.5%) | 376 (5.0%) |
| $40,000 to $44,999 | 383 (4.5%) | 527 (7.0%) |
| $45,000 to $49,999 | 198 (2.3%) | 292 (3.9%) |
| $50,000 to $54,999 | 349 (4.1%) | 316 (4.2%) |
| $55,000 to $64,999 | 664 (7.8%) | 599 (7.9%) |
| $65,000 to $74,999 | 792 (9.3%) | 367 (4.9%) |
| $75,000 to $99,999 | 1,272 (14.9%) | 882 (11.7%) |
| $100,000+ | 2,004 (23.5%) | 901 (11.9%) |
| Total | 8,536 (100.0%) | 7,543 (100.0%) |
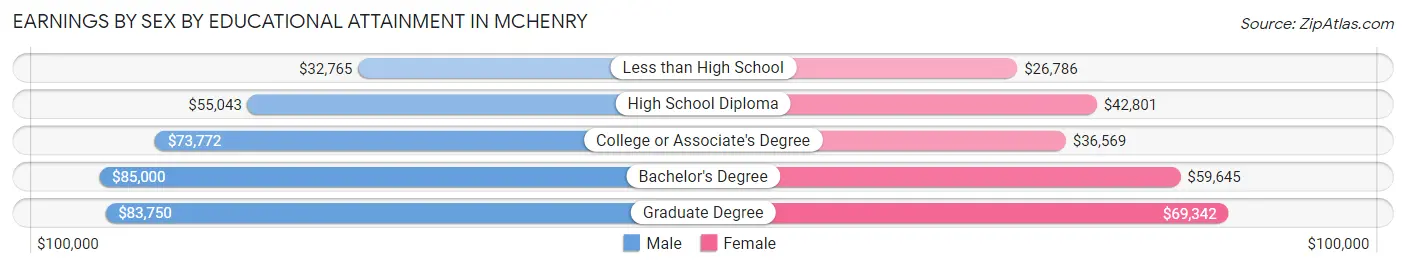
Earnings by Sex by Educational Attainment in Mchenry
Average earnings in Mchenry are $69,692 for men and $45,423 for women, a difference of 34.8%. Men with an educational attainment of bachelor's degree enjoy the highest average annual earnings of $85,000, while those with less than high school education earn the least with $32,765. Women with an educational attainment of graduate degree earn the most with the average annual earnings of $69,342, while those with less than high school education have the smallest earnings of $26,786.
| Educational Attainment | Male Income | Female Income |
| Less than High School | $32,765 | $26,786 |
| High School Diploma | $55,043 | $42,801 |
| College or Associate's Degree | $73,772 | $36,569 |
| Bachelor's Degree | $85,000 | $59,645 |
| Graduate Degree | $83,750 | $69,342 |
| Total | $69,692 | $45,423 |
Family Income in Mchenry
Family Income Brackets in Mchenry
According to the Mchenry family income data, there are 1,843 families falling into the $100,000 to $149,999 income range, which is the most common income bracket and makes up 25.0% of all families. Conversely, the less than $10,000 income bracket is the least frequent group with only 44 families (0.6%) belonging to this category.
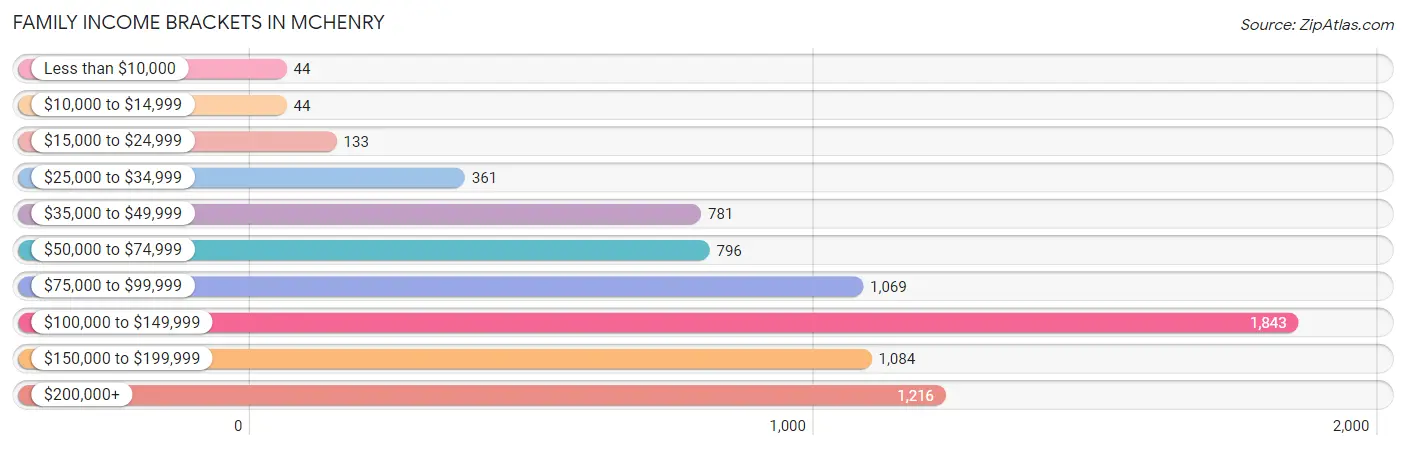
| Income Bracket | # Families | % Families |
| Less than $10,000 | 44 | 0.6% |
| $10,000 to $14,999 | 44 | 0.6% |
| $15,000 to $24,999 | 133 | 1.8% |
| $25,000 to $34,999 | 361 | 4.9% |
| $35,000 to $49,999 | 781 | 10.6% |
| $50,000 to $74,999 | 796 | 10.8% |
| $75,000 to $99,999 | 1,069 | 14.5% |
| $100,000 to $149,999 | 1,843 | 25.0% |
| $150,000 to $199,999 | 1,084 | 14.7% |
| $200,000+ | 1,216 | 16.5% |
Family Income by Famaliy Size in Mchenry
5-person families (363 | 4.9%) account for the highest median family income in Mchenry with $152,639 per family, while 2-person families (3,603 | 48.9%) have the highest median income of $46,170 per family member.
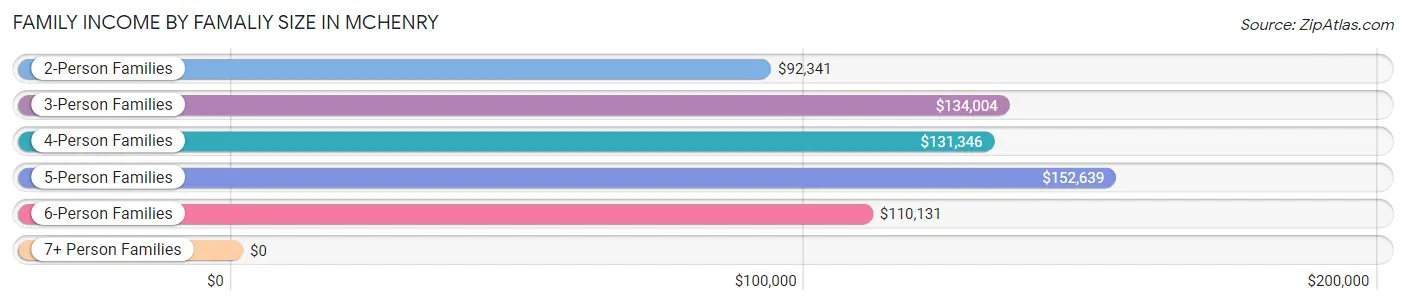
| Income Bracket | # Families | Median Income |
| 2-Person Families | 3,603 (48.9%) | $92,341 |
| 3-Person Families | 1,532 (20.8%) | $134,004 |
| 4-Person Families | 1,576 (21.4%) | $131,346 |
| 5-Person Families | 363 (4.9%) | $152,639 |
| 6-Person Families | 243 (3.3%) | $110,131 |
| 7+ Person Families | 55 (0.7%) | $0 |
| Total | 7,372 (100.0%) | $112,024 |
Family Income by Number of Earners in Mchenry
The median family income in Mchenry is $112,024, with families comprising 3+ earners (1,215) having the highest median family income of $139,886, while families with no earners (788) have the lowest median family income of $64,191, accounting for 16.5% and 10.7% of families, respectively.
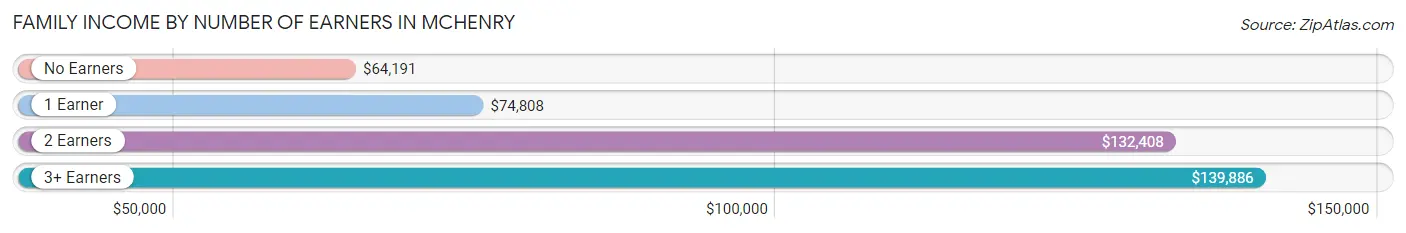
| Number of Earners | # Families | Median Income |
| No Earners | 788 (10.7%) | $64,191 |
| 1 Earner | 2,130 (28.9%) | $74,808 |
| 2 Earners | 3,239 (43.9%) | $132,408 |
| 3+ Earners | 1,215 (16.5%) | $139,886 |
| Total | 7,372 (100.0%) | $112,024 |
Household Income in Mchenry
Household Income Brackets in Mchenry
With 2,291 households falling in the category, the $100,000 to $149,999 income range is the most frequent in Mchenry, accounting for 20.4% of all households. In contrast, only 146 households (1.3%) fall into the less than $10,000 income bracket, making it the least populous group.
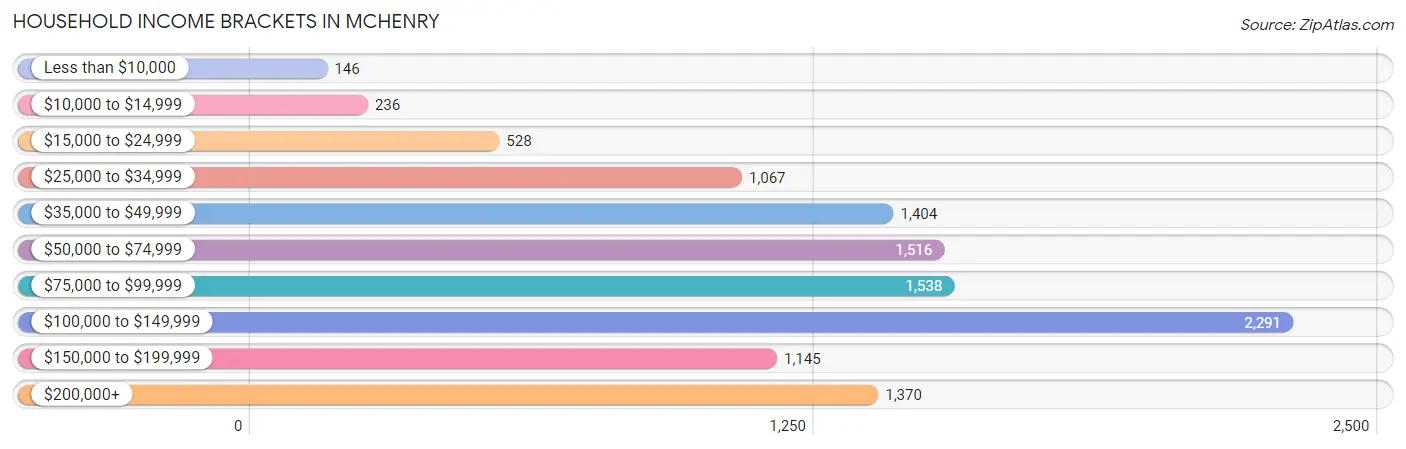
| Income Bracket | # Households | % Households |
| Less than $10,000 | 146 | 1.3% |
| $10,000 to $14,999 | 236 | 2.1% |
| $15,000 to $24,999 | 528 | 4.7% |
| $25,000 to $34,999 | 1,067 | 9.5% |
| $35,000 to $49,999 | 1,404 | 12.5% |
| $50,000 to $74,999 | 1,516 | 13.5% |
| $75,000 to $99,999 | 1,538 | 13.7% |
| $100,000 to $149,999 | 2,291 | 20.4% |
| $150,000 to $199,999 | 1,145 | 10.2% |
| $200,000+ | 1,370 | 12.2% |
Household Income by Householder Age in Mchenry
The median household income in Mchenry is $83,651, with the highest median household income of $106,778 found in the 45 to 64 years age bracket for the primary householder. A total of 4,451 households (39.6%) fall into this category. Meanwhile, the 15 to 24 years age bracket for the primary householder has the lowest median household income of $48,214, with 106 households (0.9%) in this group.
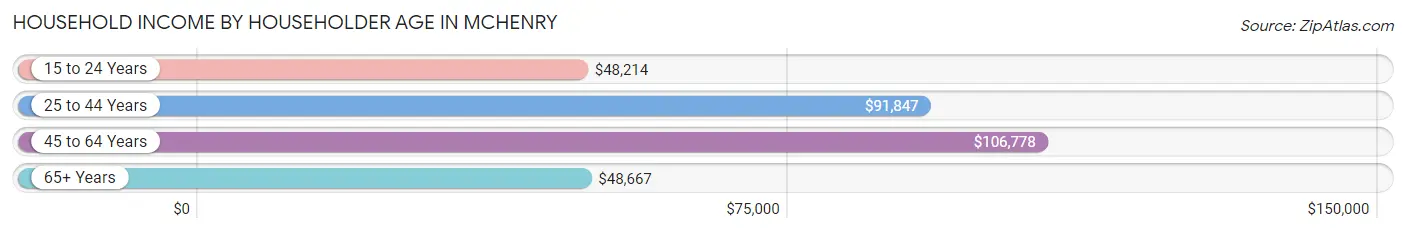
| Income Bracket | # Households | Median Income |
| 15 to 24 Years | 106 (0.9%) | $48,214 |
| 25 to 44 Years | 3,505 (31.2%) | $91,847 |
| 45 to 64 Years | 4,451 (39.6%) | $106,778 |
| 65+ Years | 3,166 (28.2%) | $48,667 |
| Total | 11,228 (100.0%) | $83,651 |
Poverty in Mchenry
Income Below Poverty by Sex and Age in Mchenry
With 4.7% poverty level for males and 3.2% for females among the residents of Mchenry, 12 to 14 year old males and 6 to 11 year old females are the most vulnerable to poverty, with 66 males (15.1%) and 120 females (12.5%) in their respective age groups living below the poverty level.
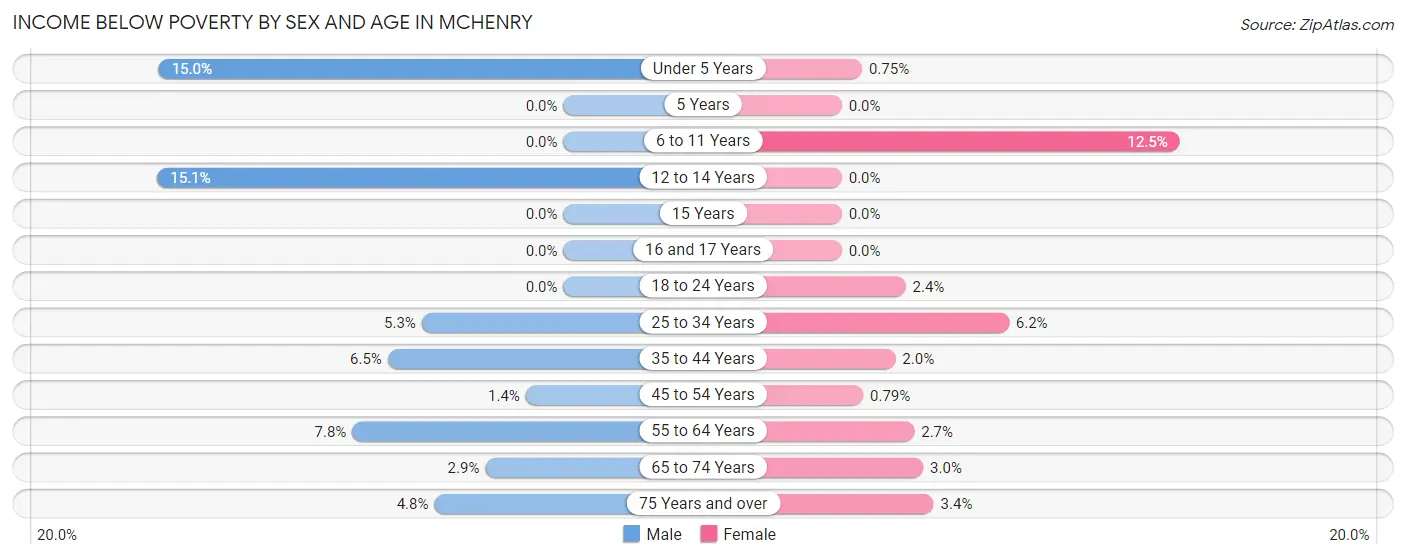
| Age Bracket | Male | Female |
| Under 5 Years | 99 (15.0%) | 6 (0.7%) |
| 5 Years | 0 (0.0%) | 0 (0.0%) |
| 6 to 11 Years | 0 (0.0%) | 120 (12.5%) |
| 12 to 14 Years | 66 (15.1%) | 0 (0.0%) |
| 15 Years | 0 (0.0%) | 0 (0.0%) |
| 16 and 17 Years | 0 (0.0%) | 0 (0.0%) |
| 18 to 24 Years | 0 (0.0%) | 20 (2.4%) |
| 25 to 34 Years | 87 (5.3%) | 102 (6.2%) |
| 35 to 44 Years | 128 (6.5%) | 38 (2.0%) |
| 45 to 54 Years | 26 (1.4%) | 15 (0.8%) |
| 55 to 64 Years | 153 (7.8%) | 54 (2.7%) |
| 65 to 74 Years | 43 (2.9%) | 42 (3.0%) |
| 75 Years and over | 31 (4.8%) | 45 (3.4%) |
| Total | 633 (4.7%) | 442 (3.2%) |
Income Above Poverty by Sex and Age in Mchenry
According to the poverty statistics in Mchenry, males aged 5 years and females aged 5 years are the age groups that are most secure financially, with 100.0% of males and 100.0% of females in these age groups living above the poverty line.
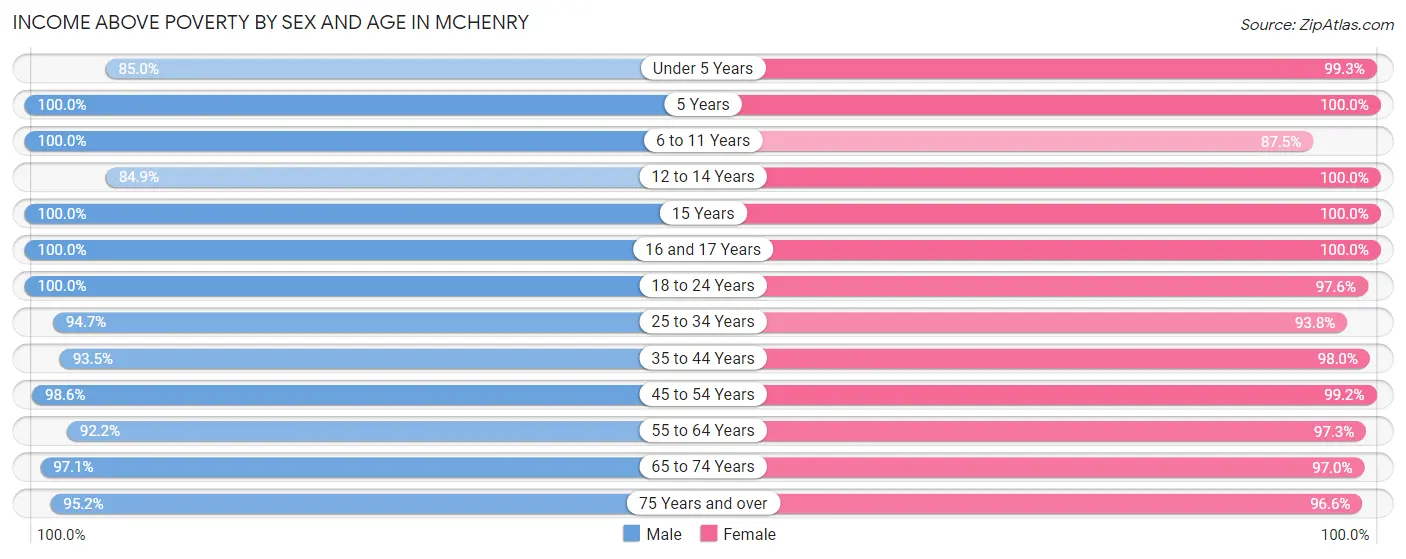
| Age Bracket | Male | Female |
| Under 5 Years | 560 (85.0%) | 797 (99.3%) |
| 5 Years | 171 (100.0%) | 46 (100.0%) |
| 6 to 11 Years | 896 (100.0%) | 837 (87.5%) |
| 12 to 14 Years | 372 (84.9%) | 363 (100.0%) |
| 15 Years | 252 (100.0%) | 273 (100.0%) |
| 16 and 17 Years | 320 (100.0%) | 301 (100.0%) |
| 18 to 24 Years | 1,165 (100.0%) | 824 (97.6%) |
| 25 to 34 Years | 1,566 (94.7%) | 1,544 (93.8%) |
| 35 to 44 Years | 1,835 (93.5%) | 1,868 (98.0%) |
| 45 to 54 Years | 1,830 (98.6%) | 1,881 (99.2%) |
| 55 to 64 Years | 1,799 (92.2%) | 1,951 (97.3%) |
| 65 to 74 Years | 1,440 (97.1%) | 1,348 (97.0%) |
| 75 Years and over | 616 (95.2%) | 1,275 (96.6%) |
| Total | 12,822 (95.3%) | 13,308 (96.8%) |
Income Below Poverty Among Married-Couple Families in Mchenry
The poverty statistics for married-couple families in Mchenry show that 1.0% or 61 of the total 6,054 families live below the poverty line. Families with 3 or 4 children have the highest poverty rate of 3.8%, comprising of 12 families. On the other hand, families with no children have the lowest poverty rate of 0.7%, which includes 28 families.
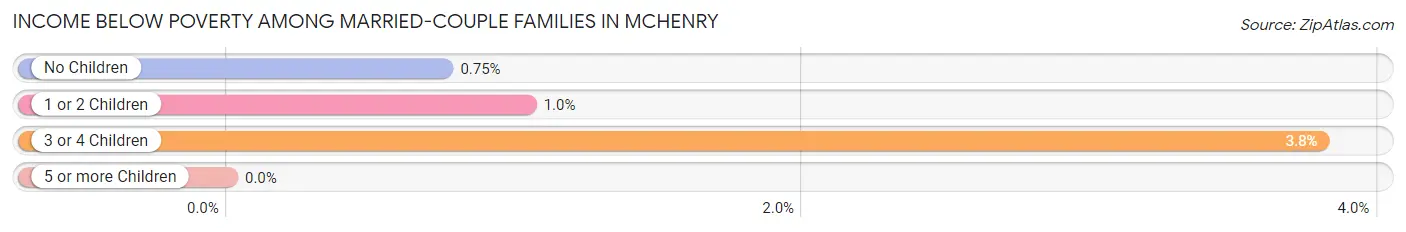
| Children | Above Poverty | Below Poverty |
| No Children | 3,696 (99.3%) | 28 (0.7%) |
| 1 or 2 Children | 1,993 (99.0%) | 21 (1.0%) |
| 3 or 4 Children | 304 (96.2%) | 12 (3.8%) |
| 5 or more Children | 0 (0.0%) | 0 (0.0%) |
| Total | 5,993 (99.0%) | 61 (1.0%) |
Income Below Poverty Among Single-Parent Households in Mchenry
According to the poverty data in Mchenry, 5.2% or 20 single-father households and 3.8% or 35 single-mother households are living below the poverty line. Among single-father households, those with 1 or 2 children have the highest poverty rate, with 13 households (7.3%) experiencing poverty. Likewise, among single-mother households, those with 1 or 2 children have the highest poverty rate, with 35 households (5.9%) falling below the poverty line.
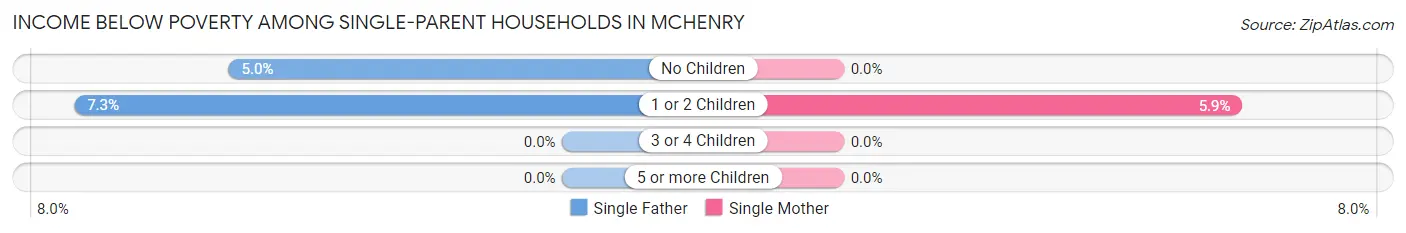
| Children | Single Father | Single Mother |
| No Children | 7 (5.0%) | 0 (0.0%) |
| 1 or 2 Children | 13 (7.3%) | 35 (5.9%) |
| 3 or 4 Children | 0 (0.0%) | 0 (0.0%) |
| 5 or more Children | 0 (0.0%) | 0 (0.0%) |
| Total | 20 (5.2%) | 35 (3.8%) |
Income Below Poverty Among Married-Couple vs Single-Parent Households in Mchenry
The poverty data for Mchenry shows that 61 of the married-couple family households (1.0%) and 55 of the single-parent households (4.2%) are living below the poverty level. Within the married-couple family households, those with 3 or 4 children have the highest poverty rate, with 12 households (3.8%) falling below the poverty line. Among the single-parent households, those with 1 or 2 children have the highest poverty rate, with 48 household (6.2%) living below poverty.
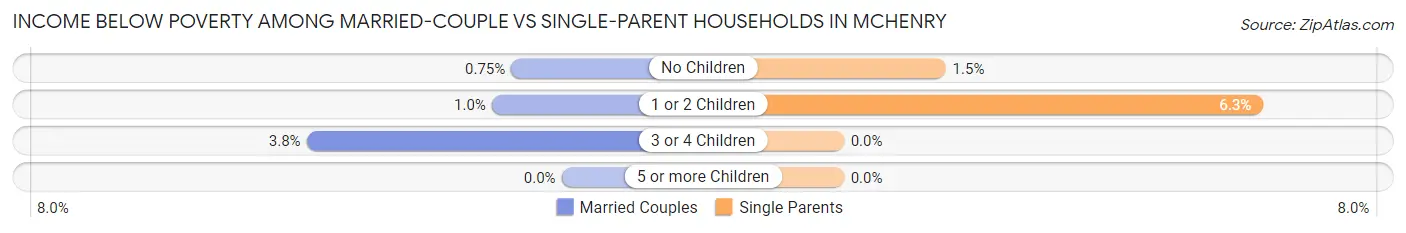
| Children | Married-Couple Families | Single-Parent Households |
| No Children | 28 (0.7%) | 7 (1.5%) |
| 1 or 2 Children | 21 (1.0%) | 48 (6.2%) |
| 3 or 4 Children | 12 (3.8%) | 0 (0.0%) |
| 5 or more Children | 0 (0.0%) | 0 (0.0%) |
| Total | 61 (1.0%) | 55 (4.2%) |
Race in Mchenry
The most populous races in Mchenry are White / Caucasian (24,245 | 88.2%), Hispanic or Latino (4,453 | 16.2%), and Two or more Races (2,070 | 7.5%).
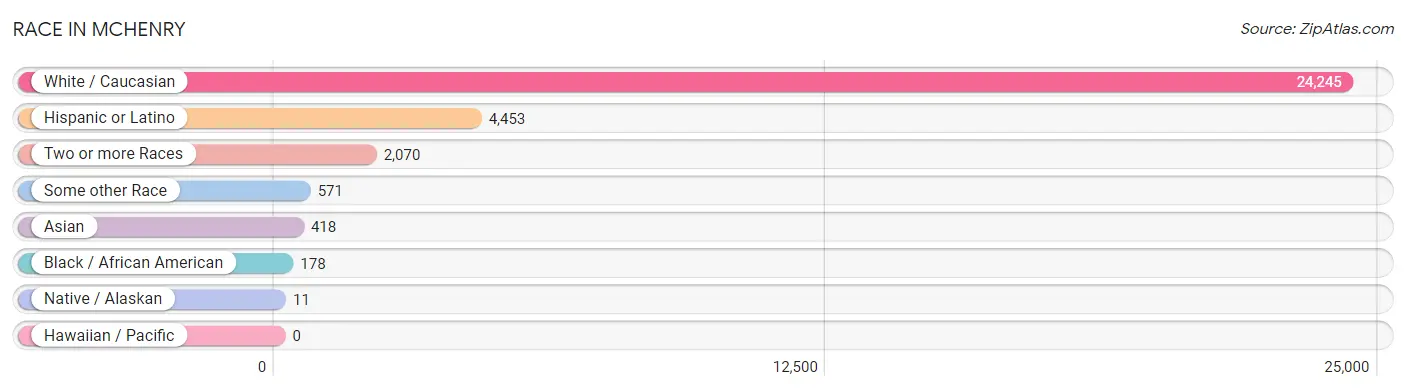
| Race | # Population | % Population |
| Asian | 418 | 1.5% |
| Black / African American | 178 | 0.6% |
| Hawaiian / Pacific | 0 | 0.0% |
| Hispanic or Latino | 4,453 | 16.2% |
| Native / Alaskan | 11 | 0.0% |
| White / Caucasian | 24,245 | 88.2% |
| Two or more Races | 2,070 | 7.5% |
| Some other Race | 571 | 2.1% |
| Total | 27,493 | 100.0% |
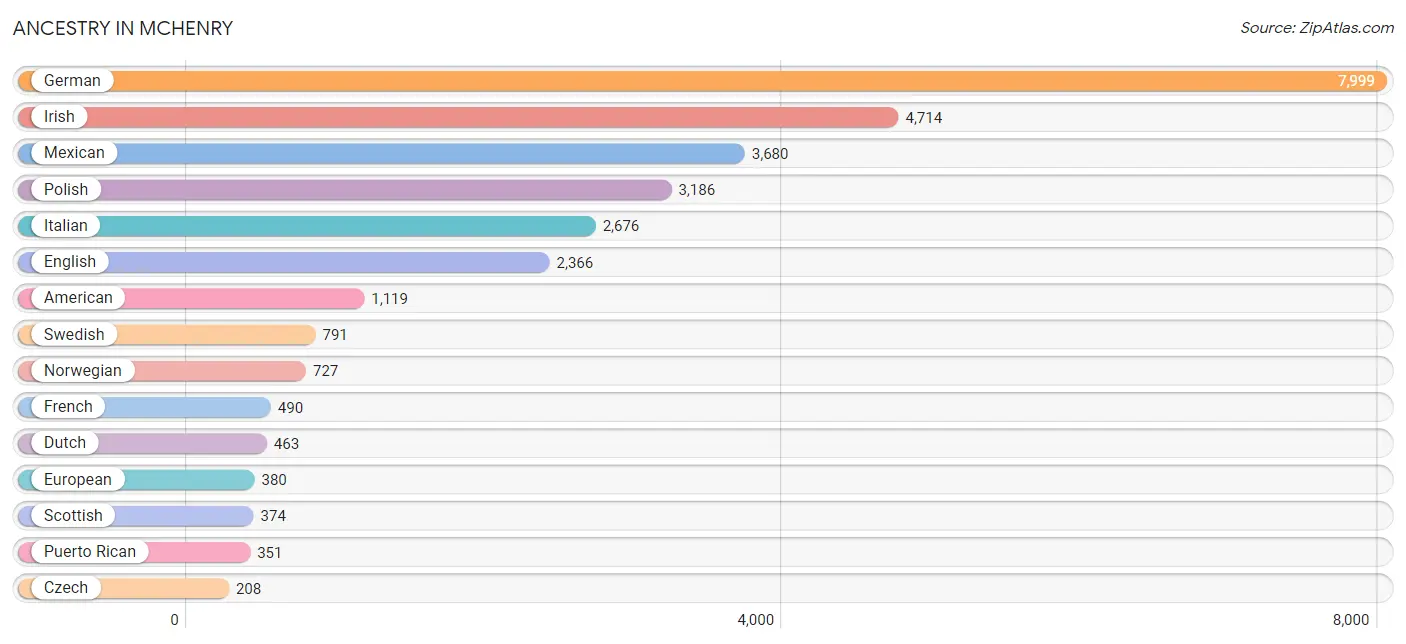
Ancestry in Mchenry
The most populous ancestries reported in Mchenry are German (7,999 | 29.1%), Irish (4,714 | 17.2%), Mexican (3,680 | 13.4%), Polish (3,186 | 11.6%), and Italian (2,676 | 9.7%), together accounting for 81.0% of all Mchenry residents.
| Ancestry | # Population | % Population |
| American | 1,119 | 4.1% |
| Apache | 13 | 0.1% |
| Assyrian / Chaldean / Syriac | 17 | 0.1% |
| Austrian | 69 | 0.3% |
| Belgian | 171 | 0.6% |
| Bhutanese | 59 | 0.2% |
| British | 136 | 0.5% |
| Bulgarian | 27 | 0.1% |
| Burmese | 116 | 0.4% |
| Canadian | 44 | 0.2% |
| Central American | 72 | 0.3% |
| Cherokee | 18 | 0.1% |
| Colombian | 102 | 0.4% |
| Croatian | 29 | 0.1% |
| Cuban | 63 | 0.2% |
| Czech | 208 | 0.8% |
| Czechoslovakian | 146 | 0.5% |
| Danish | 178 | 0.6% |
| Dutch | 463 | 1.7% |
| Eastern European | 171 | 0.6% |
| English | 2,366 | 8.6% |
| European | 380 | 1.4% |
| Finnish | 42 | 0.2% |
| French | 490 | 1.8% |
| French Canadian | 62 | 0.2% |
| German | 7,999 | 29.1% |
| Greek | 191 | 0.7% |
| Guatemalan | 33 | 0.1% |
| Haitian | 15 | 0.1% |
| Hungarian | 101 | 0.4% |
| Indian (Asian) | 28 | 0.1% |
| Irish | 4,714 | 17.2% |
| Israeli | 11 | 0.0% |
| Italian | 2,676 | 9.7% |
| Korean | 191 | 0.7% |
| Latvian | 8 | 0.0% |
| Lithuanian | 110 | 0.4% |
| Luxembourger | 12 | 0.0% |
| Menominee | 4 | 0.0% |
| Mexican | 3,680 | 13.4% |
| Nicaraguan | 10 | 0.0% |
| Norwegian | 727 | 2.6% |
| Pakistani | 113 | 0.4% |
| Panamanian | 22 | 0.1% |
| Peruvian | 39 | 0.1% |
| Polish | 3,186 | 11.6% |
| Puerto Rican | 351 | 1.3% |
| Romanian | 19 | 0.1% |
| Russian | 134 | 0.5% |
| Salvadoran | 7 | 0.0% |
| Scandinavian | 31 | 0.1% |
| Scotch-Irish | 123 | 0.4% |
| Scottish | 374 | 1.4% |
| Serbian | 17 | 0.1% |
| Slavic | 32 | 0.1% |
| South American | 141 | 0.5% |
| Spaniard | 31 | 0.1% |
| Spanish | 66 | 0.2% |
| Sri Lankan | 34 | 0.1% |
| Subsaharan African | 18 | 0.1% |
| Swedish | 791 | 2.9% |
| Swiss | 129 | 0.5% |
| Thai | 61 | 0.2% |
| Ukrainian | 81 | 0.3% |
| Welsh | 76 | 0.3% |
| Yugoslavian | 19 | 0.1% | View All 66 Rows |
Immigrants in Mchenry
The most numerous immigrant groups reported in Mchenry came from Latin America (1,470 | 5.3%), Central America (1,419 | 5.2%), Mexico (1,380 | 5.0%), Europe (433 | 1.6%), and Eastern Europe (309 | 1.1%), together accounting for 18.2% of all Mchenry residents.
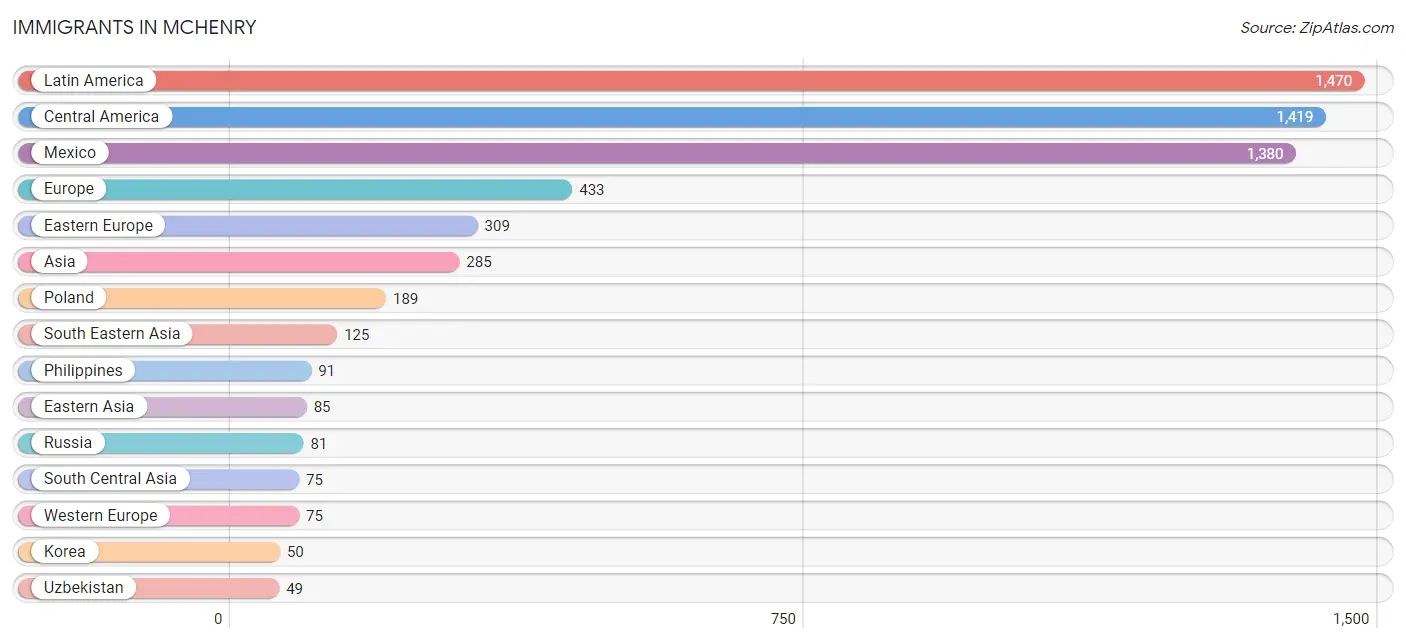
| Immigration Origin | # Population | % Population |
| Asia | 285 | 1.0% |
| Bulgaria | 9 | 0.0% |
| Canada | 48 | 0.2% |
| Caribbean | 15 | 0.1% |
| Central America | 1,419 | 5.2% |
| China | 35 | 0.1% |
| Colombia | 36 | 0.1% |
| Eastern Asia | 85 | 0.3% |
| Eastern Europe | 309 | 1.1% |
| El Salvador | 7 | 0.0% |
| Europe | 433 | 1.6% |
| France | 34 | 0.1% |
| Germany | 19 | 0.1% |
| Greece | 15 | 0.1% |
| Haiti | 15 | 0.1% |
| Hong Kong | 35 | 0.1% |
| India | 26 | 0.1% |
| Ireland | 16 | 0.1% |
| Korea | 50 | 0.2% |
| Latin America | 1,470 | 5.3% |
| Mexico | 1,380 | 5.0% |
| Netherlands | 22 | 0.1% |
| Nicaragua | 10 | 0.0% |
| Northern Europe | 34 | 0.1% |
| Panama | 22 | 0.1% |
| Philippines | 91 | 0.3% |
| Poland | 189 | 0.7% |
| Russia | 81 | 0.3% |
| Serbia | 23 | 0.1% |
| South America | 36 | 0.1% |
| South Central Asia | 75 | 0.3% |
| South Eastern Asia | 125 | 0.4% |
| Southern Europe | 15 | 0.1% |
| Ukraine | 7 | 0.0% |
| Uzbekistan | 49 | 0.2% |
| Vietnam | 34 | 0.1% |
| Western Europe | 75 | 0.3% | View All 37 Rows |
Sex and Age in Mchenry
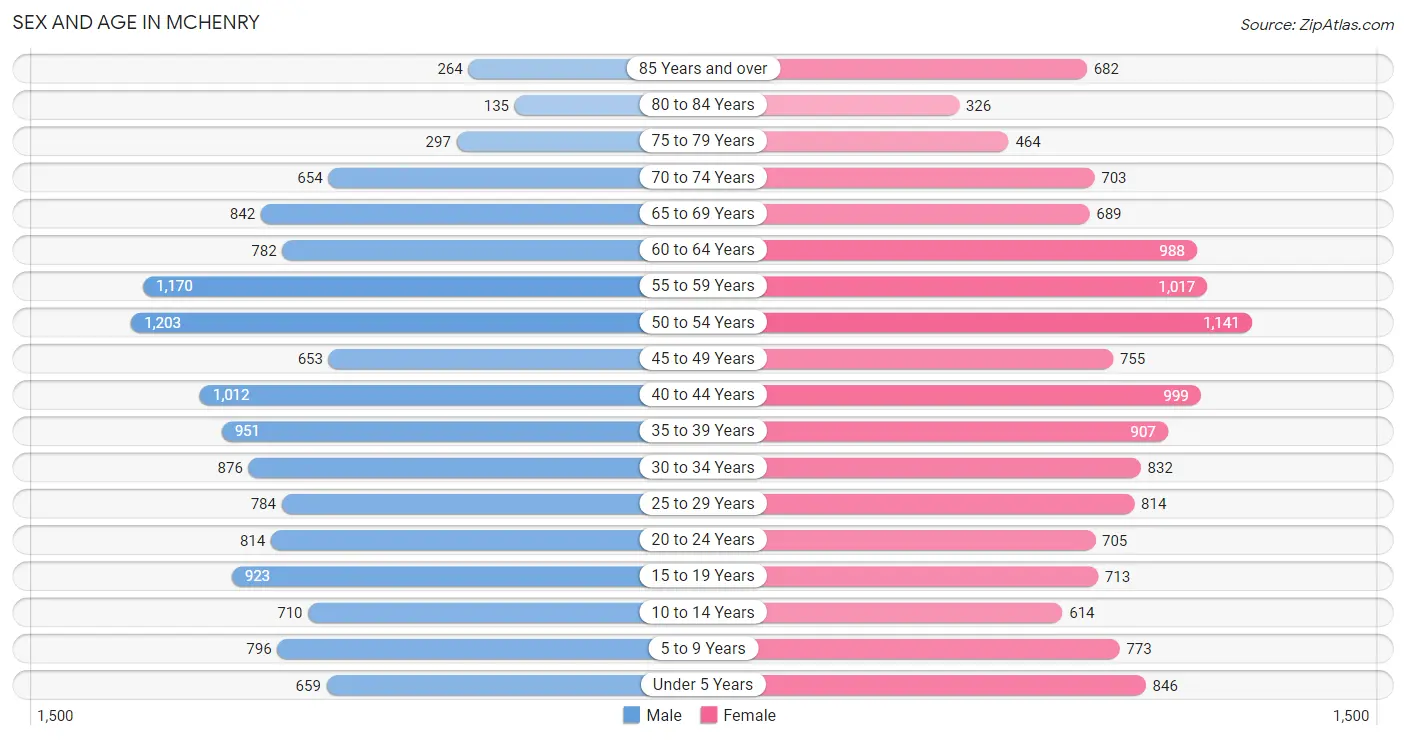
Sex and Age in Mchenry
The most populous age groups in Mchenry are 50 to 54 Years (1,203 | 8.9%) for men and 50 to 54 Years (1,141 | 8.2%) for women.
| Age Bracket | Male | Female |
| Under 5 Years | 659 (4.9%) | 846 (6.1%) |
| 5 to 9 Years | 796 (5.9%) | 773 (5.5%) |
| 10 to 14 Years | 710 (5.2%) | 614 (4.4%) |
| 15 to 19 Years | 923 (6.8%) | 713 (5.1%) |
| 20 to 24 Years | 814 (6.0%) | 705 (5.1%) |
| 25 to 29 Years | 784 (5.8%) | 814 (5.8%) |
| 30 to 34 Years | 876 (6.5%) | 832 (6.0%) |
| 35 to 39 Years | 951 (7.0%) | 907 (6.5%) |
| 40 to 44 Years | 1,012 (7.5%) | 999 (7.1%) |
| 45 to 49 Years | 653 (4.8%) | 755 (5.4%) |
| 50 to 54 Years | 1,203 (8.9%) | 1,141 (8.2%) |
| 55 to 59 Years | 1,170 (8.6%) | 1,017 (7.3%) |
| 60 to 64 Years | 782 (5.8%) | 988 (7.1%) |
| 65 to 69 Years | 842 (6.2%) | 689 (4.9%) |
| 70 to 74 Years | 654 (4.8%) | 703 (5.0%) |
| 75 to 79 Years | 297 (2.2%) | 464 (3.3%) |
| 80 to 84 Years | 135 (1.0%) | 326 (2.3%) |
| 85 Years and over | 264 (1.9%) | 682 (4.9%) |
| Total | 13,525 (100.0%) | 13,968 (100.0%) |
Families and Households in Mchenry
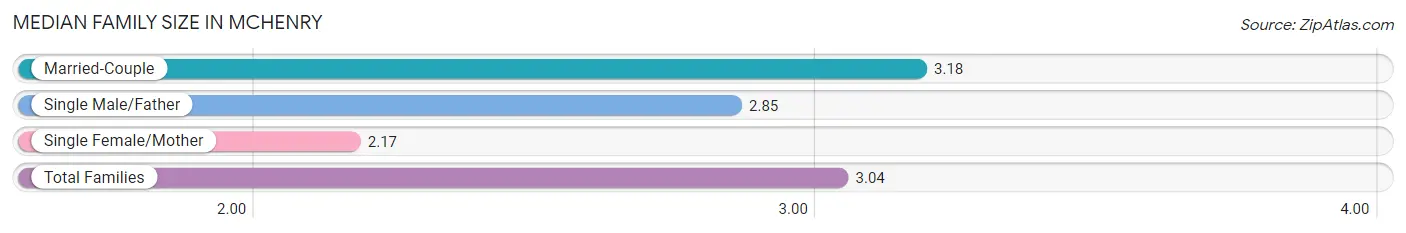
Median Family Size in Mchenry
The median family size in Mchenry is 3.04 persons per family, with married-couple families (6,054 | 82.1%) accounting for the largest median family size of 3.18 persons per family. On the other hand, single female/mother families (931 | 12.6%) represent the smallest median family size with 2.17 persons per family.
| Family Type | # Families | Family Size |
| Married-Couple | 6,054 (82.1%) | 3.18 |
| Single Male/Father | 387 (5.2%) | 2.85 |
| Single Female/Mother | 931 (12.6%) | 2.17 |
| Total Families | 7,372 (100.0%) | 3.04 |
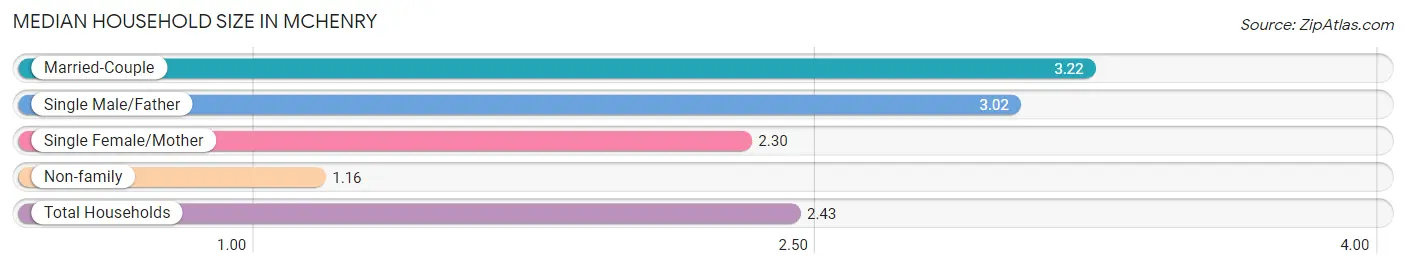
Median Household Size in Mchenry
The median household size in Mchenry is 2.43 persons per household, with married-couple households (6,054 | 53.9%) accounting for the largest median household size of 3.22 persons per household. non-family households (3,856 | 34.3%) represent the smallest median household size with 1.16 persons per household.
| Household Type | # Households | Household Size |
| Married-Couple | 6,054 (53.9%) | 3.22 |
| Single Male/Father | 387 (3.5%) | 3.02 |
| Single Female/Mother | 931 (8.3%) | 2.30 |
| Non-family | 3,856 (34.3%) | 1.16 |
| Total Households | 11,228 (100.0%) | 2.43 |
Household Size by Marriage Status in Mchenry
Out of a total of 11,228 households in Mchenry, 7,372 (65.7%) are family households, while 3,856 (34.3%) are nonfamily households. The most numerous type of family households are 2-person households, comprising 3,429, and the most common type of nonfamily households are 1-person households, comprising 3,315.
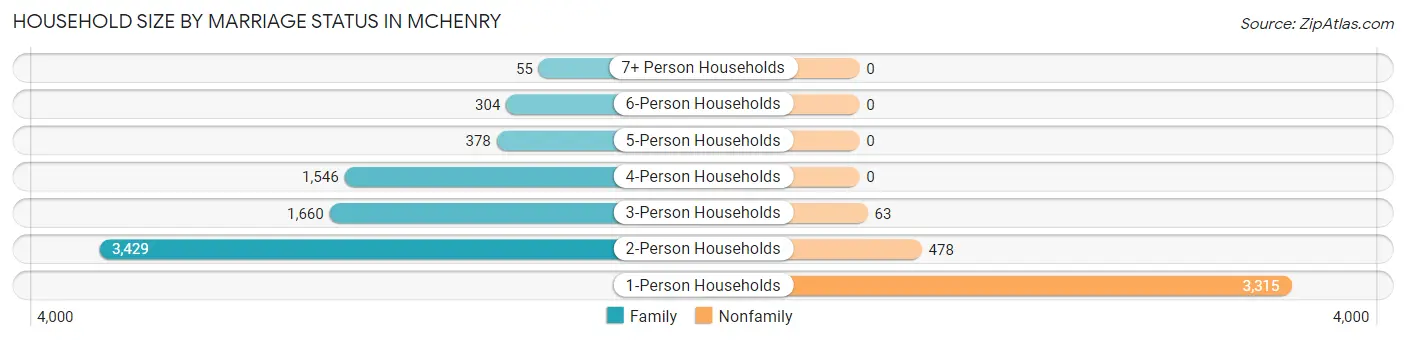
| Household Size | Family Households | Nonfamily Households |
| 1-Person Households | - | 3,315 (29.5%) |
| 2-Person Households | 3,429 (30.5%) | 478 (4.3%) |
| 3-Person Households | 1,660 (14.8%) | 63 (0.6%) |
| 4-Person Households | 1,546 (13.8%) | 0 (0.0%) |
| 5-Person Households | 378 (3.4%) | 0 (0.0%) |
| 6-Person Households | 304 (2.7%) | 0 (0.0%) |
| 7+ Person Households | 55 (0.5%) | 0 (0.0%) |
| Total | 7,372 (65.7%) | 3,856 (34.3%) |
Female Fertility in Mchenry
Fertility by Age in Mchenry
Average fertility rate in Mchenry is 64.0 births per 1,000 women. Women in the age bracket of 20 to 34 years have the highest fertility rate with 151.0 births per 1,000 women. Women in the age bracket of 20 to 34 years acount for 93.7% of all women with births.
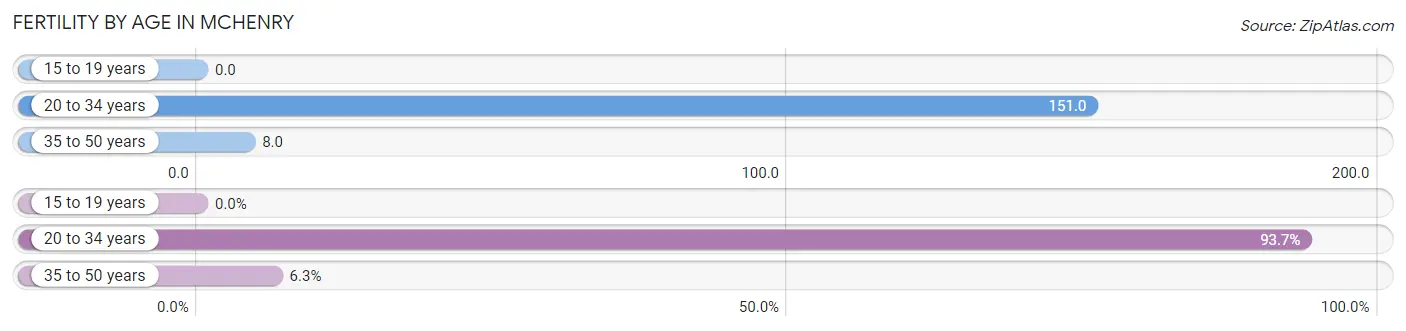
| Age Bracket | Women with Births | Births / 1,000 Women |
| 15 to 19 years | 0 (0.0%) | 0.0 |
| 20 to 34 years | 355 (93.7%) | 151.0 |
| 35 to 50 years | 24 (6.3%) | 8.0 |
| Total | 379 (100.0%) | 64.0 |
Fertility by Age by Marriage Status in Mchenry
58.8% of women with births (379) in Mchenry are married. The highest percentage of unmarried women with births falls into 35 to 50 years age bracket with 50.0% of them unmarried at the time of birth, while the lowest percentage of unmarried women with births belong to 20 to 34 years age bracket with 40.6% of them unmarried.
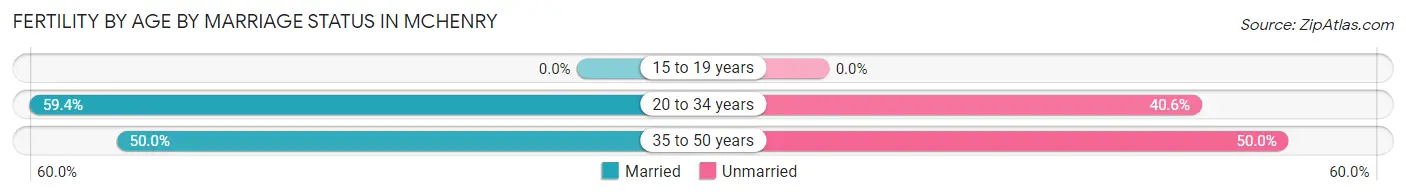
| Age Bracket | Married | Unmarried |
| 15 to 19 years | 0 (0.0%) | 0 (0.0%) |
| 20 to 34 years | 211 (59.4%) | 144 (40.6%) |
| 35 to 50 years | 12 (50.0%) | 12 (50.0%) |
| Total | 223 (58.8%) | 156 (41.2%) |
Fertility by Education in Mchenry
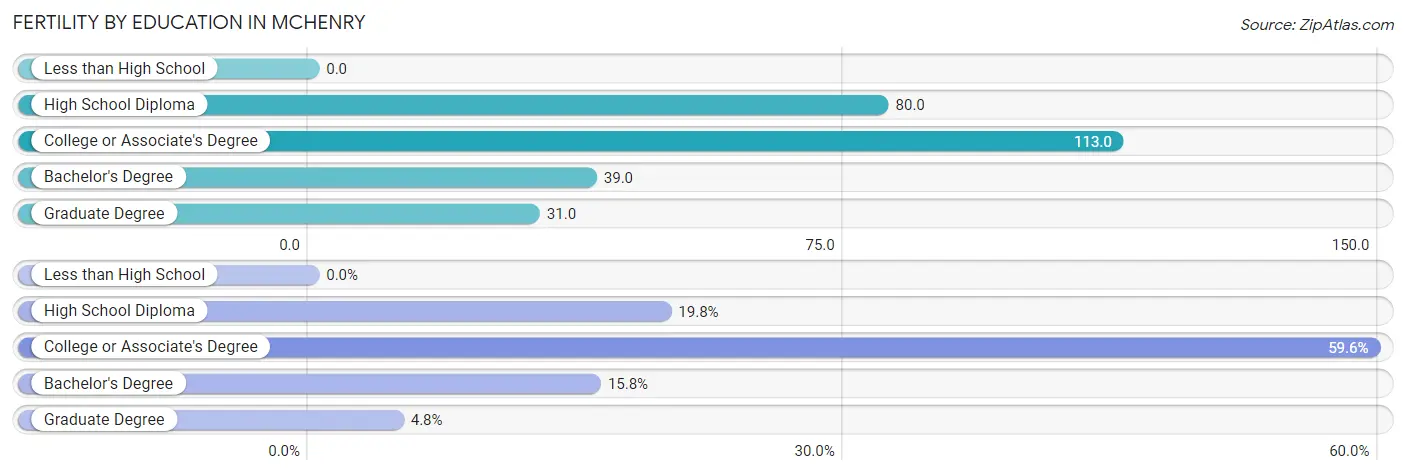
| Educational Attainment | Women with Births | Births / 1,000 Women |
| Less than High School | 0 (0.0%) | 0.0 |
| High School Diploma | 75 (19.8%) | 80.0 |
| College or Associate's Degree | 226 (59.6%) | 113.0 |
| Bachelor's Degree | 60 (15.8%) | 39.0 |
| Graduate Degree | 18 (4.8%) | 31.0 |
| Total | 379 (100.0%) | 64.0 |
Fertility by Education by Marriage Status in Mchenry
41.2% of women with births in Mchenry are unmarried. Women with the educational attainment of bachelor's degree are most likely to be married with 100.0% of them married at childbirth, while women with the educational attainment of college or associate's degree are least likely to be married with 59.3% of them unmarried at childbirth.
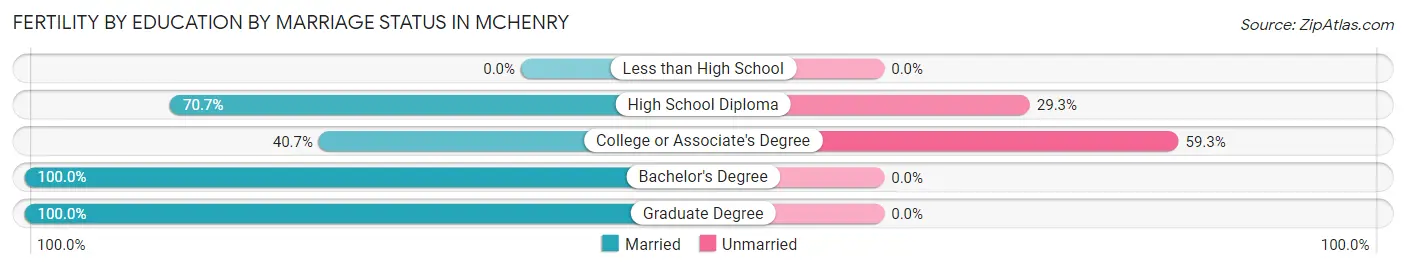
| Educational Attainment | Married | Unmarried |
| Less than High School | 0 (0.0%) | 0 (0.0%) |
| High School Diploma | 53 (70.7%) | 22 (29.3%) |
| College or Associate's Degree | 92 (40.7%) | 134 (59.3%) |
| Bachelor's Degree | 60 (100.0%) | 0 (0.0%) |
| Graduate Degree | 18 (100.0%) | 0 (0.0%) |
| Total | 223 (58.8%) | 156 (41.2%) |
Employment Characteristics in Mchenry
Employment by Class of Employer in Mchenry
Among the 14,773 employed individuals in Mchenry, private company employees (10,838 | 73.4%), local government employees (1,242 | 8.4%), and not-for-profit organizations (815 | 5.5%) make up the most common classes of employment.
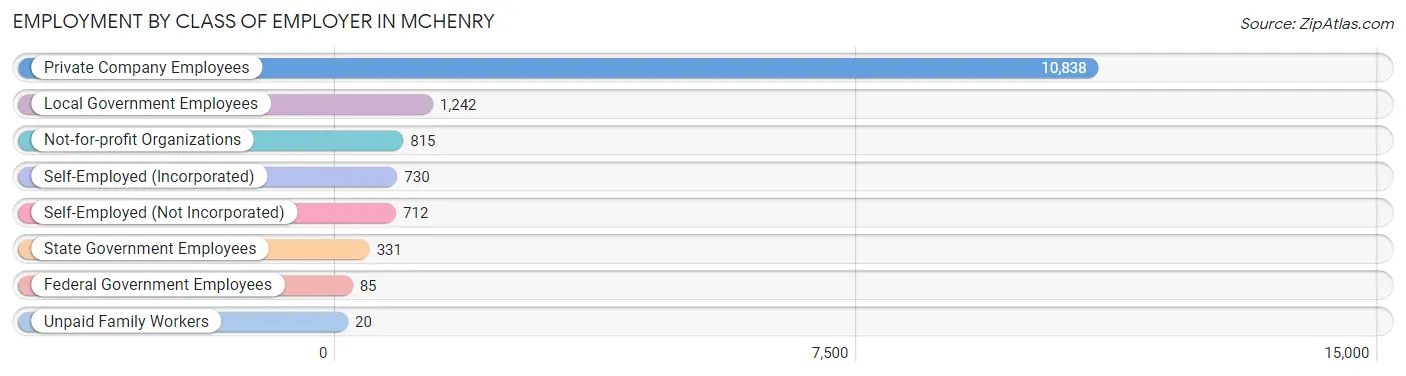
| Employer Class | # Employees | % Employees |
| Private Company Employees | 10,838 | 73.4% |
| Self-Employed (Incorporated) | 730 | 4.9% |
| Self-Employed (Not Incorporated) | 712 | 4.8% |
| Not-for-profit Organizations | 815 | 5.5% |
| Local Government Employees | 1,242 | 8.4% |
| State Government Employees | 331 | 2.2% |
| Federal Government Employees | 85 | 0.6% |
| Unpaid Family Workers | 20 | 0.1% |
| Total | 14,773 | 100.0% |
Employment Status by Age in Mchenry
According to the labor force statistics for Mchenry, out of the total population over 16 years of age (22,570), 69.9% or 15,776 individuals are in the labor force, with 4.3% or 678 of them unemployed. The age group with the highest labor force participation rate is 25 to 29 years, with 94.1% or 1,504 individuals in the labor force. Within the labor force, the 20 to 24 years age range has the highest percentage of unemployed individuals, with 10.7% or 143 of them being unemployed.
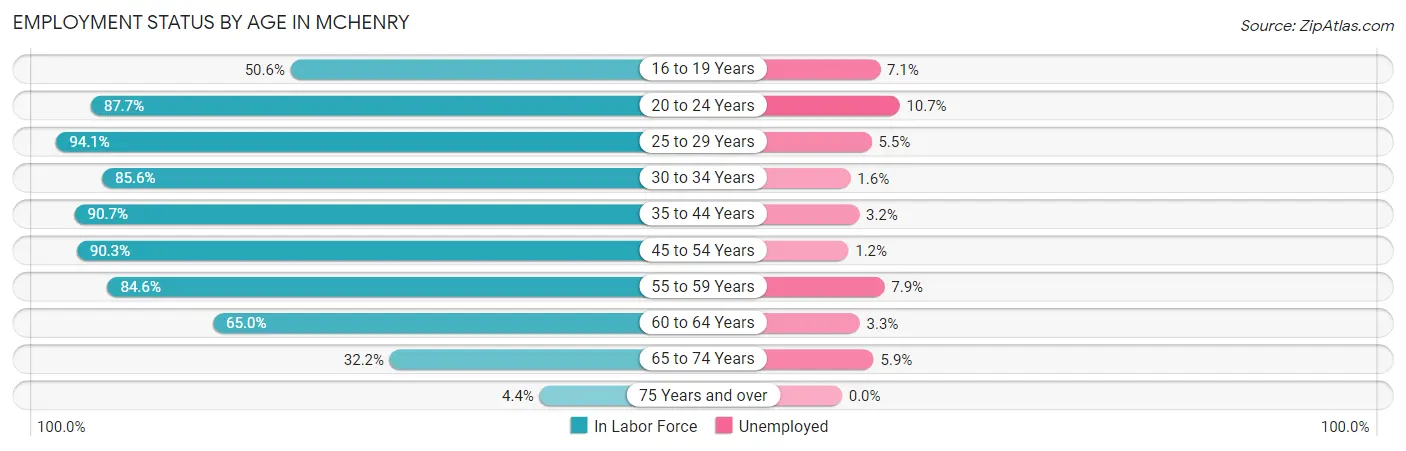
| Age Bracket | In Labor Force | Unemployed |
| 16 to 19 Years | 562 (50.6%) | 40 (7.1%) |
| 20 to 24 Years | 1,332 (87.7%) | 143 (10.7%) |
| 25 to 29 Years | 1,504 (94.1%) | 83 (5.5%) |
| 30 to 34 Years | 1,462 (85.6%) | 23 (1.6%) |
| 35 to 44 Years | 3,509 (90.7%) | 112 (3.2%) |
| 45 to 54 Years | 3,388 (90.3%) | 41 (1.2%) |
| 55 to 59 Years | 1,850 (84.6%) | 146 (7.9%) |
| 60 to 64 Years | 1,150 (65.0%) | 38 (3.3%) |
| 65 to 74 Years | 930 (32.2%) | 55 (5.9%) |
| 75 Years and over | 95 (4.4%) | 0 (0.0%) |
| Total | 15,776 (69.9%) | 678 (4.3%) |
Employment Status by Educational Attainment in Mchenry
According to labor force statistics for Mchenry, 86.4% of individuals (12,860) out of the total population between 25 and 64 years of age (14,884) are in the labor force, with 3.5% or 450 of them being unemployed. The group with the highest labor force participation rate are those with the educational attainment of bachelor's degree or higher, with 89.9% or 3,730 individuals in the labor force. Within the labor force, individuals with less than high school education have the highest percentage of unemployment, with 6.4% or 53 of them being unemployed.
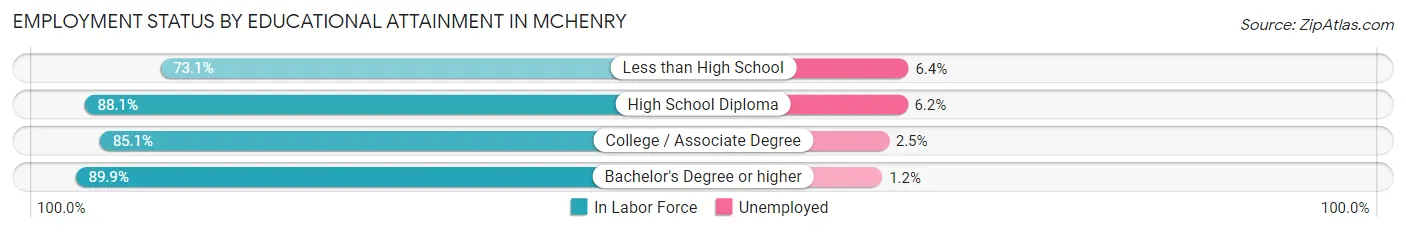
| Educational Attainment | In Labor Force | Unemployed |
| Less than High School | 830 (73.1%) | 73 (6.4%) |
| High School Diploma | 3,736 (88.1%) | 263 (6.2%) |
| College / Associate Degree | 4,560 (85.1%) | 134 (2.5%) |
| Bachelor's Degree or higher | 3,730 (89.9%) | 50 (1.2%) |
| Total | 12,860 (86.4%) | 521 (3.5%) |
Employment Occupations by Sex in Mchenry
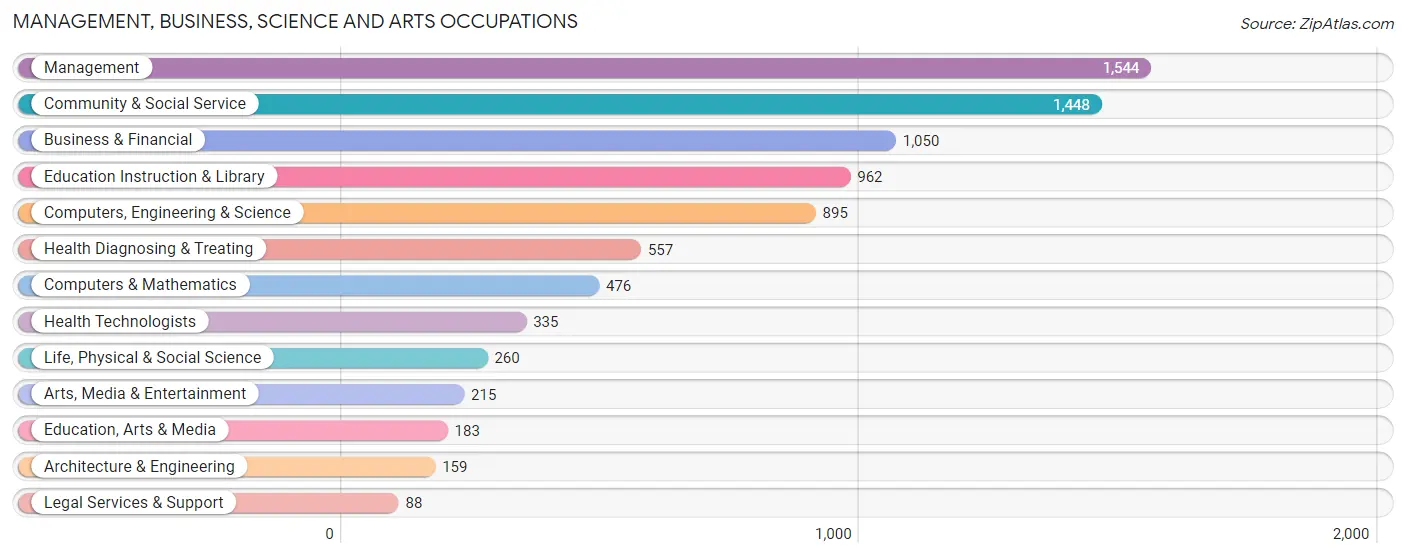
Management, Business, Science and Arts Occupations
The most common Management, Business, Science and Arts occupations in Mchenry are Management (1,544 | 10.2%), Community & Social Service (1,448 | 9.6%), Business & Financial (1,050 | 7.0%), Education Instruction & Library (962 | 6.4%), and Computers, Engineering & Science (895 | 5.9%).
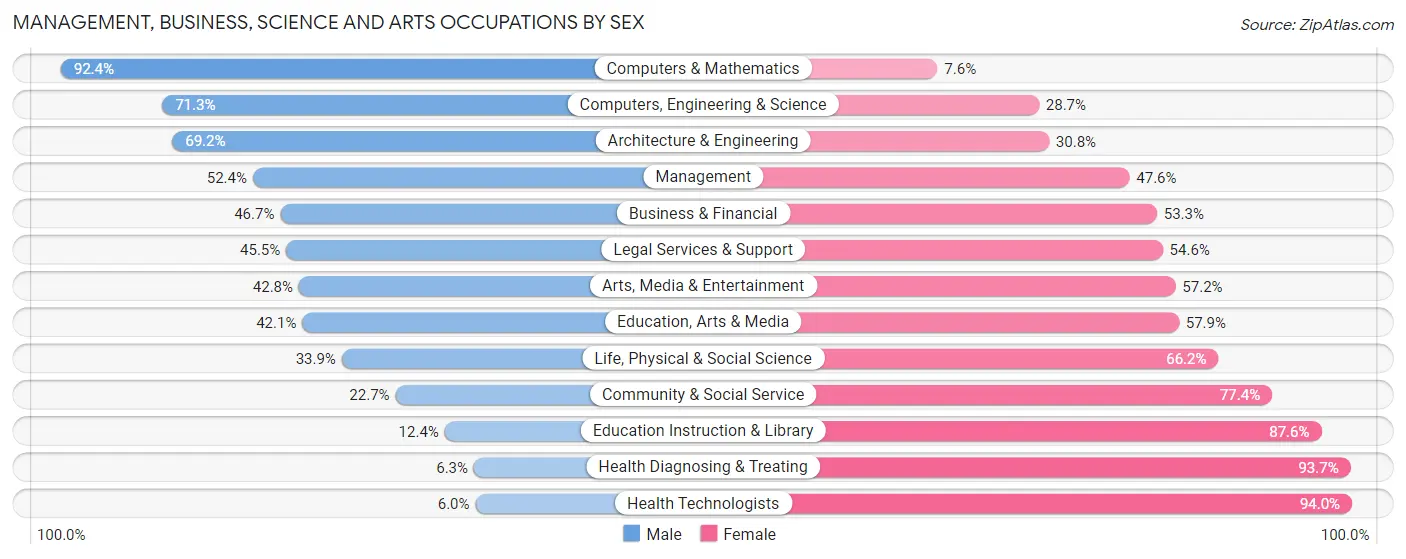
Management, Business, Science and Arts Occupations by Sex
Within the Management, Business, Science and Arts occupations in Mchenry, the most male-oriented occupations are Computers & Mathematics (92.4%), Computers, Engineering & Science (71.3%), and Architecture & Engineering (69.2%), while the most female-oriented occupations are Health Technologists (94.0%), Health Diagnosing & Treating (93.7%), and Education Instruction & Library (87.6%).
| Occupation | Male | Female |
| Management | 809 (52.4%) | 735 (47.6%) |
| Business & Financial | 490 (46.7%) | 560 (53.3%) |
| Computers, Engineering & Science | 638 (71.3%) | 257 (28.7%) |
| Computers & Mathematics | 440 (92.4%) | 36 (7.6%) |
| Architecture & Engineering | 110 (69.2%) | 49 (30.8%) |
| Life, Physical & Social Science | 88 (33.9%) | 172 (66.1%) |
| Community & Social Service | 328 (22.7%) | 1,120 (77.3%) |
| Education, Arts & Media | 77 (42.1%) | 106 (57.9%) |
| Legal Services & Support | 40 (45.5%) | 48 (54.5%) |
| Education Instruction & Library | 119 (12.4%) | 843 (87.6%) |
| Arts, Media & Entertainment | 92 (42.8%) | 123 (57.2%) |
| Health Diagnosing & Treating | 35 (6.3%) | 522 (93.7%) |
| Health Technologists | 20 (6.0%) | 315 (94.0%) |
| Total (Category) | 2,300 (41.9%) | 3,194 (58.1%) |
| Total (Overall) | 8,110 (53.7%) | 6,988 (46.3%) |
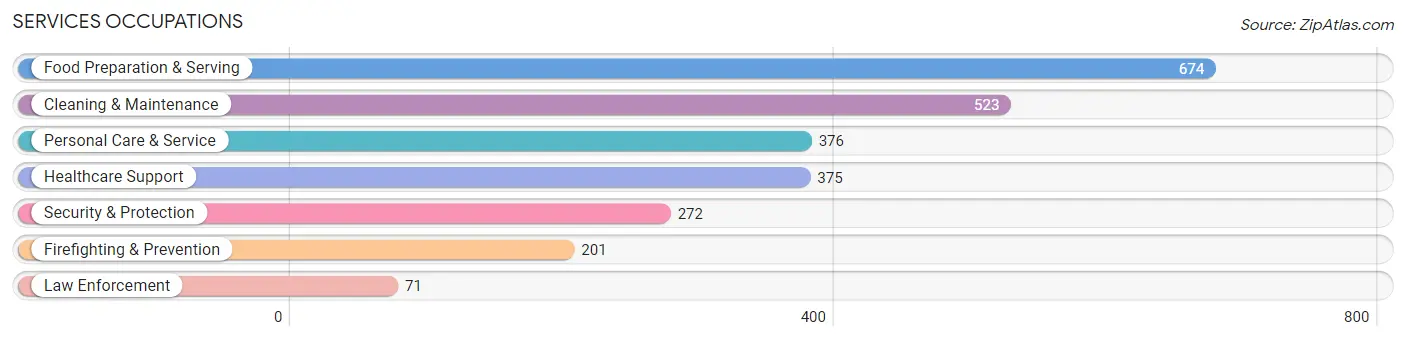
Services Occupations
The most common Services occupations in Mchenry are Food Preparation & Serving (674 | 4.5%), Cleaning & Maintenance (523 | 3.5%), Personal Care & Service (376 | 2.5%), Healthcare Support (375 | 2.5%), and Security & Protection (272 | 1.8%).
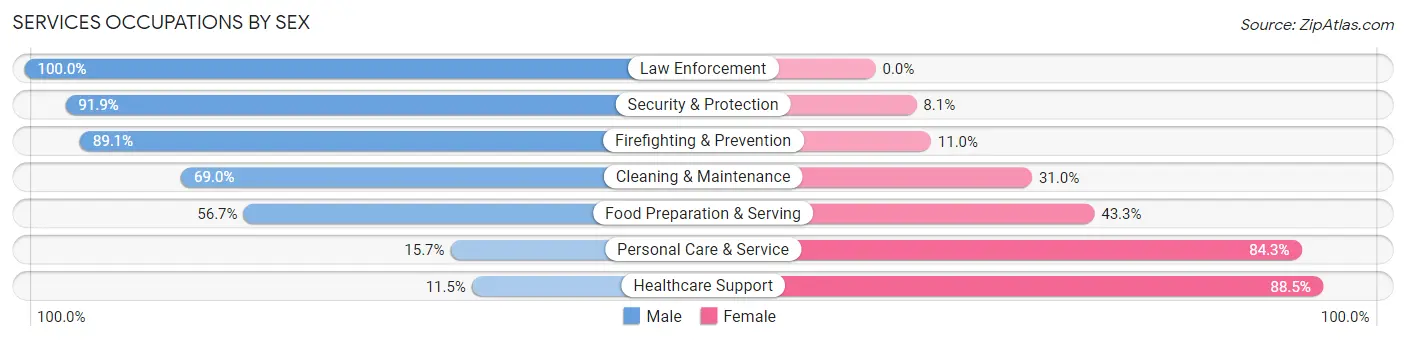
Services Occupations by Sex
Within the Services occupations in Mchenry, the most male-oriented occupations are Law Enforcement (100.0%), Security & Protection (91.9%), and Firefighting & Prevention (89.0%), while the most female-oriented occupations are Healthcare Support (88.5%), Personal Care & Service (84.3%), and Food Preparation & Serving (43.3%).
| Occupation | Male | Female |
| Healthcare Support | 43 (11.5%) | 332 (88.5%) |
| Security & Protection | 250 (91.9%) | 22 (8.1%) |
| Firefighting & Prevention | 179 (89.0%) | 22 (11.0%) |
| Law Enforcement | 71 (100.0%) | 0 (0.0%) |
| Food Preparation & Serving | 382 (56.7%) | 292 (43.3%) |
| Cleaning & Maintenance | 361 (69.0%) | 162 (31.0%) |
| Personal Care & Service | 59 (15.7%) | 317 (84.3%) |
| Total (Category) | 1,095 (49.3%) | 1,125 (50.7%) |
| Total (Overall) | 8,110 (53.7%) | 6,988 (46.3%) |
Sales and Office Occupations
The most common Sales and Office occupations in Mchenry are Sales & Related (2,014 | 13.3%), and Office & Administration (1,511 | 10.0%).
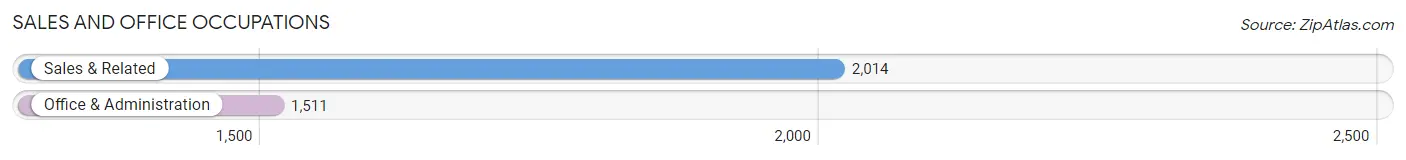
Sales and Office Occupations by Sex

| Occupation | Male | Female |
| Sales & Related | 1,197 (59.4%) | 817 (40.6%) |
| Office & Administration | 260 (17.2%) | 1,251 (82.8%) |
| Total (Category) | 1,457 (41.3%) | 2,068 (58.7%) |
| Total (Overall) | 8,110 (53.7%) | 6,988 (46.3%) |
Natural Resources, Construction and Maintenance Occupations
The most common Natural Resources, Construction and Maintenance occupations in Mchenry are Construction & Extraction (918 | 6.1%), Installation, Maintenance & Repair (510 | 3.4%), and Farming, Fishing & Forestry (12 | 0.1%).
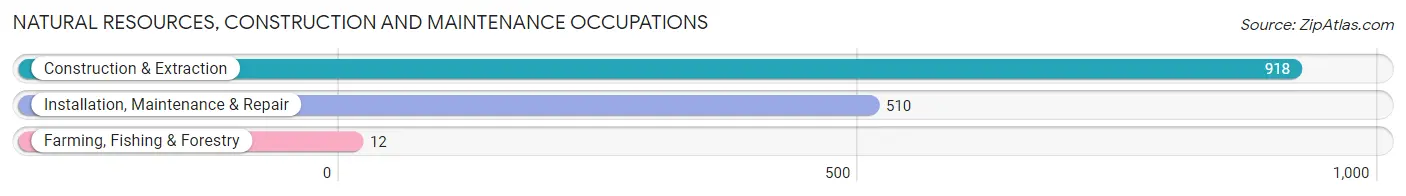
Natural Resources, Construction and Maintenance Occupations by Sex
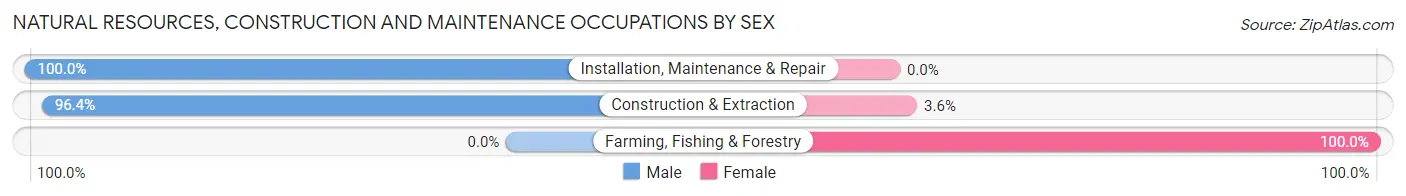
| Occupation | Male | Female |
| Farming, Fishing & Forestry | 0 (0.0%) | 12 (100.0%) |
| Construction & Extraction | 885 (96.4%) | 33 (3.6%) |
| Installation, Maintenance & Repair | 510 (100.0%) | 0 (0.0%) |
| Total (Category) | 1,395 (96.9%) | 45 (3.1%) |
| Total (Overall) | 8,110 (53.7%) | 6,988 (46.3%) |
Production, Transportation and Moving Occupations
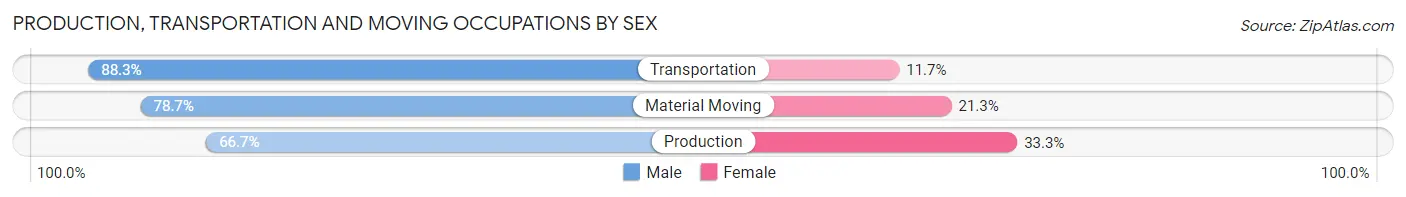
The most common Production, Transportation and Moving occupations in Mchenry are Production (1,035 | 6.9%), Transportation (872 | 5.8%), and Material Moving (512 | 3.4%).
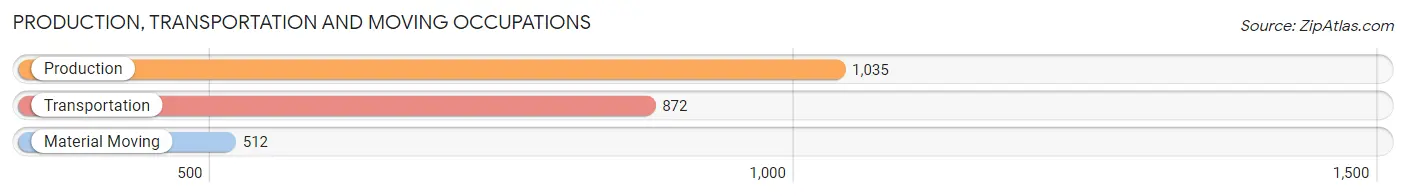
Production, Transportation and Moving Occupations by Sex
| Occupation | Male | Female |
| Production | 690 (66.7%) | 345 (33.3%) |
| Transportation | 770 (88.3%) | 102 (11.7%) |
| Material Moving | 403 (78.7%) | 109 (21.3%) |
| Total (Category) | 1,863 (77.0%) | 556 (23.0%) |
| Total (Overall) | 8,110 (53.7%) | 6,988 (46.3%) |
Employment Industries by Sex in Mchenry
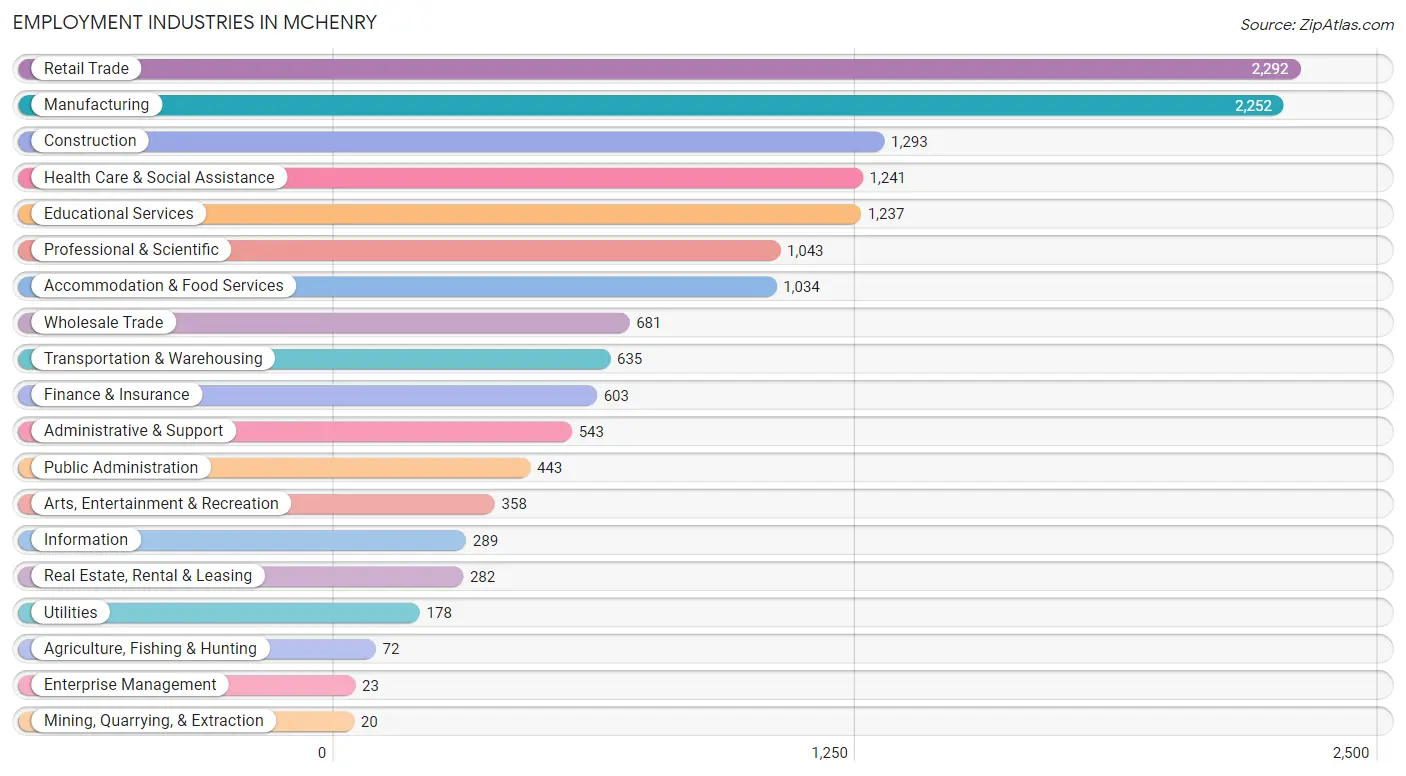
Employment Industries in Mchenry
The major employment industries in Mchenry include Retail Trade (2,292 | 15.2%), Manufacturing (2,252 | 14.9%), Construction (1,293 | 8.6%), Health Care & Social Assistance (1,241 | 8.2%), and Educational Services (1,237 | 8.2%).
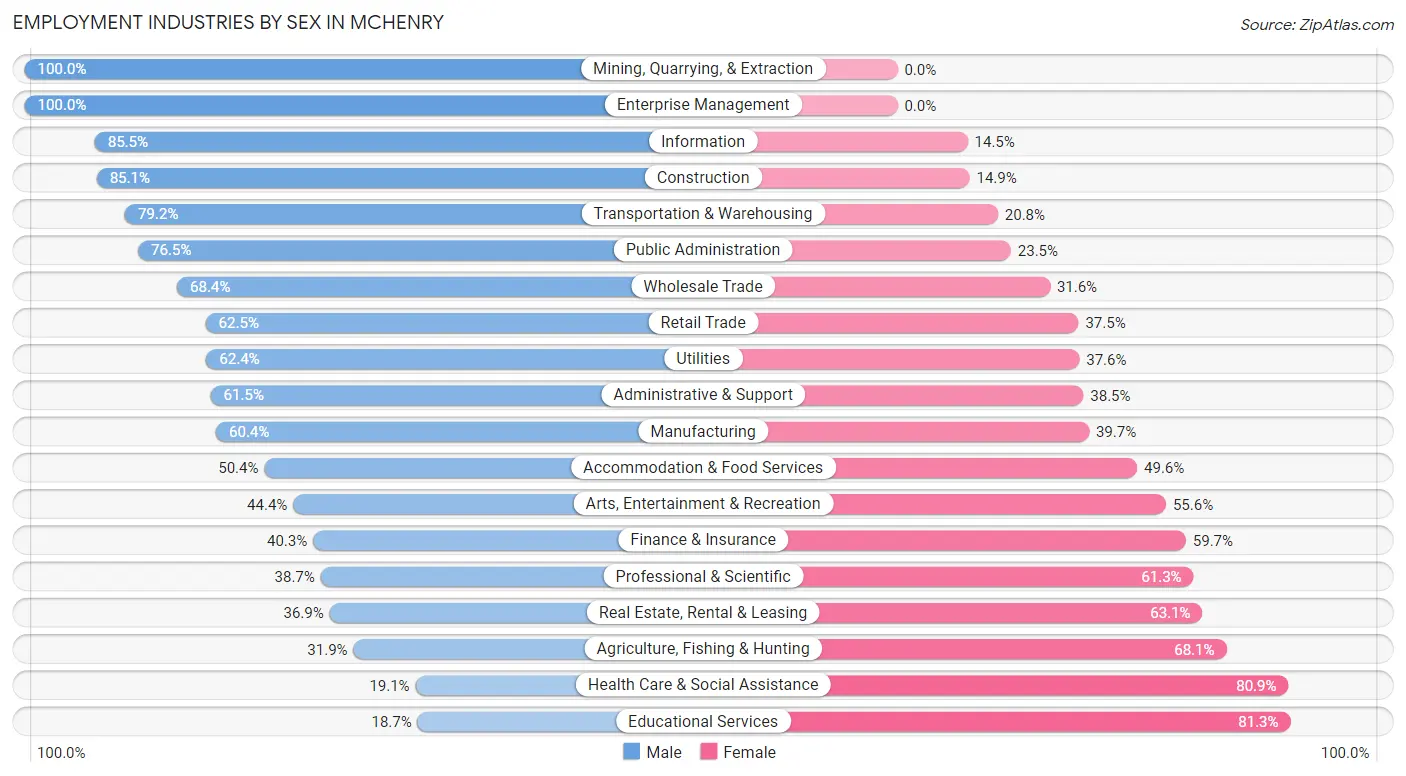
Employment Industries by Sex in Mchenry
The Mchenry industries that see more men than women are Mining, Quarrying, & Extraction (100.0%), Enterprise Management (100.0%), and Information (85.5%), whereas the industries that tend to have a higher number of women are Educational Services (81.3%), Health Care & Social Assistance (80.9%), and Agriculture, Fishing & Hunting (68.1%).
| Industry | Male | Female |
| Agriculture, Fishing & Hunting | 23 (31.9%) | 49 (68.1%) |
| Mining, Quarrying, & Extraction | 20 (100.0%) | 0 (0.0%) |
| Construction | 1,100 (85.1%) | 193 (14.9%) |
| Manufacturing | 1,359 (60.4%) | 893 (39.7%) |
| Wholesale Trade | 466 (68.4%) | 215 (31.6%) |
| Retail Trade | 1,433 (62.5%) | 859 (37.5%) |
| Transportation & Warehousing | 503 (79.2%) | 132 (20.8%) |
| Utilities | 111 (62.4%) | 67 (37.6%) |
| Information | 247 (85.5%) | 42 (14.5%) |
| Finance & Insurance | 243 (40.3%) | 360 (59.7%) |
| Real Estate, Rental & Leasing | 104 (36.9%) | 178 (63.1%) |
| Professional & Scientific | 404 (38.7%) | 639 (61.3%) |
| Enterprise Management | 23 (100.0%) | 0 (0.0%) |
| Administrative & Support | 334 (61.5%) | 209 (38.5%) |
| Educational Services | 231 (18.7%) | 1,006 (81.3%) |
| Health Care & Social Assistance | 237 (19.1%) | 1,004 (80.9%) |
| Arts, Entertainment & Recreation | 159 (44.4%) | 199 (55.6%) |
| Accommodation & Food Services | 521 (50.4%) | 513 (49.6%) |
| Public Administration | 339 (76.5%) | 104 (23.5%) |
| Total | 8,110 (53.7%) | 6,988 (46.3%) |
Education in Mchenry
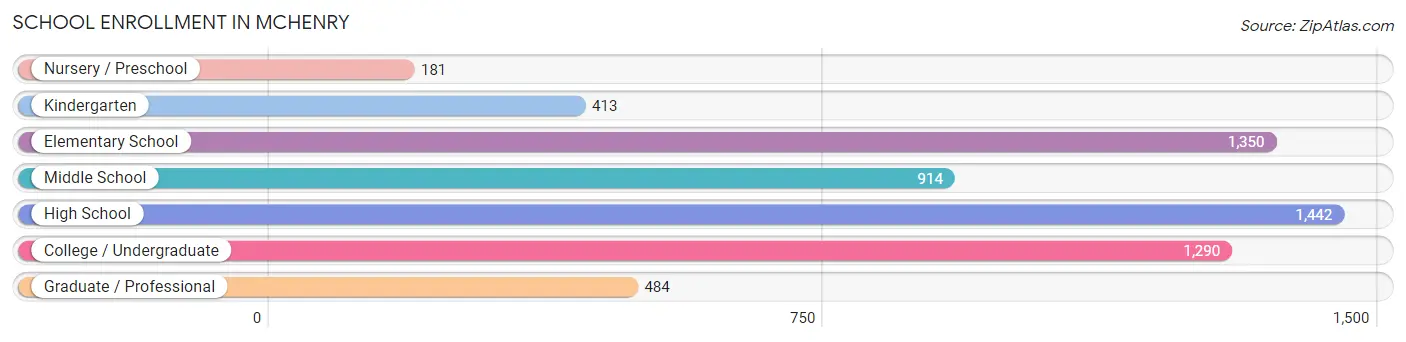
School Enrollment in Mchenry
The most common levels of schooling among the 6,074 students in Mchenry are high school (1,442 | 23.7%), elementary school (1,350 | 22.2%), and college / undergraduate (1,290 | 21.2%).
| School Level | # Students | % Students |
| Nursery / Preschool | 181 | 3.0% |
| Kindergarten | 413 | 6.8% |
| Elementary School | 1,350 | 22.2% |
| Middle School | 914 | 15.0% |
| High School | 1,442 | 23.7% |
| College / Undergraduate | 1,290 | 21.2% |
| Graduate / Professional | 484 | 8.0% |
| Total | 6,074 | 100.0% |
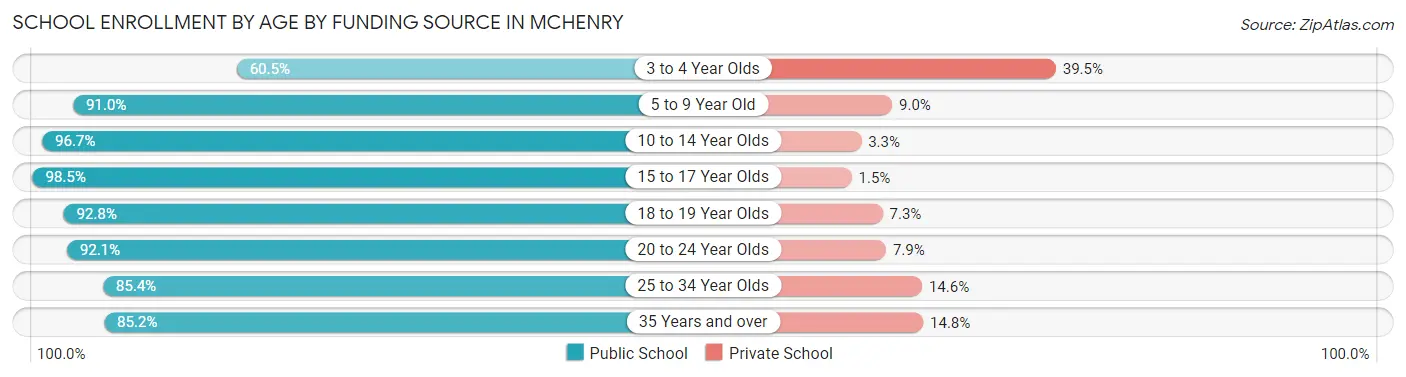
School Enrollment by Age by Funding Source in Mchenry
Out of a total of 6,074 students who are enrolled in schools in Mchenry, 468 (7.7%) attend a private institution, while the remaining 5,606 (92.3%) are enrolled in public schools. The age group of 3 to 4 year olds has the highest likelihood of being enrolled in private schools, with 64 (39.5% in the age bracket) enrolled. Conversely, the age group of 15 to 17 year olds has the lowest likelihood of being enrolled in a private school, with 1,129 (98.5% in the age bracket) attending a public institution.
| Age Bracket | Public School | Private School |
| 3 to 4 Year Olds | 98 (60.5%) | 64 (39.5%) |
| 5 to 9 Year Old | 1,402 (91.0%) | 139 (9.0%) |
| 10 to 14 Year Olds | 1,243 (96.7%) | 42 (3.3%) |
| 15 to 17 Year Olds | 1,129 (98.5%) | 17 (1.5%) |
| 18 to 19 Year Olds | 371 (92.7%) | 29 (7.2%) |
| 20 to 24 Year Olds | 666 (92.1%) | 57 (7.9%) |
| 25 to 34 Year Olds | 363 (85.4%) | 62 (14.6%) |
| 35 Years and over | 334 (85.2%) | 58 (14.8%) |
| Total | 5,606 (92.3%) | 468 (7.7%) |
Educational Attainment by Field of Study in Mchenry
Business (1,253 | 21.8%), education (872 | 15.2%), science & technology (661 | 11.5%), bio, nature & agricultural (395 | 6.9%), and visual & performing arts (380 | 6.6%) are the most common fields of study among 5,735 individuals in Mchenry who have obtained a bachelor's degree or higher.
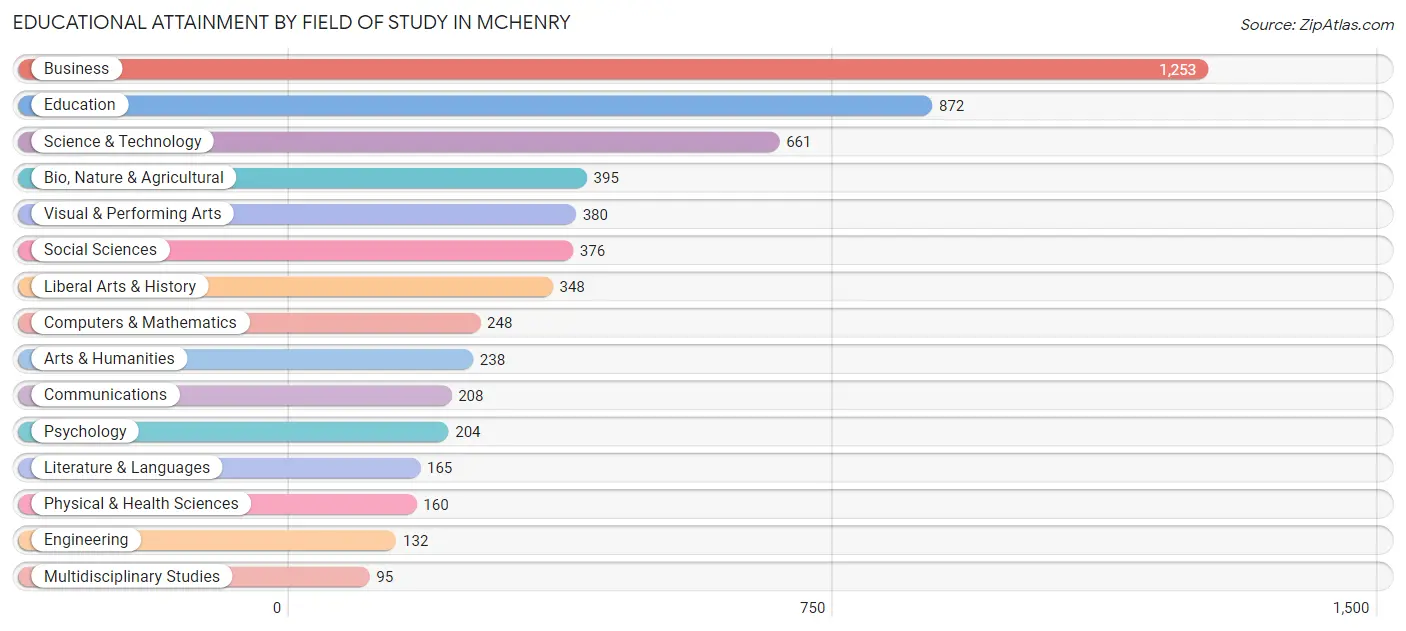
| Field of Study | # Graduates | % Graduates |
| Computers & Mathematics | 248 | 4.3% |
| Bio, Nature & Agricultural | 395 | 6.9% |
| Physical & Health Sciences | 160 | 2.8% |
| Psychology | 204 | 3.6% |
| Social Sciences | 376 | 6.6% |
| Engineering | 132 | 2.3% |
| Multidisciplinary Studies | 95 | 1.7% |
| Science & Technology | 661 | 11.5% |
| Business | 1,253 | 21.8% |
| Education | 872 | 15.2% |
| Literature & Languages | 165 | 2.9% |
| Liberal Arts & History | 348 | 6.1% |
| Visual & Performing Arts | 380 | 6.6% |
| Communications | 208 | 3.6% |
| Arts & Humanities | 238 | 4.2% |
| Total | 5,735 | 100.0% |
Transportation & Commute in Mchenry
Vehicle Availability by Sex in Mchenry
The most prevalent vehicle ownership categories in Mchenry are males with 2 vehicles (3,391, accounting for 42.5%) and females with 2 vehicles (2,758, making up 50.0%).
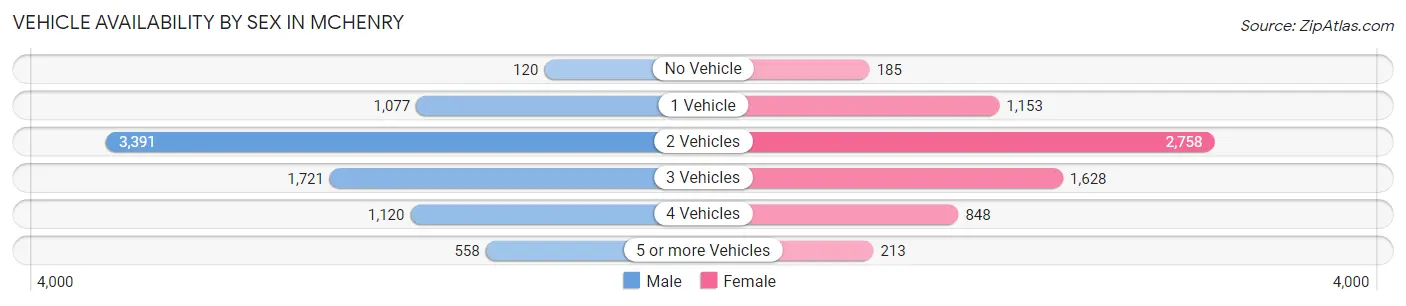
| Vehicles Available | Male | Female |
| No Vehicle | 120 (1.5%) | 185 (2.7%) |
| 1 Vehicle | 1,077 (13.5%) | 1,153 (17.0%) |
| 2 Vehicles | 3,391 (42.5%) | 2,758 (40.6%) |
| 3 Vehicles | 1,721 (21.5%) | 1,628 (24.0%) |
| 4 Vehicles | 1,120 (14.0%) | 848 (12.5%) |
| 5 or more Vehicles | 558 (7.0%) | 213 (3.1%) |
| Total | 7,987 (100.0%) | 6,785 (100.0%) |
Commute Time in Mchenry
The most frequently occuring commute durations in Mchenry are 15 to 19 minutes (1,728 commuters, 13.3%), 45 to 59 minutes (1,588 commuters, 12.2%), and 10 to 14 minutes (1,515 commuters, 11.7%).
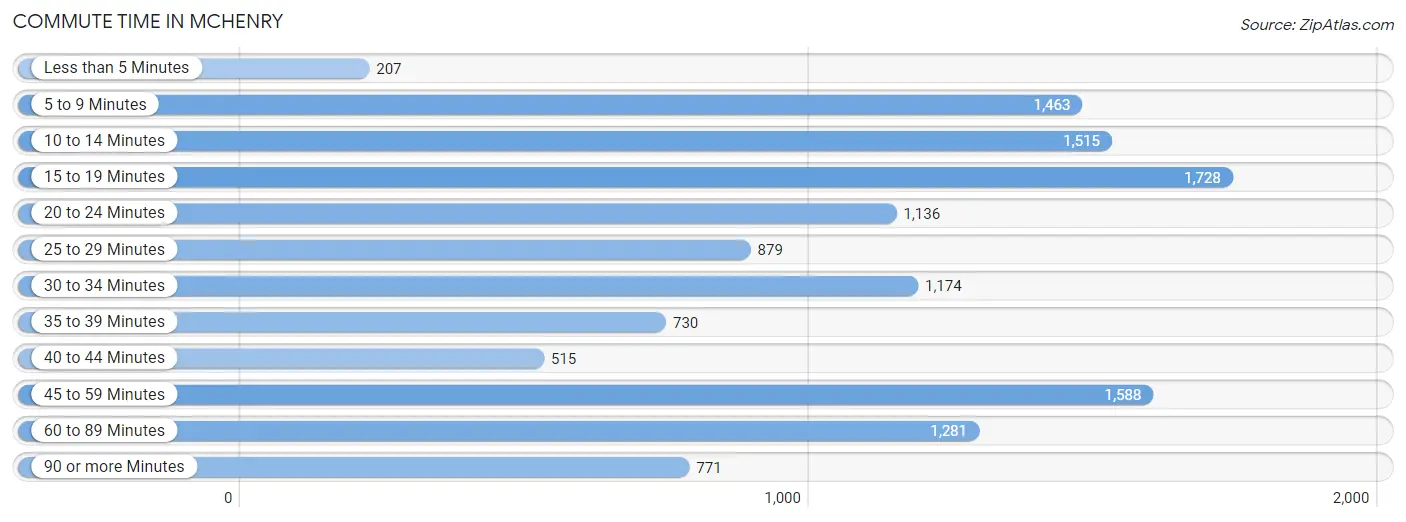
| Commute Time | # Commuters | % Commuters |
| Less than 5 Minutes | 207 | 1.6% |
| 5 to 9 Minutes | 1,463 | 11.3% |
| 10 to 14 Minutes | 1,515 | 11.7% |
| 15 to 19 Minutes | 1,728 | 13.3% |
| 20 to 24 Minutes | 1,136 | 8.7% |
| 25 to 29 Minutes | 879 | 6.8% |
| 30 to 34 Minutes | 1,174 | 9.0% |
| 35 to 39 Minutes | 730 | 5.6% |
| 40 to 44 Minutes | 515 | 4.0% |
| 45 to 59 Minutes | 1,588 | 12.2% |
| 60 to 89 Minutes | 1,281 | 9.9% |
| 90 or more Minutes | 771 | 5.9% |
Commute Time by Sex in Mchenry
The most common commute times in Mchenry are 15 to 19 minutes (969 commuters, 13.6%) for males and 5 to 9 minutes (915 commuters, 15.6%) for females.
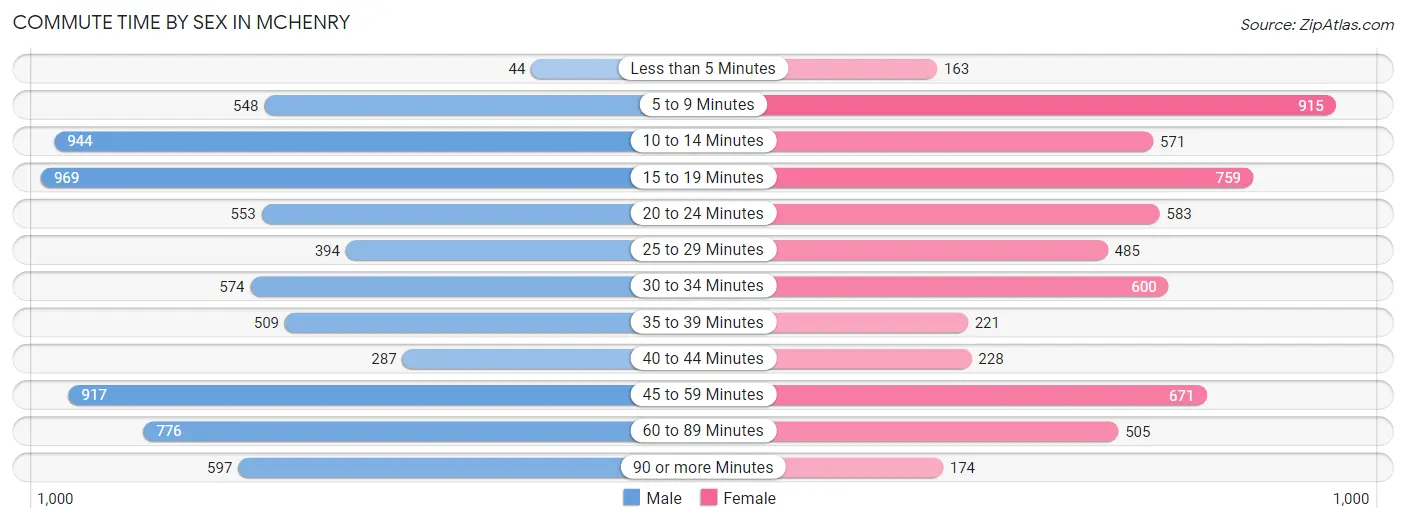
| Commute Time | Male | Female |
| Less than 5 Minutes | 44 (0.6%) | 163 (2.8%) |
| 5 to 9 Minutes | 548 (7.7%) | 915 (15.6%) |
| 10 to 14 Minutes | 944 (13.3%) | 571 (9.7%) |
| 15 to 19 Minutes | 969 (13.6%) | 759 (12.9%) |
| 20 to 24 Minutes | 553 (7.8%) | 583 (9.9%) |
| 25 to 29 Minutes | 394 (5.5%) | 485 (8.3%) |
| 30 to 34 Minutes | 574 (8.1%) | 600 (10.2%) |
| 35 to 39 Minutes | 509 (7.2%) | 221 (3.8%) |
| 40 to 44 Minutes | 287 (4.0%) | 228 (3.9%) |
| 45 to 59 Minutes | 917 (12.9%) | 671 (11.4%) |
| 60 to 89 Minutes | 776 (10.9%) | 505 (8.6%) |
| 90 or more Minutes | 597 (8.4%) | 174 (3.0%) |
Time of Departure to Work by Sex in Mchenry
The most frequent times of departure to work in Mchenry are 6:00 AM to 6:29 AM (986, 13.9%) for males and 6:30 AM to 6:59 AM (1,047, 17.8%) for females.
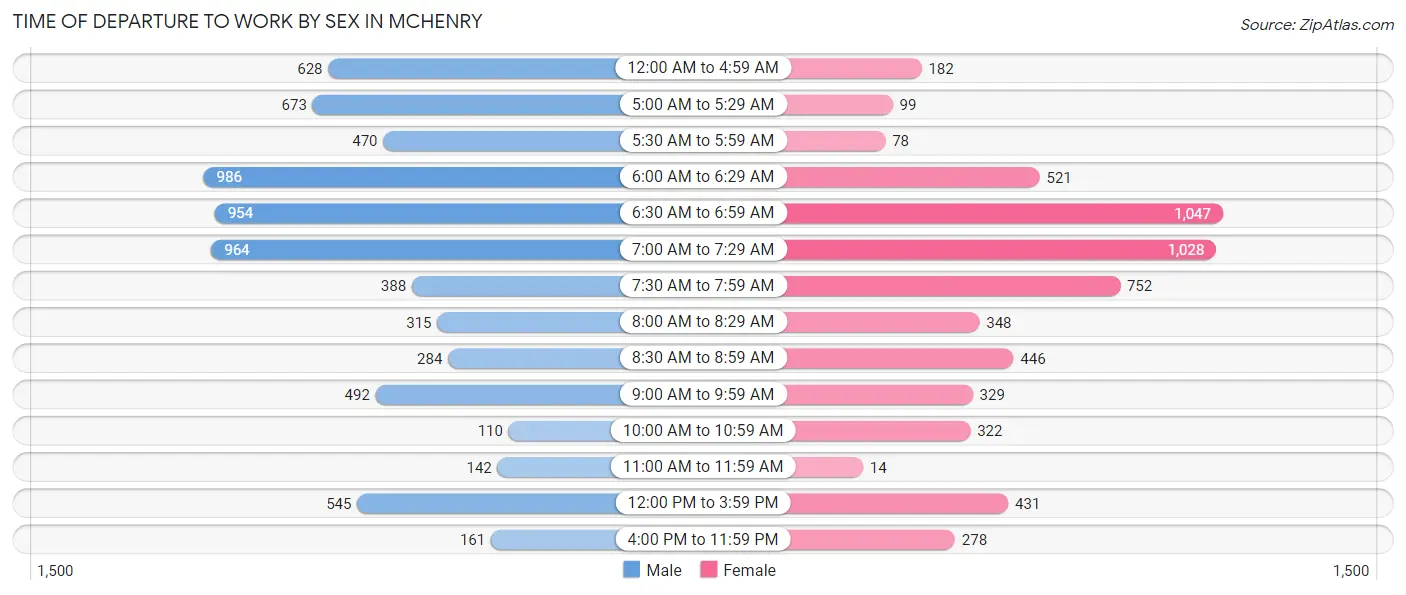
| Time of Departure | Male | Female |
| 12:00 AM to 4:59 AM | 628 (8.8%) | 182 (3.1%) |
| 5:00 AM to 5:29 AM | 673 (9.5%) | 99 (1.7%) |
| 5:30 AM to 5:59 AM | 470 (6.6%) | 78 (1.3%) |
| 6:00 AM to 6:29 AM | 986 (13.9%) | 521 (8.9%) |
| 6:30 AM to 6:59 AM | 954 (13.4%) | 1,047 (17.8%) |
| 7:00 AM to 7:29 AM | 964 (13.6%) | 1,028 (17.5%) |
| 7:30 AM to 7:59 AM | 388 (5.5%) | 752 (12.8%) |
| 8:00 AM to 8:29 AM | 315 (4.4%) | 348 (5.9%) |
| 8:30 AM to 8:59 AM | 284 (4.0%) | 446 (7.6%) |
| 9:00 AM to 9:59 AM | 492 (6.9%) | 329 (5.6%) |
| 10:00 AM to 10:59 AM | 110 (1.5%) | 322 (5.5%) |
| 11:00 AM to 11:59 AM | 142 (2.0%) | 14 (0.2%) |
| 12:00 PM to 3:59 PM | 545 (7.7%) | 431 (7.3%) |
| 4:00 PM to 11:59 PM | 161 (2.3%) | 278 (4.7%) |
| Total | 7,112 (100.0%) | 5,875 (100.0%) |
Housing Occupancy in Mchenry
Occupancy by Ownership in Mchenry
Of the total 11,228 dwellings in Mchenry, owner-occupied units account for 8,442 (75.2%), while renter-occupied units make up 2,786 (24.8%).
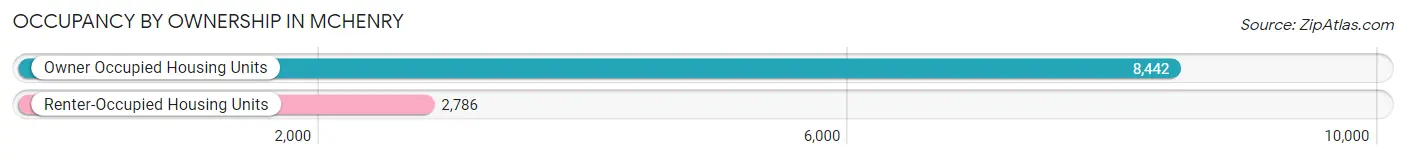
| Occupancy | # Housing Units | % Housing Units |
| Owner Occupied Housing Units | 8,442 | 75.2% |
| Renter-Occupied Housing Units | 2,786 | 24.8% |
| Total Occupied Housing Units | 11,228 | 100.0% |
Occupancy by Household Size in Mchenry
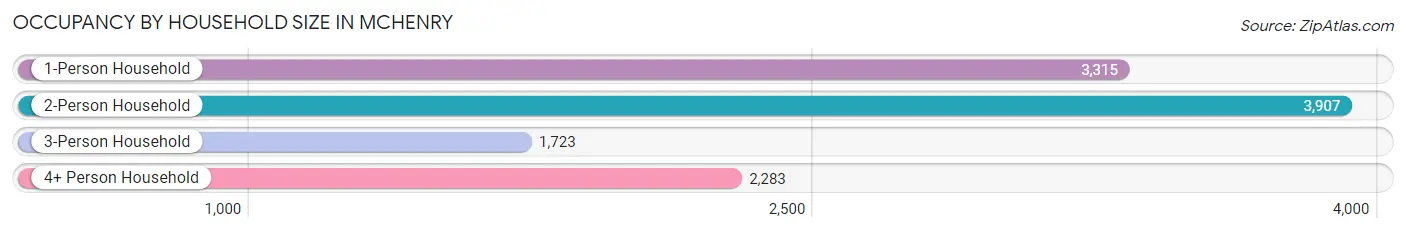
| Household Size | # Housing Units | % Housing Units |
| 1-Person Household | 3,315 | 29.5% |
| 2-Person Household | 3,907 | 34.8% |
| 3-Person Household | 1,723 | 15.3% |
| 4+ Person Household | 2,283 | 20.3% |
| Total Housing Units | 11,228 | 100.0% |
Occupancy by Ownership by Household Size in Mchenry
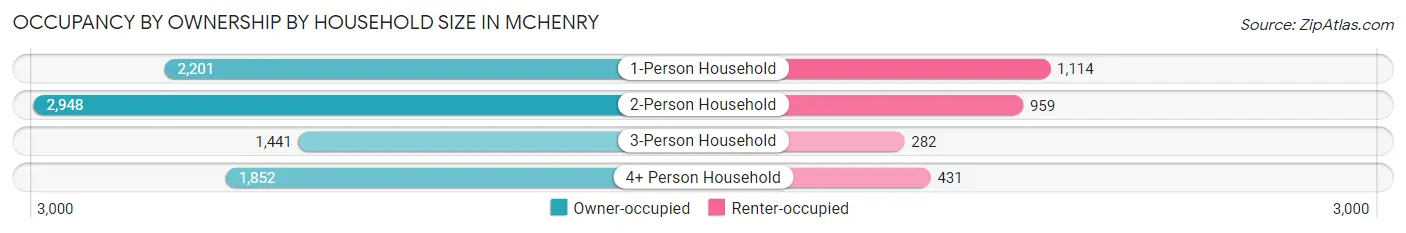
| Household Size | Owner-occupied | Renter-occupied |
| 1-Person Household | 2,201 (66.4%) | 1,114 (33.6%) |
| 2-Person Household | 2,948 (75.4%) | 959 (24.5%) |
| 3-Person Household | 1,441 (83.6%) | 282 (16.4%) |
| 4+ Person Household | 1,852 (81.1%) | 431 (18.9%) |
| Total Housing Units | 8,442 (75.2%) | 2,786 (24.8%) |
Occupancy by Educational Attainment in Mchenry
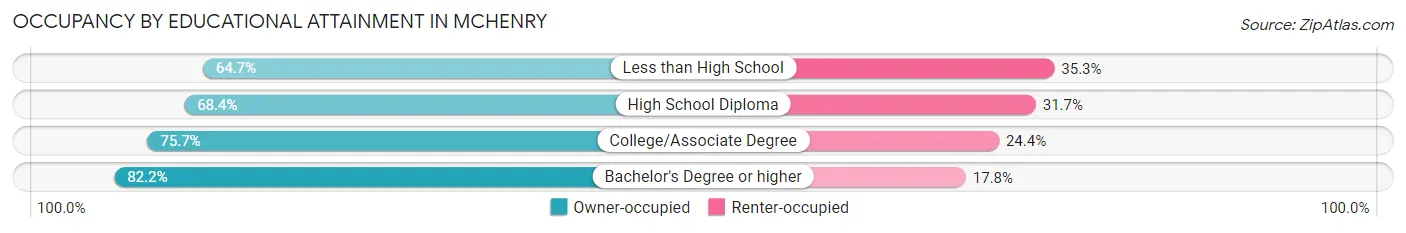
| Household Size | Owner-occupied | Renter-occupied |
| Less than High School | 485 (64.7%) | 265 (35.3%) |
| High School Diploma | 1,931 (68.3%) | 894 (31.7%) |
| College/Associate Degree | 3,066 (75.6%) | 987 (24.3%) |
| Bachelor's Degree or higher | 2,960 (82.2%) | 640 (17.8%) |
Occupancy by Age of Householder in Mchenry
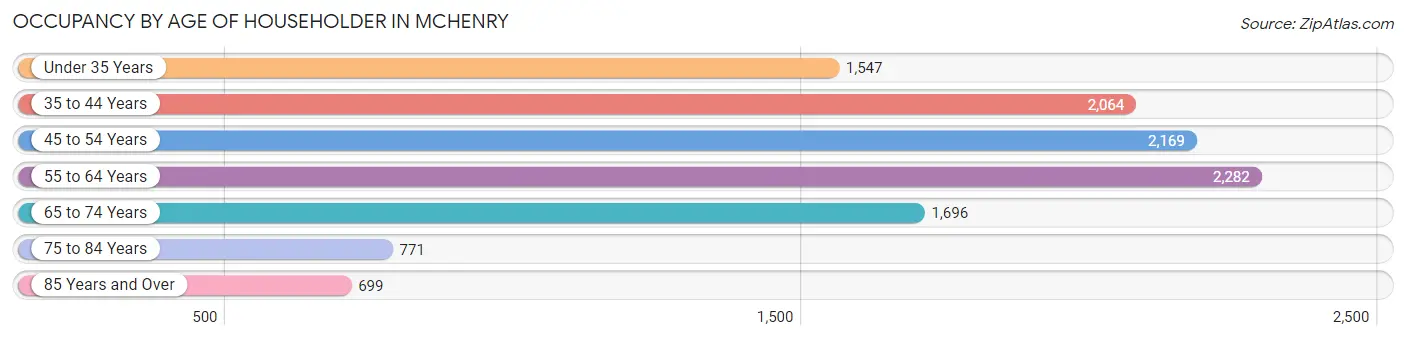
| Age Bracket | # Households | % Households |
| Under 35 Years | 1,547 | 13.8% |
| 35 to 44 Years | 2,064 | 18.4% |
| 45 to 54 Years | 2,169 | 19.3% |
| 55 to 64 Years | 2,282 | 20.3% |
| 65 to 74 Years | 1,696 | 15.1% |
| 75 to 84 Years | 771 | 6.9% |
| 85 Years and Over | 699 | 6.2% |
| Total | 11,228 | 100.0% |
Housing Finances in Mchenry
Median Income by Occupancy in Mchenry
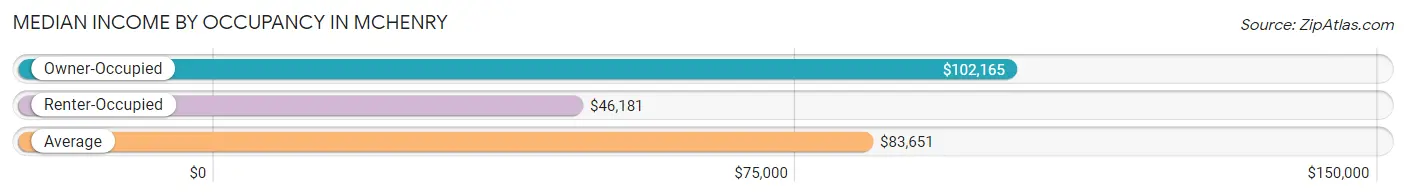
| Occupancy Type | # Households | Median Income |
| Owner-Occupied | 8,442 (75.2%) | $102,165 |
| Renter-Occupied | 2,786 (24.8%) | $46,181 |
| Average | 11,228 (100.0%) | $83,651 |
Occupancy by Householder Income Bracket in Mchenry
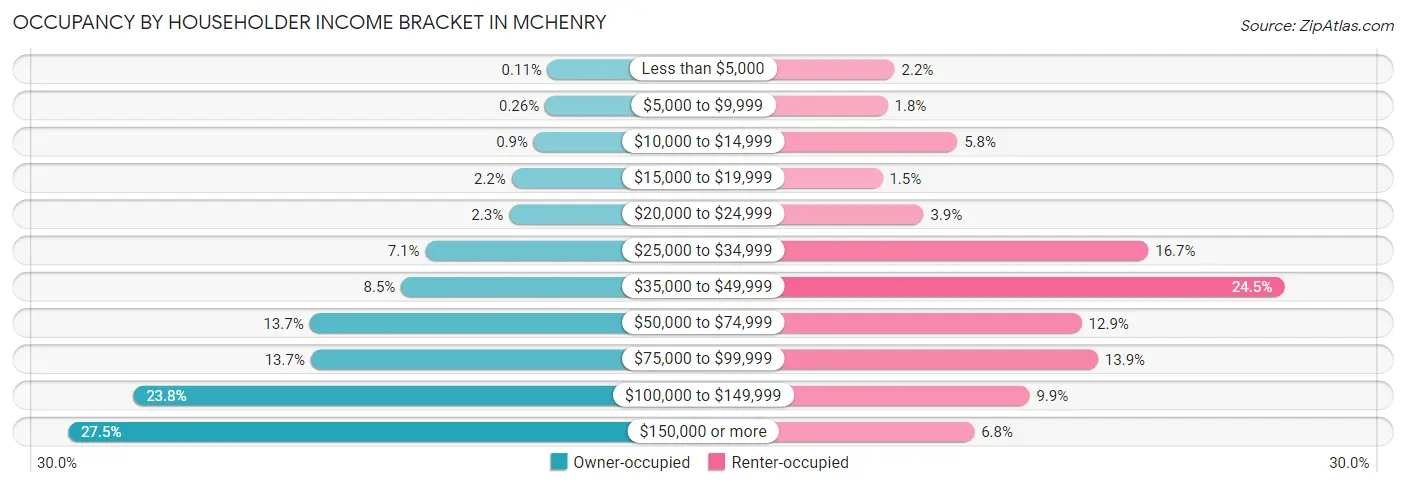
| Income Bracket | Owner-occupied | Renter-occupied |
| Less than $5,000 | 9 (0.1%) | 62 (2.2%) |
| $5,000 to $9,999 | 22 (0.3%) | 51 (1.8%) |
| $10,000 to $14,999 | 76 (0.9%) | 162 (5.8%) |
| $15,000 to $19,999 | 183 (2.2%) | 43 (1.5%) |
| $20,000 to $24,999 | 196 (2.3%) | 108 (3.9%) |
| $25,000 to $34,999 | 599 (7.1%) | 466 (16.7%) |
| $35,000 to $49,999 | 716 (8.5%) | 682 (24.5%) |
| $50,000 to $74,999 | 1,158 (13.7%) | 360 (12.9%) |
| $75,000 to $99,999 | 1,152 (13.7%) | 386 (13.9%) |
| $100,000 to $149,999 | 2,008 (23.8%) | 277 (9.9%) |
| $150,000 or more | 2,323 (27.5%) | 189 (6.8%) |
| Total | 8,442 (100.0%) | 2,786 (100.0%) |
Monthly Housing Cost Tiers in Mchenry
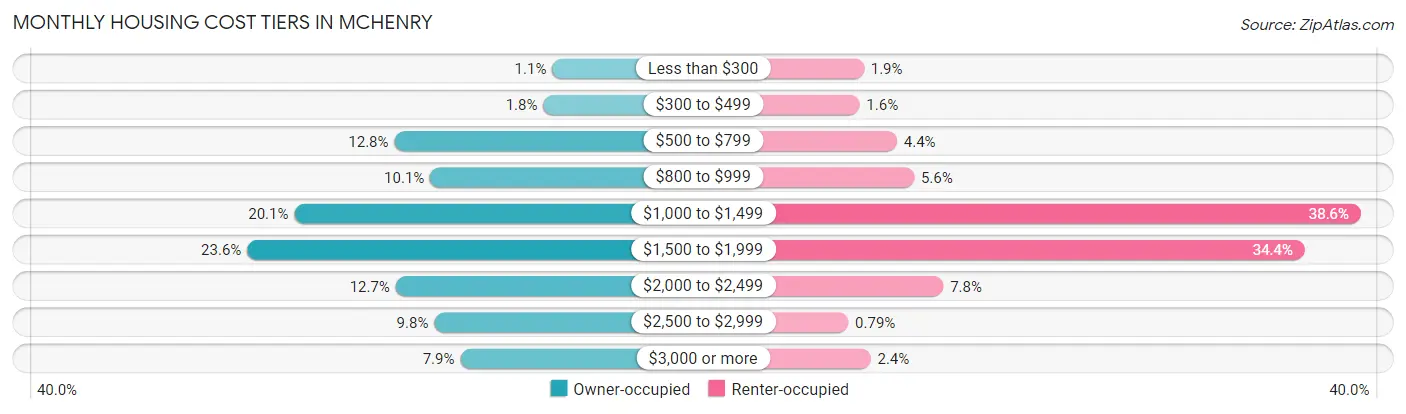
| Monthly Cost | Owner-occupied | Renter-occupied |
| Less than $300 | 96 (1.1%) | 54 (1.9%) |
| $300 to $499 | 152 (1.8%) | 45 (1.6%) |
| $500 to $799 | 1,078 (12.8%) | 122 (4.4%) |
| $800 to $999 | 855 (10.1%) | 157 (5.6%) |
| $1,000 to $1,499 | 1,700 (20.1%) | 1,074 (38.6%) |
| $1,500 to $1,999 | 1,993 (23.6%) | 959 (34.4%) |
| $2,000 to $2,499 | 1,070 (12.7%) | 217 (7.8%) |
| $2,500 to $2,999 | 830 (9.8%) | 22 (0.8%) |
| $3,000 or more | 668 (7.9%) | 68 (2.4%) |
| Total | 8,442 (100.0%) | 2,786 (100.0%) |
Physical Housing Characteristics in Mchenry
Housing Structures in Mchenry
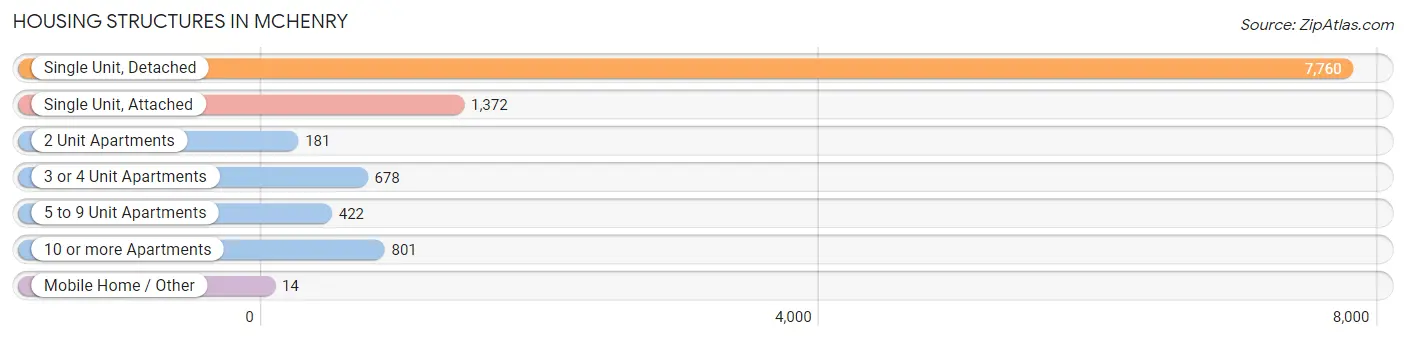
| Structure Type | # Housing Units | % Housing Units |
| Single Unit, Detached | 7,760 | 69.1% |
| Single Unit, Attached | 1,372 | 12.2% |
| 2 Unit Apartments | 181 | 1.6% |
| 3 or 4 Unit Apartments | 678 | 6.0% |
| 5 to 9 Unit Apartments | 422 | 3.8% |
| 10 or more Apartments | 801 | 7.1% |
| Mobile Home / Other | 14 | 0.1% |
| Total | 11,228 | 100.0% |
Housing Structures by Occupancy in Mchenry
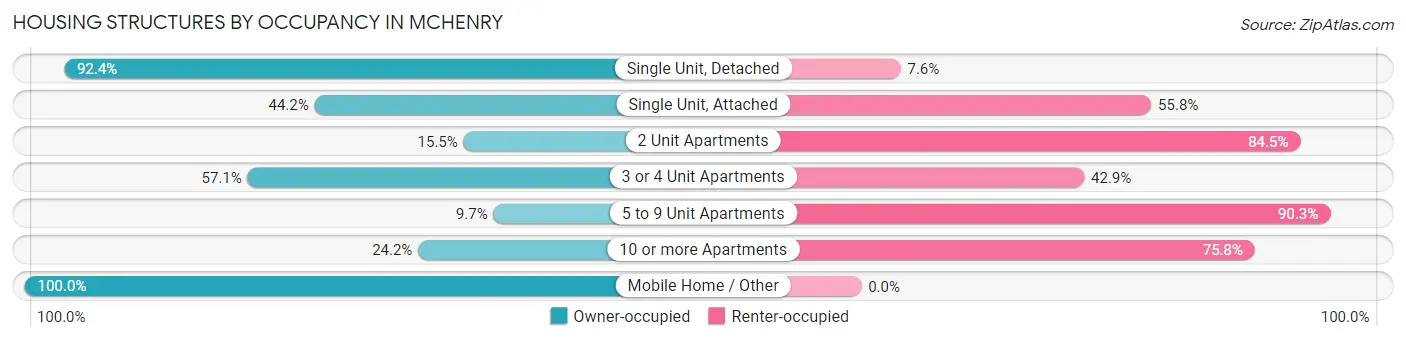
| Structure Type | Owner-occupied | Renter-occupied |
| Single Unit, Detached | 7,172 (92.4%) | 588 (7.6%) |
| Single Unit, Attached | 606 (44.2%) | 766 (55.8%) |
| 2 Unit Apartments | 28 (15.5%) | 153 (84.5%) |
| 3 or 4 Unit Apartments | 387 (57.1%) | 291 (42.9%) |
| 5 to 9 Unit Apartments | 41 (9.7%) | 381 (90.3%) |
| 10 or more Apartments | 194 (24.2%) | 607 (75.8%) |
| Mobile Home / Other | 14 (100.0%) | 0 (0.0%) |
| Total | 8,442 (75.2%) | 2,786 (24.8%) |
Housing Structures by Number of Rooms in Mchenry
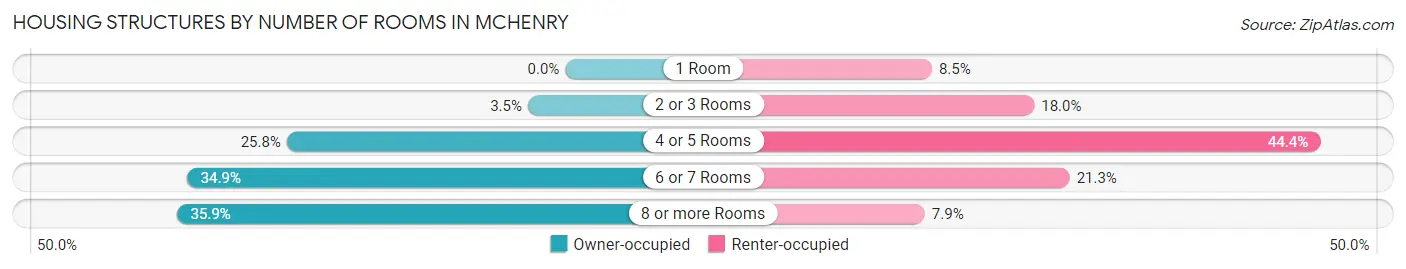
| Number of Rooms | Owner-occupied | Renter-occupied |
| 1 Room | 0 (0.0%) | 237 (8.5%) |
| 2 or 3 Rooms | 292 (3.5%) | 501 (18.0%) |
| 4 or 5 Rooms | 2,175 (25.8%) | 1,237 (44.4%) |
| 6 or 7 Rooms | 2,948 (34.9%) | 592 (21.2%) |
| 8 or more Rooms | 3,027 (35.9%) | 219 (7.9%) |
| Total | 8,442 (100.0%) | 2,786 (100.0%) |
Housing Structure by Heating Type in Mchenry
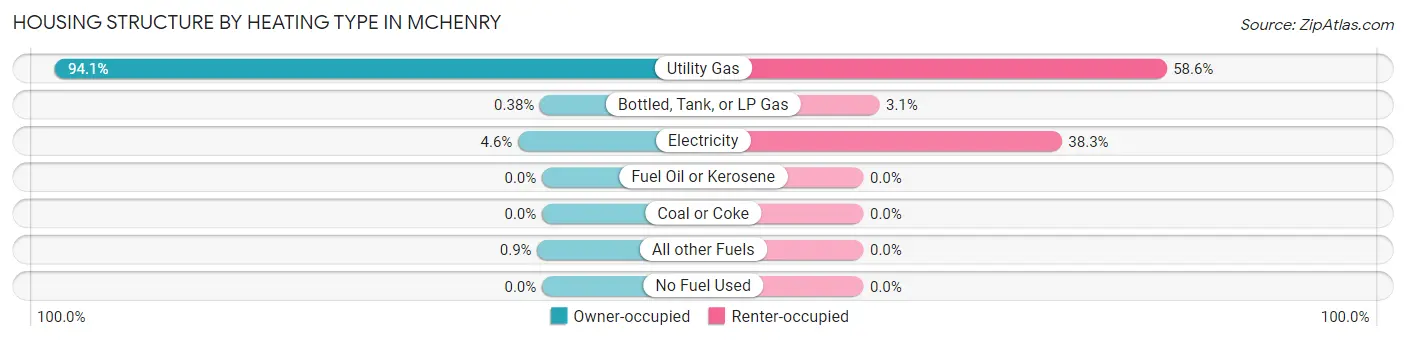
| Heating Type | Owner-occupied | Renter-occupied |
| Utility Gas | 7,944 (94.1%) | 1,632 (58.6%) |
| Bottled, Tank, or LP Gas | 32 (0.4%) | 86 (3.1%) |
| Electricity | 390 (4.6%) | 1,068 (38.3%) |
| Fuel Oil or Kerosene | 0 (0.0%) | 0 (0.0%) |
| Coal or Coke | 0 (0.0%) | 0 (0.0%) |
| All other Fuels | 76 (0.9%) | 0 (0.0%) |
| No Fuel Used | 0 (0.0%) | 0 (0.0%) |
| Total | 8,442 (100.0%) | 2,786 (100.0%) |
Household Vehicle Usage in Mchenry
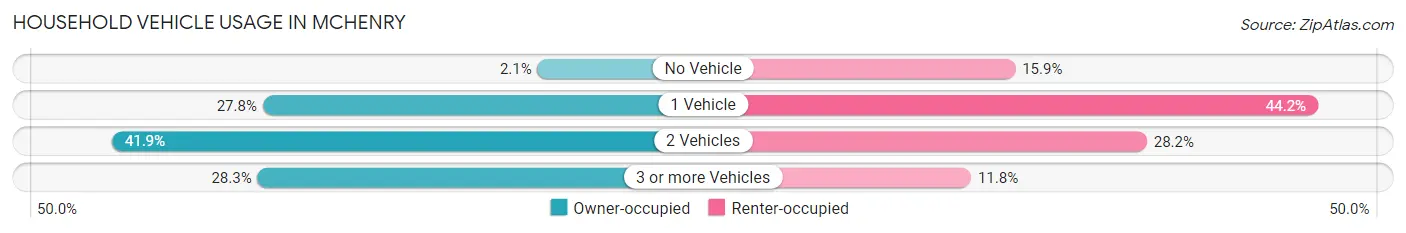
| Vehicles per Household | Owner-occupied | Renter-occupied |
| No Vehicle | 179 (2.1%) | 443 (15.9%) |
| 1 Vehicle | 2,344 (27.8%) | 1,230 (44.2%) |
| 2 Vehicles | 3,533 (41.8%) | 785 (28.2%) |
| 3 or more Vehicles | 2,386 (28.3%) | 328 (11.8%) |
| Total | 8,442 (100.0%) | 2,786 (100.0%) |
Real Estate & Mortgages in Mchenry
Real Estate and Mortgage Overview in Mchenry
| Characteristic | Without Mortgage | With Mortgage |
| Housing Units | 2,340 | 6,102 |
| Median Property Value | $213,200 | $232,700 |
| Median Household Income | $71,250 | $1,871 |
| Monthly Housing Costs | $797 | $592 |
| Real Estate Taxes | $5,919 | $63 |
Property Value by Mortgage Status in Mchenry
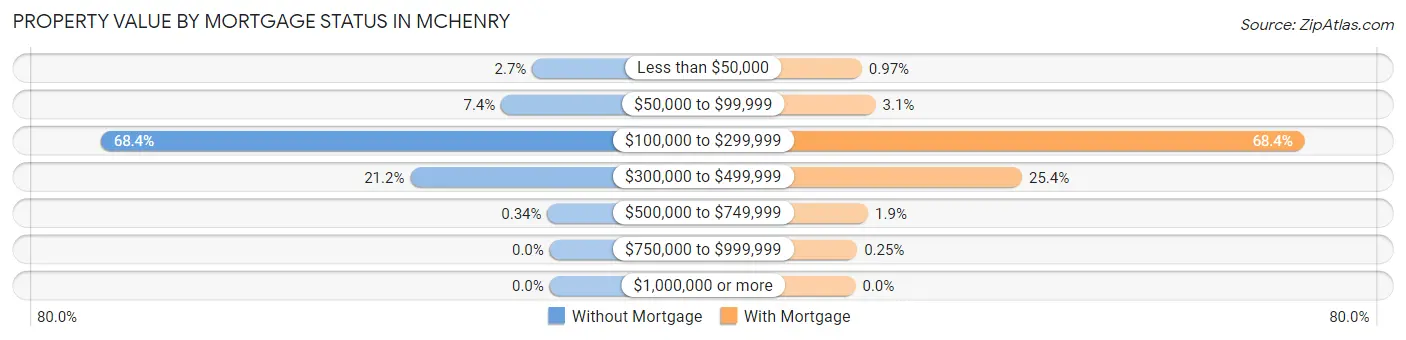
| Property Value | Without Mortgage | With Mortgage |
| Less than $50,000 | 62 (2.6%) | 59 (1.0%) |
| $50,000 to $99,999 | 173 (7.4%) | 187 (3.1%) |
| $100,000 to $299,999 | 1,600 (68.4%) | 4,176 (68.4%) |
| $300,000 to $499,999 | 497 (21.2%) | 1,548 (25.4%) |
| $500,000 to $749,999 | 8 (0.3%) | 117 (1.9%) |
| $750,000 to $999,999 | 0 (0.0%) | 15 (0.3%) |
| $1,000,000 or more | 0 (0.0%) | 0 (0.0%) |
| Total | 2,340 (100.0%) | 6,102 (100.0%) |
Household Income by Mortgage Status in Mchenry
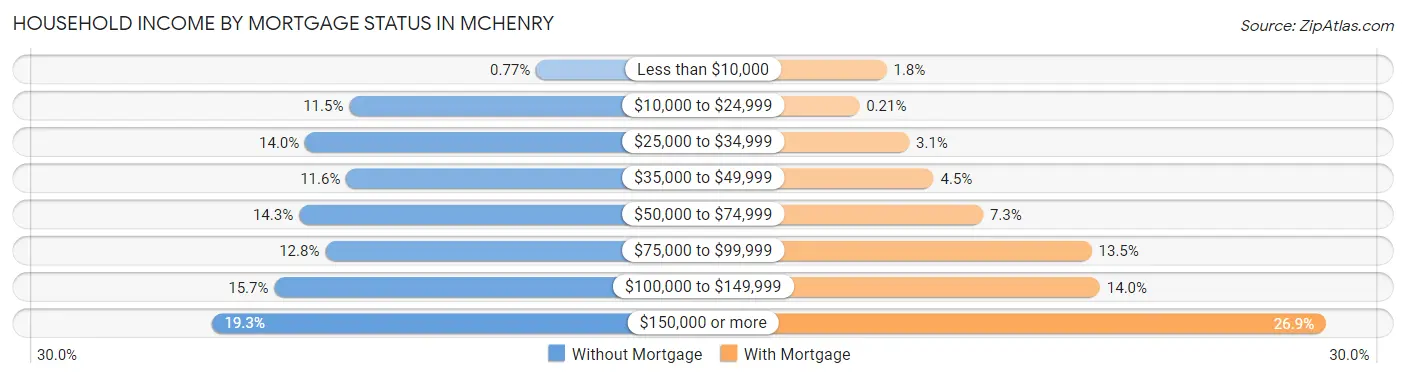
| Household Income | Without Mortgage | With Mortgage |
| Less than $10,000 | 18 (0.8%) | 108 (1.8%) |
| $10,000 to $24,999 | 268 (11.5%) | 13 (0.2%) |
| $25,000 to $34,999 | 327 (14.0%) | 187 (3.1%) |
| $35,000 to $49,999 | 272 (11.6%) | 272 (4.5%) |
| $50,000 to $74,999 | 335 (14.3%) | 444 (7.3%) |
| $75,000 to $99,999 | 300 (12.8%) | 823 (13.5%) |
| $100,000 to $149,999 | 368 (15.7%) | 852 (14.0%) |
| $150,000 or more | 452 (19.3%) | 1,640 (26.9%) |
| Total | 2,340 (100.0%) | 6,102 (100.0%) |
Property Value to Household Income Ratio in Mchenry
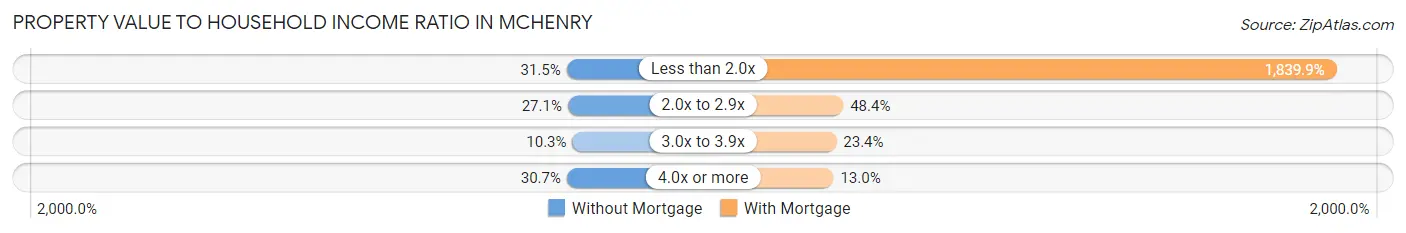
| Value-to-Income Ratio | Without Mortgage | With Mortgage |
| Less than 2.0x | 736 (31.5%) | 112,271 (1,839.9%) |
| 2.0x to 2.9x | 635 (27.1%) | 2,956 (48.4%) |
| 3.0x to 3.9x | 242 (10.3%) | 1,428 (23.4%) |
| 4.0x or more | 718 (30.7%) | 794 (13.0%) |
| Total | 2,340 (100.0%) | 6,102 (100.0%) |
Real Estate Taxes by Mortgage Status in Mchenry
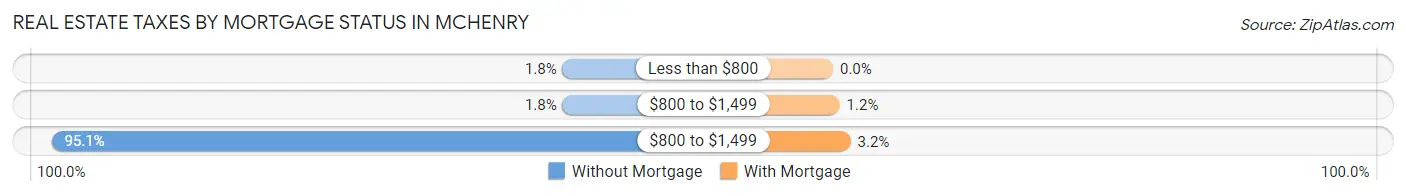
| Property Taxes | Without Mortgage | With Mortgage |
| Less than $800 | 41 (1.8%) | 0 (0.0%) |
| $800 to $1,499 | 41 (1.8%) | 74 (1.2%) |
| $800 to $1,499 | 2,225 (95.1%) | 195 (3.2%) |
| Total | 2,340 (100.0%) | 6,102 (100.0%) |
Health & Disability in Mchenry
Health Insurance Coverage by Age in Mchenry
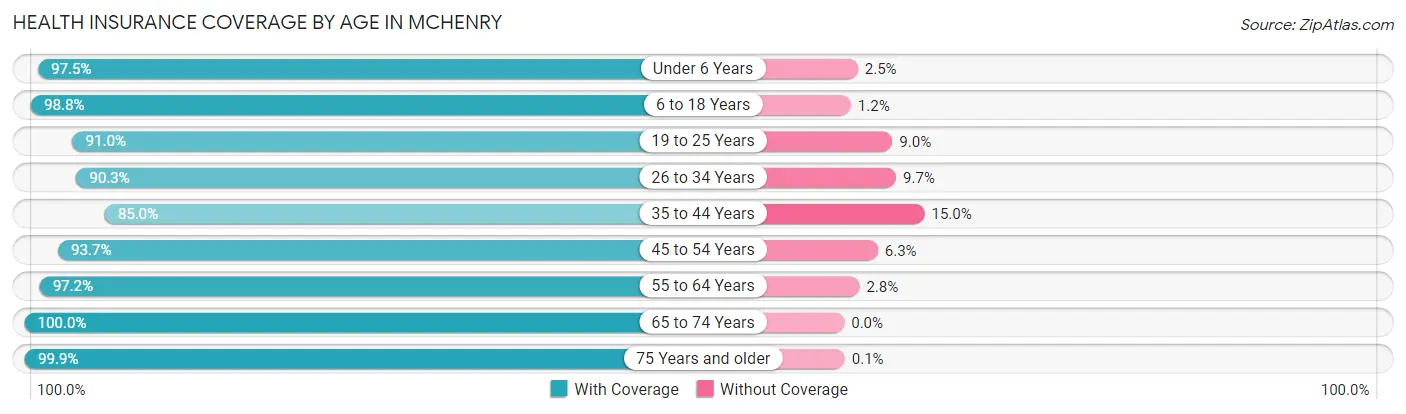
| Age Bracket | With Coverage | Without Coverage |
| Under 6 Years | 1,698 (97.5%) | 44 (2.5%) |
| 6 to 18 Years | 3,921 (98.8%) | 49 (1.2%) |
| 19 to 25 Years | 1,919 (91.0%) | 189 (9.0%) |
| 26 to 34 Years | 2,739 (90.3%) | 293 (9.7%) |
| 35 to 44 Years | 3,290 (85.0%) | 579 (15.0%) |
| 45 to 54 Years | 3,517 (93.7%) | 235 (6.3%) |
| 55 to 64 Years | 3,845 (97.2%) | 112 (2.8%) |
| 65 to 74 Years | 2,873 (100.0%) | 0 (0.0%) |
| 75 Years and older | 1,965 (99.9%) | 2 (0.1%) |
| Total | 25,767 (94.5%) | 1,503 (5.5%) |
Health Insurance Coverage by Citizenship Status in Mchenry
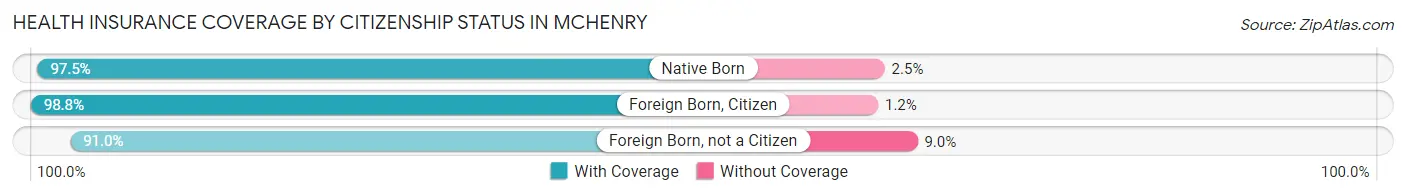
| Citizenship Status | With Coverage | Without Coverage |
| Native Born | 1,698 (97.5%) | 44 (2.5%) |
| Foreign Born, Citizen | 3,921 (98.8%) | 49 (1.2%) |
| Foreign Born, not a Citizen | 1,919 (91.0%) | 189 (9.0%) |
Health Insurance Coverage by Household Income in Mchenry
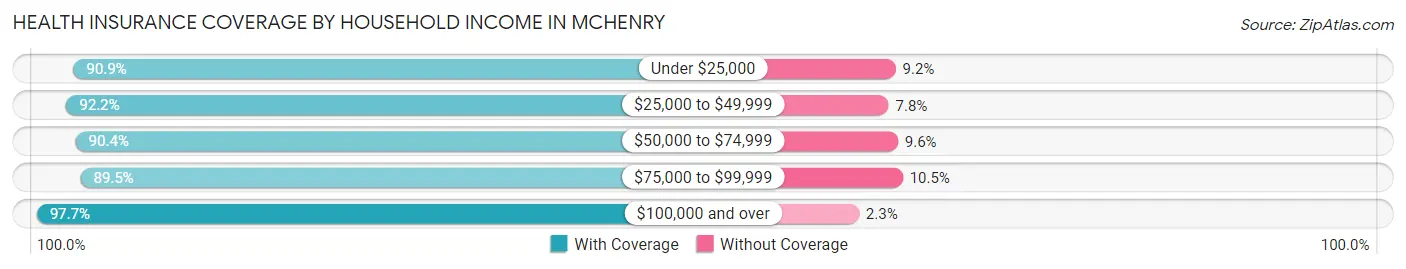
| Household Income | With Coverage | Without Coverage |
| Under $25,000 | 1,331 (90.8%) | 134 (9.1%) |
| $25,000 to $49,999 | 3,745 (92.2%) | 318 (7.8%) |
| $50,000 to $74,999 | 2,826 (90.4%) | 299 (9.6%) |
| $75,000 to $99,999 | 3,490 (89.5%) | 408 (10.5%) |
| $100,000 and over | 14,345 (97.7%) | 333 (2.3%) |
Public vs Private Health Insurance Coverage by Age in Mchenry
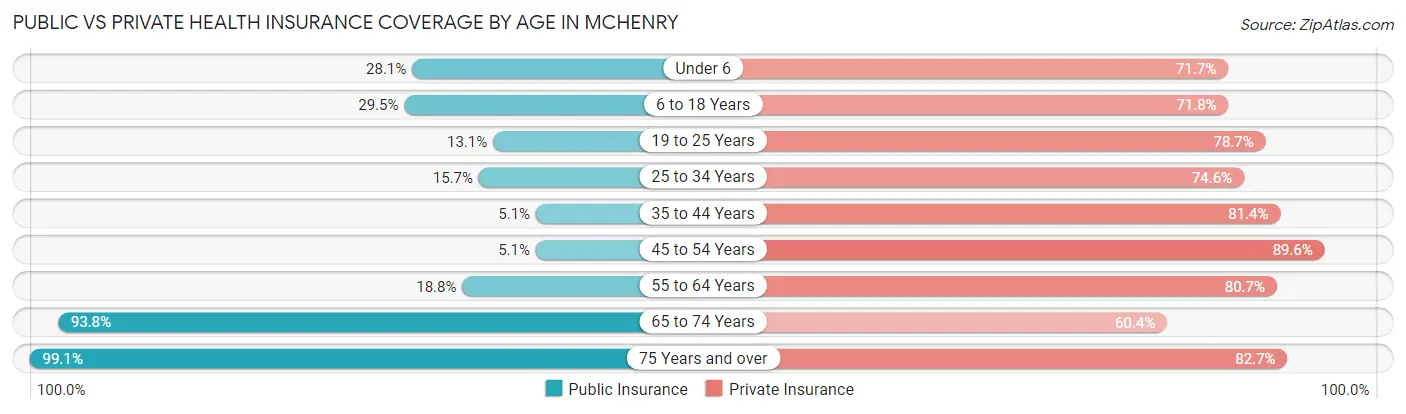
| Age Bracket | Public Insurance | Private Insurance |
| Under 6 | 489 (28.1%) | 1,249 (71.7%) |
| 6 to 18 Years | 1,172 (29.5%) | 2,849 (71.8%) |
| 19 to 25 Years | 275 (13.1%) | 1,658 (78.6%) |
| 25 to 34 Years | 476 (15.7%) | 2,263 (74.6%) |
| 35 to 44 Years | 197 (5.1%) | 3,149 (81.4%) |
| 45 to 54 Years | 192 (5.1%) | 3,363 (89.6%) |
| 55 to 64 Years | 742 (18.8%) | 3,195 (80.7%) |
| 65 to 74 Years | 2,696 (93.8%) | 1,735 (60.4%) |
| 75 Years and over | 1,949 (99.1%) | 1,627 (82.7%) |
| Total | 8,188 (30.0%) | 21,088 (77.3%) |
Disability Status by Sex by Age in Mchenry
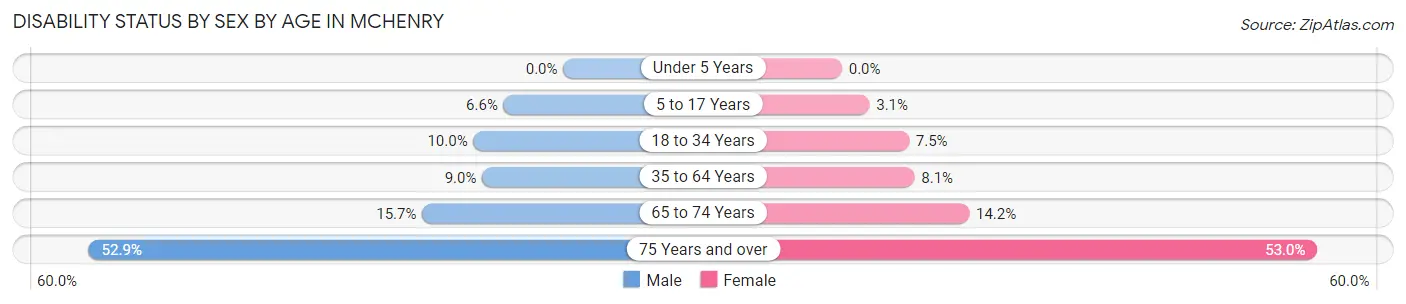
| Age Bracket | Male | Female |
| Under 5 Years | 0 (0.0%) | 0 (0.0%) |
| 5 to 17 Years | 138 (6.6%) | 60 (3.1%) |
| 18 to 34 Years | 282 (10.0%) | 186 (7.5%) |
| 35 to 64 Years | 521 (9.0%) | 469 (8.1%) |
| 65 to 74 Years | 233 (15.7%) | 197 (14.2%) |
| 75 Years and over | 342 (52.9%) | 699 (52.9%) |
Disability Class by Sex by Age in Mchenry
Disability Class: Hearing Difficulty
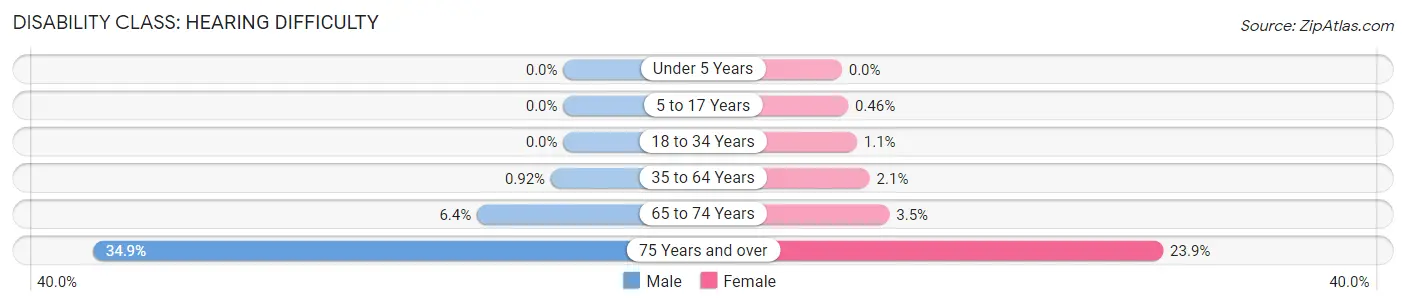
| Age Bracket | Male | Female |
| Under 5 Years | 0 (0.0%) | 0 (0.0%) |
| 5 to 17 Years | 0 (0.0%) | 9 (0.5%) |
| 18 to 34 Years | 0 (0.0%) | 28 (1.1%) |
| 35 to 64 Years | 53 (0.9%) | 120 (2.1%) |
| 65 to 74 Years | 95 (6.4%) | 49 (3.5%) |
| 75 Years and over | 226 (34.9%) | 315 (23.9%) |
Disability Class: Vision Difficulty
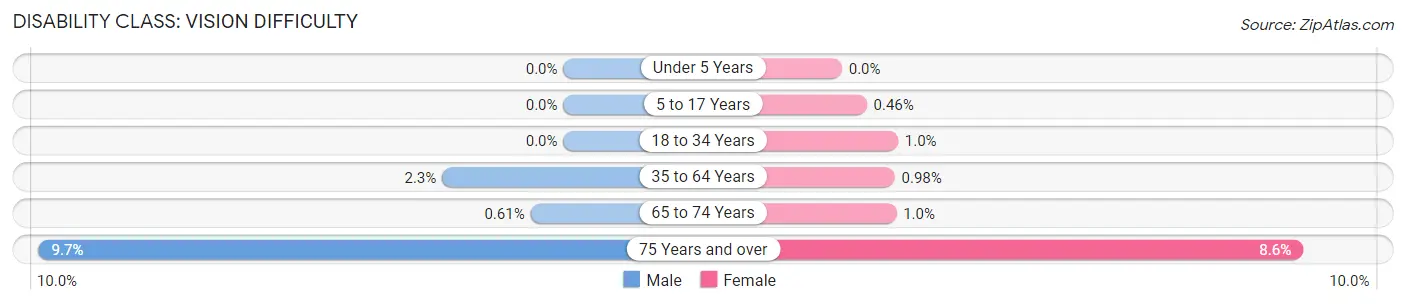
| Age Bracket | Male | Female |
| Under 5 Years | 0 (0.0%) | 0 (0.0%) |
| 5 to 17 Years | 0 (0.0%) | 9 (0.5%) |
| 18 to 34 Years | 0 (0.0%) | 26 (1.0%) |
| 35 to 64 Years | 130 (2.2%) | 57 (1.0%) |
| 65 to 74 Years | 9 (0.6%) | 14 (1.0%) |
| 75 Years and over | 63 (9.7%) | 113 (8.6%) |
Disability Class: Cognitive Difficulty
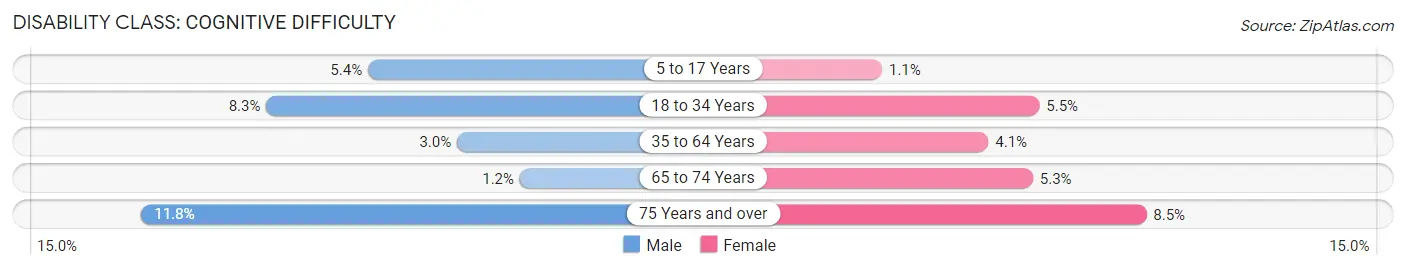
| Age Bracket | Male | Female |
| 5 to 17 Years | 113 (5.4%) | 22 (1.1%) |
| 18 to 34 Years | 233 (8.3%) | 137 (5.5%) |
| 35 to 64 Years | 171 (3.0%) | 237 (4.1%) |
| 65 to 74 Years | 18 (1.2%) | 74 (5.3%) |
| 75 Years and over | 76 (11.7%) | 112 (8.5%) |
Disability Class: Ambulatory Difficulty
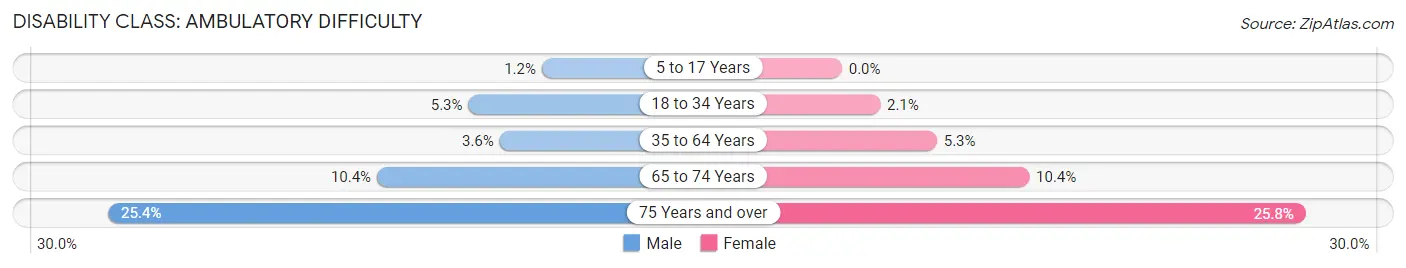
| Age Bracket | Male | Female |
| 5 to 17 Years | 25 (1.2%) | 0 (0.0%) |
| 18 to 34 Years | 149 (5.3%) | 53 (2.1%) |
| 35 to 64 Years | 205 (3.5%) | 307 (5.3%) |
| 65 to 74 Years | 154 (10.4%) | 145 (10.4%) |
| 75 Years and over | 164 (25.4%) | 341 (25.8%) |
Disability Class: Self-Care Difficulty
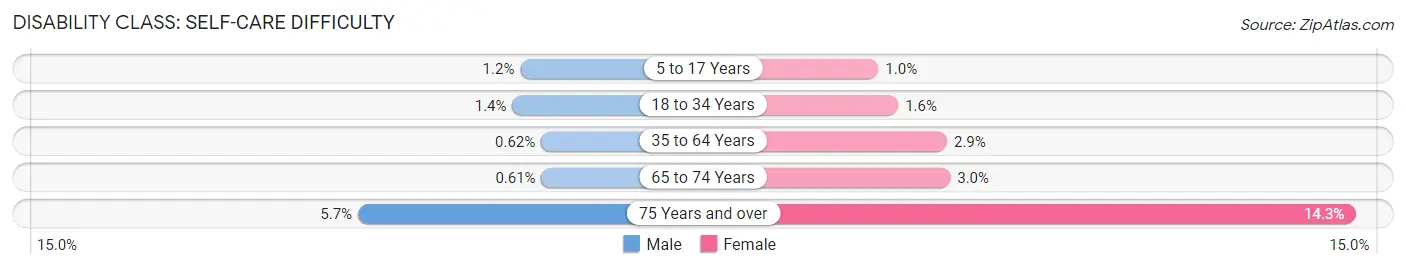
| Age Bracket | Male | Female |
| 5 to 17 Years | 25 (1.2%) | 20 (1.0%) |
| 18 to 34 Years | 40 (1.4%) | 39 (1.6%) |
| 35 to 64 Years | 36 (0.6%) | 170 (2.9%) |
| 65 to 74 Years | 9 (0.6%) | 42 (3.0%) |
| 75 Years and over | 37 (5.7%) | 189 (14.3%) |
Technology Access in Mchenry
Computing Device Access in Mchenry
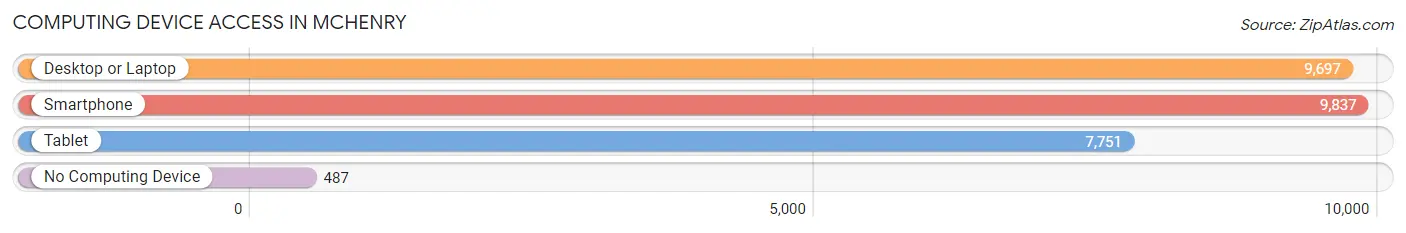
| Device Type | # Households | % Households |
| Desktop or Laptop | 9,697 | 86.4% |
| Smartphone | 9,837 | 87.6% |
| Tablet | 7,751 | 69.0% |
| No Computing Device | 487 | 4.3% |
| Total | 11,228 | 100.0% |
Internet Access in Mchenry
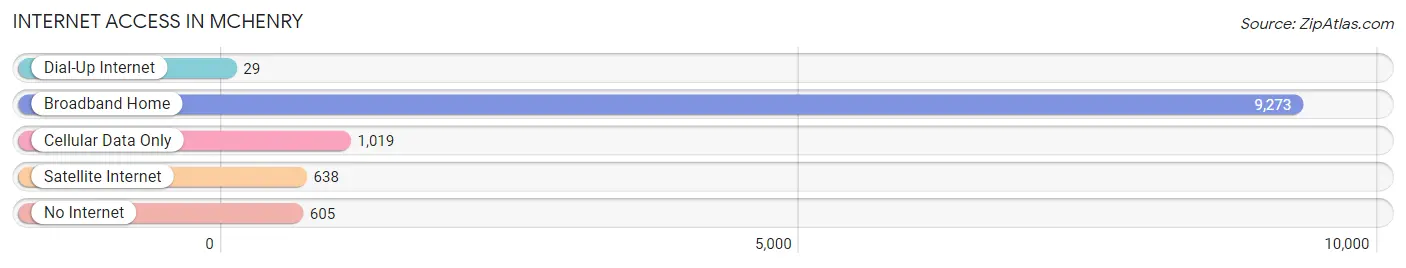
| Internet Type | # Households | % Households |
| Dial-Up Internet | 29 | 0.3% |
| Broadband Home | 9,273 | 82.6% |
| Cellular Data Only | 1,019 | 9.1% |
| Satellite Internet | 638 | 5.7% |
| No Internet | 605 | 5.4% |
| Total | 11,228 | 100.0% |
Mchenry Summary
McHenry, Illinois is a city located in McHenry County, Illinois, United States. The city is located about 50 miles northwest of Chicago and is part of the Chicago metropolitan area. As of the 2010 census, the city had a population of 26,992.
History
The area that is now McHenry was first settled in 1836 by settlers from New England. The city was named after Major William McHenry, a veteran of the War of 1812. The city was incorporated in 1855 and has grown steadily since then.
Geography
McHenry is located at 42°19'25" North, 88°20'30" West (42.323, -88.342). The city is situated on the Fox River, which flows through the city. The city has a total area of 8.7 square miles, of which 8.3 square miles is land and 0.4 square miles is water.
Economy
McHenry is a major economic center in the region. The city is home to several large employers, including McHenry County College, Centegra Health System, and the McHenry County government. The city also has a thriving retail sector, with several large shopping centers and a variety of restaurants and other businesses.
Demographics
As of the 2010 census, there were 26,992 people, 10,845 households, and 7,541 families residing in the city. The population density was 3,231.3 people per square mile. The racial makeup of the city was 90.2% White, 2.3% African American, 0.3% Native American, 3.2% Asian, 0.1% Pacific Islander, 2.2% from other races, and 1.7% from two or more races. Hispanic or Latino of any race were 6.7% of the population.
The median income for a household in the city was $62,945, and the median income for a family was $76,945. The per capita income for the city was $30,945. About 4.2% of families and 5.7% of the population were below the poverty line, including 8.2% of those under age 18 and 4.2% of those age 65 or over.
McHenry is a diverse city with a variety of cultures and backgrounds. The city is home to a large number of immigrants from Mexico, India, and other countries. The city also has a large number of retirees, as well as a growing number of young professionals.
Common Questions
What is Per Capita Income in Mchenry?
Per Capita income in Mchenry is $45,241.
What is the Median Family Income in Mchenry?
Median Family Income in Mchenry is $112,024.
What is the Median Household income in Mchenry?
Median Household Income in Mchenry is $83,651.
What is Income or Wage Gap in Mchenry?
Income or Wage Gap in Mchenry is 34.3%.
Women in Mchenry earn 65.7 cents for every dollar earned by a man.
What is Inequality or Gini Index in Mchenry?
Inequality or Gini Index in Mchenry is 0.41.
What is the Total Population of Mchenry?
Total Population of Mchenry is 27,493.
What is the Total Male Population of Mchenry?
Total Male Population of Mchenry is 13,525.
What is the Total Female Population of Mchenry?
Total Female Population of Mchenry is 13,968.
What is the Ratio of Males per 100 Females in Mchenry?
There are 96.83 Males per 100 Females in Mchenry.
What is the Ratio of Females per 100 Males in Mchenry?
There are 103.28 Females per 100 Males in Mchenry.
What is the Median Population Age in Mchenry?
Median Population Age in Mchenry is 43.1 Years.
What is the Average Family Size in Mchenry
Average Family Size in Mchenry is 3.0 People.
What is the Average Household Size in Mchenry
Average Household Size in Mchenry is 2.4 People.
How Large is the Labor Force in Mchenry?
There are 15,776 People in the Labor Forcein in Mchenry.
What is the Percentage of People in the Labor Force in Mchenry?
69.9% of People are in the Labor Force in Mchenry.
What is the Unemployment Rate in Mchenry?
Unemployment Rate in Mchenry is 4.3%.