Aviston, IL Map & Demographics
Aviston Map
Aviston Overview
$42,934
PER CAPITA INCOME
$116,324
AVG FAMILY INCOME
$99,821
AVG HOUSEHOLD INCOME
31.8%
WAGE / INCOME GAP [ % ]
68.2¢/ $1
WAGE / INCOME GAP [ $ ]
0.37
INEQUALITY / GINI INDEX
2,342
TOTAL POPULATION
1,125
MALE POPULATION
1,217
FEMALE POPULATION
92.44
MALES / 100 FEMALES
108.18
FEMALES / 100 MALES
35.3
MEDIAN AGE
3.1
AVG FAMILY SIZE
2.6
AVG HOUSEHOLD SIZE
1,273
LABOR FORCE [ PEOPLE ]
69.1%
PERCENT IN LABOR FORCE
0.9%
UNEMPLOYMENT RATE
Aviston Zip Codes
Aviston Area Codes
Income in Aviston
Income Overview in Aviston
Per Capita Income in Aviston is $42,934, while median incomes of families and households are $116,324 and $99,821 respectively.
| Characteristic | Number | Measure |
| Per Capita Income | 2,342 | $42,934 |
| Median Family Income | 624 | $116,324 |
| Mean Family Income | 624 | $136,023 |
| Median Household Income | 866 | $99,821 |
| Mean Household Income | 866 | $117,652 |
| Income Deficit | 624 | $0 |
| Wage / Income Gap (%) | 2,342 | 31.76% |
| Wage / Income Gap ($) | 2,342 | 68.24¢ per $1 |
| Gini / Inequality Index | 2,342 | 0.37 |
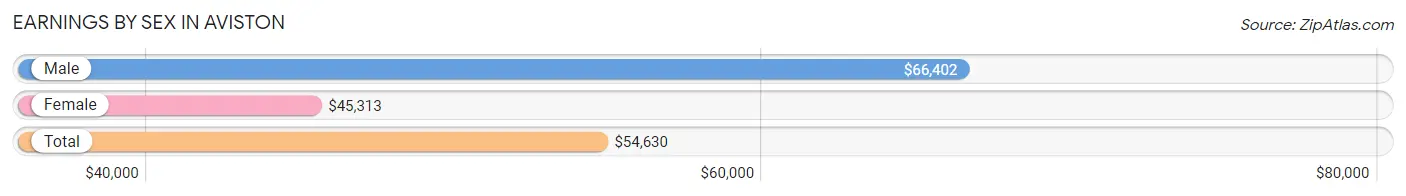
Earnings by Sex in Aviston
Average Earnings in Aviston are $54,630, $66,402 for men and $45,313 for women, a difference of 31.8%.
| Sex | Number | Average Earnings |
| Male | 735 (53.6%) | $66,402 |
| Female | 636 (46.4%) | $45,313 |
| Total | 1,371 (100.0%) | $54,630 |
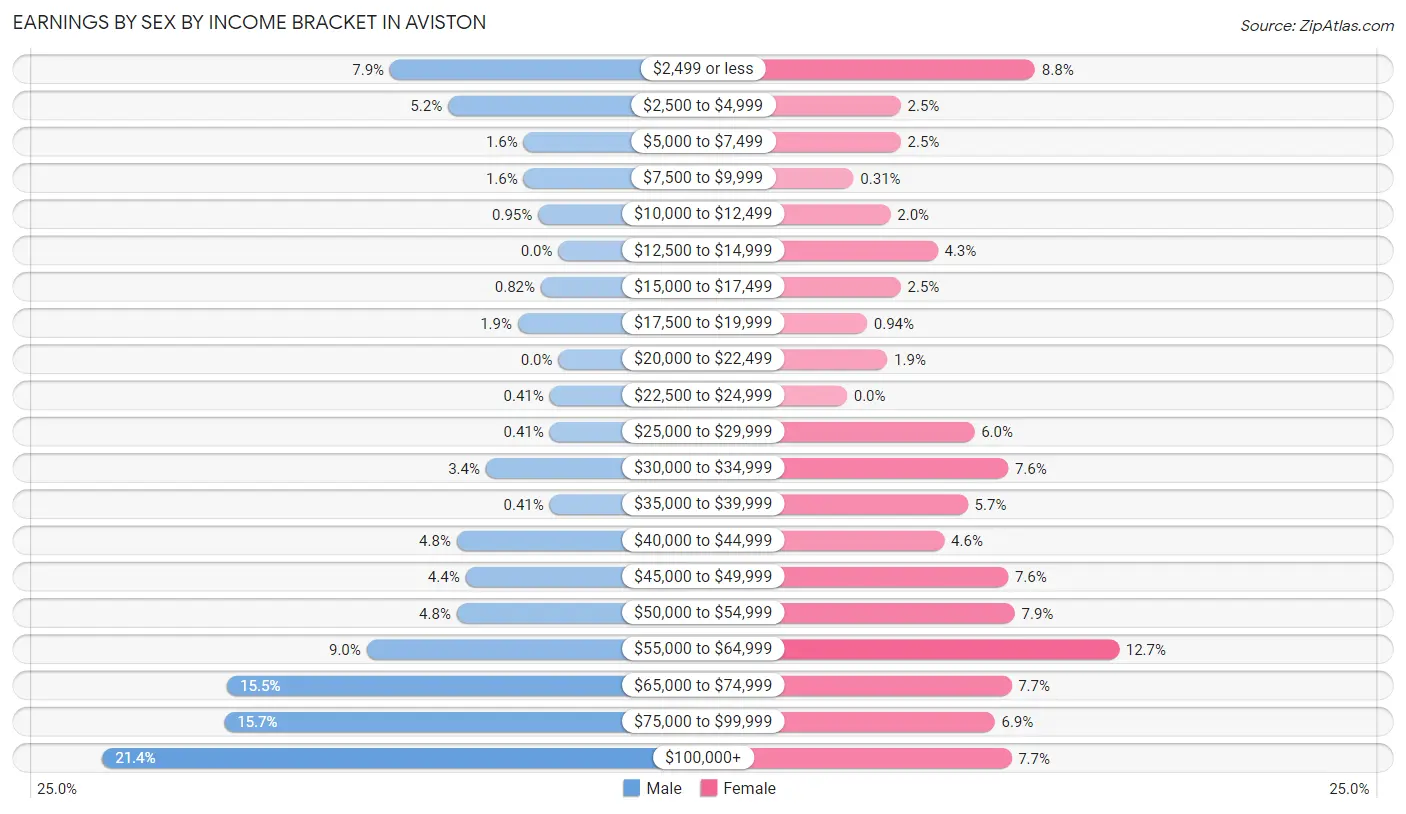
Earnings by Sex by Income Bracket in Aviston
The most common earnings brackets in Aviston are $100,000+ for men (157 | 21.4%) and $55,000 to $64,999 for women (81 | 12.7%).
| Income | Male | Female |
| $2,499 or less | 58 (7.9%) | 56 (8.8%) |
| $2,500 to $4,999 | 38 (5.2%) | 16 (2.5%) |
| $5,000 to $7,499 | 12 (1.6%) | 16 (2.5%) |
| $7,500 to $9,999 | 12 (1.6%) | 2 (0.3%) |
| $10,000 to $12,499 | 7 (0.9%) | 13 (2.0%) |
| $12,500 to $14,999 | 0 (0.0%) | 27 (4.3%) |
| $15,000 to $17,499 | 6 (0.8%) | 16 (2.5%) |
| $17,500 to $19,999 | 14 (1.9%) | 6 (0.9%) |
| $20,000 to $22,499 | 0 (0.0%) | 12 (1.9%) |
| $22,500 to $24,999 | 3 (0.4%) | 0 (0.0%) |
| $25,000 to $29,999 | 3 (0.4%) | 38 (6.0%) |
| $30,000 to $34,999 | 25 (3.4%) | 48 (7.5%) |
| $35,000 to $39,999 | 3 (0.4%) | 36 (5.7%) |
| $40,000 to $44,999 | 35 (4.8%) | 29 (4.6%) |
| $45,000 to $49,999 | 32 (4.3%) | 48 (7.5%) |
| $50,000 to $54,999 | 35 (4.8%) | 50 (7.9%) |
| $55,000 to $64,999 | 66 (9.0%) | 81 (12.7%) |
| $65,000 to $74,999 | 114 (15.5%) | 49 (7.7%) |
| $75,000 to $99,999 | 115 (15.7%) | 44 (6.9%) |
| $100,000+ | 157 (21.4%) | 49 (7.7%) |
| Total | 735 (100.0%) | 636 (100.0%) |
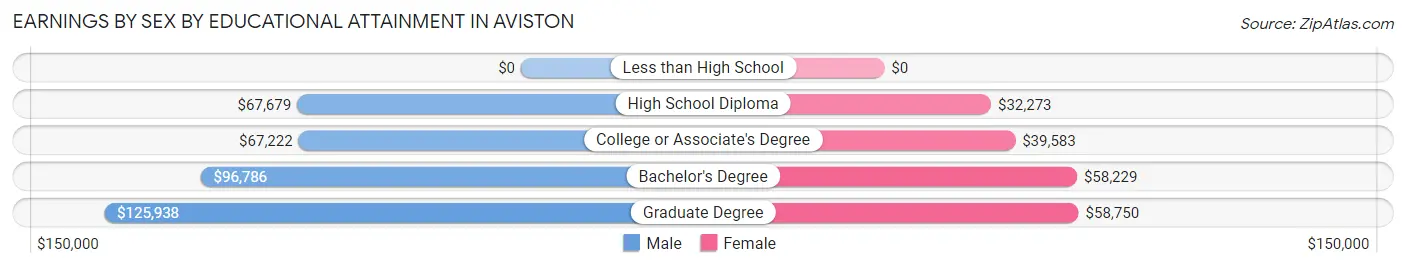
Earnings by Sex by Educational Attainment in Aviston
Average earnings in Aviston are $69,464 for men and $48,438 for women, a difference of 30.3%. Men with an educational attainment of graduate degree enjoy the highest average annual earnings of $125,938, while those with college or associate's degree education earn the least with $67,222. Women with an educational attainment of graduate degree earn the most with the average annual earnings of $58,750, while those with high school diploma education have the smallest earnings of $32,273.
| Educational Attainment | Male Income | Female Income |
| Less than High School | - | - |
| High School Diploma | $67,679 | $32,273 |
| College or Associate's Degree | $67,222 | $39,583 |
| Bachelor's Degree | $96,786 | $58,229 |
| Graduate Degree | $125,938 | $58,750 |
| Total | $69,464 | $48,438 |
Family Income in Aviston
Family Income Brackets in Aviston
According to the Aviston family income data, there are 190 families falling into the $100,000 to $149,999 income range, which is the most common income bracket and makes up 30.4% of all families. Conversely, the $10,000 to $14,999 income bracket is the least frequent group with only 3 families (0.5%) belonging to this category.
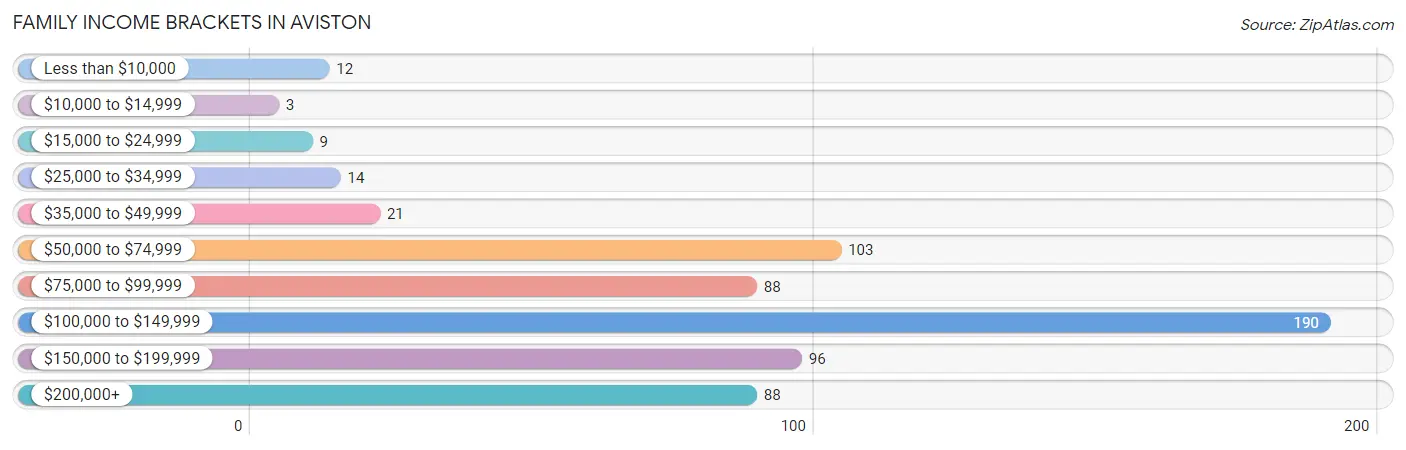
| Income Bracket | # Families | % Families |
| Less than $10,000 | 12 | 1.9% |
| $10,000 to $14,999 | 3 | 0.5% |
| $15,000 to $24,999 | 9 | 1.4% |
| $25,000 to $34,999 | 14 | 2.2% |
| $35,000 to $49,999 | 21 | 3.4% |
| $50,000 to $74,999 | 103 | 16.5% |
| $75,000 to $99,999 | 88 | 14.1% |
| $100,000 to $149,999 | 190 | 30.4% |
| $150,000 to $199,999 | 96 | 15.4% |
| $200,000+ | 88 | 14.1% |
Family Income by Famaliy Size in Aviston
4-person families (154 | 24.7%) account for the highest median family income in Aviston with $153,125 per family, while 2-person families (267 | 42.8%) have the highest median income of $49,152 per family member.
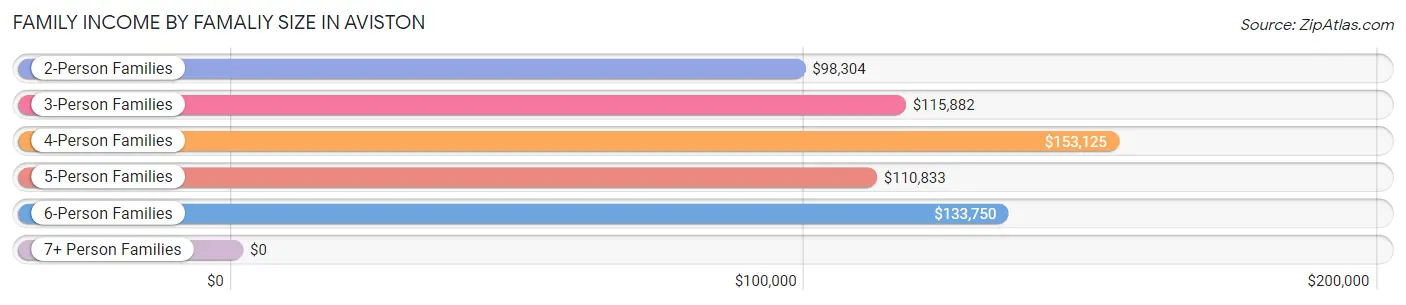
| Income Bracket | # Families | Median Income |
| 2-Person Families | 267 (42.8%) | $98,304 |
| 3-Person Families | 128 (20.5%) | $115,882 |
| 4-Person Families | 154 (24.7%) | $153,125 |
| 5-Person Families | 66 (10.6%) | $110,833 |
| 6-Person Families | 9 (1.4%) | $133,750 |
| 7+ Person Families | 0 (0.0%) | $0 |
| Total | 624 (100.0%) | $116,324 |
Family Income by Number of Earners in Aviston
The median family income in Aviston is $116,324, with families comprising 3+ earners (94) having the highest median family income of $137,500, while families with 1 earner (129) have the lowest median family income of $59,313, accounting for 15.1% and 20.7% of families, respectively.
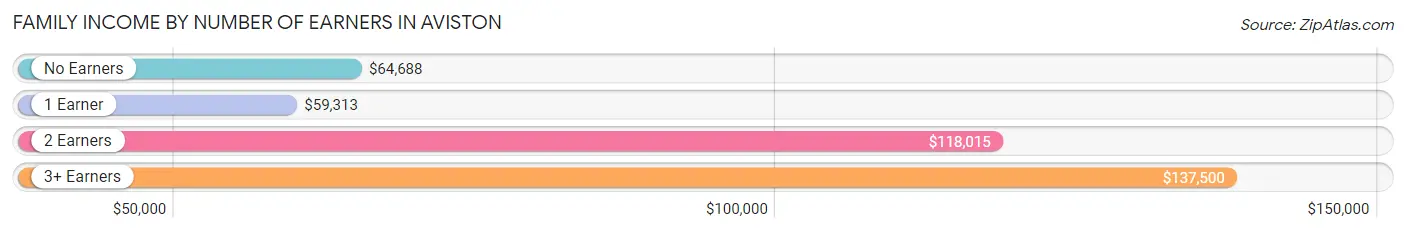
| Number of Earners | # Families | Median Income |
| No Earners | 54 (8.6%) | $64,688 |
| 1 Earner | 129 (20.7%) | $59,313 |
| 2 Earners | 347 (55.6%) | $118,015 |
| 3+ Earners | 94 (15.1%) | $137,500 |
| Total | 624 (100.0%) | $116,324 |
Household Income in Aviston
Household Income Brackets in Aviston
With 236 households falling in the category, the $100,000 to $149,999 income range is the most frequent in Aviston, accounting for 27.3% of all households. In contrast, only 4 households (0.5%) fall into the $10,000 to $14,999 income bracket, making it the least populous group.
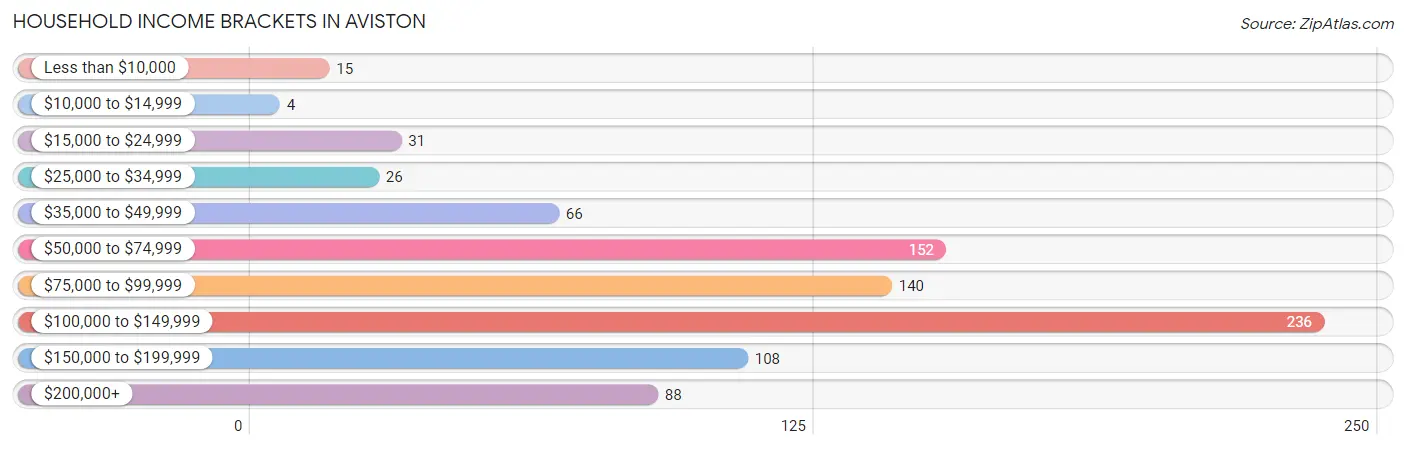
| Income Bracket | # Households | % Households |
| Less than $10,000 | 15 | 1.7% |
| $10,000 to $14,999 | 4 | 0.5% |
| $15,000 to $24,999 | 31 | 3.6% |
| $25,000 to $34,999 | 26 | 3.0% |
| $35,000 to $49,999 | 66 | 7.6% |
| $50,000 to $74,999 | 152 | 17.6% |
| $75,000 to $99,999 | 140 | 16.2% |
| $100,000 to $149,999 | 236 | 27.3% |
| $150,000 to $199,999 | 108 | 12.5% |
| $200,000+ | 88 | 10.2% |
Household Income by Householder Age in Aviston
The median household income in Aviston is $99,821, with the highest median household income of $118,182 found in the 45 to 64 years age bracket for the primary householder. A total of 268 households (30.9%) fall into this category. Meanwhile, the 65+ years age bracket for the primary householder has the lowest median household income of $60,250, with 191 households (22.1%) in this group.
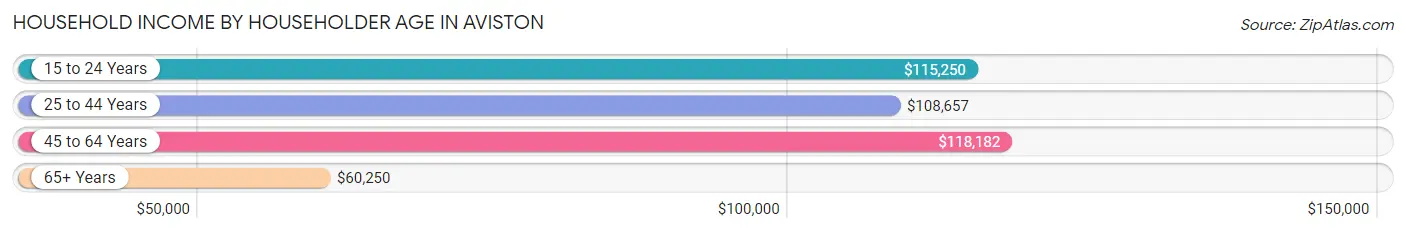
| Income Bracket | # Households | Median Income |
| 15 to 24 Years | 18 (2.1%) | $115,250 |
| 25 to 44 Years | 389 (44.9%) | $108,657 |
| 45 to 64 Years | 268 (30.9%) | $118,182 |
| 65+ Years | 191 (22.1%) | $60,250 |
| Total | 866 (100.0%) | $99,821 |
Poverty in Aviston
Income Below Poverty by Sex and Age in Aviston
With 2.5% poverty level for males and 2.4% for females among the residents of Aviston, 5 year old males and 18 to 24 year old females are the most vulnerable to poverty, with 2 males (11.1%) and 3 females (6.4%) in their respective age groups living below the poverty level.
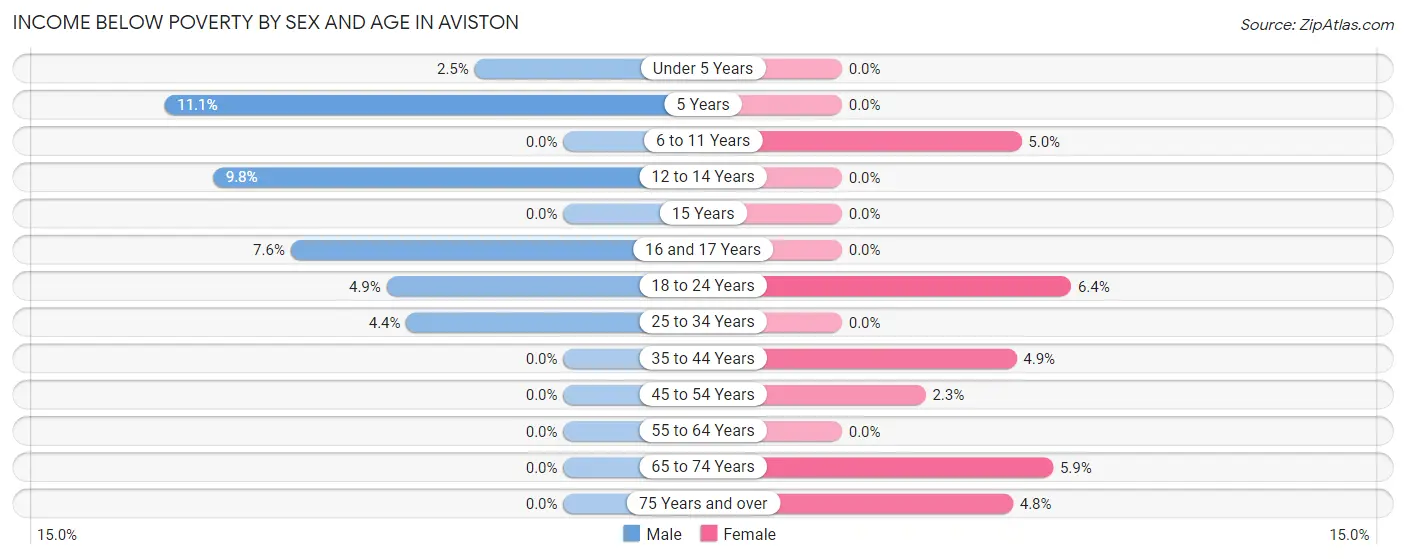
| Age Bracket | Male | Female |
| Under 5 Years | 2 (2.5%) | 0 (0.0%) |
| 5 Years | 2 (11.1%) | 0 (0.0%) |
| 6 to 11 Years | 0 (0.0%) | 7 (5.0%) |
| 12 to 14 Years | 4 (9.8%) | 0 (0.0%) |
| 15 Years | 0 (0.0%) | 0 (0.0%) |
| 16 and 17 Years | 6 (7.6%) | 0 (0.0%) |
| 18 to 24 Years | 3 (4.9%) | 3 (6.4%) |
| 25 to 34 Years | 10 (4.4%) | 0 (0.0%) |
| 35 to 44 Years | 0 (0.0%) | 7 (4.9%) |
| 45 to 54 Years | 0 (0.0%) | 3 (2.3%) |
| 55 to 64 Years | 0 (0.0%) | 0 (0.0%) |
| 65 to 74 Years | 0 (0.0%) | 5 (5.9%) |
| 75 Years and over | 0 (0.0%) | 3 (4.8%) |
| Total | 27 (2.5%) | 28 (2.4%) |
Income Above Poverty by Sex and Age in Aviston
According to the poverty statistics in Aviston, males aged 6 to 11 years and females aged under 5 years are the age groups that are most secure financially, with 100.0% of males and 100.0% of females in these age groups living above the poverty line.
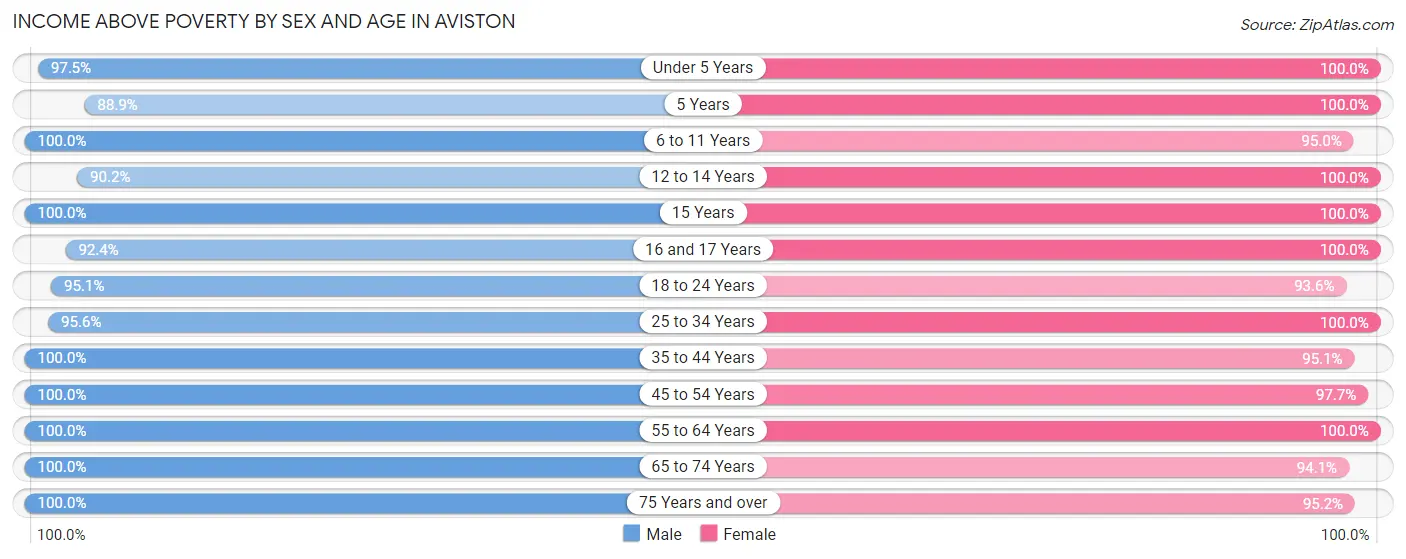
| Age Bracket | Male | Female |
| Under 5 Years | 79 (97.5%) | 71 (100.0%) |
| 5 Years | 16 (88.9%) | 7 (100.0%) |
| 6 to 11 Years | 47 (100.0%) | 133 (95.0%) |
| 12 to 14 Years | 37 (90.2%) | 67 (100.0%) |
| 15 Years | 13 (100.0%) | 15 (100.0%) |
| 16 and 17 Years | 73 (92.4%) | 64 (100.0%) |
| 18 to 24 Years | 58 (95.1%) | 44 (93.6%) |
| 25 to 34 Years | 219 (95.6%) | 170 (100.0%) |
| 35 to 44 Years | 156 (100.0%) | 137 (95.1%) |
| 45 to 54 Years | 150 (100.0%) | 126 (97.7%) |
| 55 to 64 Years | 110 (100.0%) | 162 (100.0%) |
| 65 to 74 Years | 82 (100.0%) | 80 (94.1%) |
| 75 Years and over | 28 (100.0%) | 60 (95.2%) |
| Total | 1,068 (97.5%) | 1,136 (97.6%) |
Income Below Poverty Among Married-Couple Families in Aviston
The poverty statistics for married-couple families in Aviston show that 0.9% or 5 of the total 524 families live below the poverty line. Families with no children have the highest poverty rate of 1.9%, comprising of 5 families. On the other hand, families with 1 or 2 children have the lowest poverty rate of 0.0%, which includes 0 families.
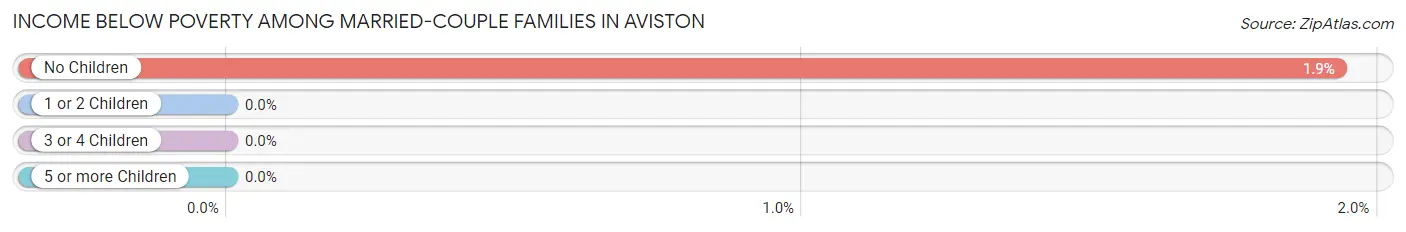
| Children | Above Poverty | Below Poverty |
| No Children | 254 (98.1%) | 5 (1.9%) |
| 1 or 2 Children | 196 (100.0%) | 0 (0.0%) |
| 3 or 4 Children | 69 (100.0%) | 0 (0.0%) |
| 5 or more Children | 0 (0.0%) | 0 (0.0%) |
| Total | 519 (99.1%) | 5 (0.9%) |
Income Below Poverty Among Single-Parent Households in Aviston
According to the poverty data in Aviston, 22.8% or 13 single-father households and 9.3% or 4 single-mother households are living below the poverty line. Among single-father households, those with 1 or 2 children have the highest poverty rate, with 13 households (50.0%) experiencing poverty. Likewise, among single-mother households, those with 3 or 4 children have the highest poverty rate, with 4 households (100.0%) falling below the poverty line.
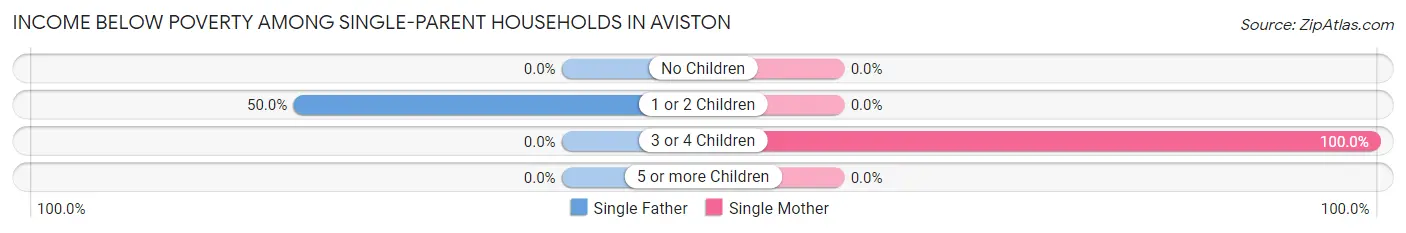
| Children | Single Father | Single Mother |
| No Children | 0 (0.0%) | 0 (0.0%) |
| 1 or 2 Children | 13 (50.0%) | 0 (0.0%) |
| 3 or 4 Children | 0 (0.0%) | 4 (100.0%) |
| 5 or more Children | 0 (0.0%) | 0 (0.0%) |
| Total | 13 (22.8%) | 4 (9.3%) |
Income Below Poverty Among Married-Couple vs Single-Parent Households in Aviston
The poverty data for Aviston shows that 5 of the married-couple family households (0.9%) and 17 of the single-parent households (17.0%) are living below the poverty level. Within the married-couple family households, those with no children have the highest poverty rate, with 5 households (1.9%) falling below the poverty line. Among the single-parent households, those with 3 or 4 children have the highest poverty rate, with 4 household (57.1%) living below poverty.
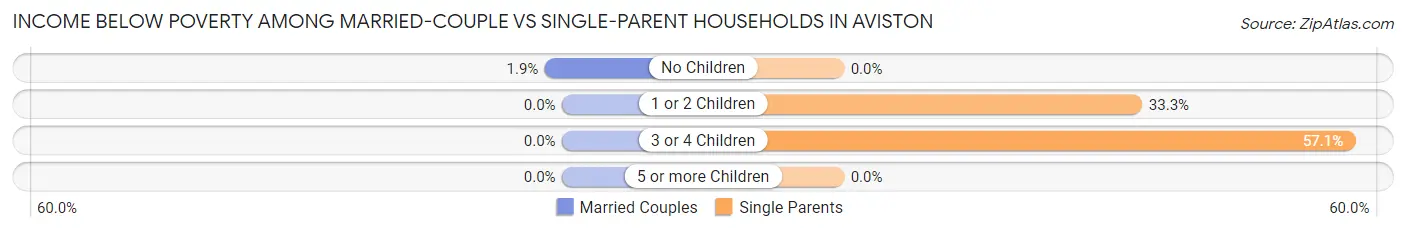
| Children | Married-Couple Families | Single-Parent Households |
| No Children | 5 (1.9%) | 0 (0.0%) |
| 1 or 2 Children | 0 (0.0%) | 13 (33.3%) |
| 3 or 4 Children | 0 (0.0%) | 4 (57.1%) |
| 5 or more Children | 0 (0.0%) | 0 (0.0%) |
| Total | 5 (0.9%) | 17 (17.0%) |
Race in Aviston
The most populous races in Aviston are White / Caucasian (2,197 | 93.8%), Hispanic or Latino (159 | 6.8%), and Two or more Races (81 | 3.5%).
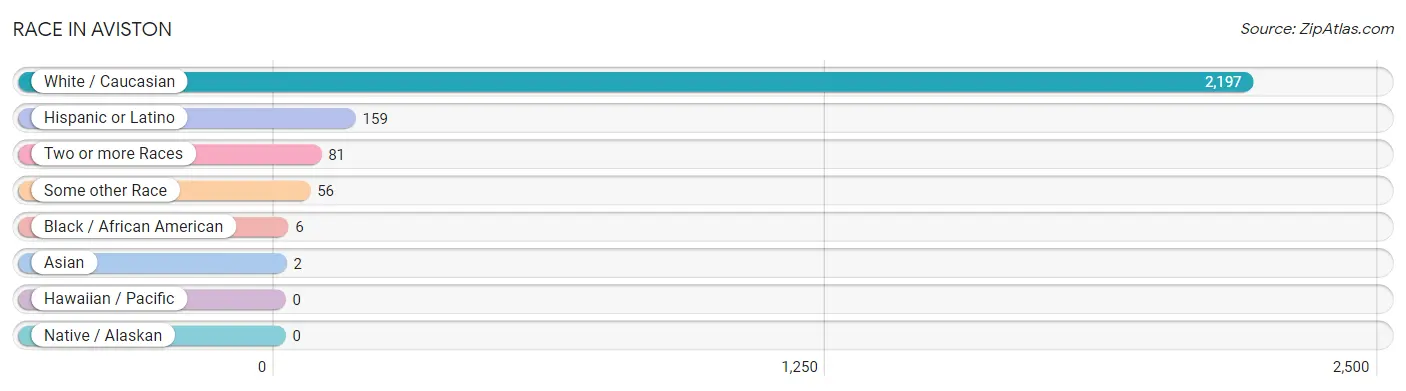
| Race | # Population | % Population |
| Asian | 2 | 0.1% |
| Black / African American | 6 | 0.3% |
| Hawaiian / Pacific | 0 | 0.0% |
| Hispanic or Latino | 159 | 6.8% |
| Native / Alaskan | 0 | 0.0% |
| White / Caucasian | 2,197 | 93.8% |
| Two or more Races | 81 | 3.5% |
| Some other Race | 56 | 2.4% |
| Total | 2,342 | 100.0% |
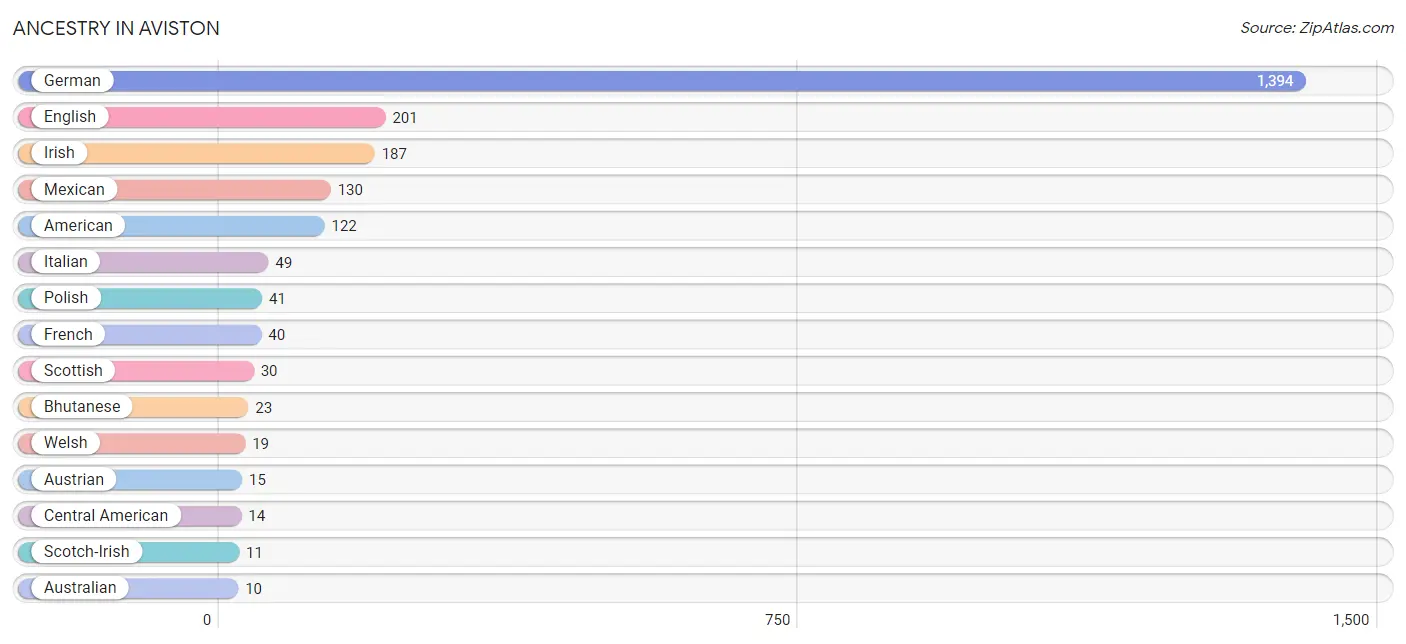
Ancestry in Aviston
The most populous ancestries reported in Aviston are German (1,394 | 59.5%), English (201 | 8.6%), Irish (187 | 8.0%), Mexican (130 | 5.6%), and American (122 | 5.2%), together accounting for 86.8% of all Aviston residents.
| Ancestry | # Population | % Population |
| Alaska Native | 9 | 0.4% |
| American | 122 | 5.2% |
| Australian | 10 | 0.4% |
| Austrian | 15 | 0.6% |
| Bhutanese | 23 | 1.0% |
| Burmese | 2 | 0.1% |
| Central American | 14 | 0.6% |
| Croatian | 4 | 0.2% |
| Czechoslovakian | 5 | 0.2% |
| Dutch | 3 | 0.1% |
| English | 201 | 8.6% |
| European | 8 | 0.3% |
| French | 40 | 1.7% |
| German | 1,394 | 59.5% |
| Guamanian / Chamorro | 2 | 0.1% |
| Guatemalan | 8 | 0.3% |
| Irish | 187 | 8.0% |
| Italian | 49 | 2.1% |
| Mexican | 130 | 5.6% |
| Northern European | 3 | 0.1% |
| Panamanian | 6 | 0.3% |
| Polish | 41 | 1.8% |
| Puerto Rican | 1 | 0.0% |
| Russian | 5 | 0.2% |
| Scotch-Irish | 11 | 0.5% |
| Scottish | 30 | 1.3% |
| Spanish | 9 | 0.4% |
| Swedish | 5 | 0.2% |
| Welsh | 19 | 0.8% | View All 29 Rows |
Immigrants in Aviston
The most numerous immigrant groups reported in Aviston came from Central America (3 | 0.1%), Guatemala (3 | 0.1%), Latin America (3 | 0.1%), Asia (2 | 0.1%), and Eastern Asia (2 | 0.1%), together accounting for 0.6% of all Aviston residents.
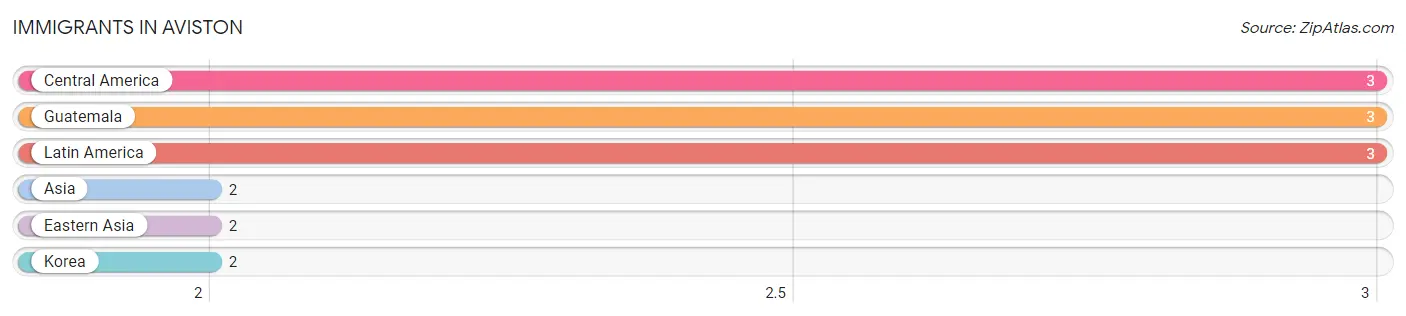
| Immigration Origin | # Population | % Population |
| Asia | 2 | 0.1% |
| Central America | 3 | 0.1% |
| Eastern Asia | 2 | 0.1% |
| Guatemala | 3 | 0.1% |
| Korea | 2 | 0.1% |
| Latin America | 3 | 0.1% | View All 6 Rows |
Sex and Age in Aviston
Sex and Age in Aviston
The most populous age groups in Aviston are 25 to 29 Years (145 | 12.9%) for men and 10 to 14 Years (123 | 10.1%) for women.
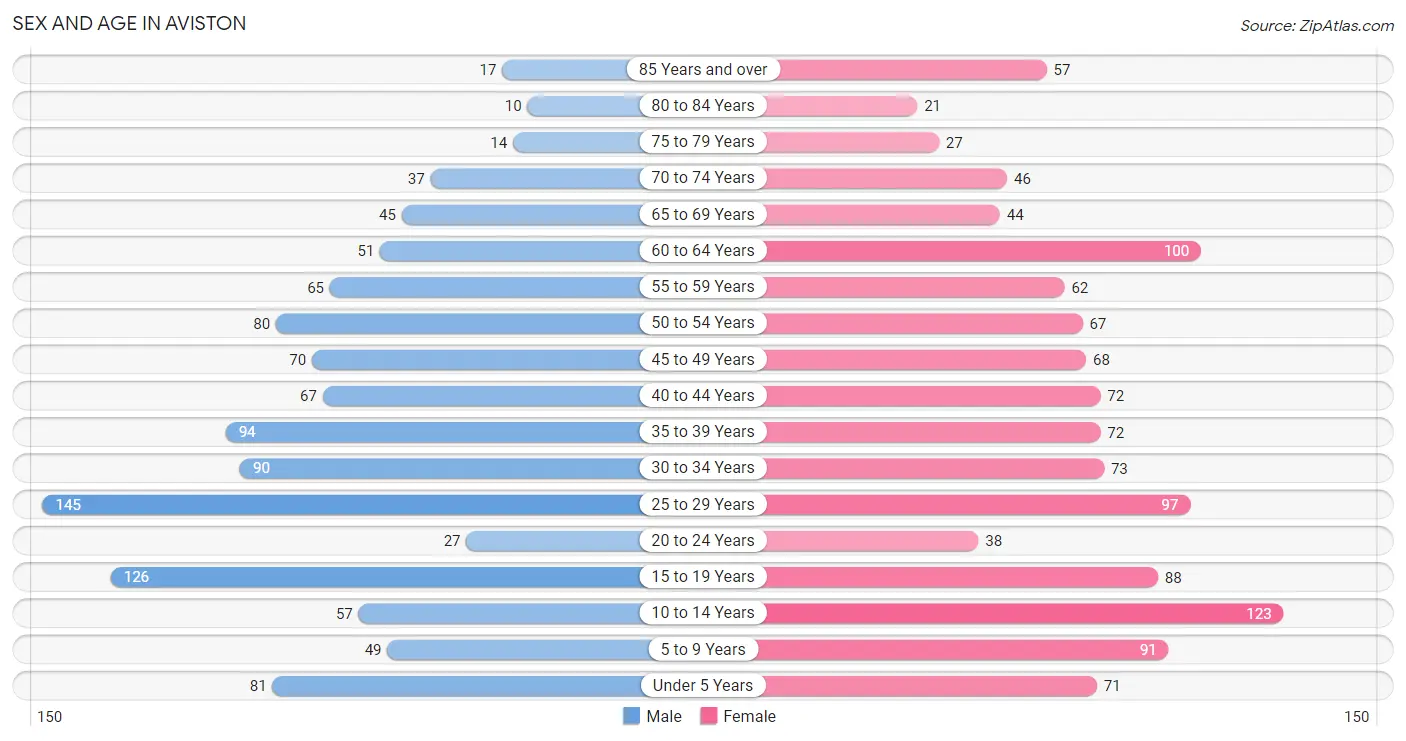
| Age Bracket | Male | Female |
| Under 5 Years | 81 (7.2%) | 71 (5.8%) |
| 5 to 9 Years | 49 (4.4%) | 91 (7.5%) |
| 10 to 14 Years | 57 (5.1%) | 123 (10.1%) |
| 15 to 19 Years | 126 (11.2%) | 88 (7.2%) |
| 20 to 24 Years | 27 (2.4%) | 38 (3.1%) |
| 25 to 29 Years | 145 (12.9%) | 97 (8.0%) |
| 30 to 34 Years | 90 (8.0%) | 73 (6.0%) |
| 35 to 39 Years | 94 (8.4%) | 72 (5.9%) |
| 40 to 44 Years | 67 (6.0%) | 72 (5.9%) |
| 45 to 49 Years | 70 (6.2%) | 68 (5.6%) |
| 50 to 54 Years | 80 (7.1%) | 67 (5.5%) |
| 55 to 59 Years | 65 (5.8%) | 62 (5.1%) |
| 60 to 64 Years | 51 (4.5%) | 100 (8.2%) |
| 65 to 69 Years | 45 (4.0%) | 44 (3.6%) |
| 70 to 74 Years | 37 (3.3%) | 46 (3.8%) |
| 75 to 79 Years | 14 (1.2%) | 27 (2.2%) |
| 80 to 84 Years | 10 (0.9%) | 21 (1.7%) |
| 85 Years and over | 17 (1.5%) | 57 (4.7%) |
| Total | 1,125 (100.0%) | 1,217 (100.0%) |
Families and Households in Aviston
Median Family Size in Aviston
The median family size in Aviston is 3.13 persons per family, with single female/mother families (43 | 6.9%) accounting for the largest median family size of 3.26 persons per family. On the other hand, single male/father families (57 | 9.1%) represent the smallest median family size with 2.30 persons per family.
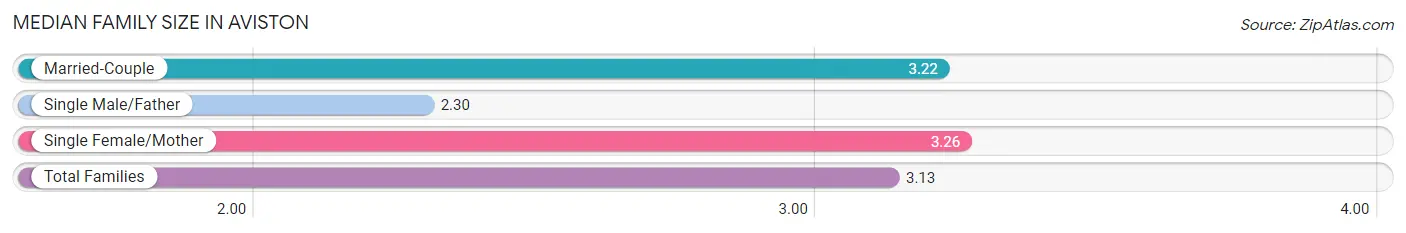
| Family Type | # Families | Family Size |
| Married-Couple | 524 (84.0%) | 3.22 |
| Single Male/Father | 57 (9.1%) | 2.30 |
| Single Female/Mother | 43 (6.9%) | 3.26 |
| Total Families | 624 (100.0%) | 3.13 |
Median Household Size in Aviston
The median household size in Aviston is 2.61 persons per household, with single female/mother households (43 | 5.0%) accounting for the largest median household size of 3.33 persons per household. non-family households (242 | 27.9%) represent the smallest median household size with 1.17 persons per household.
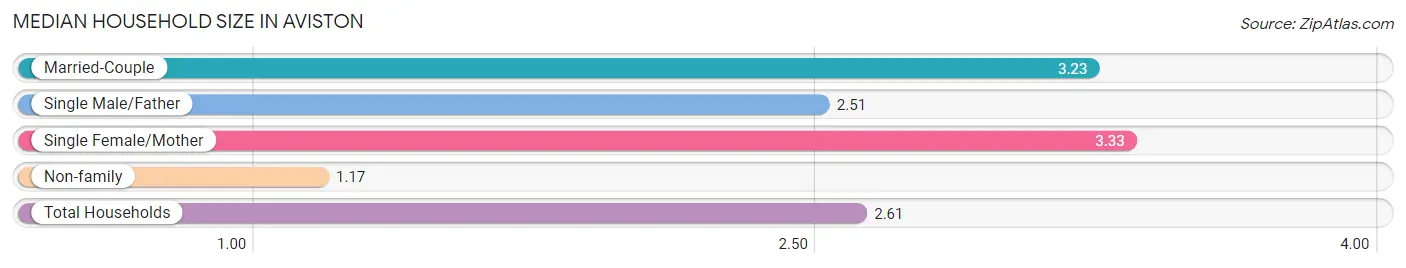
| Household Type | # Households | Household Size |
| Married-Couple | 524 (60.5%) | 3.23 |
| Single Male/Father | 57 (6.6%) | 2.51 |
| Single Female/Mother | 43 (5.0%) | 3.33 |
| Non-family | 242 (27.9%) | 1.17 |
| Total Households | 866 (100.0%) | 2.61 |
Household Size by Marriage Status in Aviston
Out of a total of 866 households in Aviston, 624 (72.1%) are family households, while 242 (27.9%) are nonfamily households. The most numerous type of family households are 2-person households, comprising 256, and the most common type of nonfamily households are 1-person households, comprising 202.
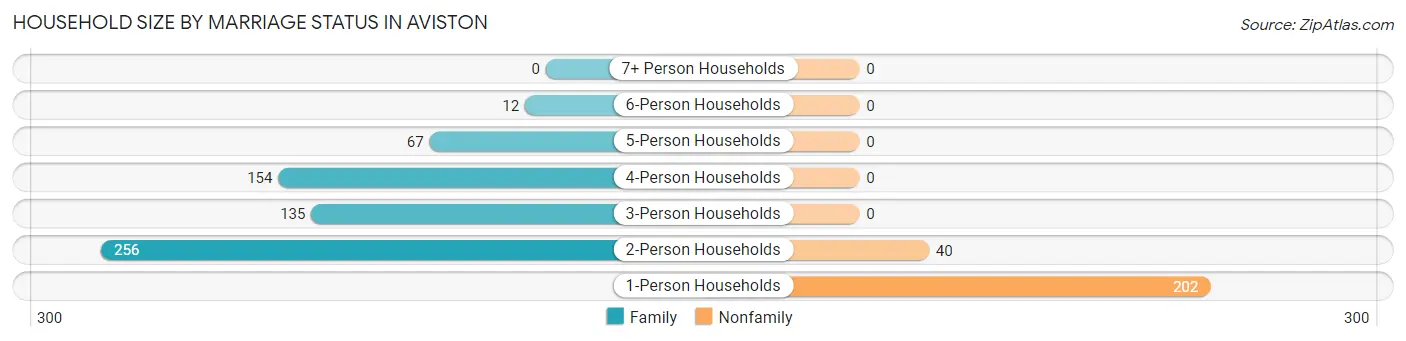
| Household Size | Family Households | Nonfamily Households |
| 1-Person Households | - | 202 (23.3%) |
| 2-Person Households | 256 (29.6%) | 40 (4.6%) |
| 3-Person Households | 135 (15.6%) | 0 (0.0%) |
| 4-Person Households | 154 (17.8%) | 0 (0.0%) |
| 5-Person Households | 67 (7.7%) | 0 (0.0%) |
| 6-Person Households | 12 (1.4%) | 0 (0.0%) |
| 7+ Person Households | 0 (0.0%) | 0 (0.0%) |
| Total | 624 (72.1%) | 242 (27.9%) |
Female Fertility in Aviston
Fertility by Age in Aviston
Average fertility rate in Aviston is 74.0 births per 1,000 women. Women in the age bracket of 20 to 34 years have the highest fertility rate with 168.0 births per 1,000 women. Women in the age bracket of 20 to 34 years acount for 92.1% of all women with births.
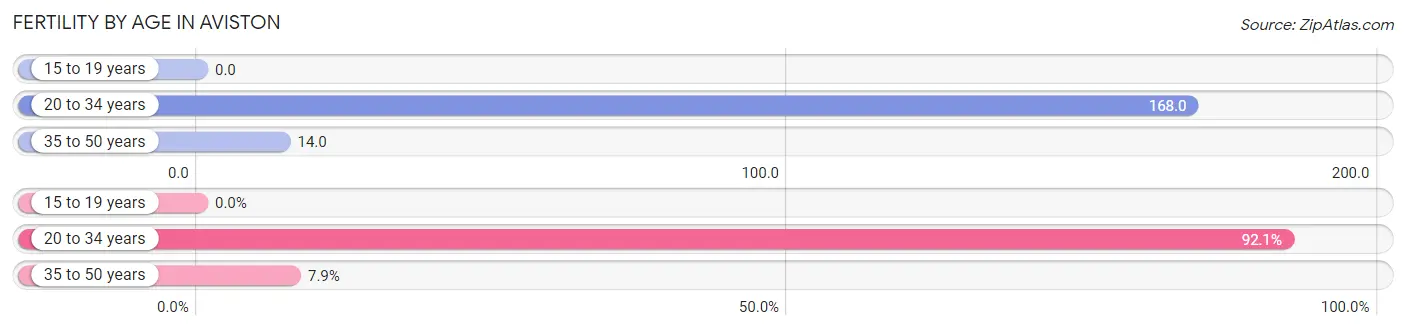
| Age Bracket | Women with Births | Births / 1,000 Women |
| 15 to 19 years | 0 (0.0%) | 0.0 |
| 20 to 34 years | 35 (92.1%) | 168.0 |
| 35 to 50 years | 3 (7.9%) | 14.0 |
| Total | 38 (100.0%) | 74.0 |
Fertility by Age by Marriage Status in Aviston
78.9% of women with births (38) in Aviston are married. The highest percentage of unmarried women with births falls into 20 to 34 years age bracket with 22.9% of them unmarried at the time of birth, while the lowest percentage of unmarried women with births belong to 35 to 50 years age bracket with 0.0% of them unmarried.
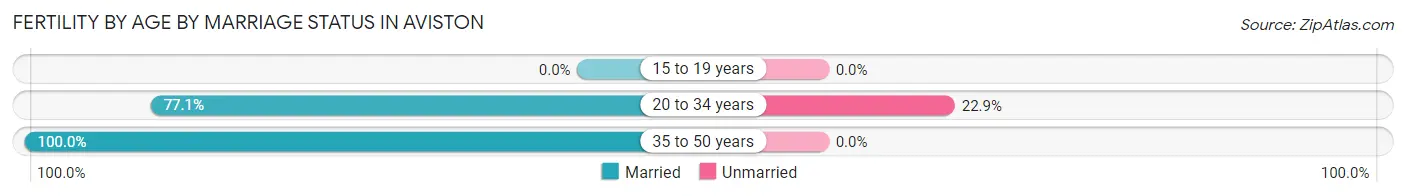
| Age Bracket | Married | Unmarried |
| 15 to 19 years | 0 (0.0%) | 0 (0.0%) |
| 20 to 34 years | 27 (77.1%) | 8 (22.9%) |
| 35 to 50 years | 3 (100.0%) | 0 (0.0%) |
| Total | 30 (78.9%) | 8 (21.0%) |
Fertility by Education in Aviston
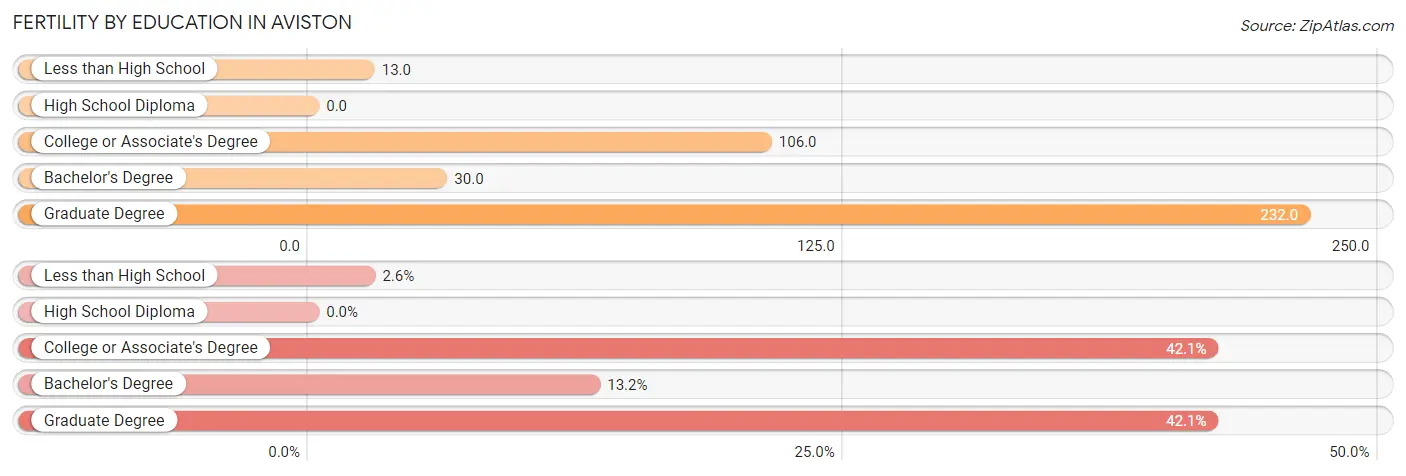
| Educational Attainment | Women with Births | Births / 1,000 Women |
| Less than High School | 1 (2.6%) | 13.0 |
| High School Diploma | 0 (0.0%) | 0.0 |
| College or Associate's Degree | 16 (42.1%) | 106.0 |
| Bachelor's Degree | 5 (13.2%) | 30.0 |
| Graduate Degree | 16 (42.1%) | 232.0 |
| Total | 38 (100.0%) | 74.0 |
Fertility by Education by Marriage Status in Aviston
21.0% of women with births in Aviston are unmarried. Women with the educational attainment of less than high school are most likely to be married with 100.0% of them married at childbirth, while women with the educational attainment of bachelor's degree are least likely to be married with 100.0% of them unmarried at childbirth.
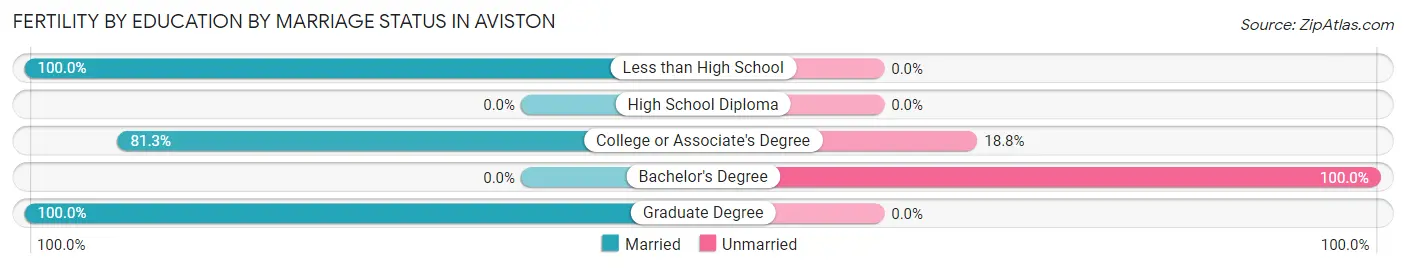
| Educational Attainment | Married | Unmarried |
| Less than High School | 1 (100.0%) | 0 (0.0%) |
| High School Diploma | 0 (0.0%) | 0 (0.0%) |
| College or Associate's Degree | 13 (81.2%) | 3 (18.8%) |
| Bachelor's Degree | 0 (0.0%) | 5 (100.0%) |
| Graduate Degree | 16 (100.0%) | 0 (0.0%) |
| Total | 30 (78.9%) | 8 (21.0%) |
Employment Characteristics in Aviston
Employment by Class of Employer in Aviston
Among the 1,217 employed individuals in Aviston, private company employees (792 | 65.1%), not-for-profit organizations (109 | 9.0%), and federal government employees (87 | 7.1%) make up the most common classes of employment.
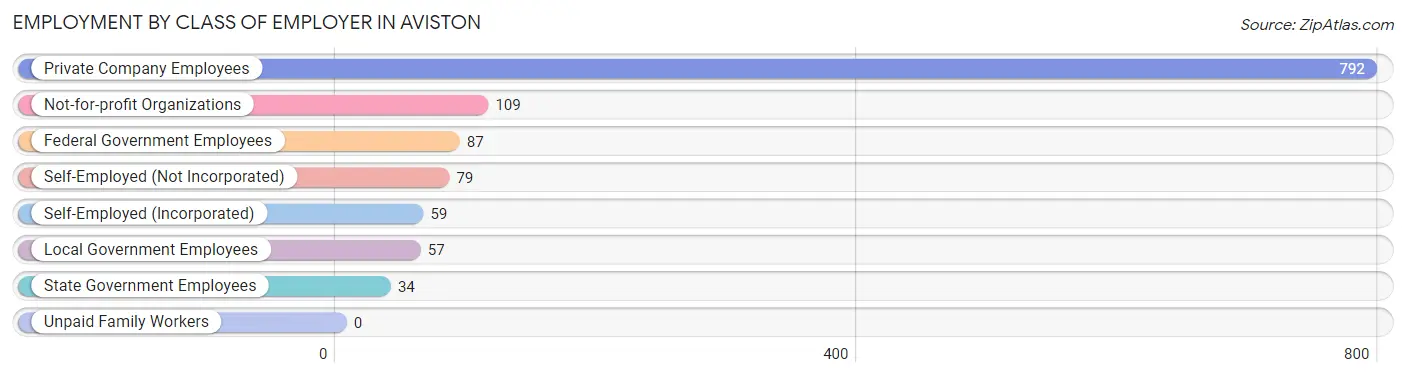
| Employer Class | # Employees | % Employees |
| Private Company Employees | 792 | 65.1% |
| Self-Employed (Incorporated) | 59 | 4.9% |
| Self-Employed (Not Incorporated) | 79 | 6.5% |
| Not-for-profit Organizations | 109 | 9.0% |
| Local Government Employees | 57 | 4.7% |
| State Government Employees | 34 | 2.8% |
| Federal Government Employees | 87 | 7.1% |
| Unpaid Family Workers | 0 | 0.0% |
| Total | 1,217 | 100.0% |
Employment Status by Age in Aviston
According to the labor force statistics for Aviston, out of the total population over 16 years of age (1,842), 69.1% or 1,273 individuals are in the labor force, with 0.9% or 11 of them unemployed. The age group with the highest labor force participation rate is 35 to 44 years, with 95.7% or 292 individuals in the labor force. Within the labor force, the 60 to 64 years age range has the highest percentage of unemployed individuals, with 3.6% or 4 of them being unemployed.
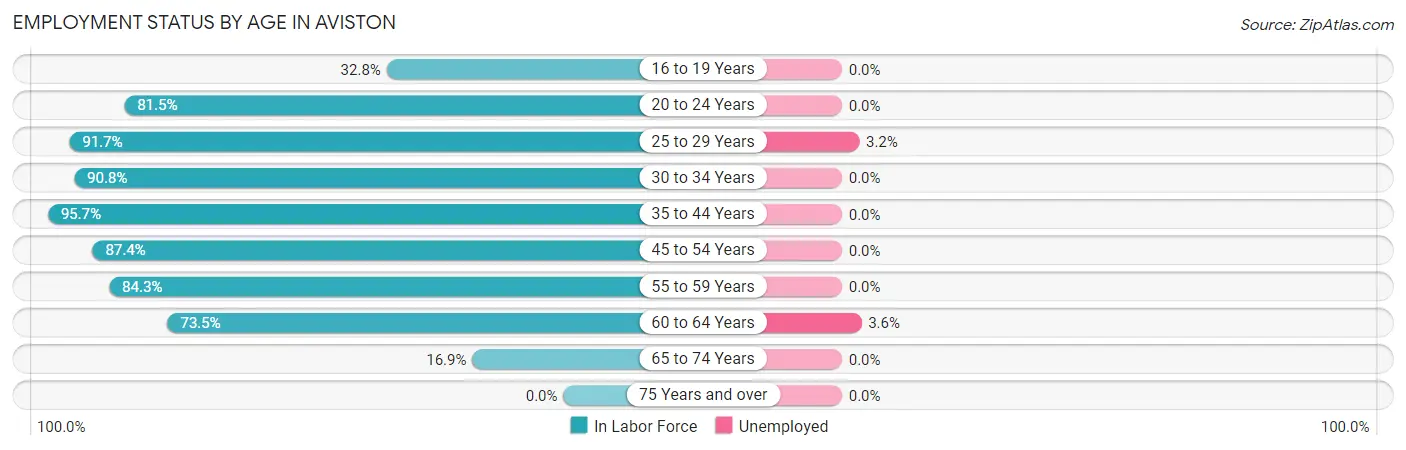
| Age Bracket | In Labor Force | Unemployed |
| 16 to 19 Years | 61 (32.8%) | 0 (0.0%) |
| 20 to 24 Years | 53 (81.5%) | 0 (0.0%) |
| 25 to 29 Years | 222 (91.7%) | 7 (3.2%) |
| 30 to 34 Years | 148 (90.8%) | 0 (0.0%) |
| 35 to 44 Years | 292 (95.7%) | 0 (0.0%) |
| 45 to 54 Years | 249 (87.4%) | 0 (0.0%) |
| 55 to 59 Years | 107 (84.3%) | 0 (0.0%) |
| 60 to 64 Years | 111 (73.5%) | 4 (3.6%) |
| 65 to 74 Years | 29 (16.9%) | 0 (0.0%) |
| 75 Years and over | 0 (0.0%) | 0 (0.0%) |
| Total | 1,273 (69.1%) | 11 (0.9%) |
Employment Status by Educational Attainment in Aviston
According to labor force statistics for Aviston, 88.7% of individuals (1,129) out of the total population between 25 and 64 years of age (1,273) are in the labor force, with 1.0% or 11 of them being unemployed. The group with the highest labor force participation rate are those with the educational attainment of college / associate degree, with 93.2% or 560 individuals in the labor force. Within the labor force, individuals with college / associate degree education have the highest percentage of unemployment, with 2.0% or 11 of them being unemployed.
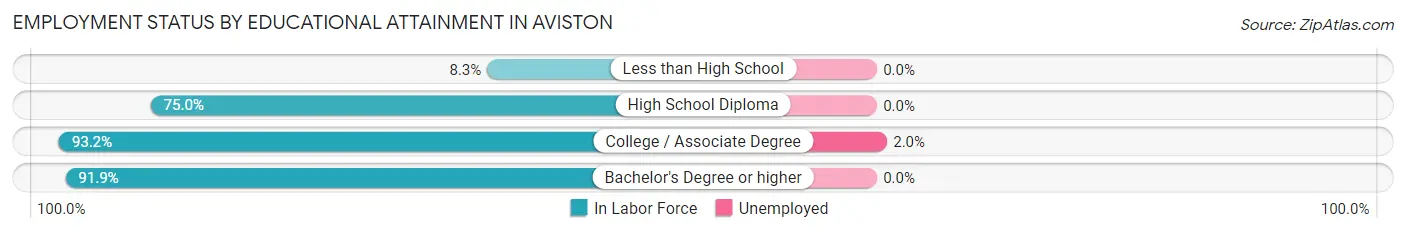
| Educational Attainment | In Labor Force | Unemployed |
| Less than High School | 1 (8.3%) | 0 (0.0%) |
| High School Diploma | 171 (75.0%) | 0 (0.0%) |
| College / Associate Degree | 560 (93.2%) | 12 (2.0%) |
| Bachelor's Degree or higher | 397 (91.9%) | 0 (0.0%) |
| Total | 1,129 (88.7%) | 13 (1.0%) |
Employment Occupations by Sex in Aviston
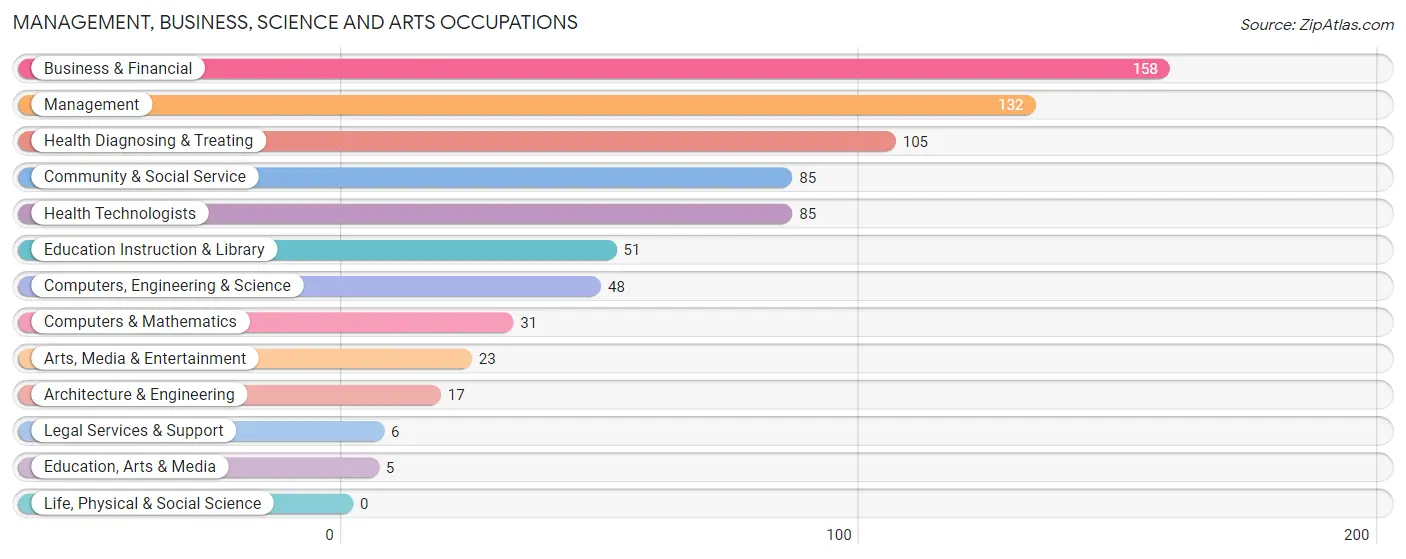
Management, Business, Science and Arts Occupations
The most common Management, Business, Science and Arts occupations in Aviston are Business & Financial (158 | 12.7%), Management (132 | 10.6%), Health Diagnosing & Treating (105 | 8.5%), Community & Social Service (85 | 6.9%), and Health Technologists (85 | 6.9%).
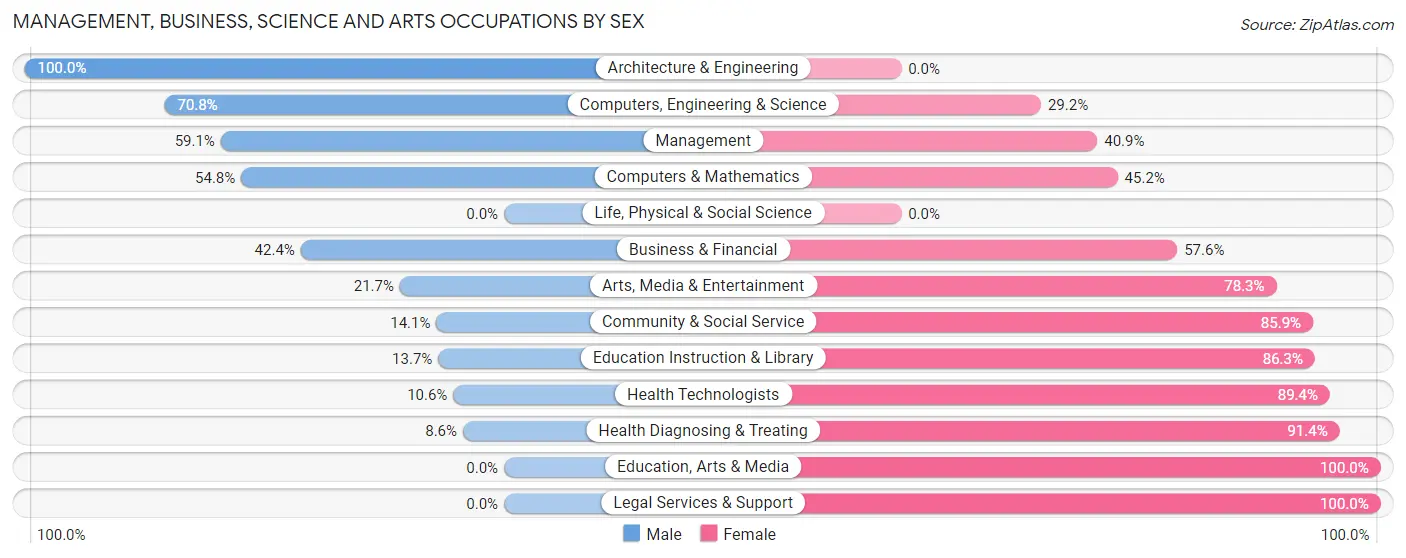
Management, Business, Science and Arts Occupations by Sex
Within the Management, Business, Science and Arts occupations in Aviston, the most male-oriented occupations are Architecture & Engineering (100.0%), Computers, Engineering & Science (70.8%), and Management (59.1%), while the most female-oriented occupations are Education, Arts & Media (100.0%), Legal Services & Support (100.0%), and Health Diagnosing & Treating (91.4%).
| Occupation | Male | Female |
| Management | 78 (59.1%) | 54 (40.9%) |
| Business & Financial | 67 (42.4%) | 91 (57.6%) |
| Computers, Engineering & Science | 34 (70.8%) | 14 (29.2%) |
| Computers & Mathematics | 17 (54.8%) | 14 (45.2%) |
| Architecture & Engineering | 17 (100.0%) | 0 (0.0%) |
| Life, Physical & Social Science | 0 (0.0%) | 0 (0.0%) |
| Community & Social Service | 12 (14.1%) | 73 (85.9%) |
| Education, Arts & Media | 0 (0.0%) | 5 (100.0%) |
| Legal Services & Support | 0 (0.0%) | 6 (100.0%) |
| Education Instruction & Library | 7 (13.7%) | 44 (86.3%) |
| Arts, Media & Entertainment | 5 (21.7%) | 18 (78.3%) |
| Health Diagnosing & Treating | 9 (8.6%) | 96 (91.4%) |
| Health Technologists | 9 (10.6%) | 76 (89.4%) |
| Total (Category) | 200 (37.9%) | 328 (62.1%) |
| Total (Overall) | 654 (52.7%) | 587 (47.3%) |
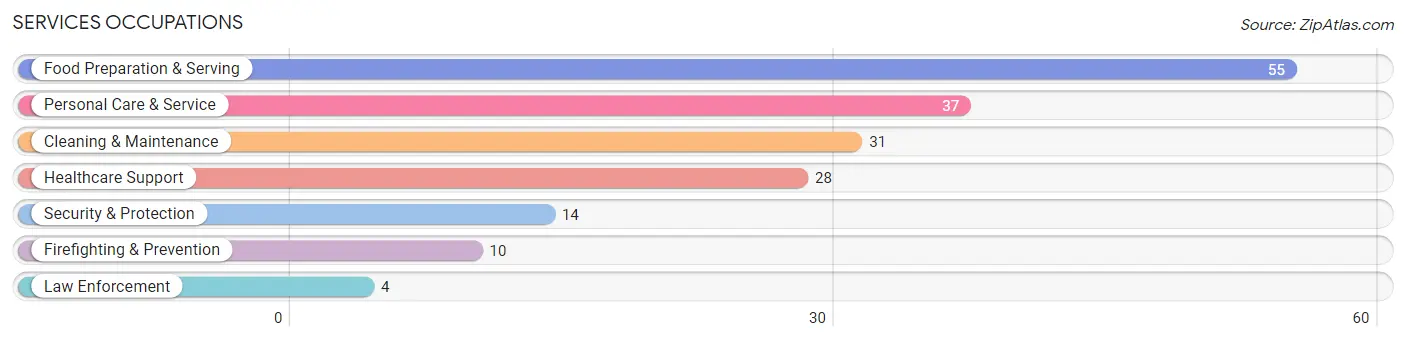
Services Occupations
The most common Services occupations in Aviston are Food Preparation & Serving (55 | 4.4%), Personal Care & Service (37 | 3.0%), Cleaning & Maintenance (31 | 2.5%), Healthcare Support (28 | 2.3%), and Security & Protection (14 | 1.1%).
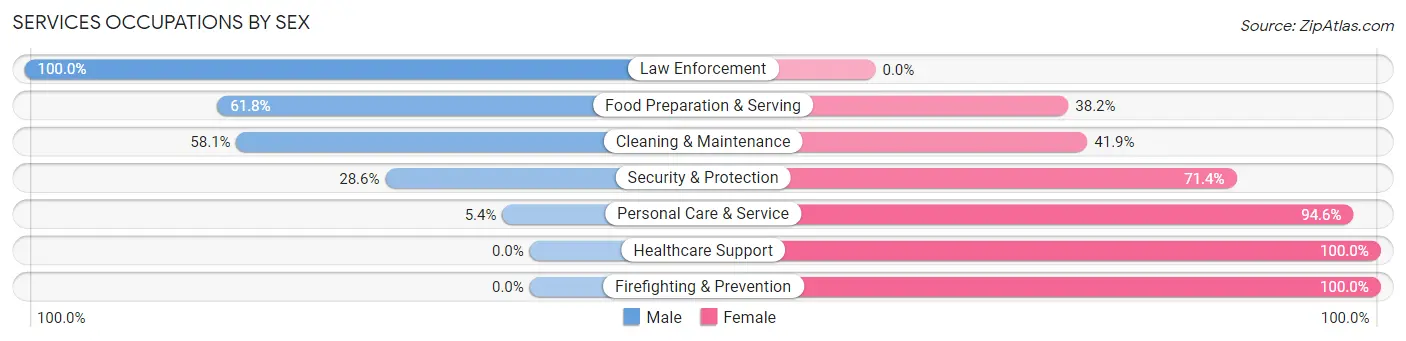
Services Occupations by Sex
Within the Services occupations in Aviston, the most male-oriented occupations are Law Enforcement (100.0%), Food Preparation & Serving (61.8%), and Cleaning & Maintenance (58.1%), while the most female-oriented occupations are Healthcare Support (100.0%), Firefighting & Prevention (100.0%), and Personal Care & Service (94.6%).
| Occupation | Male | Female |
| Healthcare Support | 0 (0.0%) | 28 (100.0%) |
| Security & Protection | 4 (28.6%) | 10 (71.4%) |
| Firefighting & Prevention | 0 (0.0%) | 10 (100.0%) |
| Law Enforcement | 4 (100.0%) | 0 (0.0%) |
| Food Preparation & Serving | 34 (61.8%) | 21 (38.2%) |
| Cleaning & Maintenance | 18 (58.1%) | 13 (41.9%) |
| Personal Care & Service | 2 (5.4%) | 35 (94.6%) |
| Total (Category) | 58 (35.1%) | 107 (64.8%) |
| Total (Overall) | 654 (52.7%) | 587 (47.3%) |
Sales and Office Occupations
The most common Sales and Office occupations in Aviston are Sales & Related (116 | 9.3%), and Office & Administration (95 | 7.7%).
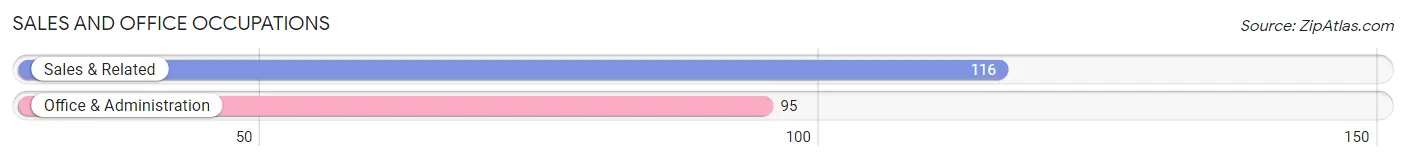
Sales and Office Occupations by Sex
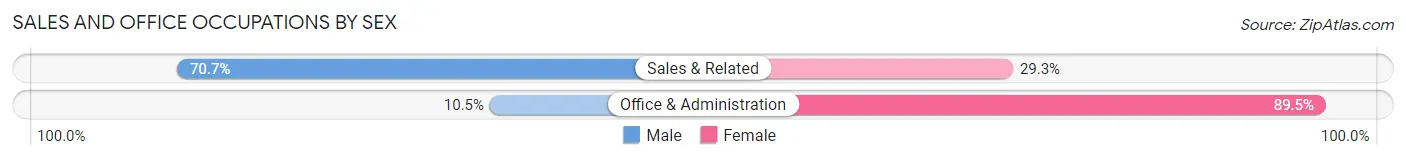
| Occupation | Male | Female |
| Sales & Related | 82 (70.7%) | 34 (29.3%) |
| Office & Administration | 10 (10.5%) | 85 (89.5%) |
| Total (Category) | 92 (43.6%) | 119 (56.4%) |
| Total (Overall) | 654 (52.7%) | 587 (47.3%) |
Natural Resources, Construction and Maintenance Occupations
The most common Natural Resources, Construction and Maintenance occupations in Aviston are Construction & Extraction (121 | 9.8%), Installation, Maintenance & Repair (52 | 4.2%), and Farming, Fishing & Forestry (4 | 0.3%).
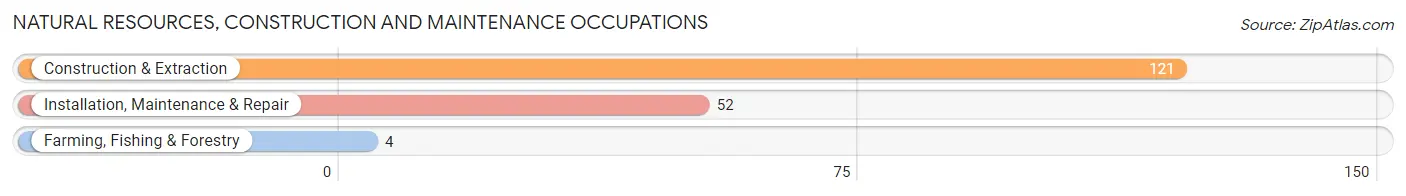
Natural Resources, Construction and Maintenance Occupations by Sex
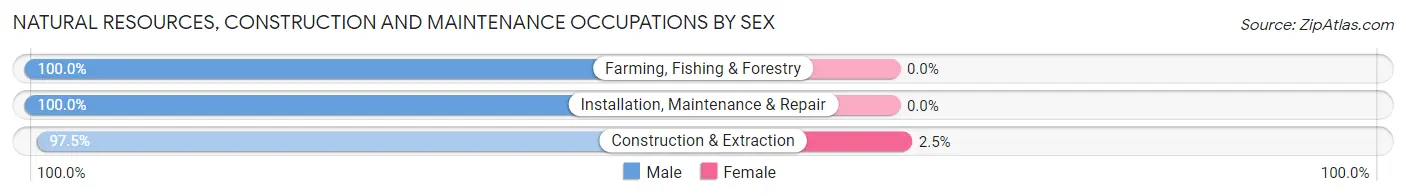
| Occupation | Male | Female |
| Farming, Fishing & Forestry | 4 (100.0%) | 0 (0.0%) |
| Construction & Extraction | 118 (97.5%) | 3 (2.5%) |
| Installation, Maintenance & Repair | 52 (100.0%) | 0 (0.0%) |
| Total (Category) | 174 (98.3%) | 3 (1.7%) |
| Total (Overall) | 654 (52.7%) | 587 (47.3%) |
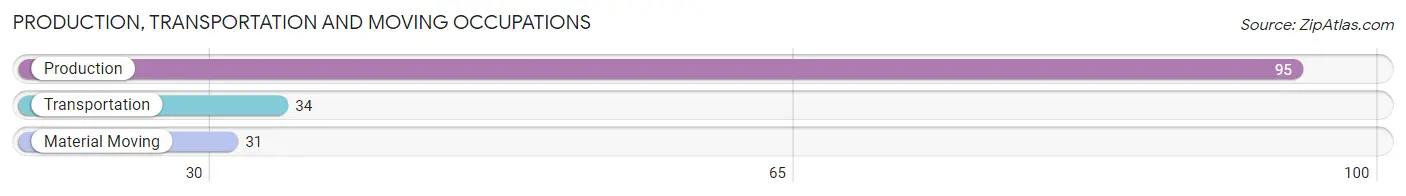
Production, Transportation and Moving Occupations
The most common Production, Transportation and Moving occupations in Aviston are Production (95 | 7.7%), Transportation (34 | 2.7%), and Material Moving (31 | 2.5%).
Production, Transportation and Moving Occupations by Sex
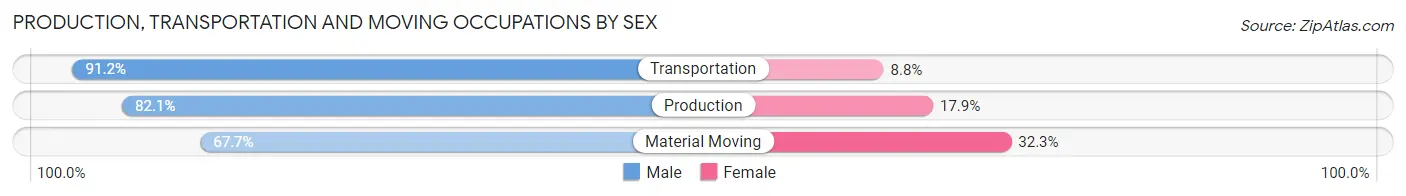
| Occupation | Male | Female |
| Production | 78 (82.1%) | 17 (17.9%) |
| Transportation | 31 (91.2%) | 3 (8.8%) |
| Material Moving | 21 (67.7%) | 10 (32.3%) |
| Total (Category) | 130 (81.2%) | 30 (18.8%) |
| Total (Overall) | 654 (52.7%) | 587 (47.3%) |
Employment Industries by Sex in Aviston
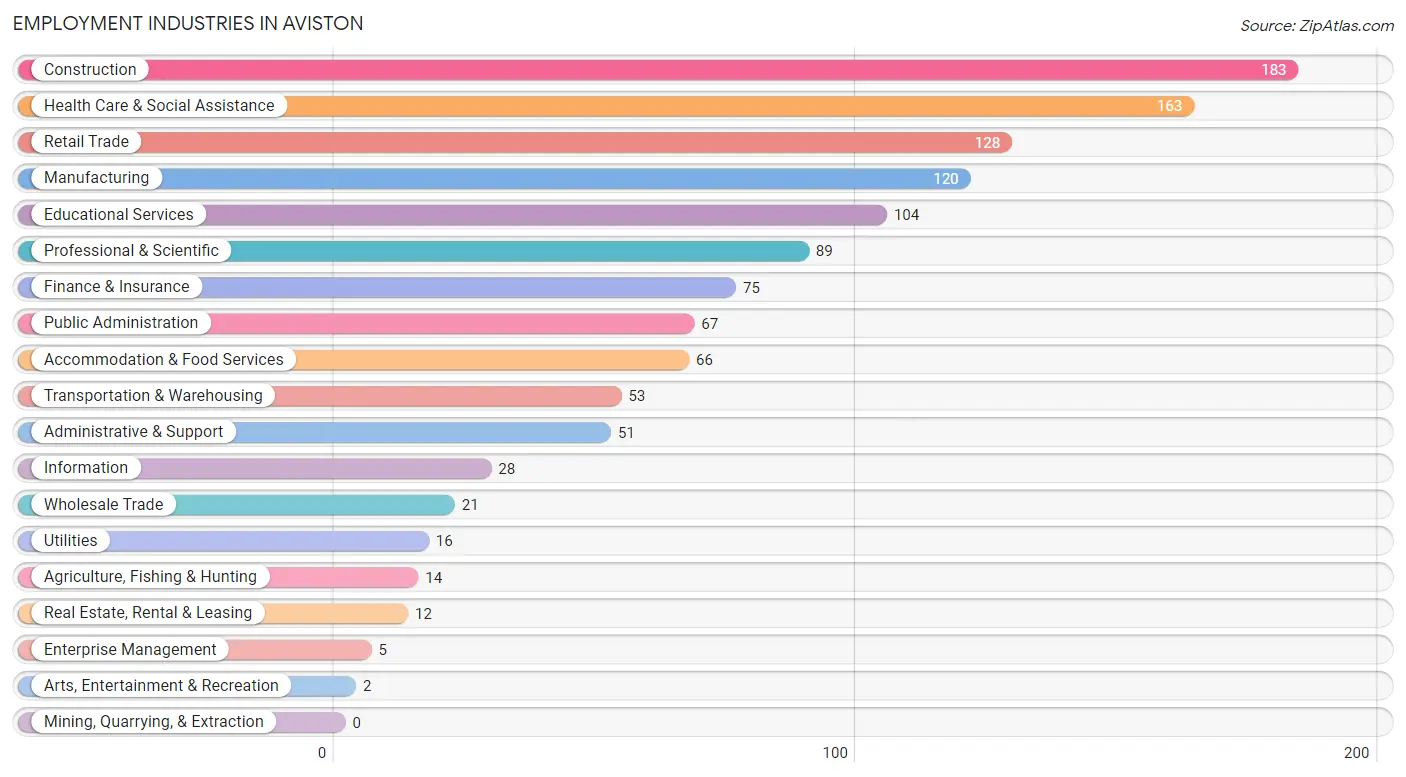
Employment Industries in Aviston
The major employment industries in Aviston include Construction (183 | 14.7%), Health Care & Social Assistance (163 | 13.1%), Retail Trade (128 | 10.3%), Manufacturing (120 | 9.7%), and Educational Services (104 | 8.4%).
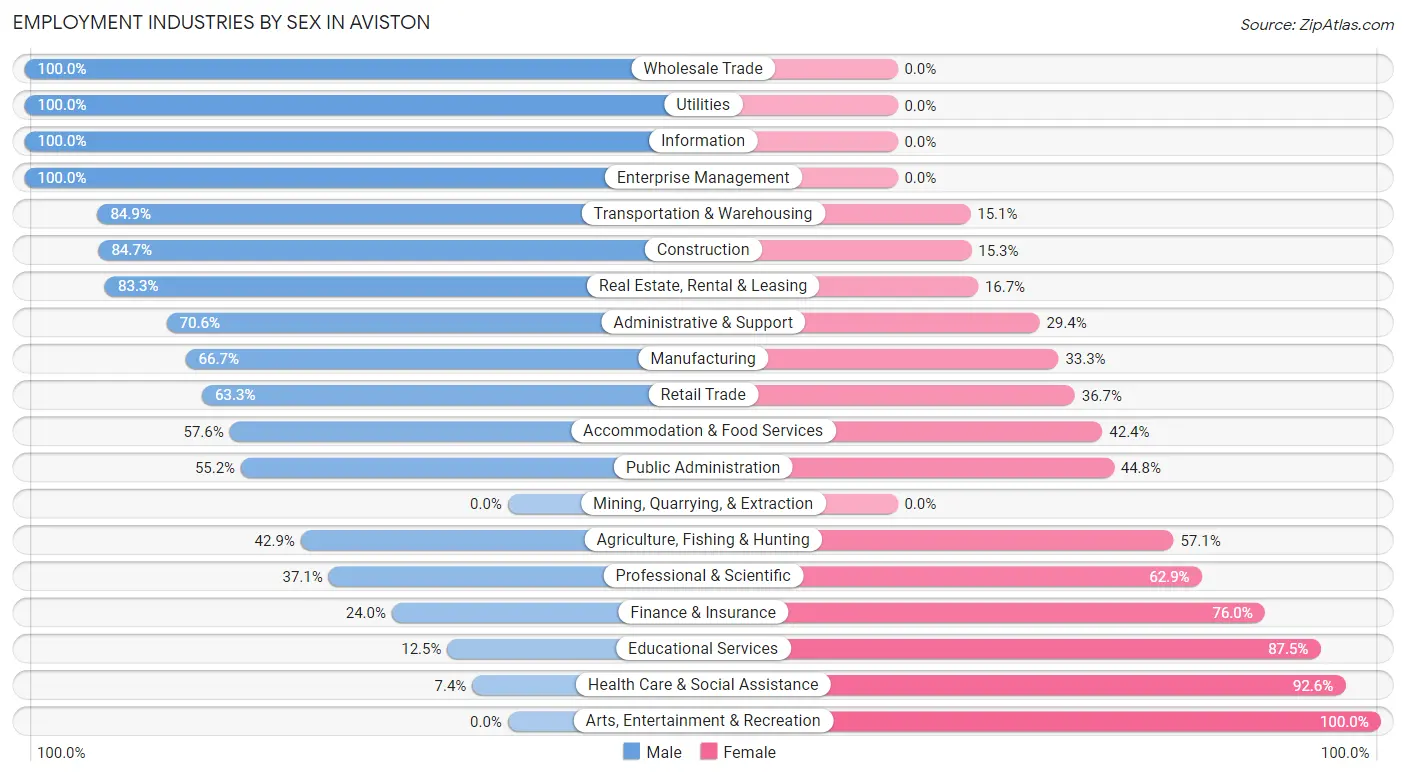
Employment Industries by Sex in Aviston
The Aviston industries that see more men than women are Wholesale Trade (100.0%), Utilities (100.0%), and Information (100.0%), whereas the industries that tend to have a higher number of women are Arts, Entertainment & Recreation (100.0%), Health Care & Social Assistance (92.6%), and Educational Services (87.5%).
| Industry | Male | Female |
| Agriculture, Fishing & Hunting | 6 (42.9%) | 8 (57.1%) |
| Mining, Quarrying, & Extraction | 0 (0.0%) | 0 (0.0%) |
| Construction | 155 (84.7%) | 28 (15.3%) |
| Manufacturing | 80 (66.7%) | 40 (33.3%) |
| Wholesale Trade | 21 (100.0%) | 0 (0.0%) |
| Retail Trade | 81 (63.3%) | 47 (36.7%) |
| Transportation & Warehousing | 45 (84.9%) | 8 (15.1%) |
| Utilities | 16 (100.0%) | 0 (0.0%) |
| Information | 28 (100.0%) | 0 (0.0%) |
| Finance & Insurance | 18 (24.0%) | 57 (76.0%) |
| Real Estate, Rental & Leasing | 10 (83.3%) | 2 (16.7%) |
| Professional & Scientific | 33 (37.1%) | 56 (62.9%) |
| Enterprise Management | 5 (100.0%) | 0 (0.0%) |
| Administrative & Support | 36 (70.6%) | 15 (29.4%) |
| Educational Services | 13 (12.5%) | 91 (87.5%) |
| Health Care & Social Assistance | 12 (7.4%) | 151 (92.6%) |
| Arts, Entertainment & Recreation | 0 (0.0%) | 2 (100.0%) |
| Accommodation & Food Services | 38 (57.6%) | 28 (42.4%) |
| Public Administration | 37 (55.2%) | 30 (44.8%) |
| Total | 654 (52.7%) | 587 (47.3%) |
Education in Aviston
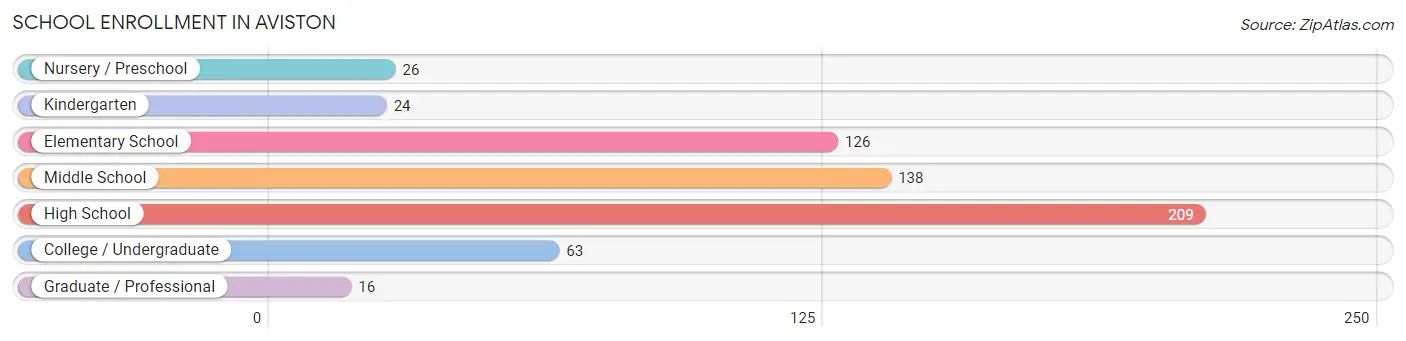
School Enrollment in Aviston
The most common levels of schooling among the 602 students in Aviston are high school (209 | 34.7%), middle school (138 | 22.9%), and elementary school (126 | 20.9%).
| School Level | # Students | % Students |
| Nursery / Preschool | 26 | 4.3% |
| Kindergarten | 24 | 4.0% |
| Elementary School | 126 | 20.9% |
| Middle School | 138 | 22.9% |
| High School | 209 | 34.7% |
| College / Undergraduate | 63 | 10.5% |
| Graduate / Professional | 16 | 2.7% |
| Total | 602 | 100.0% |
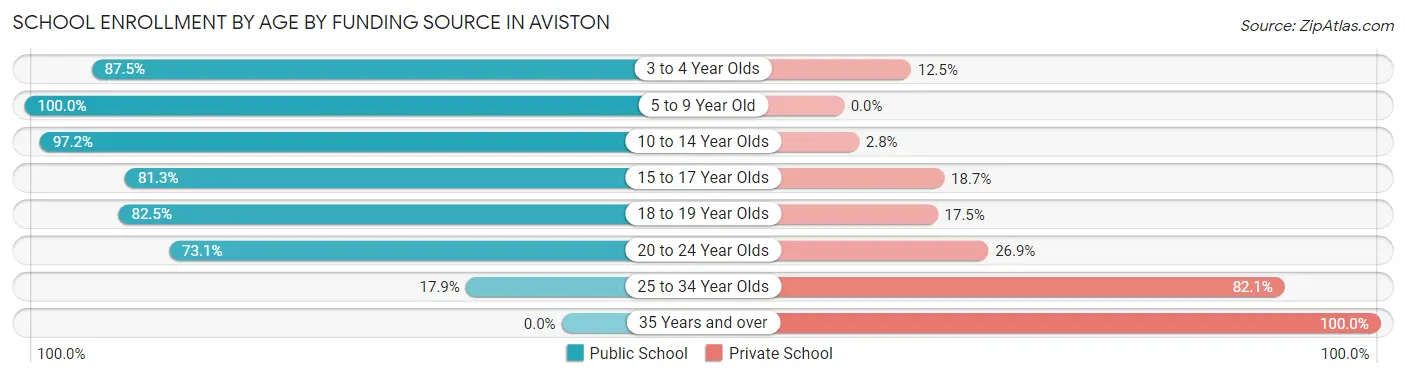
School Enrollment by Age by Funding Source in Aviston
Out of a total of 602 students who are enrolled in schools in Aviston, 79 (13.1%) attend a private institution, while the remaining 523 (86.9%) are enrolled in public schools. The age group of 35 years and over has the highest likelihood of being enrolled in private schools, with 2 (100.0% in the age bracket) enrolled. Conversely, the age group of 5 to 9 year old has the lowest likelihood of being enrolled in a private school, with 134 (100.0% in the age bracket) attending a public institution.
| Age Bracket | Public School | Private School |
| 3 to 4 Year Olds | 21 (87.5%) | 3 (12.5%) |
| 5 to 9 Year Old | 134 (100.0%) | 0 (0.0%) |
| 10 to 14 Year Olds | 172 (97.2%) | 5 (2.8%) |
| 15 to 17 Year Olds | 139 (81.3%) | 32 (18.7%) |
| 18 to 19 Year Olds | 33 (82.5%) | 7 (17.5%) |
| 20 to 24 Year Olds | 19 (73.1%) | 7 (26.9%) |
| 25 to 34 Year Olds | 5 (17.9%) | 23 (82.1%) |
| 35 Years and over | 0 (0.0%) | 2 (100.0%) |
| Total | 523 (86.9%) | 79 (13.1%) |
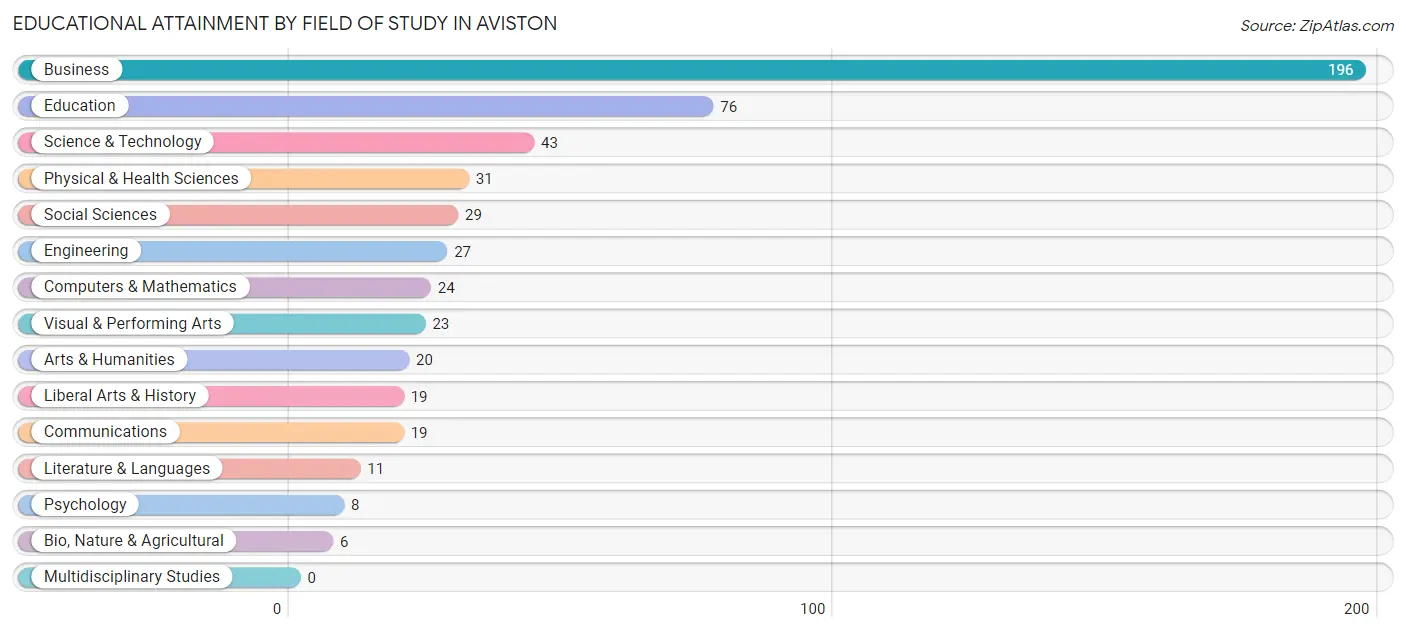
Educational Attainment by Field of Study in Aviston
Business (196 | 36.8%), education (76 | 14.3%), science & technology (43 | 8.1%), physical & health sciences (31 | 5.8%), and social sciences (29 | 5.4%) are the most common fields of study among 532 individuals in Aviston who have obtained a bachelor's degree or higher.
| Field of Study | # Graduates | % Graduates |
| Computers & Mathematics | 24 | 4.5% |
| Bio, Nature & Agricultural | 6 | 1.1% |
| Physical & Health Sciences | 31 | 5.8% |
| Psychology | 8 | 1.5% |
| Social Sciences | 29 | 5.4% |
| Engineering | 27 | 5.1% |
| Multidisciplinary Studies | 0 | 0.0% |
| Science & Technology | 43 | 8.1% |
| Business | 196 | 36.8% |
| Education | 76 | 14.3% |
| Literature & Languages | 11 | 2.1% |
| Liberal Arts & History | 19 | 3.6% |
| Visual & Performing Arts | 23 | 4.3% |
| Communications | 19 | 3.6% |
| Arts & Humanities | 20 | 3.8% |
| Total | 532 | 100.0% |
Transportation & Commute in Aviston
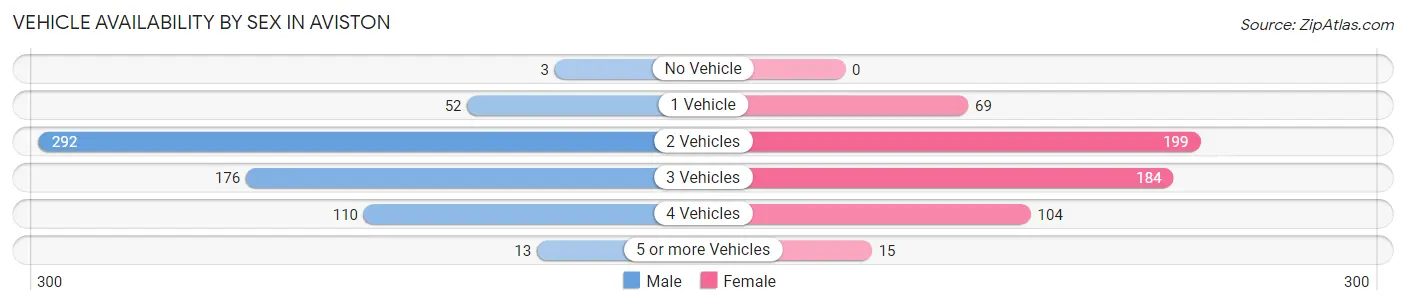
Vehicle Availability by Sex in Aviston
The most prevalent vehicle ownership categories in Aviston are males with 2 vehicles (292, accounting for 45.2%) and females with 2 vehicles (199, making up 51.1%).
| Vehicles Available | Male | Female |
| No Vehicle | 3 (0.5%) | 0 (0.0%) |
| 1 Vehicle | 52 (8.1%) | 69 (12.1%) |
| 2 Vehicles | 292 (45.2%) | 199 (34.8%) |
| 3 Vehicles | 176 (27.2%) | 184 (32.2%) |
| 4 Vehicles | 110 (17.0%) | 104 (18.2%) |
| 5 or more Vehicles | 13 (2.0%) | 15 (2.6%) |
| Total | 646 (100.0%) | 571 (100.0%) |
Commute Time in Aviston
The most frequently occuring commute durations in Aviston are 30 to 34 minutes (168 commuters, 15.7%), 10 to 14 minutes (161 commuters, 15.0%), and 45 to 59 minutes (130 commuters, 12.1%).
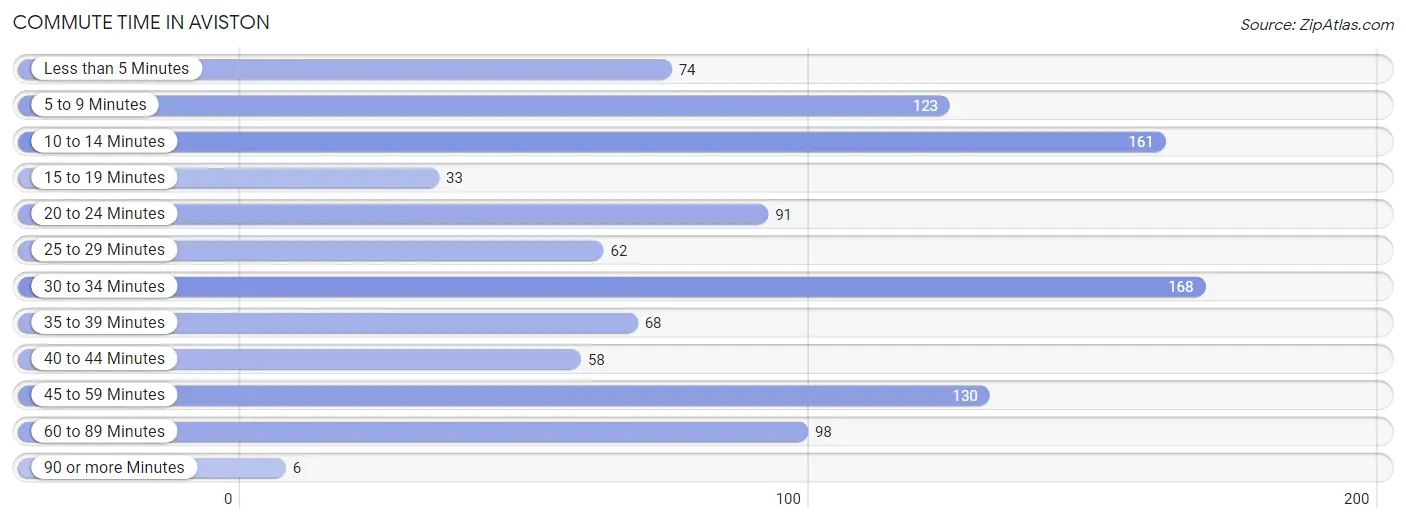
| Commute Time | # Commuters | % Commuters |
| Less than 5 Minutes | 74 | 6.9% |
| 5 to 9 Minutes | 123 | 11.5% |
| 10 to 14 Minutes | 161 | 15.0% |
| 15 to 19 Minutes | 33 | 3.1% |
| 20 to 24 Minutes | 91 | 8.5% |
| 25 to 29 Minutes | 62 | 5.8% |
| 30 to 34 Minutes | 168 | 15.7% |
| 35 to 39 Minutes | 68 | 6.3% |
| 40 to 44 Minutes | 58 | 5.4% |
| 45 to 59 Minutes | 130 | 12.1% |
| 60 to 89 Minutes | 98 | 9.1% |
| 90 or more Minutes | 6 | 0.6% |
Commute Time by Sex in Aviston
The most common commute times in Aviston are 10 to 14 minutes (84 commuters, 14.0%) for males and 30 to 34 minutes (85 commuters, 18.0%) for females.
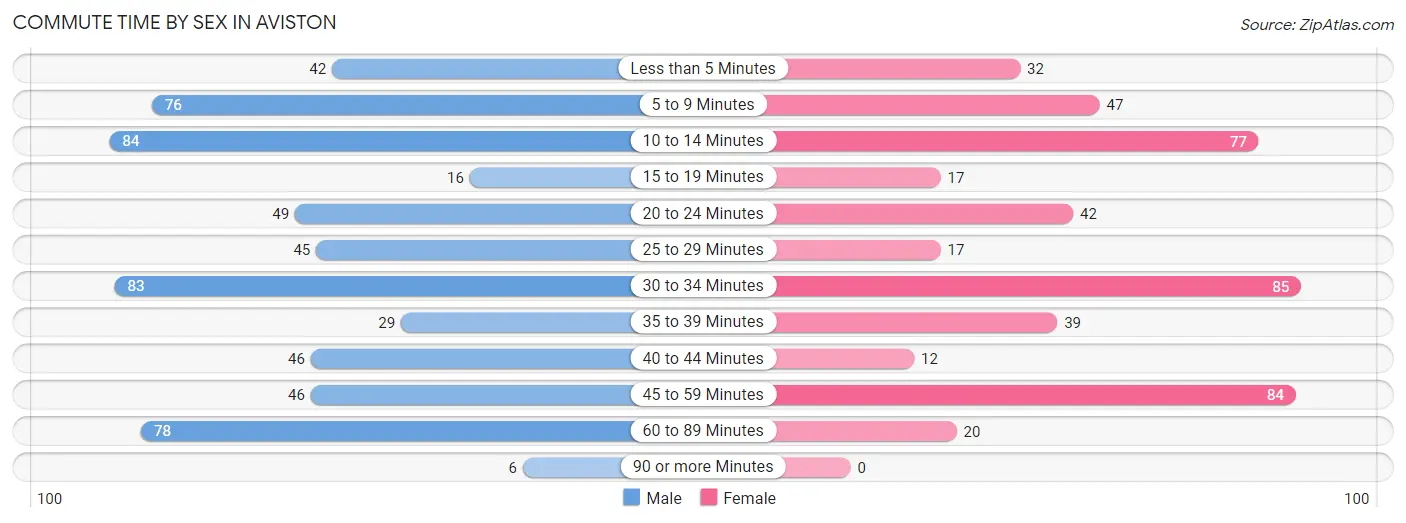
| Commute Time | Male | Female |
| Less than 5 Minutes | 42 (7.0%) | 32 (6.8%) |
| 5 to 9 Minutes | 76 (12.7%) | 47 (10.0%) |
| 10 to 14 Minutes | 84 (14.0%) | 77 (16.3%) |
| 15 to 19 Minutes | 16 (2.7%) | 17 (3.6%) |
| 20 to 24 Minutes | 49 (8.2%) | 42 (8.9%) |
| 25 to 29 Minutes | 45 (7.5%) | 17 (3.6%) |
| 30 to 34 Minutes | 83 (13.8%) | 85 (18.0%) |
| 35 to 39 Minutes | 29 (4.8%) | 39 (8.3%) |
| 40 to 44 Minutes | 46 (7.7%) | 12 (2.5%) |
| 45 to 59 Minutes | 46 (7.7%) | 84 (17.8%) |
| 60 to 89 Minutes | 78 (13.0%) | 20 (4.2%) |
| 90 or more Minutes | 6 (1.0%) | 0 (0.0%) |
Time of Departure to Work by Sex in Aviston
The most frequent times of departure to work in Aviston are 7:00 AM to 7:29 AM (126, 21.0%) for males and 7:00 AM to 7:29 AM (112, 23.7%) for females.
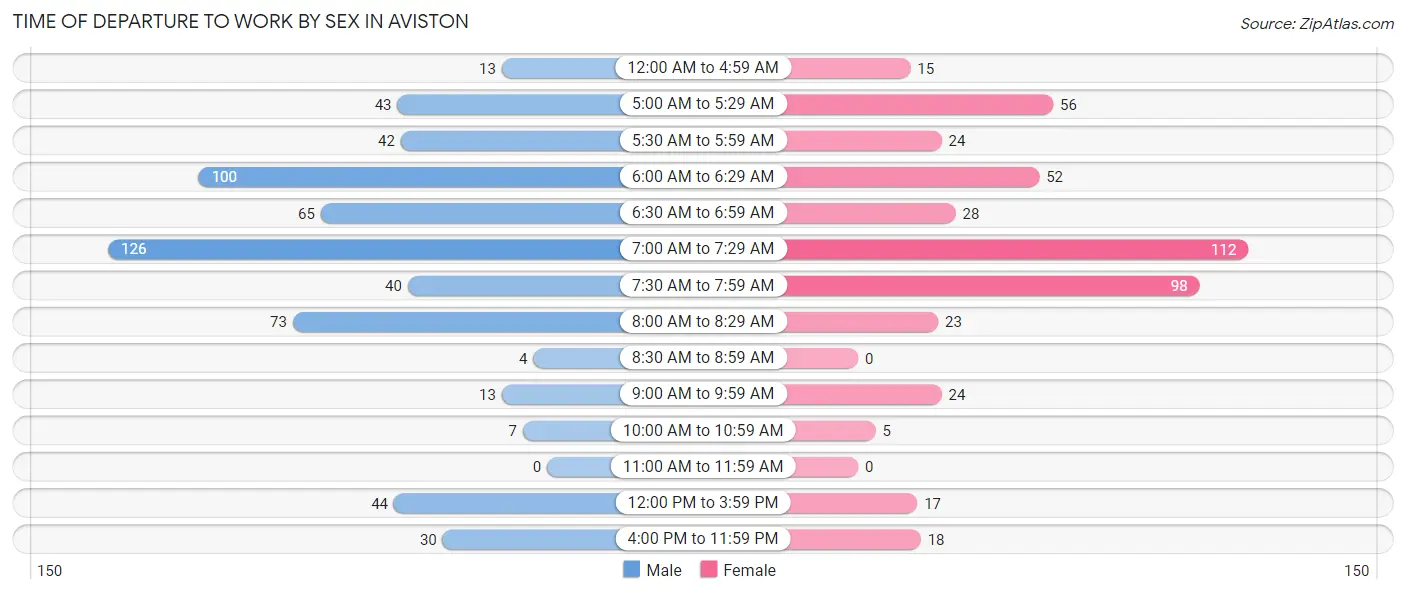
| Time of Departure | Male | Female |
| 12:00 AM to 4:59 AM | 13 (2.2%) | 15 (3.2%) |
| 5:00 AM to 5:29 AM | 43 (7.2%) | 56 (11.9%) |
| 5:30 AM to 5:59 AM | 42 (7.0%) | 24 (5.1%) |
| 6:00 AM to 6:29 AM | 100 (16.7%) | 52 (11.0%) |
| 6:30 AM to 6:59 AM | 65 (10.8%) | 28 (5.9%) |
| 7:00 AM to 7:29 AM | 126 (21.0%) | 112 (23.7%) |
| 7:30 AM to 7:59 AM | 40 (6.7%) | 98 (20.8%) |
| 8:00 AM to 8:29 AM | 73 (12.2%) | 23 (4.9%) |
| 8:30 AM to 8:59 AM | 4 (0.7%) | 0 (0.0%) |
| 9:00 AM to 9:59 AM | 13 (2.2%) | 24 (5.1%) |
| 10:00 AM to 10:59 AM | 7 (1.2%) | 5 (1.1%) |
| 11:00 AM to 11:59 AM | 0 (0.0%) | 0 (0.0%) |
| 12:00 PM to 3:59 PM | 44 (7.3%) | 17 (3.6%) |
| 4:00 PM to 11:59 PM | 30 (5.0%) | 18 (3.8%) |
| Total | 600 (100.0%) | 472 (100.0%) |
Housing Occupancy in Aviston
Occupancy by Ownership in Aviston
Of the total 866 dwellings in Aviston, owner-occupied units account for 694 (80.1%), while renter-occupied units make up 172 (19.9%).
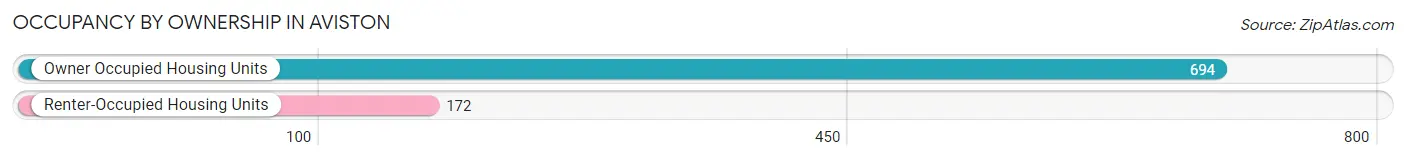
| Occupancy | # Housing Units | % Housing Units |
| Owner Occupied Housing Units | 694 | 80.1% |
| Renter-Occupied Housing Units | 172 | 19.9% |
| Total Occupied Housing Units | 866 | 100.0% |
Occupancy by Household Size in Aviston
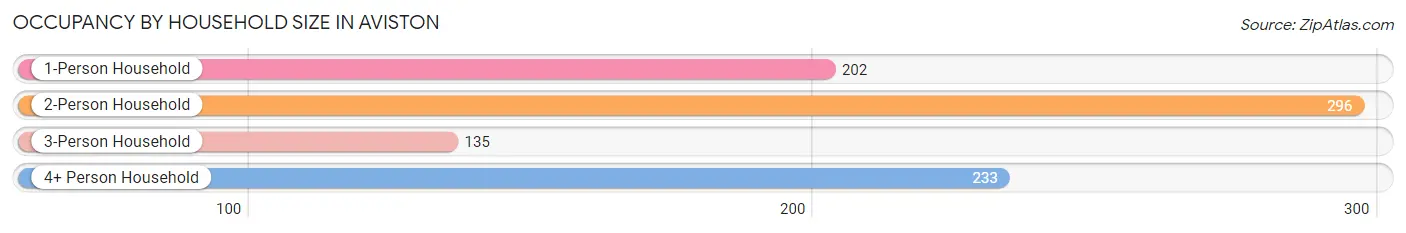
| Household Size | # Housing Units | % Housing Units |
| 1-Person Household | 202 | 23.3% |
| 2-Person Household | 296 | 34.2% |
| 3-Person Household | 135 | 15.6% |
| 4+ Person Household | 233 | 26.9% |
| Total Housing Units | 866 | 100.0% |
Occupancy by Ownership by Household Size in Aviston
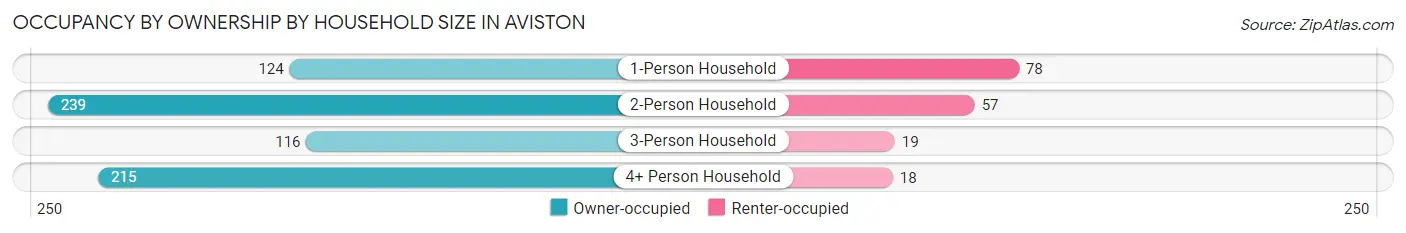
| Household Size | Owner-occupied | Renter-occupied |
| 1-Person Household | 124 (61.4%) | 78 (38.6%) |
| 2-Person Household | 239 (80.7%) | 57 (19.3%) |
| 3-Person Household | 116 (85.9%) | 19 (14.1%) |
| 4+ Person Household | 215 (92.3%) | 18 (7.7%) |
| Total Housing Units | 694 (80.1%) | 172 (19.9%) |
Occupancy by Educational Attainment in Aviston
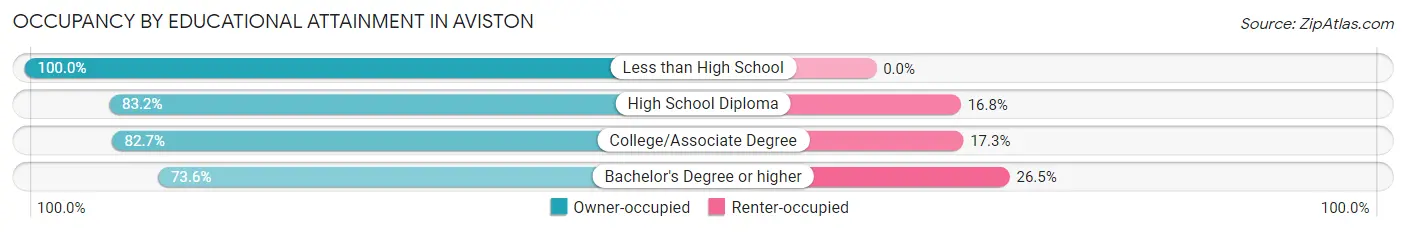
| Household Size | Owner-occupied | Renter-occupied |
| Less than High School | 11 (100.0%) | 0 (0.0%) |
| High School Diploma | 154 (83.2%) | 31 (16.8%) |
| College/Associate Degree | 326 (82.7%) | 68 (17.3%) |
| Bachelor's Degree or higher | 203 (73.6%) | 73 (26.5%) |
Occupancy by Age of Householder in Aviston
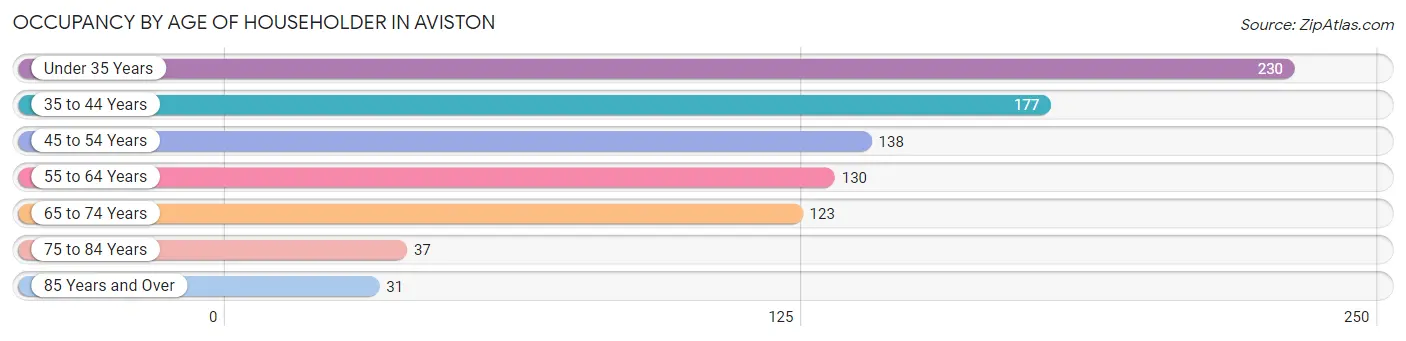
| Age Bracket | # Households | % Households |
| Under 35 Years | 230 | 26.6% |
| 35 to 44 Years | 177 | 20.4% |
| 45 to 54 Years | 138 | 15.9% |
| 55 to 64 Years | 130 | 15.0% |
| 65 to 74 Years | 123 | 14.2% |
| 75 to 84 Years | 37 | 4.3% |
| 85 Years and Over | 31 | 3.6% |
| Total | 866 | 100.0% |
Housing Finances in Aviston
Median Income by Occupancy in Aviston
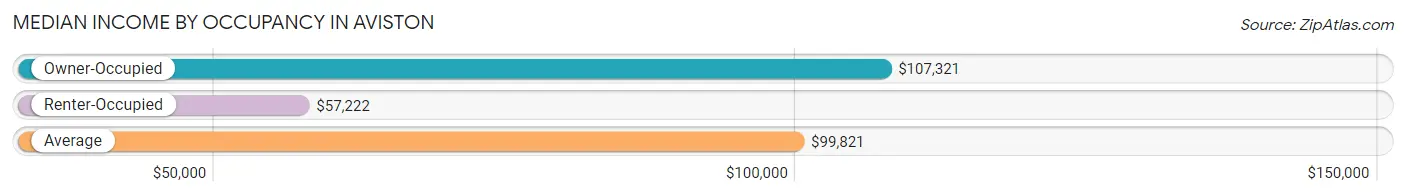
| Occupancy Type | # Households | Median Income |
| Owner-Occupied | 694 (80.1%) | $107,321 |
| Renter-Occupied | 172 (19.9%) | $57,222 |
| Average | 866 (100.0%) | $99,821 |
Occupancy by Householder Income Bracket in Aviston
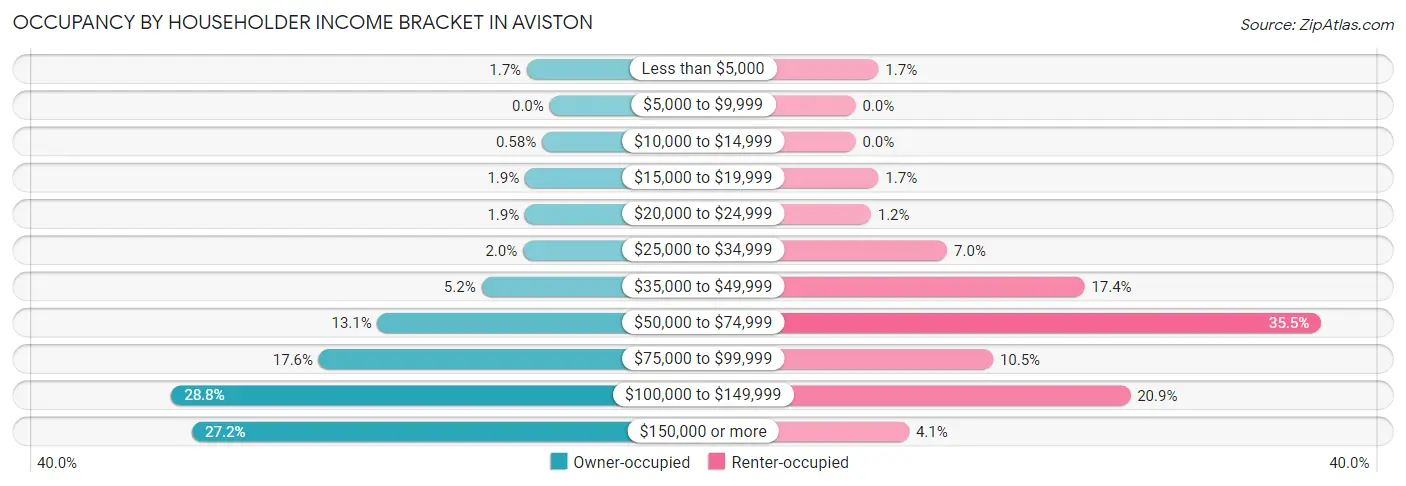
| Income Bracket | Owner-occupied | Renter-occupied |
| Less than $5,000 | 12 (1.7%) | 3 (1.7%) |
| $5,000 to $9,999 | 0 (0.0%) | 0 (0.0%) |
| $10,000 to $14,999 | 4 (0.6%) | 0 (0.0%) |
| $15,000 to $19,999 | 13 (1.9%) | 3 (1.7%) |
| $20,000 to $24,999 | 13 (1.9%) | 2 (1.2%) |
| $25,000 to $34,999 | 14 (2.0%) | 12 (7.0%) |
| $35,000 to $49,999 | 36 (5.2%) | 30 (17.4%) |
| $50,000 to $74,999 | 91 (13.1%) | 61 (35.5%) |
| $75,000 to $99,999 | 122 (17.6%) | 18 (10.5%) |
| $100,000 to $149,999 | 200 (28.8%) | 36 (20.9%) |
| $150,000 or more | 189 (27.2%) | 7 (4.1%) |
| Total | 694 (100.0%) | 172 (100.0%) |
Monthly Housing Cost Tiers in Aviston
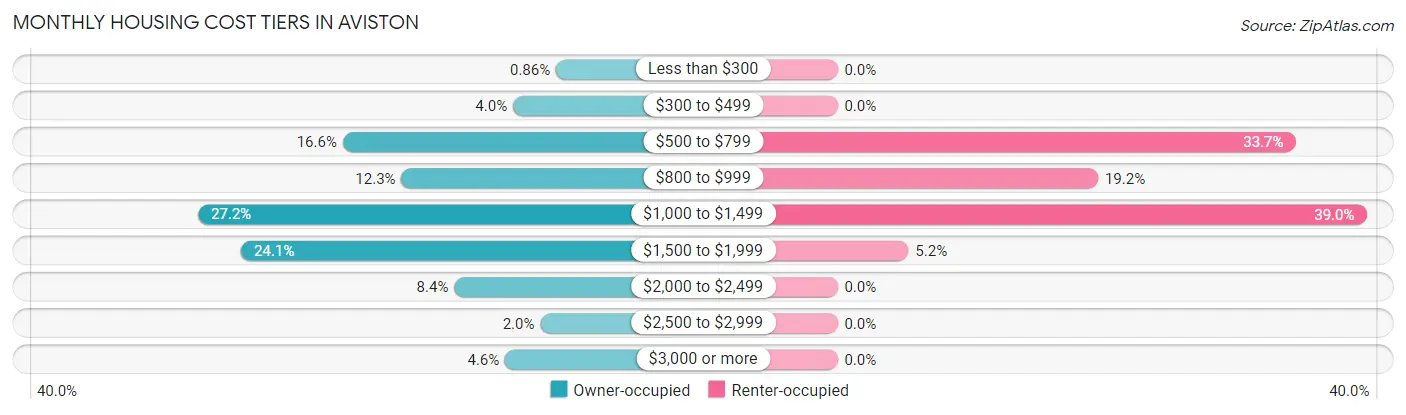
| Monthly Cost | Owner-occupied | Renter-occupied |
| Less than $300 | 6 (0.9%) | 0 (0.0%) |
| $300 to $499 | 28 (4.0%) | 0 (0.0%) |
| $500 to $799 | 115 (16.6%) | 58 (33.7%) |
| $800 to $999 | 85 (12.2%) | 33 (19.2%) |
| $1,000 to $1,499 | 189 (27.2%) | 67 (39.0%) |
| $1,500 to $1,999 | 167 (24.1%) | 9 (5.2%) |
| $2,000 to $2,499 | 58 (8.4%) | 0 (0.0%) |
| $2,500 to $2,999 | 14 (2.0%) | 0 (0.0%) |
| $3,000 or more | 32 (4.6%) | 0 (0.0%) |
| Total | 694 (100.0%) | 172 (100.0%) |
Physical Housing Characteristics in Aviston
Housing Structures in Aviston
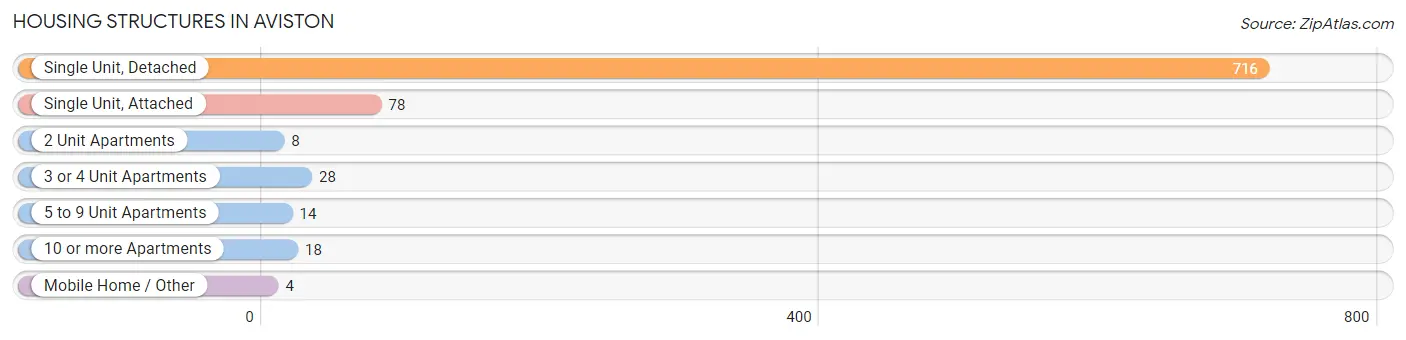
| Structure Type | # Housing Units | % Housing Units |
| Single Unit, Detached | 716 | 82.7% |
| Single Unit, Attached | 78 | 9.0% |
| 2 Unit Apartments | 8 | 0.9% |
| 3 or 4 Unit Apartments | 28 | 3.2% |
| 5 to 9 Unit Apartments | 14 | 1.6% |
| 10 or more Apartments | 18 | 2.1% |
| Mobile Home / Other | 4 | 0.5% |
| Total | 866 | 100.0% |
Housing Structures by Occupancy in Aviston
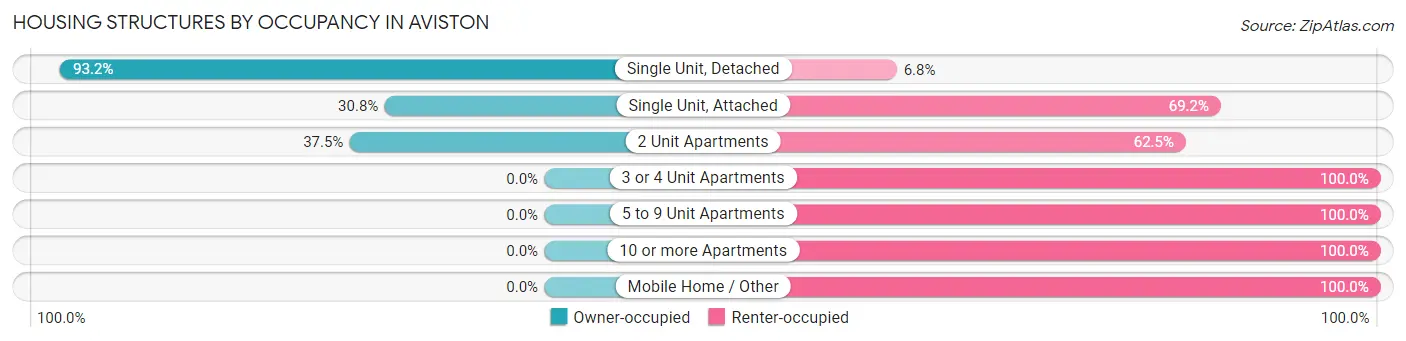
| Structure Type | Owner-occupied | Renter-occupied |
| Single Unit, Detached | 667 (93.2%) | 49 (6.8%) |
| Single Unit, Attached | 24 (30.8%) | 54 (69.2%) |
| 2 Unit Apartments | 3 (37.5%) | 5 (62.5%) |
| 3 or 4 Unit Apartments | 0 (0.0%) | 28 (100.0%) |
| 5 to 9 Unit Apartments | 0 (0.0%) | 14 (100.0%) |
| 10 or more Apartments | 0 (0.0%) | 18 (100.0%) |
| Mobile Home / Other | 0 (0.0%) | 4 (100.0%) |
| Total | 694 (80.1%) | 172 (19.9%) |
Housing Structures by Number of Rooms in Aviston
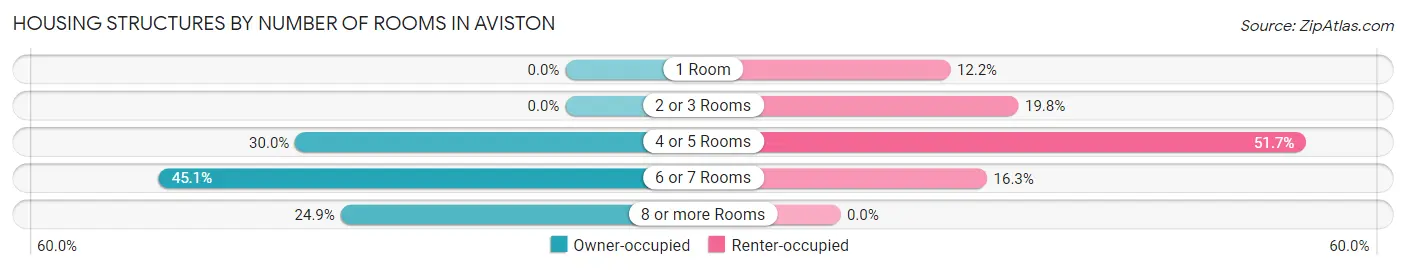
| Number of Rooms | Owner-occupied | Renter-occupied |
| 1 Room | 0 (0.0%) | 21 (12.2%) |
| 2 or 3 Rooms | 0 (0.0%) | 34 (19.8%) |
| 4 or 5 Rooms | 208 (30.0%) | 89 (51.7%) |
| 6 or 7 Rooms | 313 (45.1%) | 28 (16.3%) |
| 8 or more Rooms | 173 (24.9%) | 0 (0.0%) |
| Total | 694 (100.0%) | 172 (100.0%) |
Housing Structure by Heating Type in Aviston
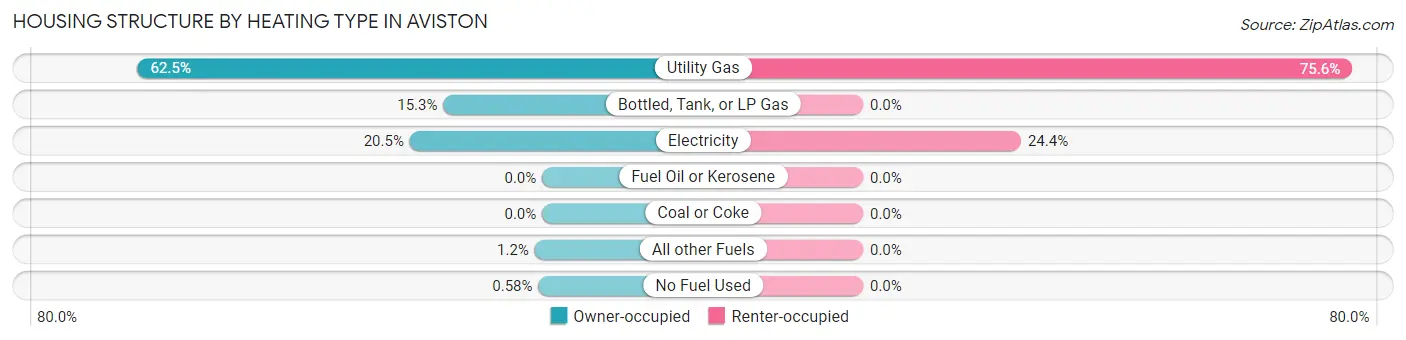
| Heating Type | Owner-occupied | Renter-occupied |
| Utility Gas | 434 (62.5%) | 130 (75.6%) |
| Bottled, Tank, or LP Gas | 106 (15.3%) | 0 (0.0%) |
| Electricity | 142 (20.5%) | 42 (24.4%) |
| Fuel Oil or Kerosene | 0 (0.0%) | 0 (0.0%) |
| Coal or Coke | 0 (0.0%) | 0 (0.0%) |
| All other Fuels | 8 (1.1%) | 0 (0.0%) |
| No Fuel Used | 4 (0.6%) | 0 (0.0%) |
| Total | 694 (100.0%) | 172 (100.0%) |
Household Vehicle Usage in Aviston
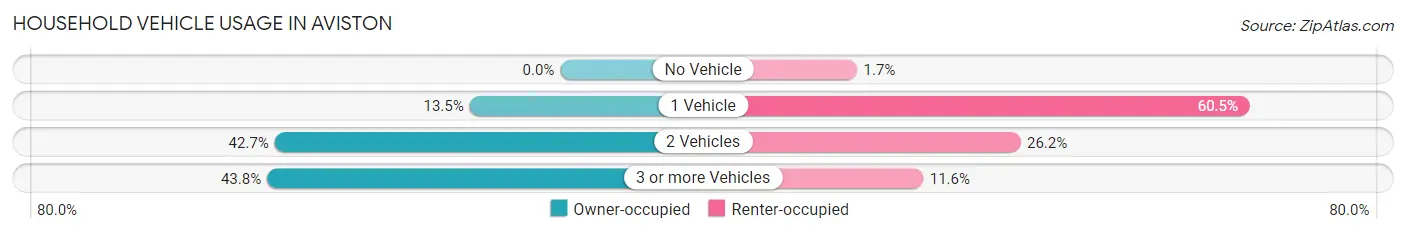
| Vehicles per Household | Owner-occupied | Renter-occupied |
| No Vehicle | 0 (0.0%) | 3 (1.7%) |
| 1 Vehicle | 94 (13.5%) | 104 (60.5%) |
| 2 Vehicles | 296 (42.6%) | 45 (26.2%) |
| 3 or more Vehicles | 304 (43.8%) | 20 (11.6%) |
| Total | 694 (100.0%) | 172 (100.0%) |
Real Estate & Mortgages in Aviston
Real Estate and Mortgage Overview in Aviston
| Characteristic | Without Mortgage | With Mortgage |
| Housing Units | 210 | 484 |
| Median Property Value | $208,200 | $192,700 |
| Median Household Income | $83,750 | $151 |
| Monthly Housing Costs | $697 | $32 |
| Real Estate Taxes | $4,011 | $7 |
Property Value by Mortgage Status in Aviston
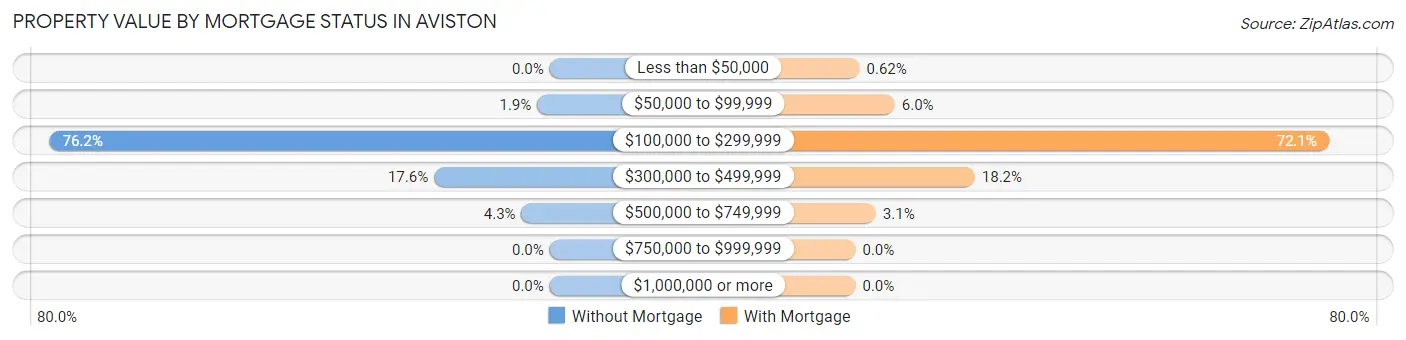
| Property Value | Without Mortgage | With Mortgage |
| Less than $50,000 | 0 (0.0%) | 3 (0.6%) |
| $50,000 to $99,999 | 4 (1.9%) | 29 (6.0%) |
| $100,000 to $299,999 | 160 (76.2%) | 349 (72.1%) |
| $300,000 to $499,999 | 37 (17.6%) | 88 (18.2%) |
| $500,000 to $749,999 | 9 (4.3%) | 15 (3.1%) |
| $750,000 to $999,999 | 0 (0.0%) | 0 (0.0%) |
| $1,000,000 or more | 0 (0.0%) | 0 (0.0%) |
| Total | 210 (100.0%) | 484 (100.0%) |
Household Income by Mortgage Status in Aviston
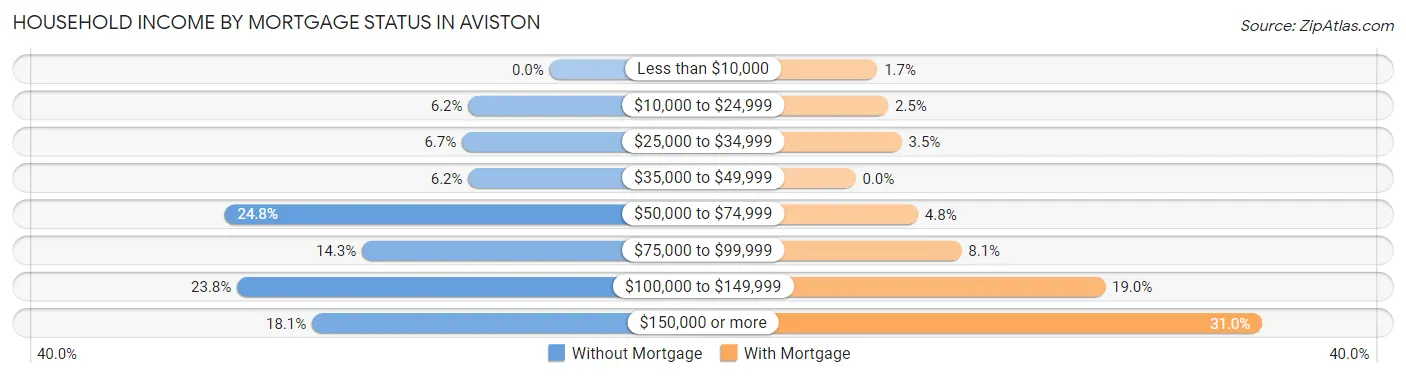
| Household Income | Without Mortgage | With Mortgage |
| Less than $10,000 | 0 (0.0%) | 8 (1.7%) |
| $10,000 to $24,999 | 13 (6.2%) | 12 (2.5%) |
| $25,000 to $34,999 | 14 (6.7%) | 17 (3.5%) |
| $35,000 to $49,999 | 13 (6.2%) | 0 (0.0%) |
| $50,000 to $74,999 | 52 (24.8%) | 23 (4.8%) |
| $75,000 to $99,999 | 30 (14.3%) | 39 (8.1%) |
| $100,000 to $149,999 | 50 (23.8%) | 92 (19.0%) |
| $150,000 or more | 38 (18.1%) | 150 (31.0%) |
| Total | 210 (100.0%) | 484 (100.0%) |
Property Value to Household Income Ratio in Aviston
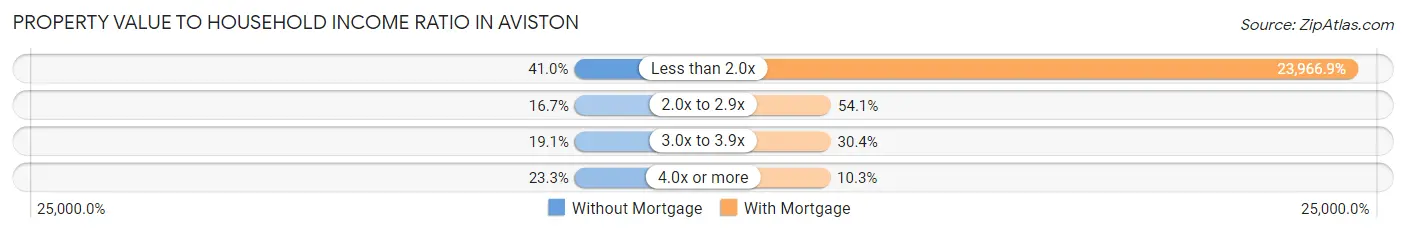
| Value-to-Income Ratio | Without Mortgage | With Mortgage |
| Less than 2.0x | 86 (40.9%) | 116,000 (23,966.9%) |
| 2.0x to 2.9x | 35 (16.7%) | 262 (54.1%) |
| 3.0x to 3.9x | 40 (19.1%) | 147 (30.4%) |
| 4.0x or more | 49 (23.3%) | 50 (10.3%) |
| Total | 210 (100.0%) | 484 (100.0%) |
Real Estate Taxes by Mortgage Status in Aviston
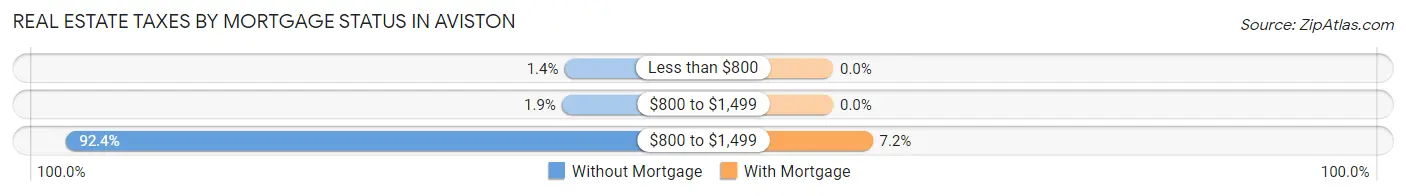
| Property Taxes | Without Mortgage | With Mortgage |
| Less than $800 | 3 (1.4%) | 0 (0.0%) |
| $800 to $1,499 | 4 (1.9%) | 0 (0.0%) |
| $800 to $1,499 | 194 (92.4%) | 35 (7.2%) |
| Total | 210 (100.0%) | 484 (100.0%) |
Health & Disability in Aviston
Health Insurance Coverage by Age in Aviston
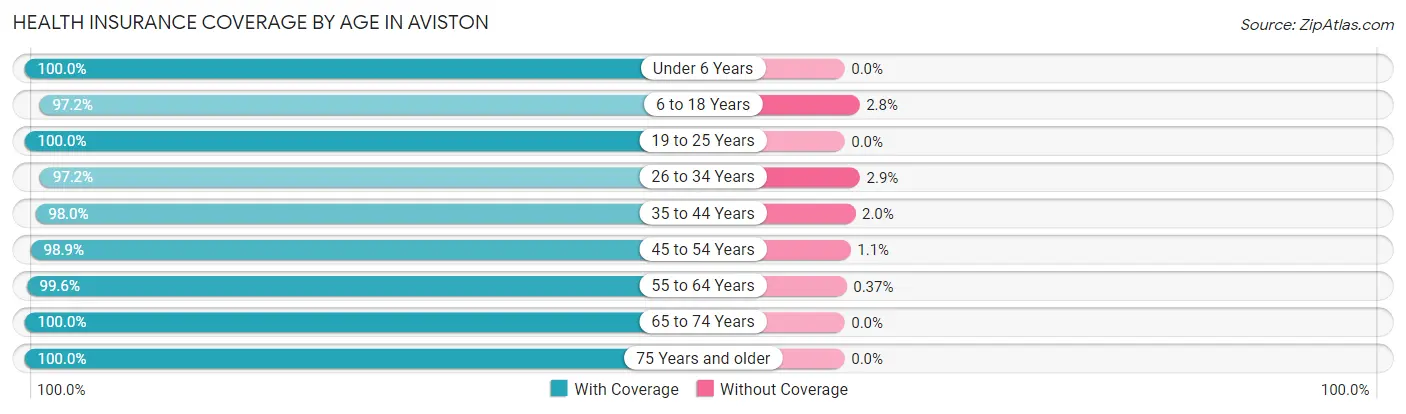
| Age Bracket | With Coverage | Without Coverage |
| Under 6 Years | 177 (100.0%) | 0 (0.0%) |
| 6 to 18 Years | 490 (97.2%) | 14 (2.8%) |
| 19 to 25 Years | 147 (100.0%) | 0 (0.0%) |
| 26 to 34 Years | 307 (97.2%) | 9 (2.9%) |
| 35 to 44 Years | 294 (98.0%) | 6 (2.0%) |
| 45 to 54 Years | 262 (98.9%) | 3 (1.1%) |
| 55 to 64 Years | 271 (99.6%) | 1 (0.4%) |
| 65 to 74 Years | 167 (100.0%) | 0 (0.0%) |
| 75 Years and older | 91 (100.0%) | 0 (0.0%) |
| Total | 2,206 (98.5%) | 33 (1.5%) |
Health Insurance Coverage by Citizenship Status in Aviston
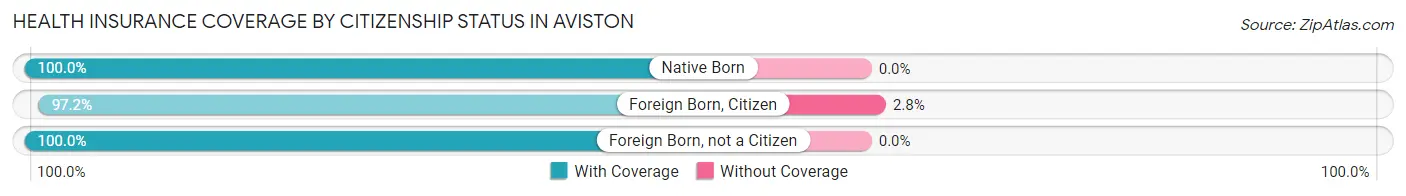
| Citizenship Status | With Coverage | Without Coverage |
| Native Born | 177 (100.0%) | 0 (0.0%) |
| Foreign Born, Citizen | 490 (97.2%) | 14 (2.8%) |
| Foreign Born, not a Citizen | 147 (100.0%) | 0 (0.0%) |
Health Insurance Coverage by Household Income in Aviston
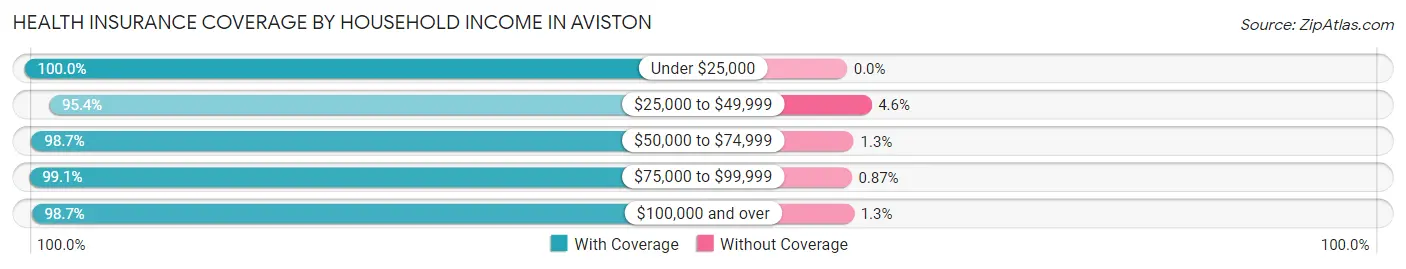
| Household Income | With Coverage | Without Coverage |
| Under $25,000 | 62 (100.0%) | 0 (0.0%) |
| $25,000 to $49,999 | 188 (95.4%) | 9 (4.6%) |
| $50,000 to $74,999 | 311 (98.7%) | 4 (1.3%) |
| $75,000 to $99,999 | 343 (99.1%) | 3 (0.9%) |
| $100,000 and over | 1,302 (98.7%) | 17 (1.3%) |
Public vs Private Health Insurance Coverage by Age in Aviston
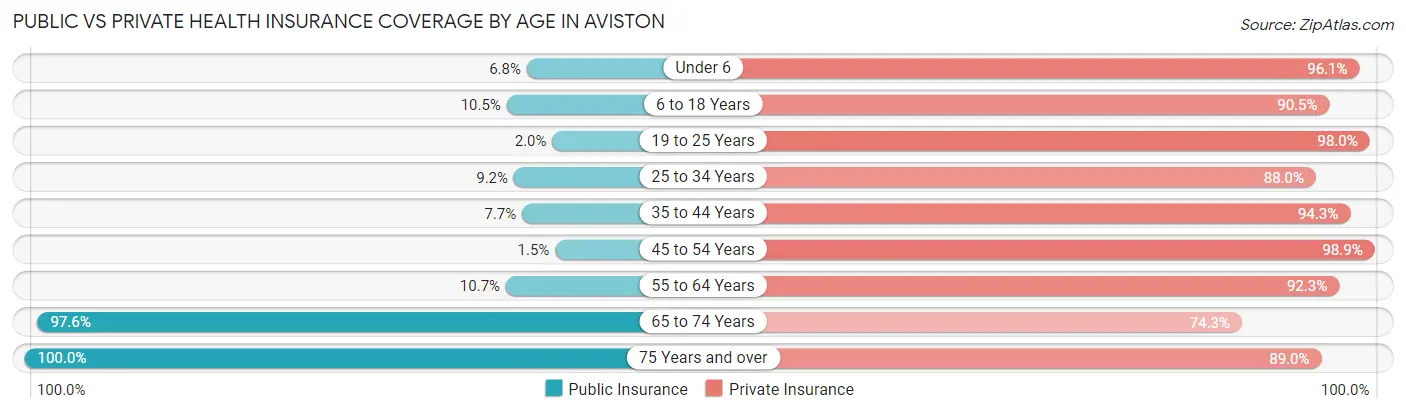
| Age Bracket | Public Insurance | Private Insurance |
| Under 6 | 12 (6.8%) | 170 (96.1%) |
| 6 to 18 Years | 53 (10.5%) | 456 (90.5%) |
| 19 to 25 Years | 3 (2.0%) | 144 (98.0%) |
| 25 to 34 Years | 29 (9.2%) | 278 (88.0%) |
| 35 to 44 Years | 23 (7.7%) | 283 (94.3%) |
| 45 to 54 Years | 4 (1.5%) | 262 (98.9%) |
| 55 to 64 Years | 29 (10.7%) | 251 (92.3%) |
| 65 to 74 Years | 163 (97.6%) | 124 (74.3%) |
| 75 Years and over | 91 (100.0%) | 81 (89.0%) |
| Total | 407 (18.2%) | 2,049 (91.5%) |
Disability Status by Sex by Age in Aviston
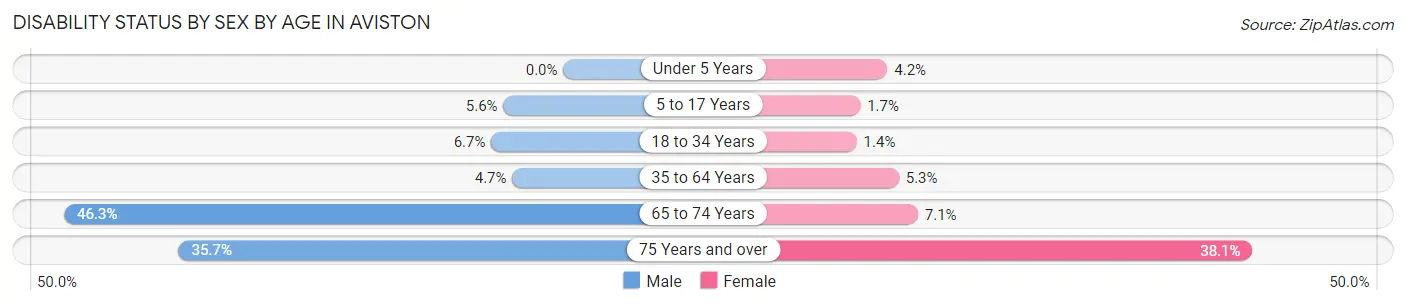
| Age Bracket | Male | Female |
| Under 5 Years | 0 (0.0%) | 3 (4.2%) |
| 5 to 17 Years | 11 (5.6%) | 5 (1.7%) |
| 18 to 34 Years | 19 (6.7%) | 3 (1.4%) |
| 35 to 64 Years | 19 (4.7%) | 23 (5.3%) |
| 65 to 74 Years | 38 (46.3%) | 6 (7.1%) |
| 75 Years and over | 10 (35.7%) | 24 (38.1%) |
Disability Class by Sex by Age in Aviston
Disability Class: Hearing Difficulty
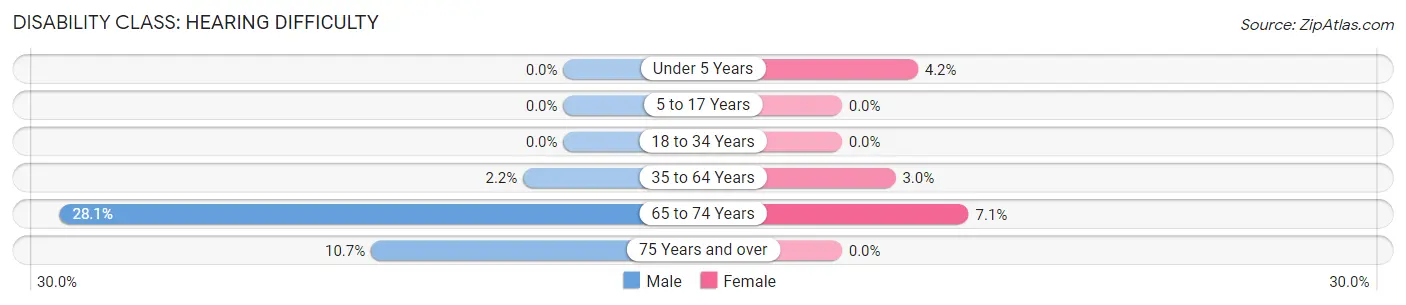
| Age Bracket | Male | Female |
| Under 5 Years | 0 (0.0%) | 3 (4.2%) |
| 5 to 17 Years | 0 (0.0%) | 0 (0.0%) |
| 18 to 34 Years | 0 (0.0%) | 0 (0.0%) |
| 35 to 64 Years | 9 (2.2%) | 13 (3.0%) |
| 65 to 74 Years | 23 (28.1%) | 6 (7.1%) |
| 75 Years and over | 3 (10.7%) | 0 (0.0%) |
Disability Class: Vision Difficulty
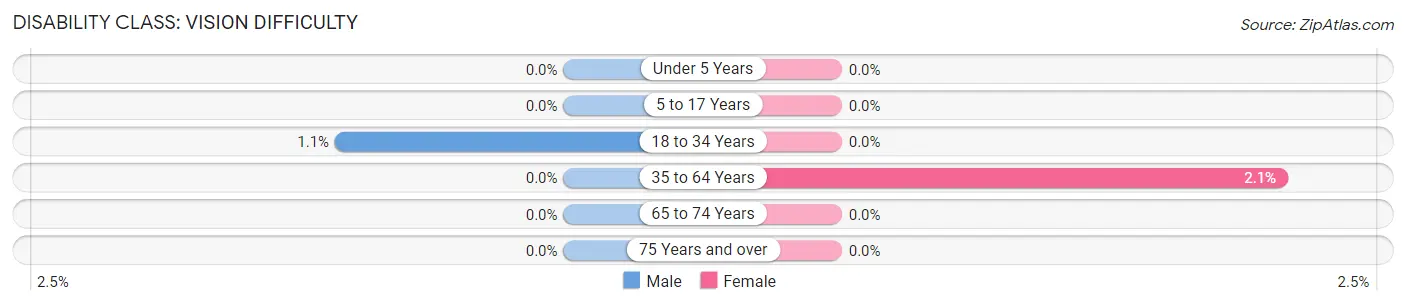
| Age Bracket | Male | Female |
| Under 5 Years | 0 (0.0%) | 0 (0.0%) |
| 5 to 17 Years | 0 (0.0%) | 0 (0.0%) |
| 18 to 34 Years | 3 (1.1%) | 0 (0.0%) |
| 35 to 64 Years | 0 (0.0%) | 9 (2.1%) |
| 65 to 74 Years | 0 (0.0%) | 0 (0.0%) |
| 75 Years and over | 0 (0.0%) | 0 (0.0%) |
Disability Class: Cognitive Difficulty
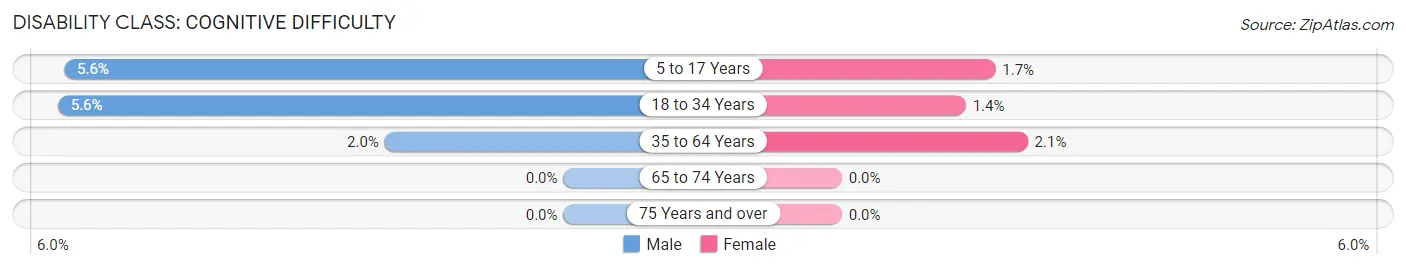
| Age Bracket | Male | Female |
| 5 to 17 Years | 11 (5.6%) | 5 (1.7%) |
| 18 to 34 Years | 16 (5.6%) | 3 (1.4%) |
| 35 to 64 Years | 8 (2.0%) | 9 (2.1%) |
| 65 to 74 Years | 0 (0.0%) | 0 (0.0%) |
| 75 Years and over | 0 (0.0%) | 0 (0.0%) |
Disability Class: Ambulatory Difficulty
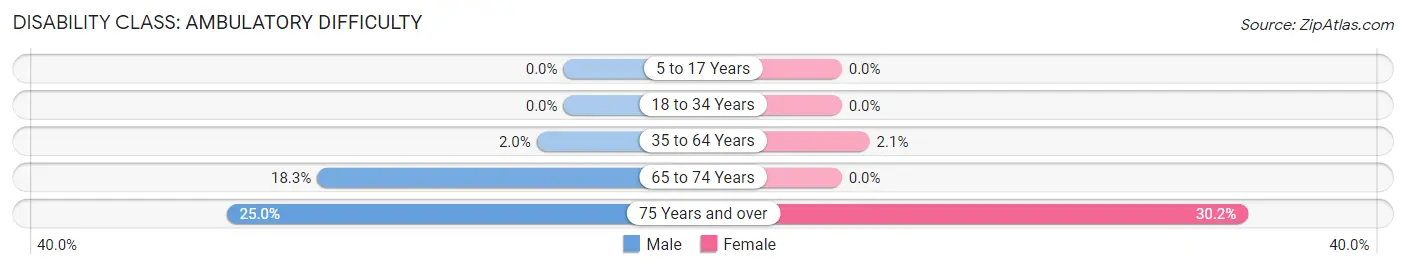
| Age Bracket | Male | Female |
| 5 to 17 Years | 0 (0.0%) | 0 (0.0%) |
| 18 to 34 Years | 0 (0.0%) | 0 (0.0%) |
| 35 to 64 Years | 8 (2.0%) | 9 (2.1%) |
| 65 to 74 Years | 15 (18.3%) | 0 (0.0%) |
| 75 Years and over | 7 (25.0%) | 19 (30.2%) |
Disability Class: Self-Care Difficulty
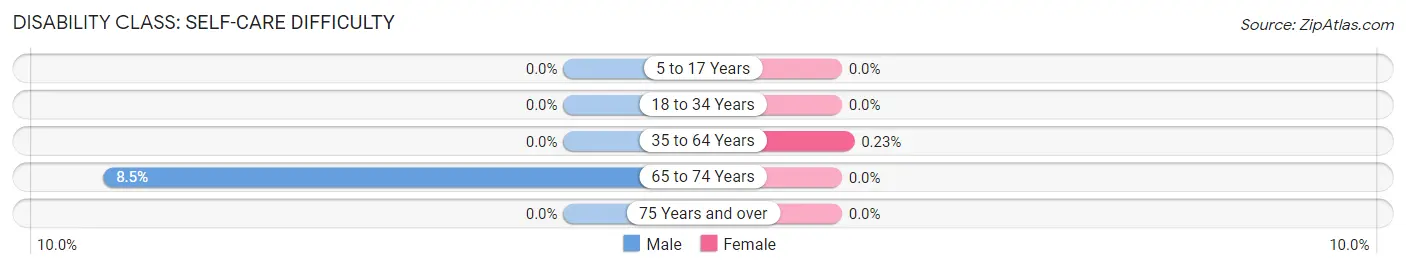
| Age Bracket | Male | Female |
| 5 to 17 Years | 0 (0.0%) | 0 (0.0%) |
| 18 to 34 Years | 0 (0.0%) | 0 (0.0%) |
| 35 to 64 Years | 0 (0.0%) | 1 (0.2%) |
| 65 to 74 Years | 7 (8.5%) | 0 (0.0%) |
| 75 Years and over | 0 (0.0%) | 0 (0.0%) |
Technology Access in Aviston
Computing Device Access in Aviston
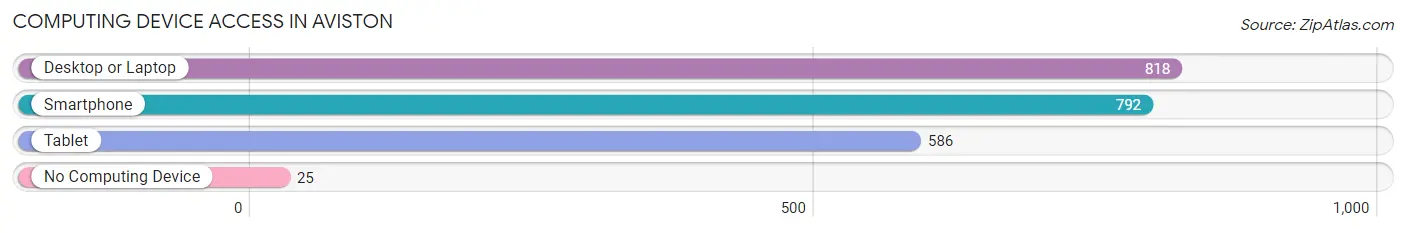
| Device Type | # Households | % Households |
| Desktop or Laptop | 818 | 94.5% |
| Smartphone | 792 | 91.4% |
| Tablet | 586 | 67.7% |
| No Computing Device | 25 | 2.9% |
| Total | 866 | 100.0% |
Internet Access in Aviston
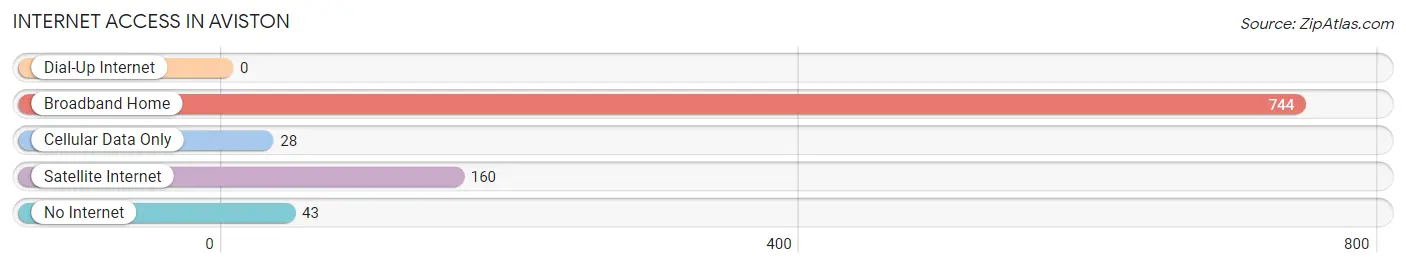
| Internet Type | # Households | % Households |
| Dial-Up Internet | 0 | 0.0% |
| Broadband Home | 744 | 85.9% |
| Cellular Data Only | 28 | 3.2% |
| Satellite Internet | 160 | 18.5% |
| No Internet | 43 | 5.0% |
| Total | 866 | 100.0% |
Aviston Summary
Aviston, Illinois is a small village located in Clinton County, Illinois. It is situated in the southwestern part of the state, about 25 miles east of St. Louis, Missouri. The village has a population of 1,717 people, according to the 2010 census.
History
Aviston was founded in 1854 by German immigrants who had come to the area in search of a better life. The village was named after the Aviston family, who were among the first settlers. The village was incorporated in 1872.
Aviston has a rich history of German culture and traditions. The village was home to a large German-speaking population until the mid-20th century. The village was also home to a large Catholic population, and the St. Francis Catholic Church was built in 1875.
Geography
Aviston is located in the southwestern part of Clinton County, Illinois. It is situated on the banks of the Kaskaskia River, which flows through the village. The village is surrounded by rolling hills and farmland.
The climate in Aviston is humid continental, with hot summers and cold winters. The average annual temperature is around 50 degrees Fahrenheit.
Economy
Aviston’s economy is largely based on agriculture. The village is home to several farms, which produce corn, soybeans, and other crops. The village also has a few small businesses, including a grocery store, a hardware store, and a few restaurants.
Demographics
According to the 2010 census, Aviston has a population of 1,717 people. The population is predominantly white (97.2%), with a small percentage of African Americans (1.2%) and Hispanics (1.1%). The median household income is $50,945, and the median age is 41.
Aviston is a small village with a rich history and a strong sense of community. The village is home to a diverse population, and its economy is largely based on agriculture. Aviston is a great place to live and work, and it is a great place to visit.
Common Questions
What is Per Capita Income in Aviston?
Per Capita income in Aviston is $42,934.
What is the Median Family Income in Aviston?
Median Family Income in Aviston is $116,324.
What is the Median Household income in Aviston?
Median Household Income in Aviston is $99,821.
What is Income or Wage Gap in Aviston?
Income or Wage Gap in Aviston is 31.8%.
Women in Aviston earn 68.2 cents for every dollar earned by a man.
What is Inequality or Gini Index in Aviston?
Inequality or Gini Index in Aviston is 0.37.
What is the Total Population of Aviston?
Total Population of Aviston is 2,342.
What is the Total Male Population of Aviston?
Total Male Population of Aviston is 1,125.
What is the Total Female Population of Aviston?
Total Female Population of Aviston is 1,217.
What is the Ratio of Males per 100 Females in Aviston?
There are 92.44 Males per 100 Females in Aviston.
What is the Ratio of Females per 100 Males in Aviston?
There are 108.18 Females per 100 Males in Aviston.
What is the Median Population Age in Aviston?
Median Population Age in Aviston is 35.3 Years.
What is the Average Family Size in Aviston
Average Family Size in Aviston is 3.1 People.
What is the Average Household Size in Aviston
Average Household Size in Aviston is 2.6 People.
How Large is the Labor Force in Aviston?
There are 1,273 People in the Labor Forcein in Aviston.
What is the Percentage of People in the Labor Force in Aviston?
69.1% of People are in the Labor Force in Aviston.
What is the Unemployment Rate in Aviston?
Unemployment Rate in Aviston is 0.9%.