Geneseo, IL Map & Demographics
Geneseo Map
Geneseo Overview
$40,287
PER CAPITA INCOME
$95,734
AVG FAMILY INCOME
$64,010
AVG HOUSEHOLD INCOME
23.5%
WAGE / INCOME GAP [ % ]
76.5¢/ $1
WAGE / INCOME GAP [ $ ]
0.40
INEQUALITY / GINI INDEX
6,421
TOTAL POPULATION
3,003
MALE POPULATION
3,418
FEMALE POPULATION
87.86
MALES / 100 FEMALES
113.82
FEMALES / 100 MALES
46.5
MEDIAN AGE
2.8
AVG FAMILY SIZE
2.1
AVG HOUSEHOLD SIZE
3,114
LABOR FORCE [ PEOPLE ]
61.6%
PERCENT IN LABOR FORCE
5.1%
UNEMPLOYMENT RATE
Geneseo Zip Codes
Geneseo Area Codes
Income in Geneseo
Income Overview in Geneseo
Per Capita Income in Geneseo is $40,287, while median incomes of families and households are $95,734 and $64,010 respectively.
| Characteristic | Number | Measure |
| Per Capita Income | 6,421 | $40,287 |
| Median Family Income | 1,788 | $95,734 |
| Mean Family Income | 1,788 | $103,595 |
| Median Household Income | 2,960 | $64,010 |
| Mean Household Income | 2,960 | $85,121 |
| Income Deficit | 1,788 | $0 |
| Wage / Income Gap (%) | 6,421 | 23.45% |
| Wage / Income Gap ($) | 6,421 | 76.55¢ per $1 |
| Gini / Inequality Index | 6,421 | 0.40 |
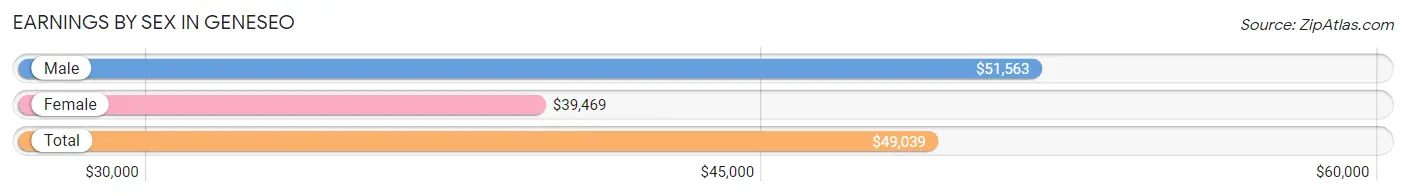
Earnings by Sex in Geneseo
Average Earnings in Geneseo are $49,039, $51,563 for men and $39,469 for women, a difference of 23.4%.
| Sex | Number | Average Earnings |
| Male | 1,687 (53.3%) | $51,563 |
| Female | 1,478 (46.7%) | $39,469 |
| Total | 3,165 (100.0%) | $49,039 |
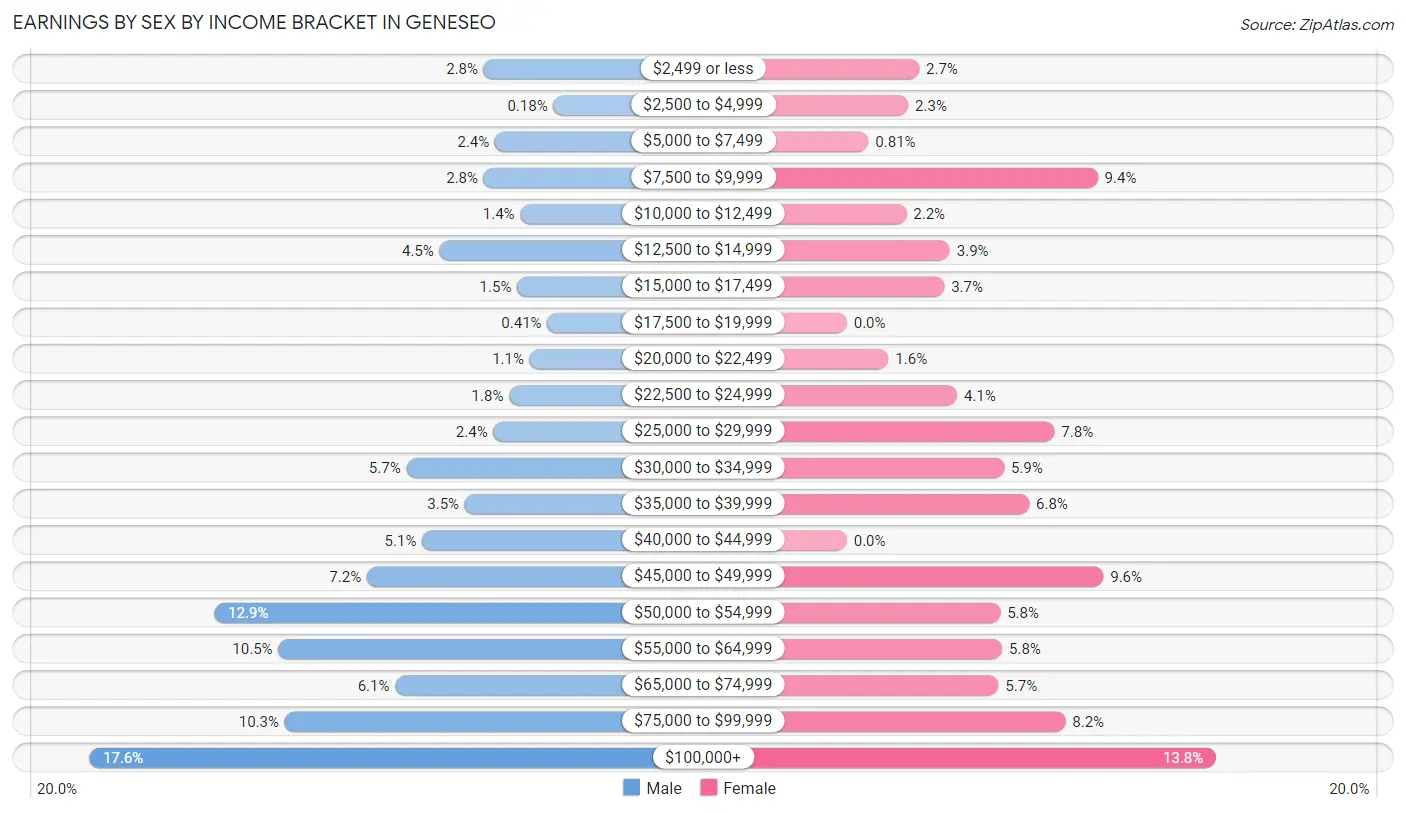
Earnings by Sex by Income Bracket in Geneseo
The most common earnings brackets in Geneseo are $100,000+ for men (296 | 17.5%) and $100,000+ for women (204 | 13.8%).
| Income | Male | Female |
| $2,499 or less | 47 (2.8%) | 40 (2.7%) |
| $2,500 to $4,999 | 3 (0.2%) | 34 (2.3%) |
| $5,000 to $7,499 | 40 (2.4%) | 12 (0.8%) |
| $7,500 to $9,999 | 47 (2.8%) | 139 (9.4%) |
| $10,000 to $12,499 | 24 (1.4%) | 33 (2.2%) |
| $12,500 to $14,999 | 75 (4.4%) | 57 (3.9%) |
| $15,000 to $17,499 | 26 (1.5%) | 54 (3.6%) |
| $17,500 to $19,999 | 7 (0.4%) | 0 (0.0%) |
| $20,000 to $22,499 | 18 (1.1%) | 23 (1.6%) |
| $22,500 to $24,999 | 31 (1.8%) | 61 (4.1%) |
| $25,000 to $29,999 | 41 (2.4%) | 115 (7.8%) |
| $30,000 to $34,999 | 96 (5.7%) | 87 (5.9%) |
| $35,000 to $39,999 | 59 (3.5%) | 101 (6.8%) |
| $40,000 to $44,999 | 86 (5.1%) | 0 (0.0%) |
| $45,000 to $49,999 | 121 (7.2%) | 142 (9.6%) |
| $50,000 to $54,999 | 217 (12.9%) | 85 (5.8%) |
| $55,000 to $64,999 | 177 (10.5%) | 86 (5.8%) |
| $65,000 to $74,999 | 103 (6.1%) | 84 (5.7%) |
| $75,000 to $99,999 | 173 (10.2%) | 121 (8.2%) |
| $100,000+ | 296 (17.5%) | 204 (13.8%) |
| Total | 1,687 (100.0%) | 1,478 (100.0%) |
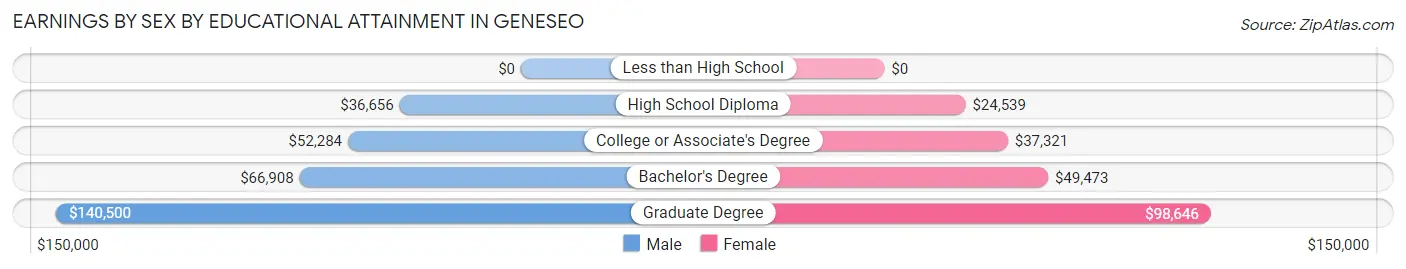
Earnings by Sex by Educational Attainment in Geneseo
Average earnings in Geneseo are $52,857 for men and $45,849 for women, a difference of 13.3%. Men with an educational attainment of graduate degree enjoy the highest average annual earnings of $140,500, while those with high school diploma education earn the least with $36,656. Women with an educational attainment of graduate degree earn the most with the average annual earnings of $98,646, while those with high school diploma education have the smallest earnings of $24,539.
| Educational Attainment | Male Income | Female Income |
| Less than High School | - | - |
| High School Diploma | $36,656 | $24,539 |
| College or Associate's Degree | $52,284 | $37,321 |
| Bachelor's Degree | $66,908 | $49,473 |
| Graduate Degree | $140,500 | $98,646 |
| Total | $52,857 | $45,849 |
Family Income in Geneseo
Family Income Brackets in Geneseo
According to the Geneseo family income data, there are 429 families falling into the $100,000 to $149,999 income range, which is the most common income bracket and makes up 24.0% of all families.
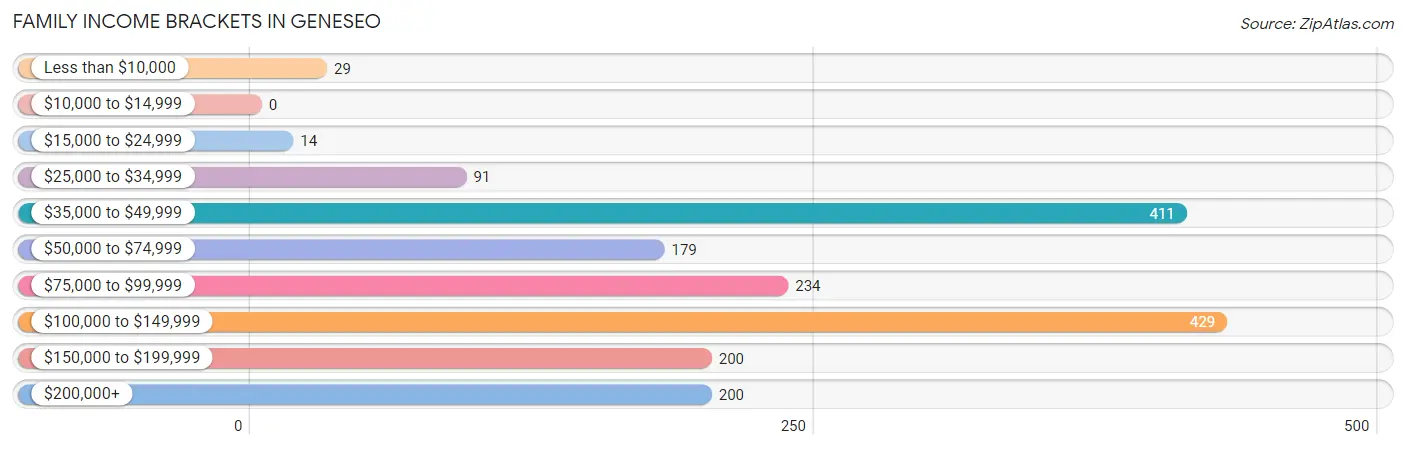
| Income Bracket | # Families | % Families |
| Less than $10,000 | 29 | 1.6% |
| $10,000 to $14,999 | 0 | 0.0% |
| $15,000 to $24,999 | 14 | 0.8% |
| $25,000 to $34,999 | 91 | 5.1% |
| $35,000 to $49,999 | 411 | 23.0% |
| $50,000 to $74,999 | 179 | 10.0% |
| $75,000 to $99,999 | 234 | 13.1% |
| $100,000 to $149,999 | 429 | 24.0% |
| $150,000 to $199,999 | 200 | 11.2% |
| $200,000+ | 200 | 11.2% |
Family Income by Famaliy Size in Geneseo
5-person families (50 | 2.8%) account for the highest median family income in Geneseo with $111,875 per family, while 2-person families (833 | 46.6%) have the highest median income of $36,080 per family member.
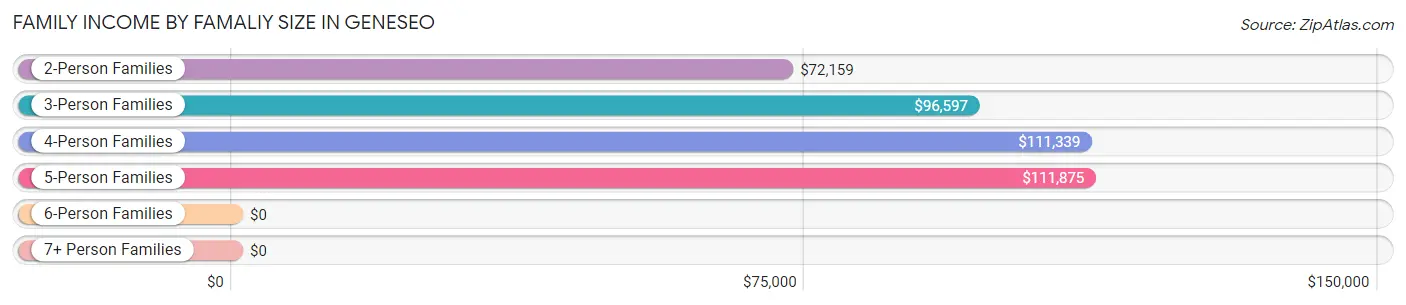
| Income Bracket | # Families | Median Income |
| 2-Person Families | 833 (46.6%) | $72,159 |
| 3-Person Families | 424 (23.7%) | $96,597 |
| 4-Person Families | 458 (25.6%) | $111,339 |
| 5-Person Families | 50 (2.8%) | $111,875 |
| 6-Person Families | 23 (1.3%) | $0 |
| 7+ Person Families | 0 (0.0%) | $0 |
| Total | 1,788 (100.0%) | $95,734 |
Family Income by Number of Earners in Geneseo
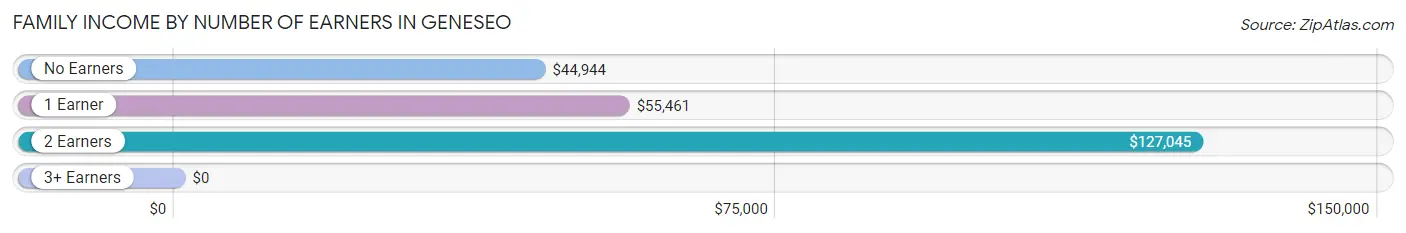
| Number of Earners | # Families | Median Income |
| No Earners | 442 (24.7%) | $44,944 |
| 1 Earner | 429 (24.0%) | $55,461 |
| 2 Earners | 814 (45.5%) | $127,045 |
| 3+ Earners | 103 (5.8%) | $0 |
| Total | 1,788 (100.0%) | $95,734 |
Household Income in Geneseo
Household Income Brackets in Geneseo
With 666 households falling in the category, the $35,000 to $49,999 income range is the most frequent in Geneseo, accounting for 22.5% of all households.
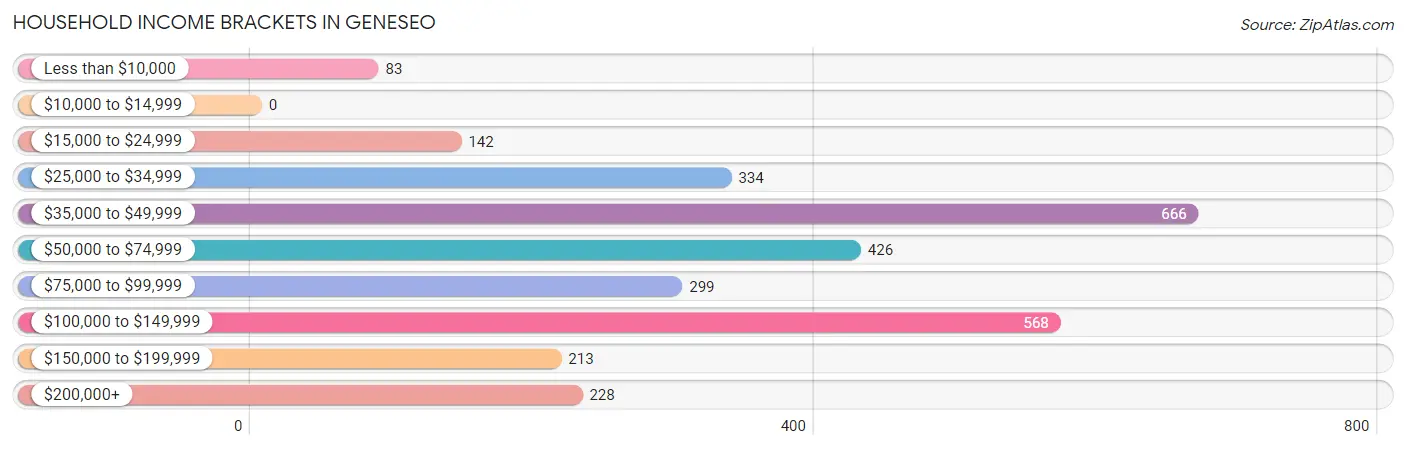
| Income Bracket | # Households | % Households |
| Less than $10,000 | 83 | 2.8% |
| $10,000 to $14,999 | 0 | 0.0% |
| $15,000 to $24,999 | 142 | 4.8% |
| $25,000 to $34,999 | 334 | 11.3% |
| $35,000 to $49,999 | 666 | 22.5% |
| $50,000 to $74,999 | 426 | 14.4% |
| $75,000 to $99,999 | 299 | 10.1% |
| $100,000 to $149,999 | 568 | 19.2% |
| $150,000 to $199,999 | 213 | 7.2% |
| $200,000+ | 228 | 7.7% |
Household Income by Householder Age in Geneseo
The median household income in Geneseo is $64,010, with the highest median household income of $104,322 found in the 25 to 44 years age bracket for the primary householder. A total of 716 households (24.2%) fall into this category. Meanwhile, the 65+ years age bracket for the primary householder has the lowest median household income of $42,557, with 1,280 households (43.2%) in this group.
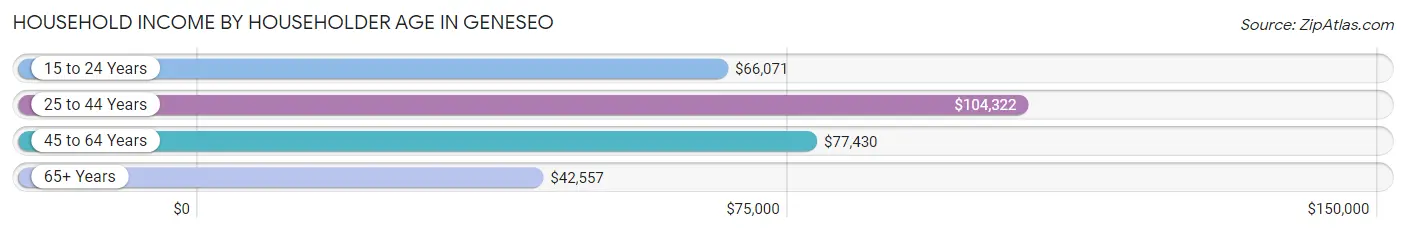
| Income Bracket | # Households | Median Income |
| 15 to 24 Years | 44 (1.5%) | $66,071 |
| 25 to 44 Years | 716 (24.2%) | $104,322 |
| 45 to 64 Years | 920 (31.1%) | $77,430 |
| 65+ Years | 1,280 (43.2%) | $42,557 |
| Total | 2,960 (100.0%) | $64,010 |
Poverty in Geneseo
Income Below Poverty by Sex and Age in Geneseo
With 2.6% poverty level for males and 2.7% for females among the residents of Geneseo, under 5 year old males and 25 to 34 year old females are the most vulnerable to poverty, with 20 males (23.5%) and 33 females (9.0%) in their respective age groups living below the poverty level.
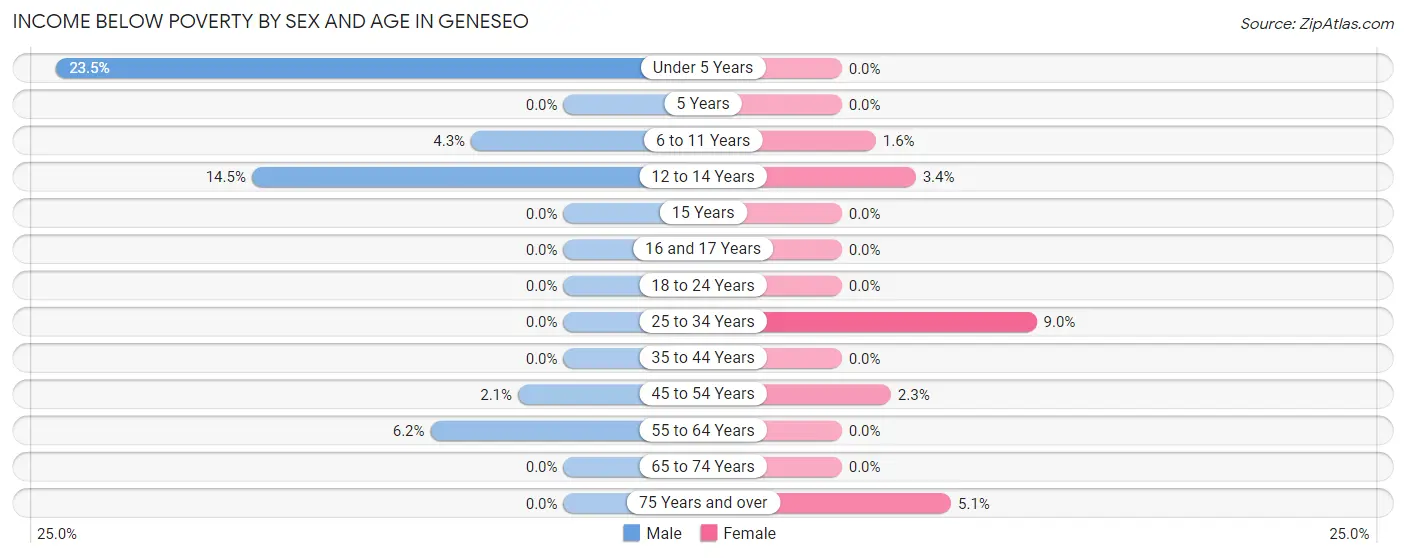
| Age Bracket | Male | Female |
| Under 5 Years | 20 (23.5%) | 0 (0.0%) |
| 5 Years | 0 (0.0%) | 0 (0.0%) |
| 6 to 11 Years | 15 (4.3%) | 6 (1.6%) |
| 12 to 14 Years | 12 (14.5%) | 6 (3.4%) |
| 15 Years | 0 (0.0%) | 0 (0.0%) |
| 16 and 17 Years | 0 (0.0%) | 0 (0.0%) |
| 18 to 24 Years | 0 (0.0%) | 0 (0.0%) |
| 25 to 34 Years | 0 (0.0%) | 33 (9.0%) |
| 35 to 44 Years | 0 (0.0%) | 0 (0.0%) |
| 45 to 54 Years | 11 (2.1%) | 10 (2.3%) |
| 55 to 64 Years | 20 (6.2%) | 0 (0.0%) |
| 65 to 74 Years | 0 (0.0%) | 0 (0.0%) |
| 75 Years and over | 0 (0.0%) | 35 (5.1%) |
| Total | 78 (2.6%) | 90 (2.7%) |
Income Above Poverty by Sex and Age in Geneseo
According to the poverty statistics in Geneseo, males aged 5 years and females aged under 5 years are the age groups that are most secure financially, with 100.0% of males and 100.0% of females in these age groups living above the poverty line.
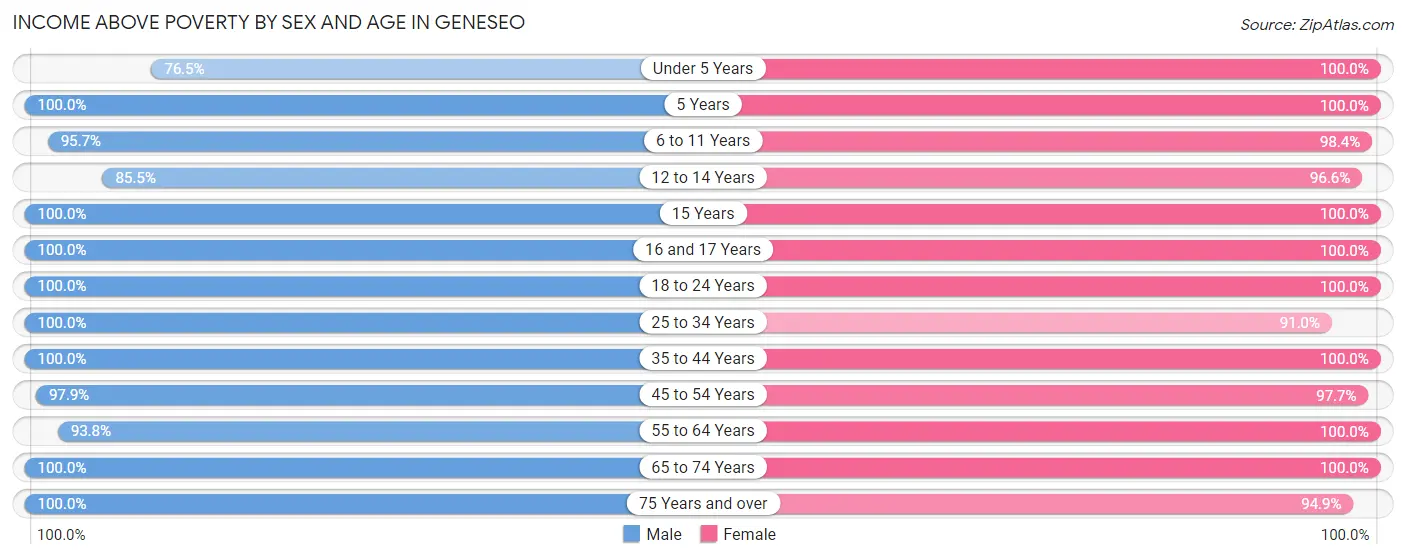
| Age Bracket | Male | Female |
| Under 5 Years | 65 (76.5%) | 120 (100.0%) |
| 5 Years | 30 (100.0%) | 21 (100.0%) |
| 6 to 11 Years | 335 (95.7%) | 374 (98.4%) |
| 12 to 14 Years | 71 (85.5%) | 169 (96.6%) |
| 15 Years | 57 (100.0%) | 64 (100.0%) |
| 16 and 17 Years | 20 (100.0%) | 45 (100.0%) |
| 18 to 24 Years | 173 (100.0%) | 91 (100.0%) |
| 25 to 34 Years | 366 (100.0%) | 332 (91.0%) |
| 35 to 44 Years | 335 (100.0%) | 331 (100.0%) |
| 45 to 54 Years | 511 (97.9%) | 428 (97.7%) |
| 55 to 64 Years | 304 (93.8%) | 271 (100.0%) |
| 65 to 74 Years | 342 (100.0%) | 382 (100.0%) |
| 75 Years and over | 268 (100.0%) | 655 (94.9%) |
| Total | 2,877 (97.4%) | 3,283 (97.3%) |
Income Below Poverty Among Married-Couple Families in Geneseo
The poverty statistics for married-couple families in Geneseo show that 0.8% or 11 of the total 1,451 families live below the poverty line. Families with 1 or 2 children have the highest poverty rate of 1.9%, comprising of 11 families. On the other hand, families with no children have the lowest poverty rate of 0.0%, which includes 0 families.
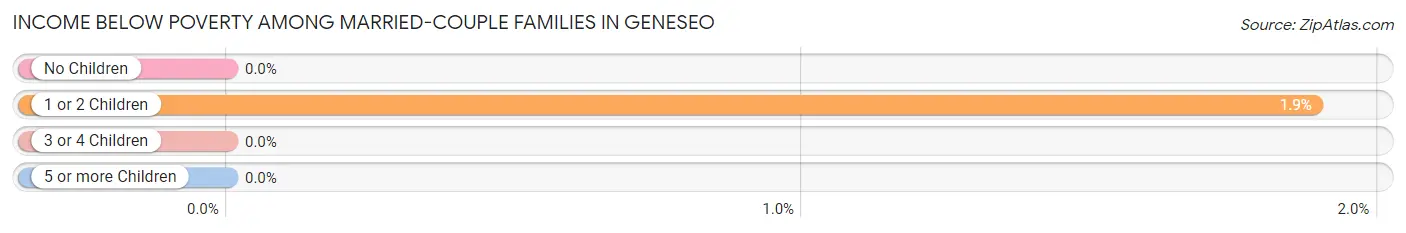
| Children | Above Poverty | Below Poverty |
| No Children | 811 (100.0%) | 0 (0.0%) |
| 1 or 2 Children | 572 (98.1%) | 11 (1.9%) |
| 3 or 4 Children | 57 (100.0%) | 0 (0.0%) |
| 5 or more Children | 0 (0.0%) | 0 (0.0%) |
| Total | 1,440 (99.2%) | 11 (0.8%) |
Income Below Poverty Among Single-Parent Households in Geneseo
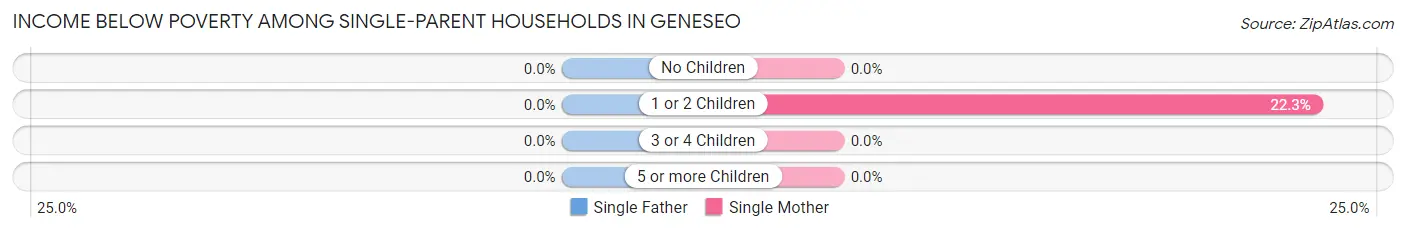
| Children | Single Father | Single Mother |
| No Children | 0 (0.0%) | 0 (0.0%) |
| 1 or 2 Children | 0 (0.0%) | 33 (22.3%) |
| 3 or 4 Children | 0 (0.0%) | 0 (0.0%) |
| 5 or more Children | 0 (0.0%) | 0 (0.0%) |
| Total | 0 (0.0%) | 33 (16.4%) |
Income Below Poverty Among Married-Couple vs Single-Parent Households in Geneseo
The poverty data for Geneseo shows that 11 of the married-couple family households (0.8%) and 33 of the single-parent households (9.8%) are living below the poverty level. Within the married-couple family households, those with 1 or 2 children have the highest poverty rate, with 11 households (1.9%) falling below the poverty line. Among the single-parent households, those with 1 or 2 children have the highest poverty rate, with 33 household (13.6%) living below poverty.
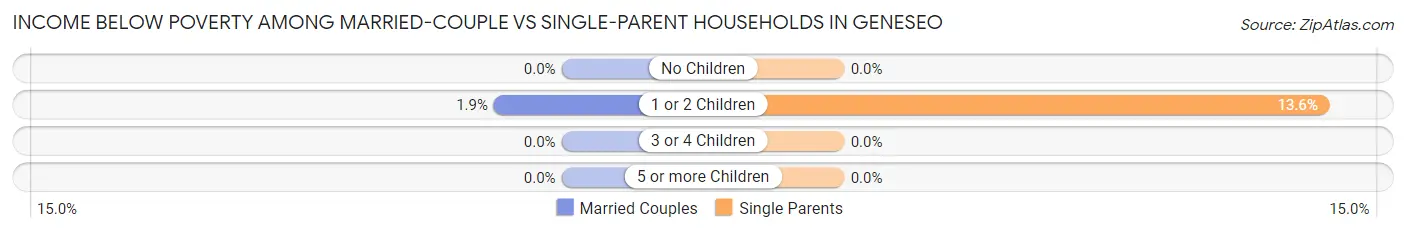
| Children | Married-Couple Families | Single-Parent Households |
| No Children | 0 (0.0%) | 0 (0.0%) |
| 1 or 2 Children | 11 (1.9%) | 33 (13.6%) |
| 3 or 4 Children | 0 (0.0%) | 0 (0.0%) |
| 5 or more Children | 0 (0.0%) | 0 (0.0%) |
| Total | 11 (0.8%) | 33 (9.8%) |
Race in Geneseo
The most populous races in Geneseo are White / Caucasian (5,995 | 93.4%), Two or more Races (298 | 4.6%), and Hispanic or Latino (224 | 3.5%).
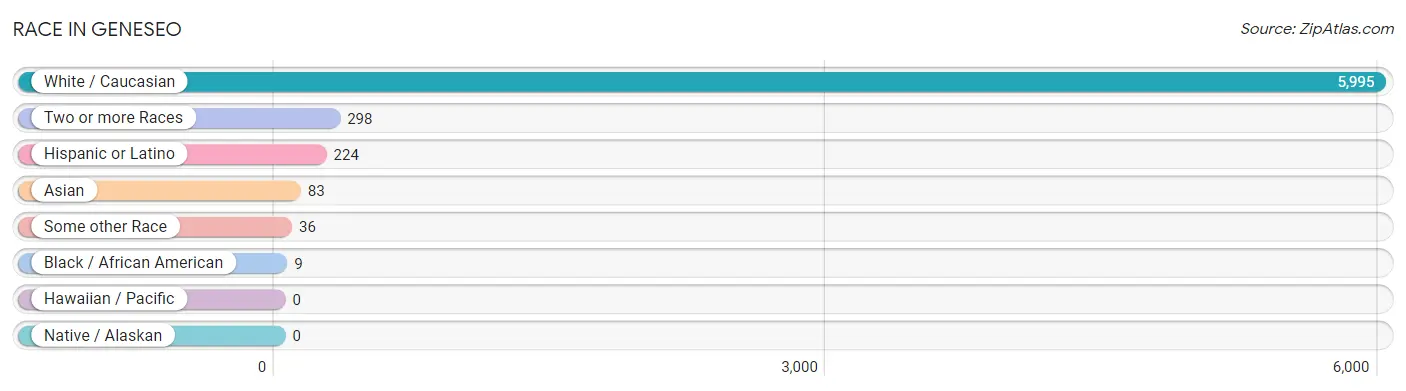
| Race | # Population | % Population |
| Asian | 83 | 1.3% |
| Black / African American | 9 | 0.1% |
| Hawaiian / Pacific | 0 | 0.0% |
| Hispanic or Latino | 224 | 3.5% |
| Native / Alaskan | 0 | 0.0% |
| White / Caucasian | 5,995 | 93.4% |
| Two or more Races | 298 | 4.6% |
| Some other Race | 36 | 0.6% |
| Total | 6,421 | 100.0% |
Ancestry in Geneseo
The most populous ancestries reported in Geneseo are German (1,264 | 19.7%), Belgian (858 | 13.4%), English (781 | 12.2%), Irish (435 | 6.8%), and Swedish (286 | 4.4%), together accounting for 56.4% of all Geneseo residents.
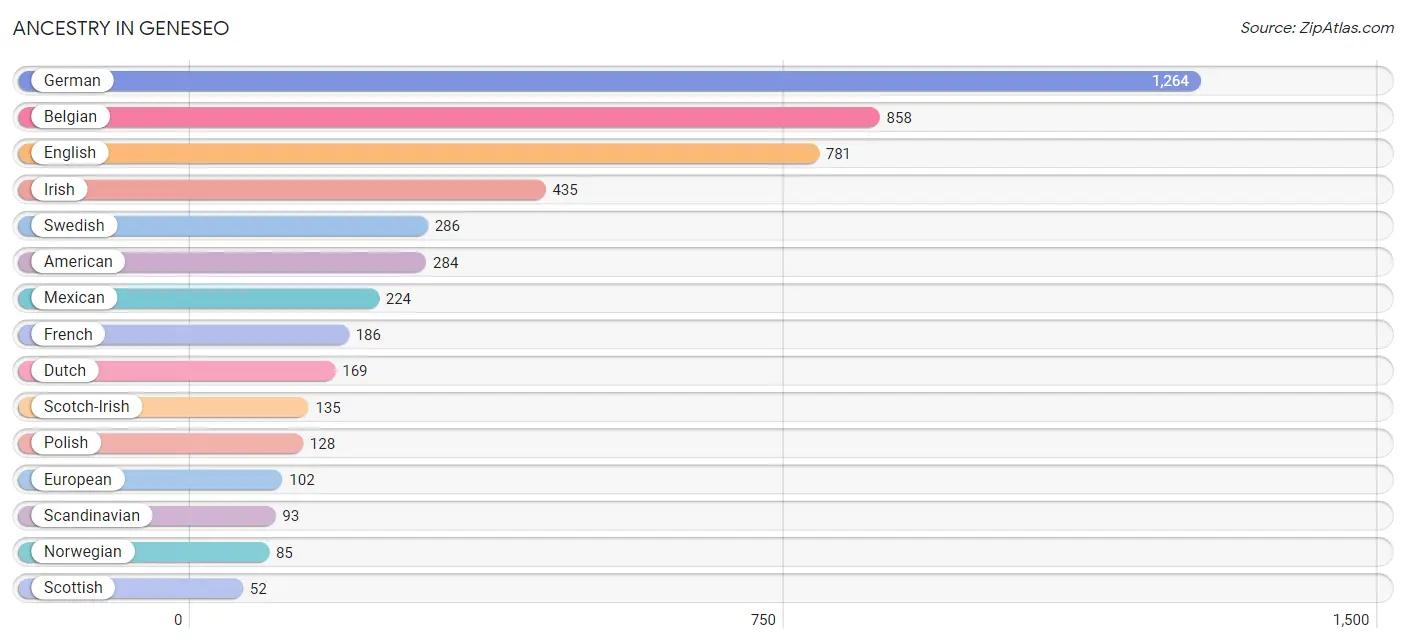
| Ancestry | # Population | % Population |
| American | 284 | 4.4% |
| Belgian | 858 | 13.4% |
| British | 14 | 0.2% |
| Burmese | 22 | 0.3% |
| Canadian | 7 | 0.1% |
| Cherokee | 17 | 0.3% |
| Danish | 36 | 0.6% |
| Dutch | 169 | 2.6% |
| English | 781 | 12.2% |
| European | 102 | 1.6% |
| French | 186 | 2.9% |
| French Canadian | 46 | 0.7% |
| German | 1,264 | 19.7% |
| Greek | 17 | 0.3% |
| Haitian | 9 | 0.1% |
| Indian (Asian) | 39 | 0.6% |
| Irish | 435 | 6.8% |
| Italian | 49 | 0.8% |
| Korean | 29 | 0.4% |
| Luxembourger | 12 | 0.2% |
| Mexican | 224 | 3.5% |
| Northern European | 5 | 0.1% |
| Norwegian | 85 | 1.3% |
| Polish | 128 | 2.0% |
| Portuguese | 15 | 0.2% |
| Scandinavian | 93 | 1.5% |
| Scotch-Irish | 135 | 2.1% |
| Scottish | 52 | 0.8% |
| Slovak | 16 | 0.3% |
| Sri Lankan | 34 | 0.5% |
| Swedish | 286 | 4.4% |
| Ukrainian | 16 | 0.3% |
| Welsh | 16 | 0.3% | View All 33 Rows |
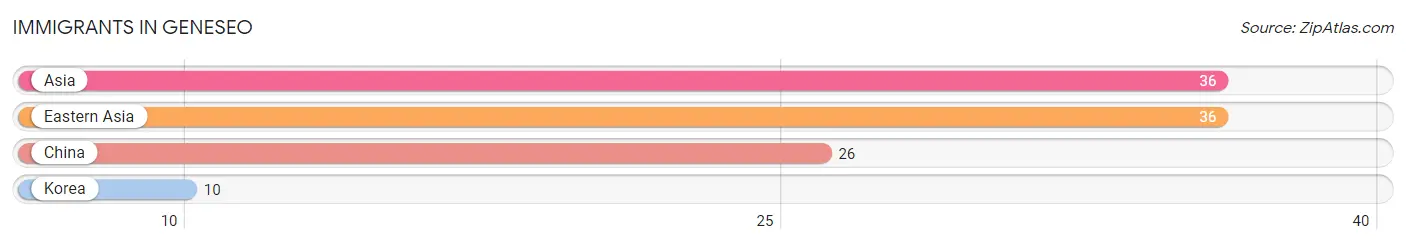
Immigrants in Geneseo
The most numerous immigrant groups reported in Geneseo came from Asia (36 | 0.6%), Eastern Asia (36 | 0.6%), China (26 | 0.4%), and Korea (10 | 0.2%), together accounting for 1.7% of all Geneseo residents.
| Immigration Origin | # Population | % Population |
| Asia | 36 | 0.6% |
| China | 26 | 0.4% |
| Eastern Asia | 36 | 0.6% |
| Korea | 10 | 0.2% | View All 4 Rows |
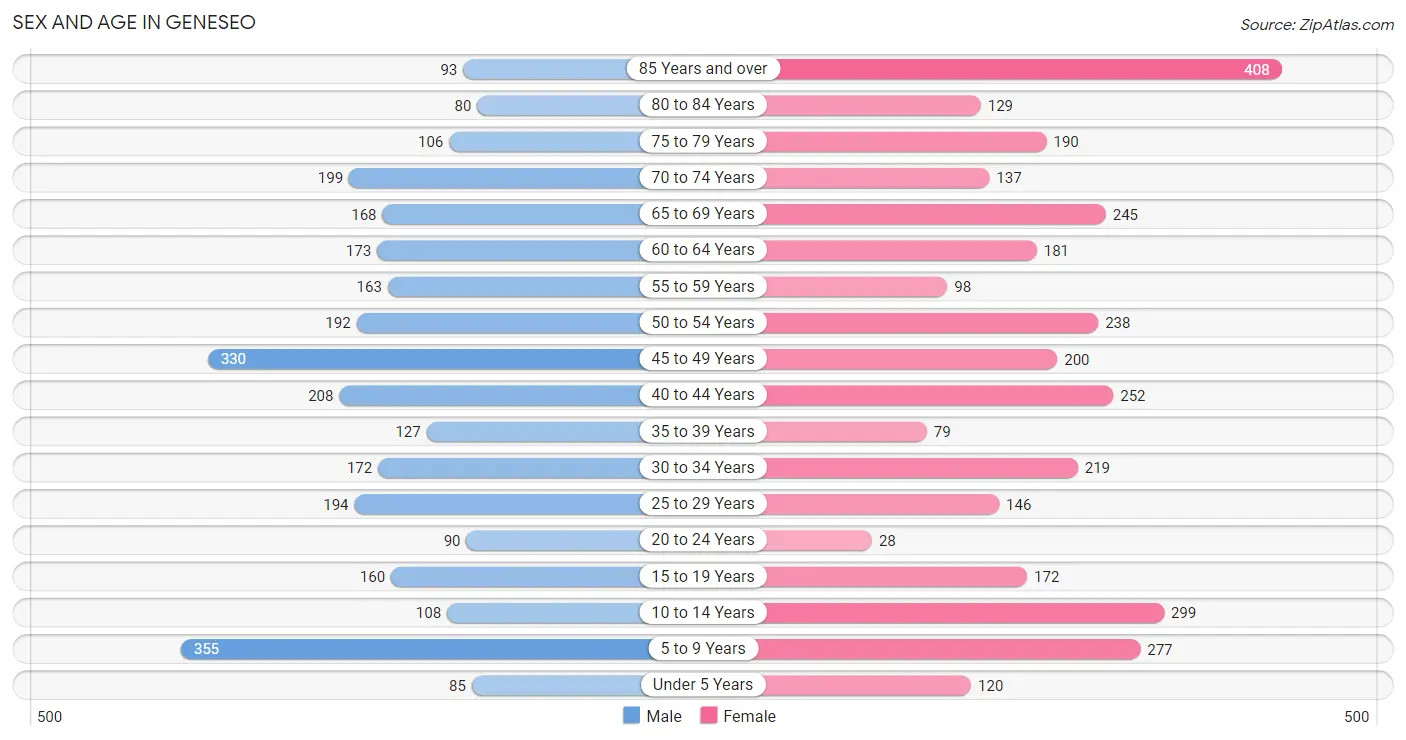
Sex and Age in Geneseo
Sex and Age in Geneseo
The most populous age groups in Geneseo are 5 to 9 Years (355 | 11.8%) for men and 85 Years and over (408 | 11.9%) for women.
| Age Bracket | Male | Female |
| Under 5 Years | 85 (2.8%) | 120 (3.5%) |
| 5 to 9 Years | 355 (11.8%) | 277 (8.1%) |
| 10 to 14 Years | 108 (3.6%) | 299 (8.7%) |
| 15 to 19 Years | 160 (5.3%) | 172 (5.0%) |
| 20 to 24 Years | 90 (3.0%) | 28 (0.8%) |
| 25 to 29 Years | 194 (6.5%) | 146 (4.3%) |
| 30 to 34 Years | 172 (5.7%) | 219 (6.4%) |
| 35 to 39 Years | 127 (4.2%) | 79 (2.3%) |
| 40 to 44 Years | 208 (6.9%) | 252 (7.4%) |
| 45 to 49 Years | 330 (11.0%) | 200 (5.9%) |
| 50 to 54 Years | 192 (6.4%) | 238 (7.0%) |
| 55 to 59 Years | 163 (5.4%) | 98 (2.9%) |
| 60 to 64 Years | 173 (5.8%) | 181 (5.3%) |
| 65 to 69 Years | 168 (5.6%) | 245 (7.2%) |
| 70 to 74 Years | 199 (6.6%) | 137 (4.0%) |
| 75 to 79 Years | 106 (3.5%) | 190 (5.6%) |
| 80 to 84 Years | 80 (2.7%) | 129 (3.8%) |
| 85 Years and over | 93 (3.1%) | 408 (11.9%) |
| Total | 3,003 (100.0%) | 3,418 (100.0%) |
Families and Households in Geneseo
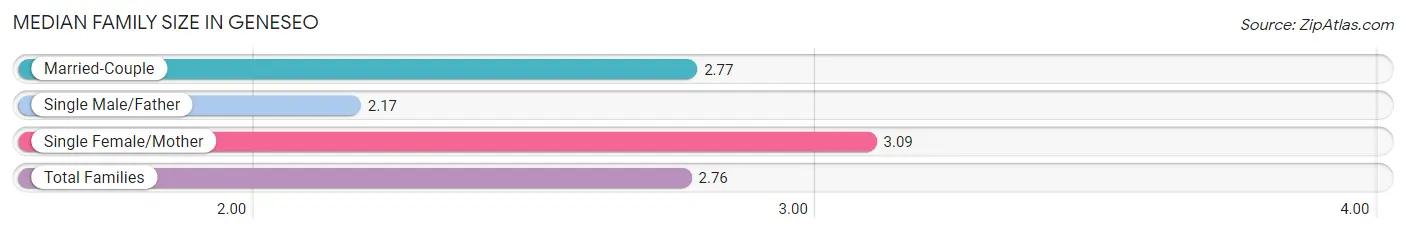
Median Family Size in Geneseo
The median family size in Geneseo is 2.76 persons per family, with single female/mother families (201 | 11.2%) accounting for the largest median family size of 3.09 persons per family. On the other hand, single male/father families (136 | 7.6%) represent the smallest median family size with 2.17 persons per family.
| Family Type | # Families | Family Size |
| Married-Couple | 1,451 (81.1%) | 2.77 |
| Single Male/Father | 136 (7.6%) | 2.17 |
| Single Female/Mother | 201 (11.2%) | 3.09 |
| Total Families | 1,788 (100.0%) | 2.76 |
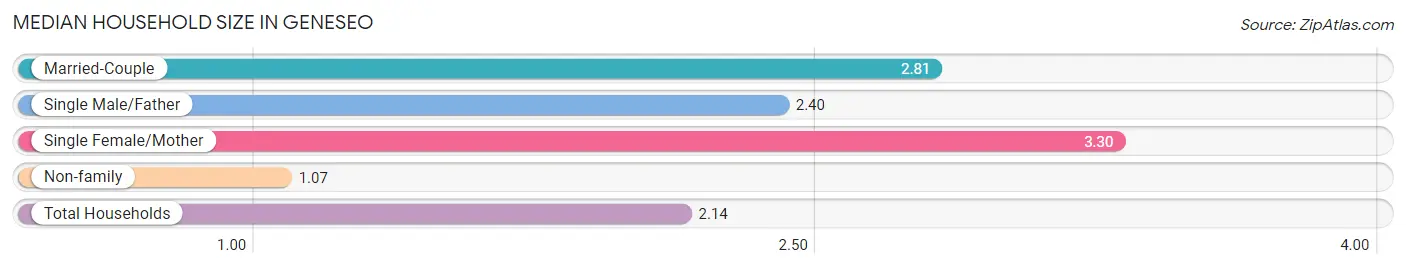
Median Household Size in Geneseo
The median household size in Geneseo is 2.14 persons per household, with single female/mother households (201 | 6.8%) accounting for the largest median household size of 3.3 persons per household. non-family households (1,172 | 39.6%) represent the smallest median household size with 1.07 persons per household.
| Household Type | # Households | Household Size |
| Married-Couple | 1,451 (49.0%) | 2.81 |
| Single Male/Father | 136 (4.6%) | 2.40 |
| Single Female/Mother | 201 (6.8%) | 3.30 |
| Non-family | 1,172 (39.6%) | 1.07 |
| Total Households | 2,960 (100.0%) | 2.14 |
Household Size by Marriage Status in Geneseo
Out of a total of 2,960 households in Geneseo, 1,788 (60.4%) are family households, while 1,172 (39.6%) are nonfamily households. The most numerous type of family households are 2-person households, comprising 817, and the most common type of nonfamily households are 1-person households, comprising 1,082.
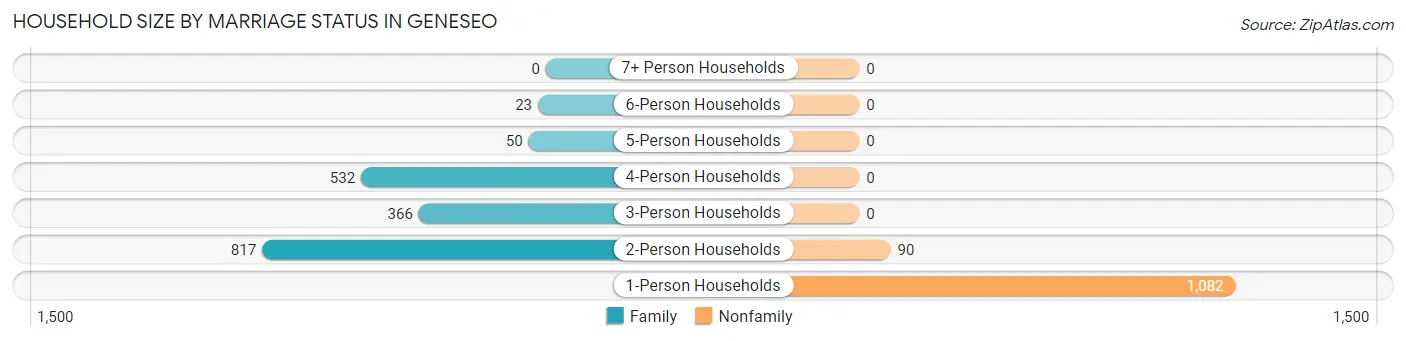
| Household Size | Family Households | Nonfamily Households |
| 1-Person Households | - | 1,082 (36.5%) |
| 2-Person Households | 817 (27.6%) | 90 (3.0%) |
| 3-Person Households | 366 (12.4%) | 0 (0.0%) |
| 4-Person Households | 532 (18.0%) | 0 (0.0%) |
| 5-Person Households | 50 (1.7%) | 0 (0.0%) |
| 6-Person Households | 23 (0.8%) | 0 (0.0%) |
| 7+ Person Households | 0 (0.0%) | 0 (0.0%) |
| Total | 1,788 (60.4%) | 1,172 (39.6%) |
Female Fertility in Geneseo
Fertility by Age in Geneseo
Average fertility rate in Geneseo is 19.0 births per 1,000 women. Women in the age bracket of 20 to 34 years have the highest fertility rate with 59.0 births per 1,000 women. Women in the age bracket of 20 to 34 years acount for 100.0% of all women with births.
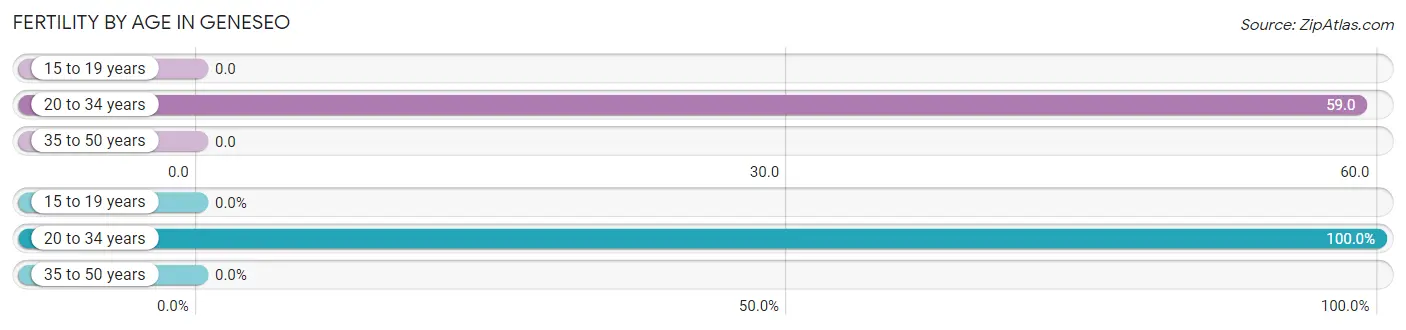
| Age Bracket | Women with Births | Births / 1,000 Women |
| 15 to 19 years | 0 (0.0%) | 0.0 |
| 20 to 34 years | 23 (100.0%) | 59.0 |
| 35 to 50 years | 0 (0.0%) | 0.0 |
| Total | 23 (100.0%) | 19.0 |
Fertility by Age by Marriage Status in Geneseo
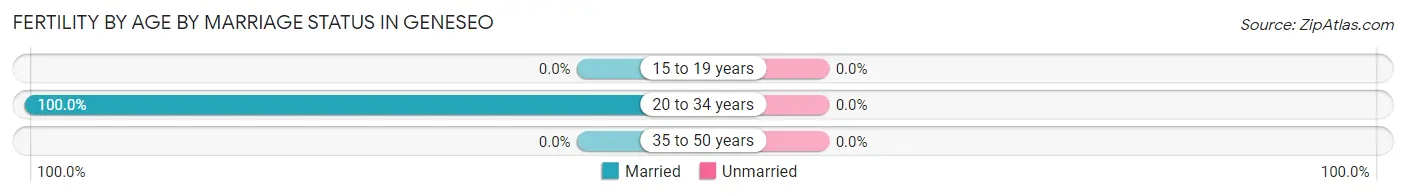
| Age Bracket | Married | Unmarried |
| 15 to 19 years | 0 (0.0%) | 0 (0.0%) |
| 20 to 34 years | 23 (100.0%) | 0 (0.0%) |
| 35 to 50 years | 0 (0.0%) | 0 (0.0%) |
| Total | 23 (100.0%) | 0 (0.0%) |
Fertility by Education in Geneseo
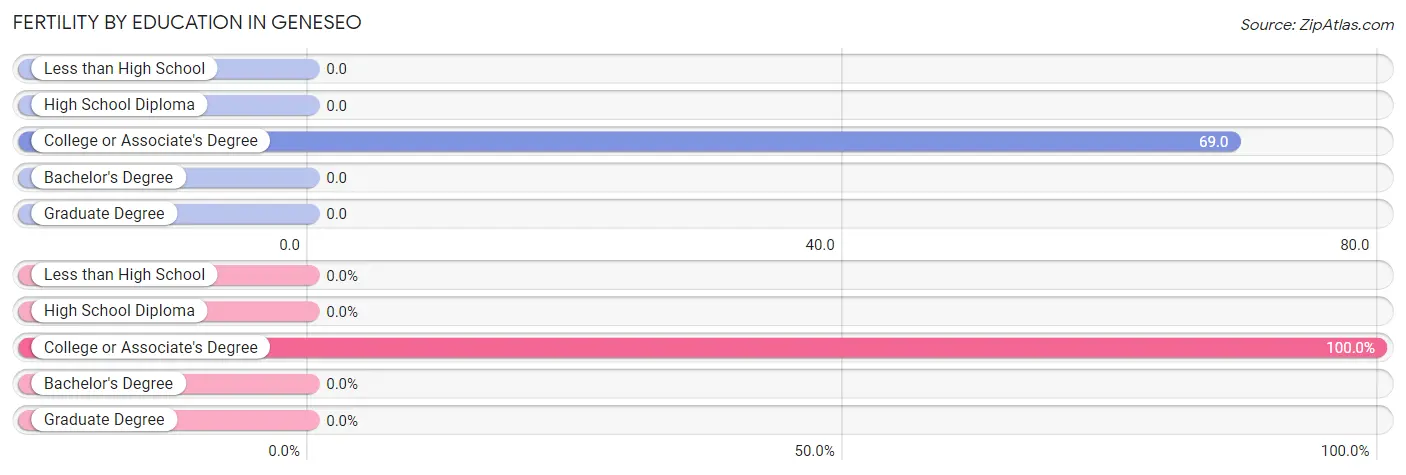
| Educational Attainment | Women with Births | Births / 1,000 Women |
| Less than High School | 0 (0.0%) | 0.0 |
| High School Diploma | 0 (0.0%) | 0.0 |
| College or Associate's Degree | 23 (100.0%) | 69.0 |
| Bachelor's Degree | 0 (0.0%) | 0.0 |
| Graduate Degree | 0 (0.0%) | 0.0 |
| Total | 23 (100.0%) | 19.0 |
Fertility by Education by Marriage Status in Geneseo
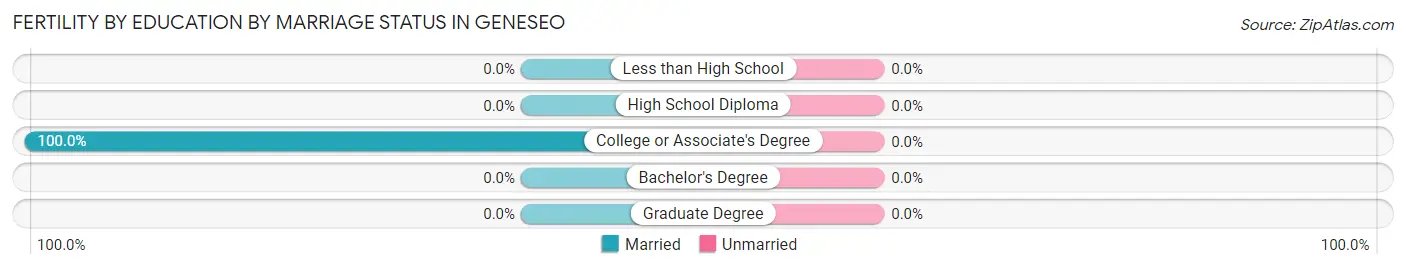
| Educational Attainment | Married | Unmarried |
| Less than High School | 0 (0.0%) | 0 (0.0%) |
| High School Diploma | 0 (0.0%) | 0 (0.0%) |
| College or Associate's Degree | 23 (100.0%) | 0 (0.0%) |
| Bachelor's Degree | 0 (0.0%) | 0 (0.0%) |
| Graduate Degree | 0 (0.0%) | 0 (0.0%) |
| Total | 23 (100.0%) | 0 (0.0%) |
Employment Characteristics in Geneseo
Employment by Class of Employer in Geneseo
Among the 2,934 employed individuals in Geneseo, private company employees (1,798 | 61.3%), local government employees (370 | 12.6%), and not-for-profit organizations (310 | 10.6%) make up the most common classes of employment.
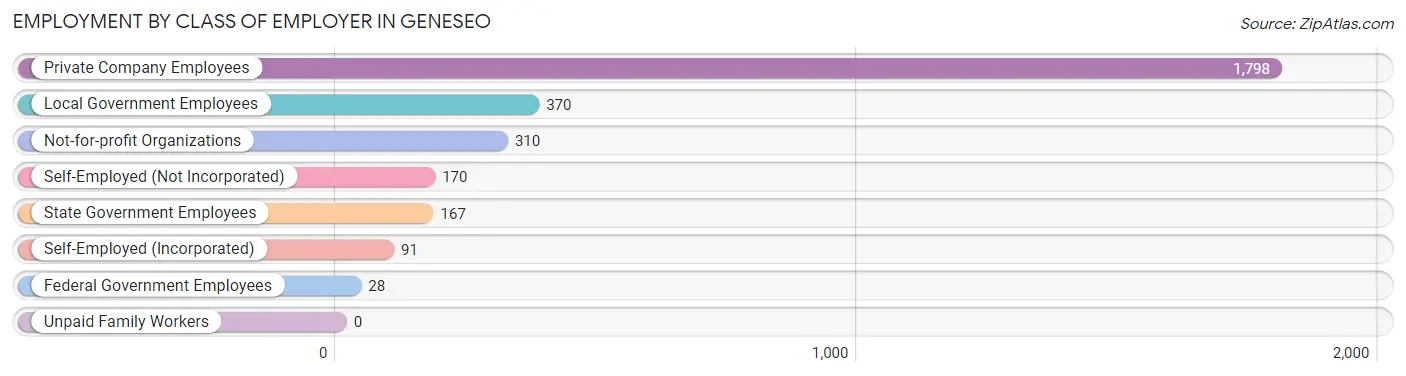
| Employer Class | # Employees | % Employees |
| Private Company Employees | 1,798 | 61.3% |
| Self-Employed (Incorporated) | 91 | 3.1% |
| Self-Employed (Not Incorporated) | 170 | 5.8% |
| Not-for-profit Organizations | 310 | 10.6% |
| Local Government Employees | 370 | 12.6% |
| State Government Employees | 167 | 5.7% |
| Federal Government Employees | 28 | 0.9% |
| Unpaid Family Workers | 0 | 0.0% |
| Total | 2,934 | 100.0% |
Employment Status by Age in Geneseo
According to the labor force statistics for Geneseo, out of the total population over 16 years of age (5,056), 61.6% or 3,114 individuals are in the labor force, with 5.1% or 159 of them unemployed. The age group with the highest labor force participation rate is 30 to 34 years, with 100.0% or 391 individuals in the labor force. Within the labor force, the 75 years and over age range has the highest percentage of unemployed individuals, with 57.1% or 8 of them being unemployed.
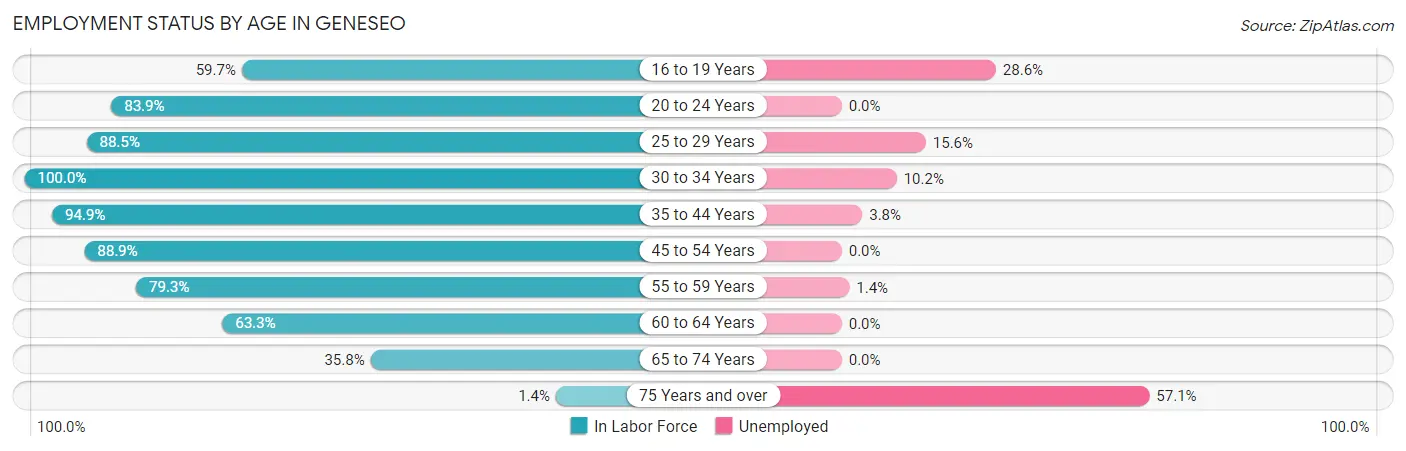
| Age Bracket | In Labor Force | Unemployed |
| 16 to 19 Years | 126 (59.7%) | 36 (28.6%) |
| 20 to 24 Years | 99 (83.9%) | 0 (0.0%) |
| 25 to 29 Years | 301 (88.5%) | 47 (15.6%) |
| 30 to 34 Years | 391 (100.0%) | 40 (10.2%) |
| 35 to 44 Years | 632 (94.9%) | 24 (3.8%) |
| 45 to 54 Years | 853 (88.9%) | 0 (0.0%) |
| 55 to 59 Years | 207 (79.3%) | 3 (1.4%) |
| 60 to 64 Years | 224 (63.3%) | 0 (0.0%) |
| 65 to 74 Years | 268 (35.8%) | 0 (0.0%) |
| 75 Years and over | 14 (1.4%) | 8 (57.1%) |
| Total | 3,114 (61.6%) | 159 (5.1%) |
Employment Status by Educational Attainment in Geneseo
According to labor force statistics for Geneseo, 87.8% of individuals (2,609) out of the total population between 25 and 64 years of age (2,972) are in the labor force, with 4.4% or 115 of them being unemployed. The group with the highest labor force participation rate are those with the educational attainment of bachelor's degree or higher, with 92.4% or 1,092 individuals in the labor force. Within the labor force, individuals with high school diploma education have the highest percentage of unemployment, with 10.1% or 64 of them being unemployed.
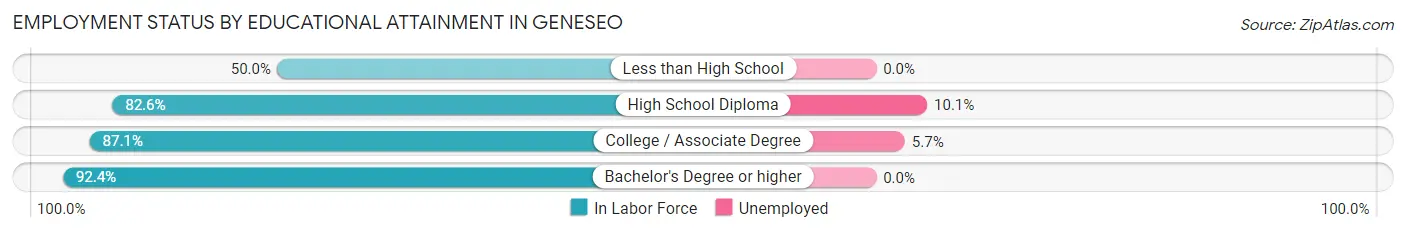
| Educational Attainment | In Labor Force | Unemployed |
| Less than High School | 11 (50.0%) | 0 (0.0%) |
| High School Diploma | 634 (82.6%) | 78 (10.1%) |
| College / Associate Degree | 871 (87.1%) | 57 (5.7%) |
| Bachelor's Degree or higher | 1,092 (92.4%) | 0 (0.0%) |
| Total | 2,609 (87.8%) | 131 (4.4%) |
Employment Occupations by Sex in Geneseo
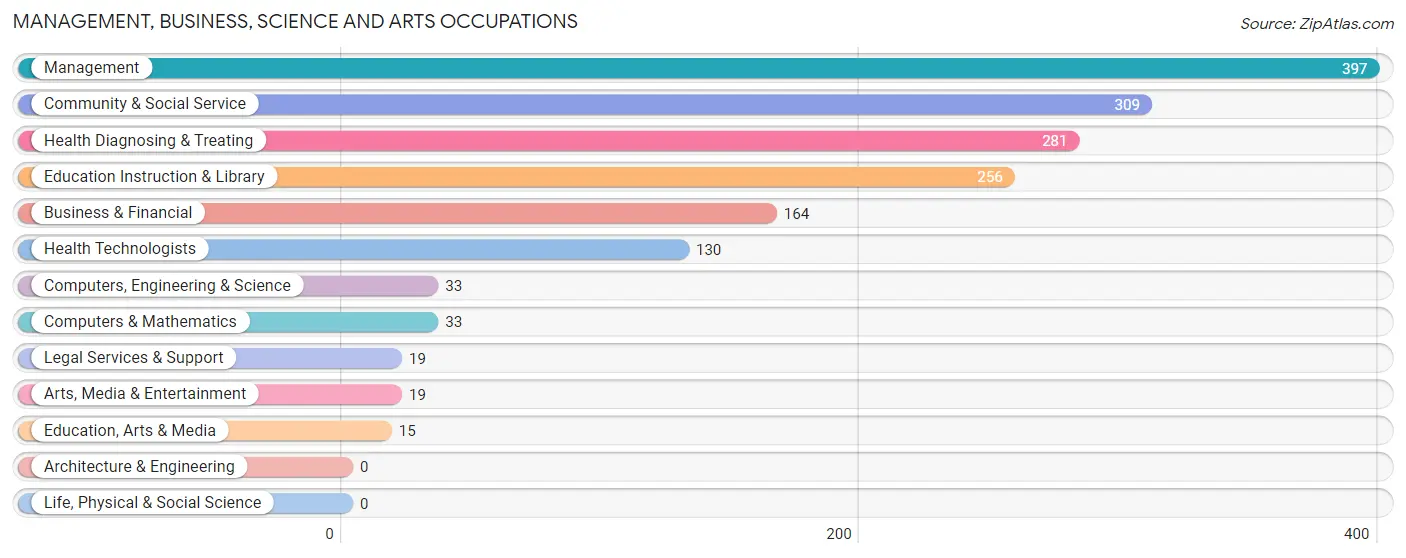
Management, Business, Science and Arts Occupations
The most common Management, Business, Science and Arts occupations in Geneseo are Management (397 | 13.4%), Community & Social Service (309 | 10.4%), Health Diagnosing & Treating (281 | 9.5%), Education Instruction & Library (256 | 8.7%), and Business & Financial (164 | 5.6%).
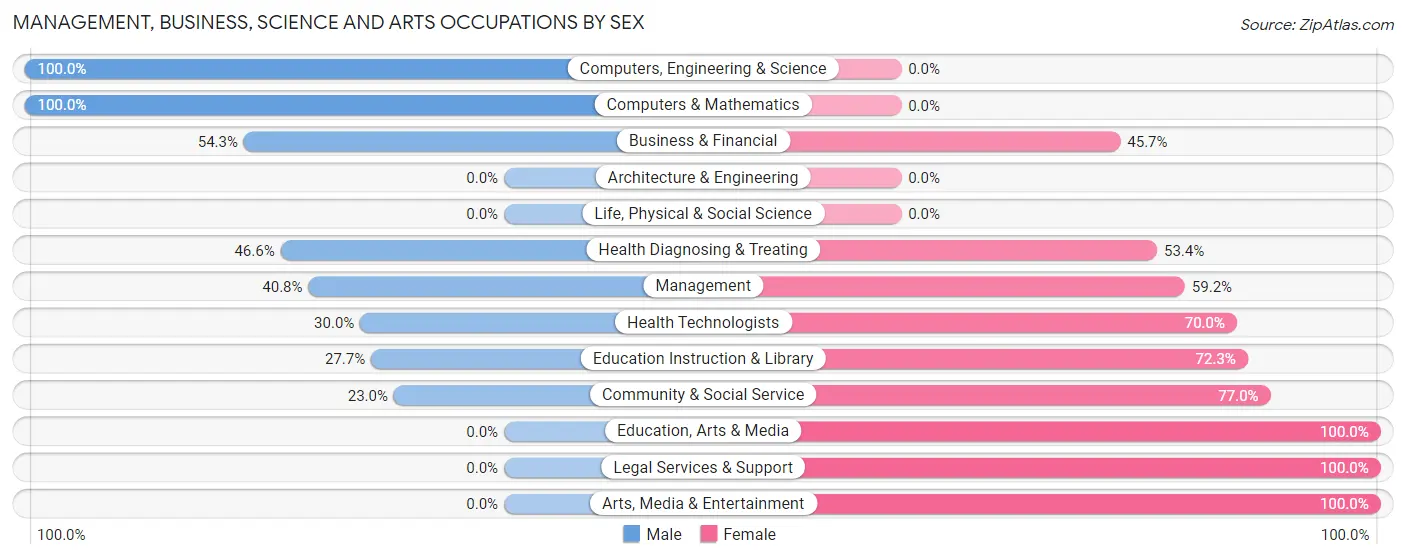
Management, Business, Science and Arts Occupations by Sex
Within the Management, Business, Science and Arts occupations in Geneseo, the most male-oriented occupations are Computers, Engineering & Science (100.0%), Computers & Mathematics (100.0%), and Business & Financial (54.3%), while the most female-oriented occupations are Education, Arts & Media (100.0%), Legal Services & Support (100.0%), and Arts, Media & Entertainment (100.0%).
| Occupation | Male | Female |
| Management | 162 (40.8%) | 235 (59.2%) |
| Business & Financial | 89 (54.3%) | 75 (45.7%) |
| Computers, Engineering & Science | 33 (100.0%) | 0 (0.0%) |
| Computers & Mathematics | 33 (100.0%) | 0 (0.0%) |
| Architecture & Engineering | 0 (0.0%) | 0 (0.0%) |
| Life, Physical & Social Science | 0 (0.0%) | 0 (0.0%) |
| Community & Social Service | 71 (23.0%) | 238 (77.0%) |
| Education, Arts & Media | 0 (0.0%) | 15 (100.0%) |
| Legal Services & Support | 0 (0.0%) | 19 (100.0%) |
| Education Instruction & Library | 71 (27.7%) | 185 (72.3%) |
| Arts, Media & Entertainment | 0 (0.0%) | 19 (100.0%) |
| Health Diagnosing & Treating | 131 (46.6%) | 150 (53.4%) |
| Health Technologists | 39 (30.0%) | 91 (70.0%) |
| Total (Category) | 486 (41.0%) | 698 (59.0%) |
| Total (Overall) | 1,510 (51.1%) | 1,447 (48.9%) |
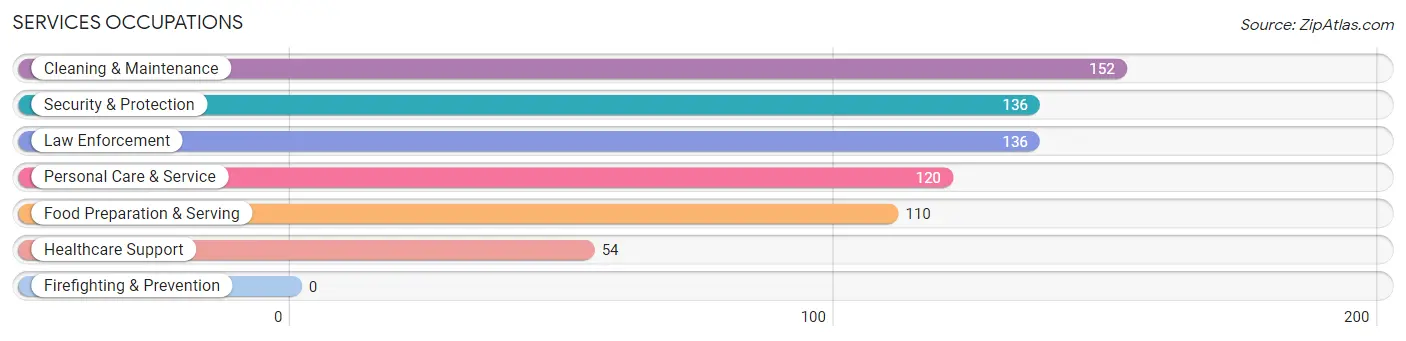
Services Occupations
The most common Services occupations in Geneseo are Cleaning & Maintenance (152 | 5.1%), Security & Protection (136 | 4.6%), Law Enforcement (136 | 4.6%), Personal Care & Service (120 | 4.1%), and Food Preparation & Serving (110 | 3.7%).
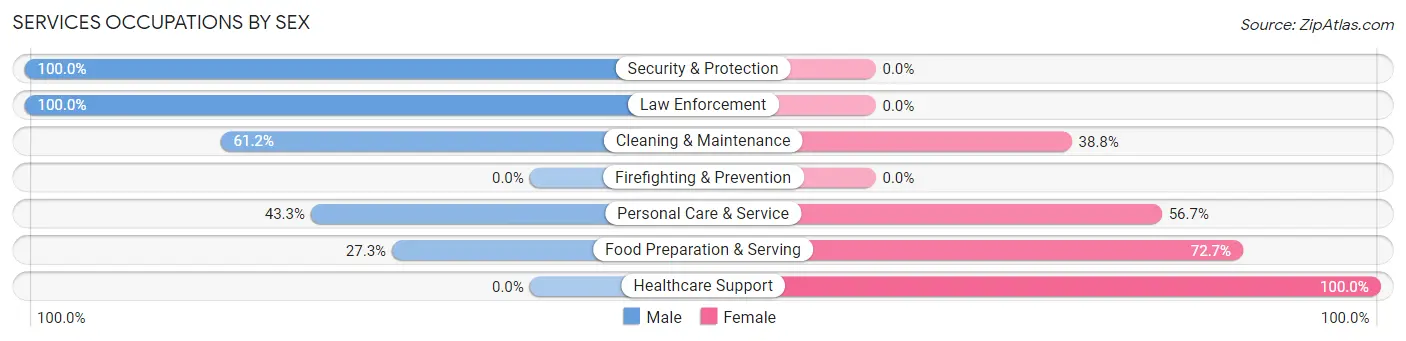
Services Occupations by Sex
Within the Services occupations in Geneseo, the most male-oriented occupations are Security & Protection (100.0%), Law Enforcement (100.0%), and Cleaning & Maintenance (61.2%), while the most female-oriented occupations are Healthcare Support (100.0%), Food Preparation & Serving (72.7%), and Personal Care & Service (56.7%).
| Occupation | Male | Female |
| Healthcare Support | 0 (0.0%) | 54 (100.0%) |
| Security & Protection | 136 (100.0%) | 0 (0.0%) |
| Firefighting & Prevention | 0 (0.0%) | 0 (0.0%) |
| Law Enforcement | 136 (100.0%) | 0 (0.0%) |
| Food Preparation & Serving | 30 (27.3%) | 80 (72.7%) |
| Cleaning & Maintenance | 93 (61.2%) | 59 (38.8%) |
| Personal Care & Service | 52 (43.3%) | 68 (56.7%) |
| Total (Category) | 311 (54.4%) | 261 (45.6%) |
| Total (Overall) | 1,510 (51.1%) | 1,447 (48.9%) |
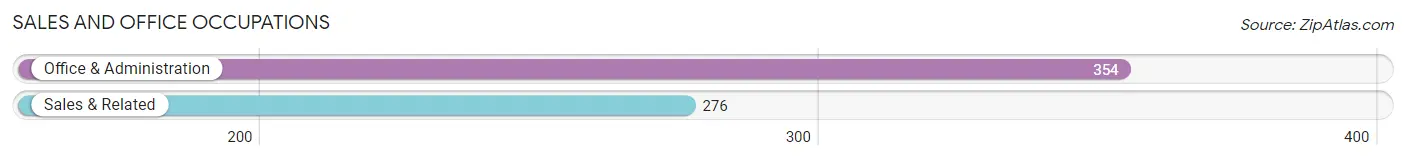
Sales and Office Occupations
The most common Sales and Office occupations in Geneseo are Office & Administration (354 | 12.0%), and Sales & Related (276 | 9.3%).
Sales and Office Occupations by Sex
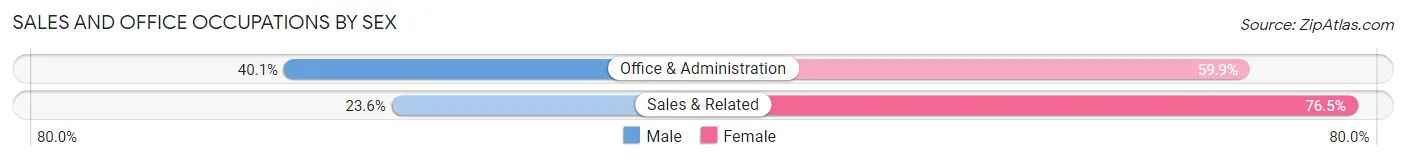
| Occupation | Male | Female |
| Sales & Related | 65 (23.5%) | 211 (76.4%) |
| Office & Administration | 142 (40.1%) | 212 (59.9%) |
| Total (Category) | 207 (32.9%) | 423 (67.1%) |
| Total (Overall) | 1,510 (51.1%) | 1,447 (48.9%) |
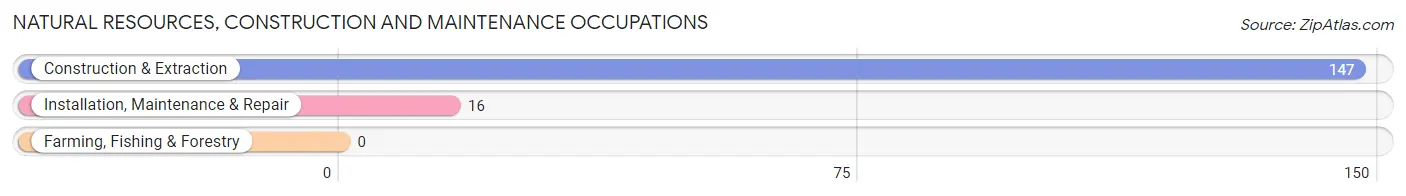
Natural Resources, Construction and Maintenance Occupations
The most common Natural Resources, Construction and Maintenance occupations in Geneseo are Construction & Extraction (147 | 5.0%), and Installation, Maintenance & Repair (16 | 0.5%).
Natural Resources, Construction and Maintenance Occupations by Sex
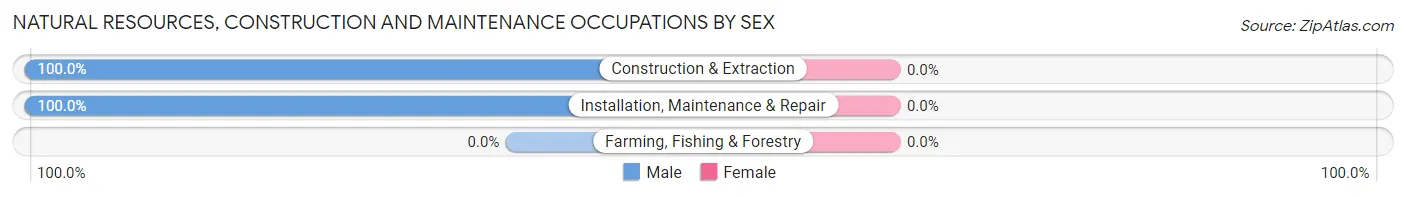
| Occupation | Male | Female |
| Farming, Fishing & Forestry | 0 (0.0%) | 0 (0.0%) |
| Construction & Extraction | 147 (100.0%) | 0 (0.0%) |
| Installation, Maintenance & Repair | 16 (100.0%) | 0 (0.0%) |
| Total (Category) | 163 (100.0%) | 0 (0.0%) |
| Total (Overall) | 1,510 (51.1%) | 1,447 (48.9%) |
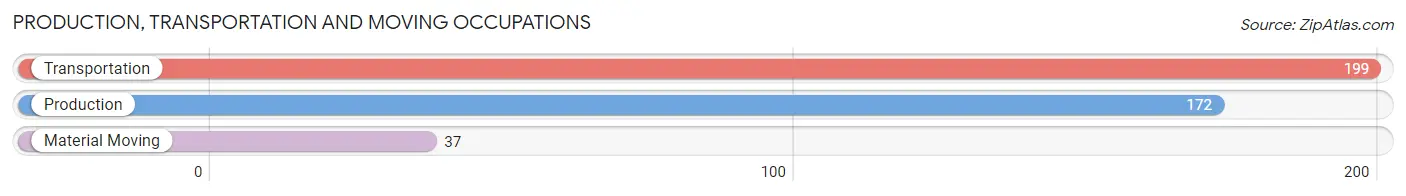
Production, Transportation and Moving Occupations
The most common Production, Transportation and Moving occupations in Geneseo are Transportation (199 | 6.7%), Production (172 | 5.8%), and Material Moving (37 | 1.3%).
Production, Transportation and Moving Occupations by Sex
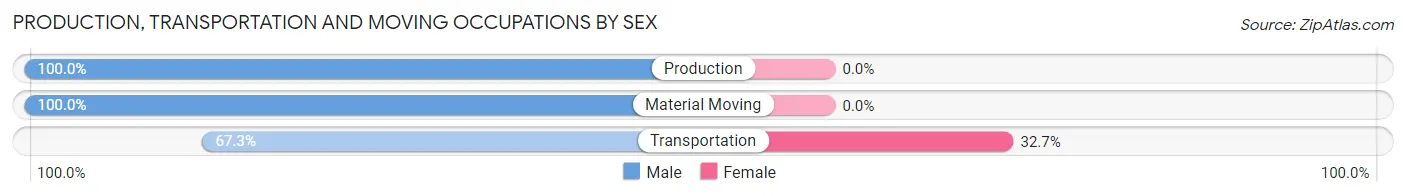
| Occupation | Male | Female |
| Production | 172 (100.0%) | 0 (0.0%) |
| Transportation | 134 (67.3%) | 65 (32.7%) |
| Material Moving | 37 (100.0%) | 0 (0.0%) |
| Total (Category) | 343 (84.1%) | 65 (15.9%) |
| Total (Overall) | 1,510 (51.1%) | 1,447 (48.9%) |
Employment Industries by Sex in Geneseo
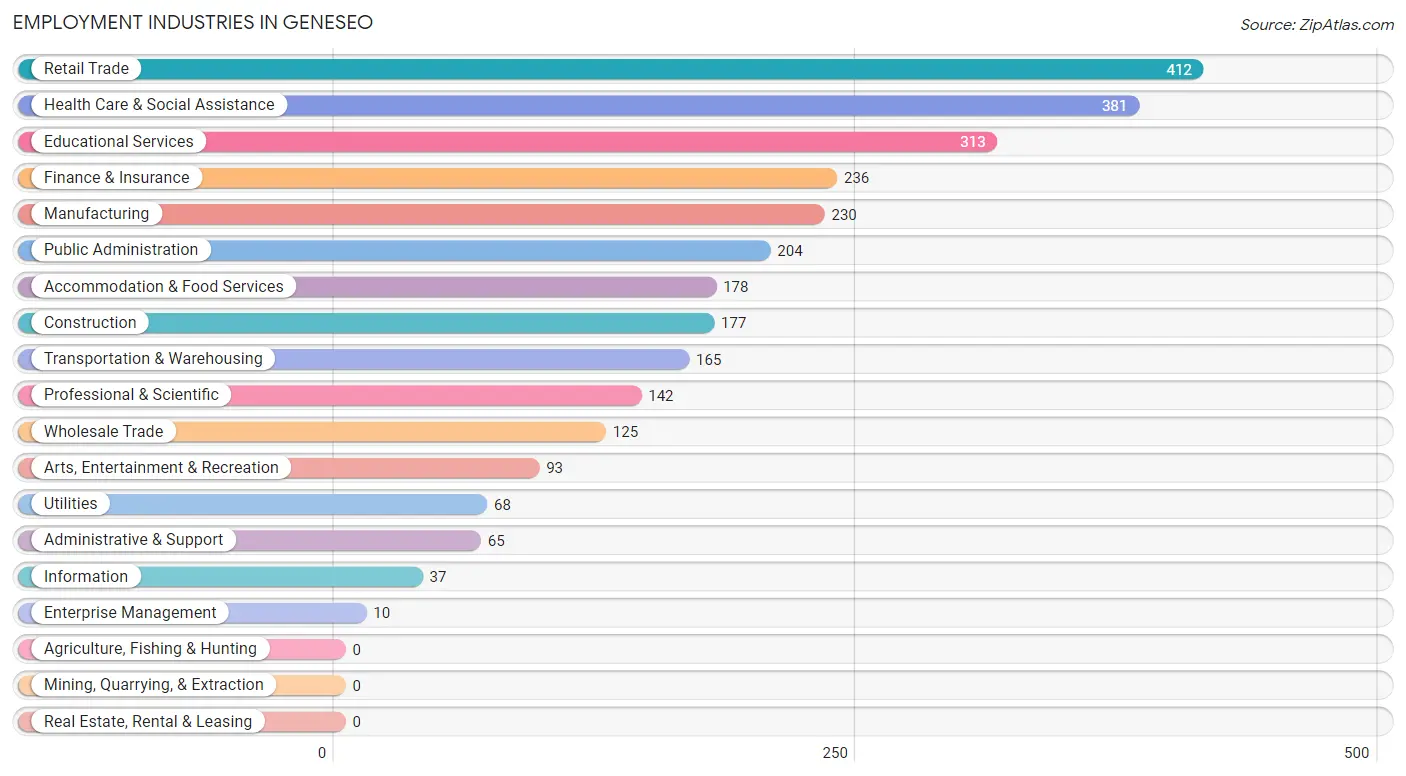
Employment Industries in Geneseo
The major employment industries in Geneseo include Retail Trade (412 | 13.9%), Health Care & Social Assistance (381 | 12.9%), Educational Services (313 | 10.6%), Finance & Insurance (236 | 8.0%), and Manufacturing (230 | 7.8%).
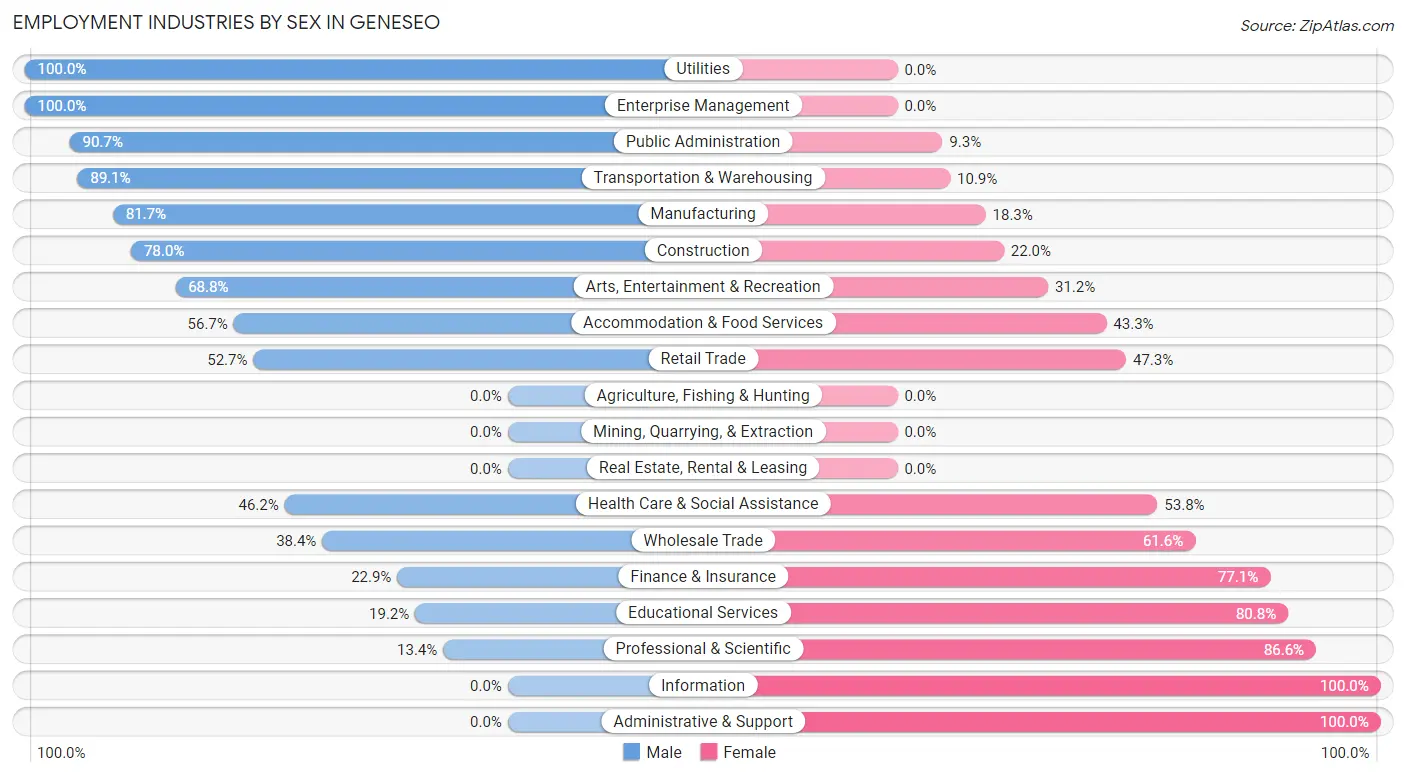
Employment Industries by Sex in Geneseo
The Geneseo industries that see more men than women are Utilities (100.0%), Enterprise Management (100.0%), and Public Administration (90.7%), whereas the industries that tend to have a higher number of women are Information (100.0%), Administrative & Support (100.0%), and Professional & Scientific (86.6%).
| Industry | Male | Female |
| Agriculture, Fishing & Hunting | 0 (0.0%) | 0 (0.0%) |
| Mining, Quarrying, & Extraction | 0 (0.0%) | 0 (0.0%) |
| Construction | 138 (78.0%) | 39 (22.0%) |
| Manufacturing | 188 (81.7%) | 42 (18.3%) |
| Wholesale Trade | 48 (38.4%) | 77 (61.6%) |
| Retail Trade | 217 (52.7%) | 195 (47.3%) |
| Transportation & Warehousing | 147 (89.1%) | 18 (10.9%) |
| Utilities | 68 (100.0%) | 0 (0.0%) |
| Information | 0 (0.0%) | 37 (100.0%) |
| Finance & Insurance | 54 (22.9%) | 182 (77.1%) |
| Real Estate, Rental & Leasing | 0 (0.0%) | 0 (0.0%) |
| Professional & Scientific | 19 (13.4%) | 123 (86.6%) |
| Enterprise Management | 10 (100.0%) | 0 (0.0%) |
| Administrative & Support | 0 (0.0%) | 65 (100.0%) |
| Educational Services | 60 (19.2%) | 253 (80.8%) |
| Health Care & Social Assistance | 176 (46.2%) | 205 (53.8%) |
| Arts, Entertainment & Recreation | 64 (68.8%) | 29 (31.2%) |
| Accommodation & Food Services | 101 (56.7%) | 77 (43.3%) |
| Public Administration | 185 (90.7%) | 19 (9.3%) |
| Total | 1,510 (51.1%) | 1,447 (48.9%) |
Education in Geneseo
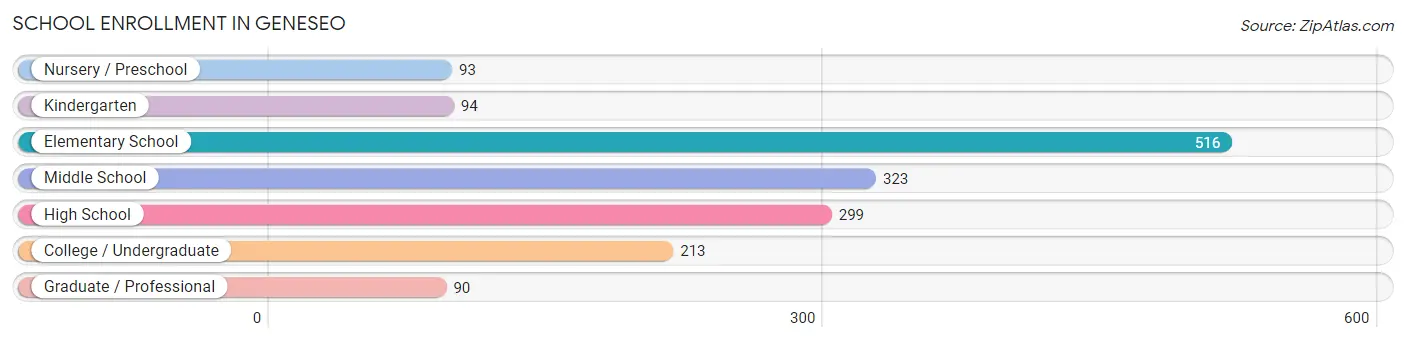
School Enrollment in Geneseo
The most common levels of schooling among the 1,628 students in Geneseo are elementary school (516 | 31.7%), middle school (323 | 19.8%), and high school (299 | 18.4%).
| School Level | # Students | % Students |
| Nursery / Preschool | 93 | 5.7% |
| Kindergarten | 94 | 5.8% |
| Elementary School | 516 | 31.7% |
| Middle School | 323 | 19.8% |
| High School | 299 | 18.4% |
| College / Undergraduate | 213 | 13.1% |
| Graduate / Professional | 90 | 5.5% |
| Total | 1,628 | 100.0% |
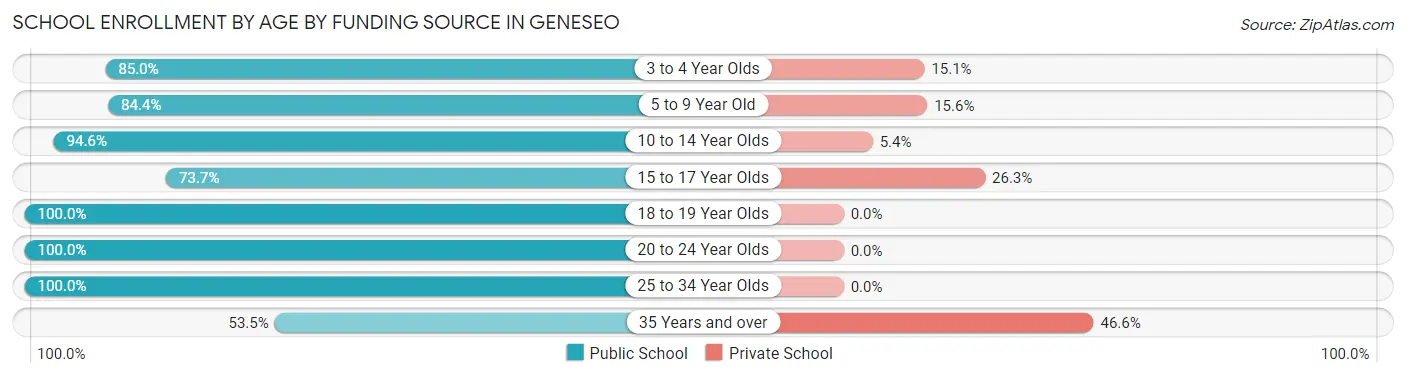
School Enrollment by Age by Funding Source in Geneseo
Out of a total of 1,628 students who are enrolled in schools in Geneseo, 257 (15.8%) attend a private institution, while the remaining 1,371 (84.2%) are enrolled in public schools. The age group of 35 years and over has the highest likelihood of being enrolled in private schools, with 81 (46.6% in the age bracket) enrolled. Conversely, the age group of 18 to 19 year olds has the lowest likelihood of being enrolled in a private school, with 110 (100.0% in the age bracket) attending a public institution.
| Age Bracket | Public School | Private School |
| 3 to 4 Year Olds | 79 (85.0%) | 14 (15.0%) |
| 5 to 9 Year Old | 494 (84.4%) | 91 (15.6%) |
| 10 to 14 Year Olds | 385 (94.6%) | 22 (5.4%) |
| 15 to 17 Year Olds | 137 (73.7%) | 49 (26.3%) |
| 18 to 19 Year Olds | 110 (100.0%) | 0 (0.0%) |
| 20 to 24 Year Olds | 47 (100.0%) | 0 (0.0%) |
| 25 to 34 Year Olds | 26 (100.0%) | 0 (0.0%) |
| 35 Years and over | 93 (53.4%) | 81 (46.6%) |
| Total | 1,371 (84.2%) | 257 (15.8%) |
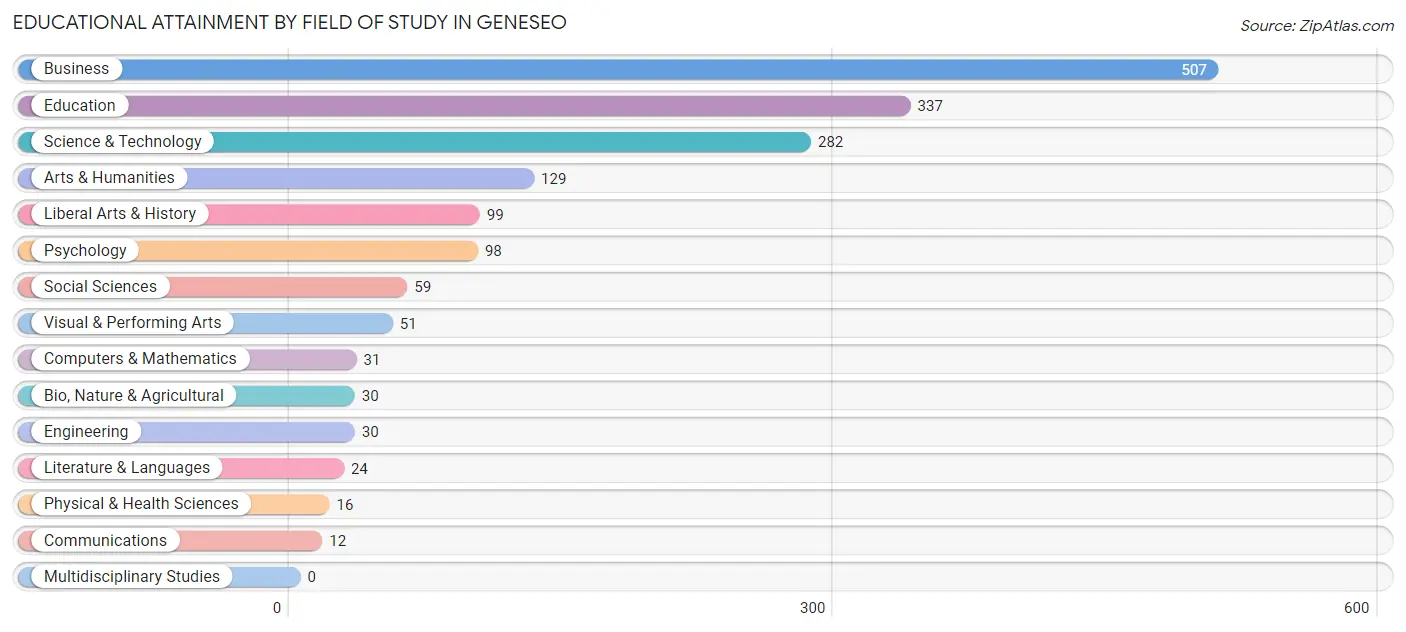
Educational Attainment by Field of Study in Geneseo
Business (507 | 29.7%), education (337 | 19.8%), science & technology (282 | 16.5%), arts & humanities (129 | 7.6%), and liberal arts & history (99 | 5.8%) are the most common fields of study among 1,705 individuals in Geneseo who have obtained a bachelor's degree or higher.
| Field of Study | # Graduates | % Graduates |
| Computers & Mathematics | 31 | 1.8% |
| Bio, Nature & Agricultural | 30 | 1.8% |
| Physical & Health Sciences | 16 | 0.9% |
| Psychology | 98 | 5.8% |
| Social Sciences | 59 | 3.5% |
| Engineering | 30 | 1.8% |
| Multidisciplinary Studies | 0 | 0.0% |
| Science & Technology | 282 | 16.5% |
| Business | 507 | 29.7% |
| Education | 337 | 19.8% |
| Literature & Languages | 24 | 1.4% |
| Liberal Arts & History | 99 | 5.8% |
| Visual & Performing Arts | 51 | 3.0% |
| Communications | 12 | 0.7% |
| Arts & Humanities | 129 | 7.6% |
| Total | 1,705 | 100.0% |
Transportation & Commute in Geneseo
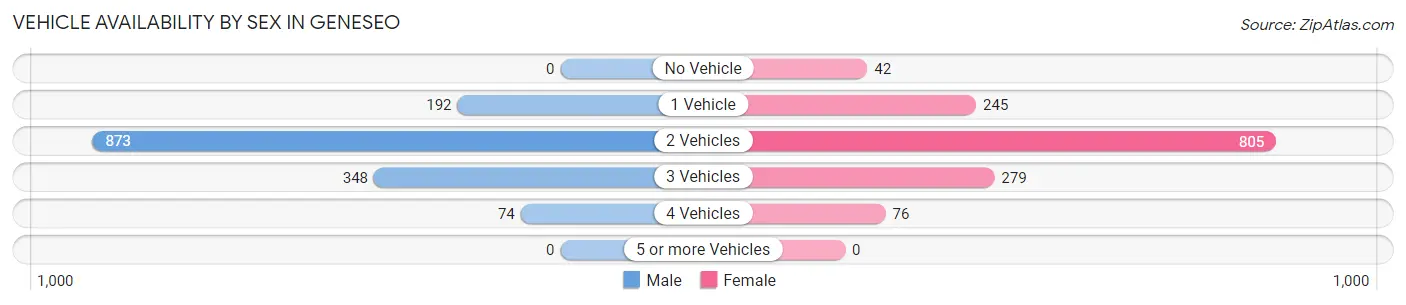
Vehicle Availability by Sex in Geneseo
The most prevalent vehicle ownership categories in Geneseo are males with 2 vehicles (873, accounting for 58.7%) and females with 2 vehicles (805, making up 60.3%).
| Vehicles Available | Male | Female |
| No Vehicle | 0 (0.0%) | 42 (2.9%) |
| 1 Vehicle | 192 (12.9%) | 245 (16.9%) |
| 2 Vehicles | 873 (58.7%) | 805 (55.6%) |
| 3 Vehicles | 348 (23.4%) | 279 (19.3%) |
| 4 Vehicles | 74 (5.0%) | 76 (5.2%) |
| 5 or more Vehicles | 0 (0.0%) | 0 (0.0%) |
| Total | 1,487 (100.0%) | 1,447 (100.0%) |
Commute Time in Geneseo
The most frequently occuring commute durations in Geneseo are 5 to 9 minutes (728 commuters, 26.0%), 30 to 34 minutes (502 commuters, 17.9%), and less than 5 minutes (411 commuters, 14.7%).
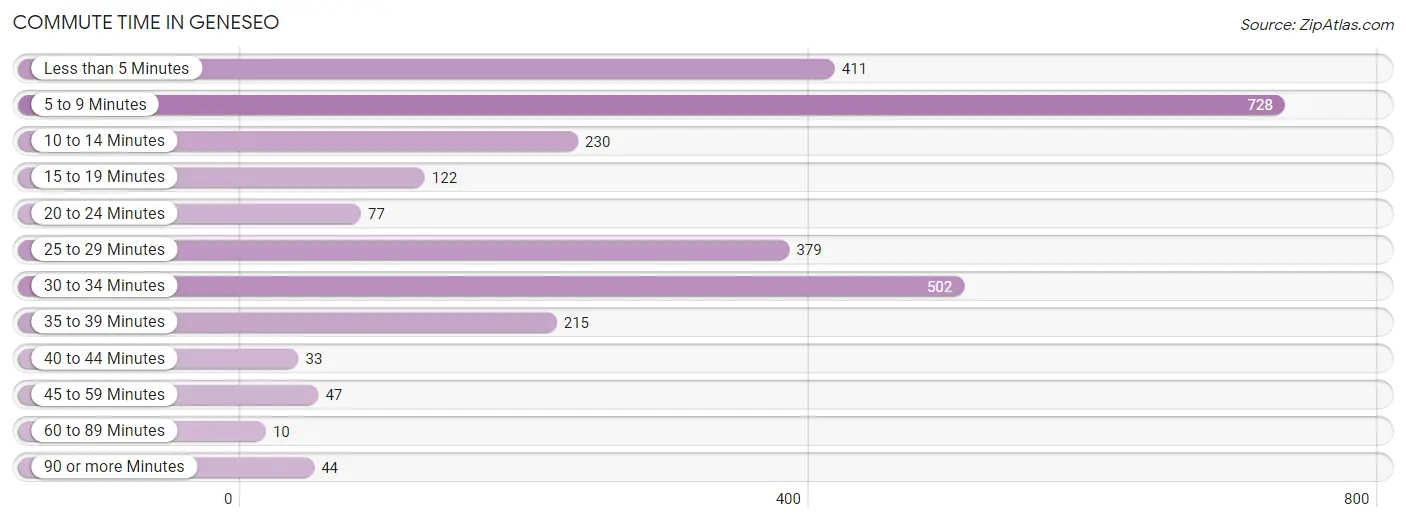
| Commute Time | # Commuters | % Commuters |
| Less than 5 Minutes | 411 | 14.7% |
| 5 to 9 Minutes | 728 | 26.0% |
| 10 to 14 Minutes | 230 | 8.2% |
| 15 to 19 Minutes | 122 | 4.4% |
| 20 to 24 Minutes | 77 | 2.8% |
| 25 to 29 Minutes | 379 | 13.6% |
| 30 to 34 Minutes | 502 | 17.9% |
| 35 to 39 Minutes | 215 | 7.7% |
| 40 to 44 Minutes | 33 | 1.2% |
| 45 to 59 Minutes | 47 | 1.7% |
| 60 to 89 Minutes | 10 | 0.4% |
| 90 or more Minutes | 44 | 1.6% |
Commute Time by Sex in Geneseo
The most common commute times in Geneseo are 5 to 9 minutes (357 commuters, 24.7%) for males and 5 to 9 minutes (371 commuters, 27.4%) for females.
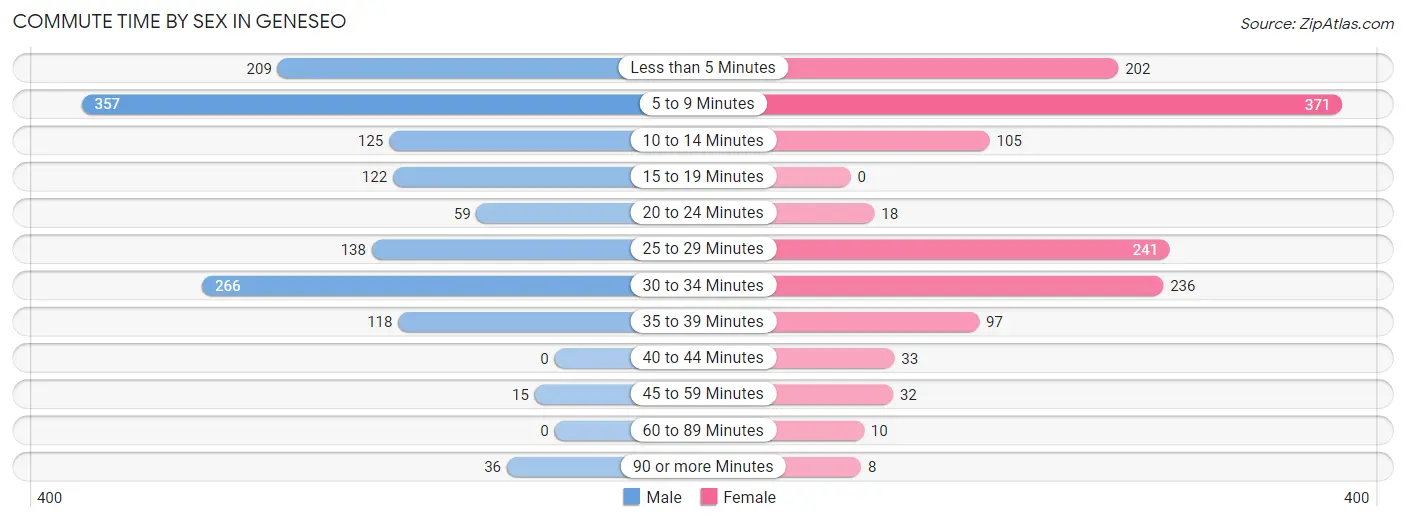
| Commute Time | Male | Female |
| Less than 5 Minutes | 209 (14.5%) | 202 (14.9%) |
| 5 to 9 Minutes | 357 (24.7%) | 371 (27.4%) |
| 10 to 14 Minutes | 125 (8.6%) | 105 (7.8%) |
| 15 to 19 Minutes | 122 (8.4%) | 0 (0.0%) |
| 20 to 24 Minutes | 59 (4.1%) | 18 (1.3%) |
| 25 to 29 Minutes | 138 (9.6%) | 241 (17.8%) |
| 30 to 34 Minutes | 266 (18.4%) | 236 (17.4%) |
| 35 to 39 Minutes | 118 (8.2%) | 97 (7.2%) |
| 40 to 44 Minutes | 0 (0.0%) | 33 (2.4%) |
| 45 to 59 Minutes | 15 (1.0%) | 32 (2.4%) |
| 60 to 89 Minutes | 0 (0.0%) | 10 (0.7%) |
| 90 or more Minutes | 36 (2.5%) | 8 (0.6%) |
Time of Departure to Work by Sex in Geneseo
The most frequent times of departure to work in Geneseo are 7:00 AM to 7:29 AM (201, 13.9%) for males and 7:00 AM to 7:29 AM (399, 29.5%) for females.
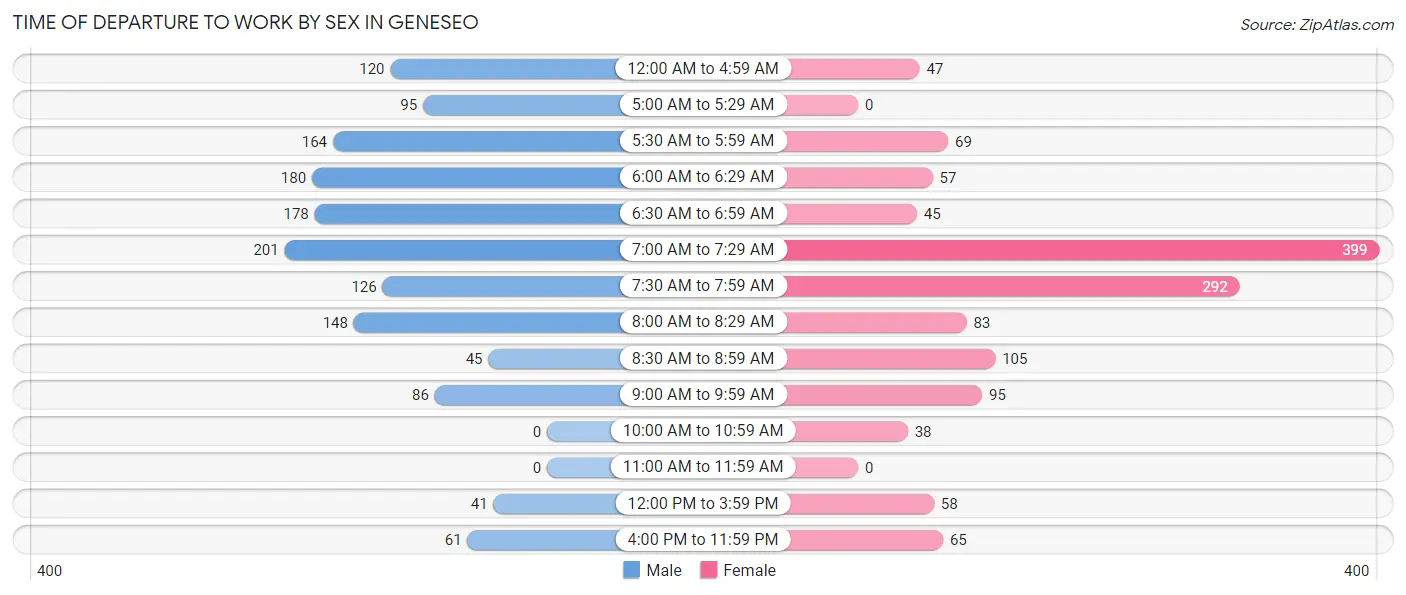
| Time of Departure | Male | Female |
| 12:00 AM to 4:59 AM | 120 (8.3%) | 47 (3.5%) |
| 5:00 AM to 5:29 AM | 95 (6.6%) | 0 (0.0%) |
| 5:30 AM to 5:59 AM | 164 (11.4%) | 69 (5.1%) |
| 6:00 AM to 6:29 AM | 180 (12.5%) | 57 (4.2%) |
| 6:30 AM to 6:59 AM | 178 (12.3%) | 45 (3.3%) |
| 7:00 AM to 7:29 AM | 201 (13.9%) | 399 (29.5%) |
| 7:30 AM to 7:59 AM | 126 (8.7%) | 292 (21.6%) |
| 8:00 AM to 8:29 AM | 148 (10.2%) | 83 (6.1%) |
| 8:30 AM to 8:59 AM | 45 (3.1%) | 105 (7.8%) |
| 9:00 AM to 9:59 AM | 86 (5.9%) | 95 (7.0%) |
| 10:00 AM to 10:59 AM | 0 (0.0%) | 38 (2.8%) |
| 11:00 AM to 11:59 AM | 0 (0.0%) | 0 (0.0%) |
| 12:00 PM to 3:59 PM | 41 (2.8%) | 58 (4.3%) |
| 4:00 PM to 11:59 PM | 61 (4.2%) | 65 (4.8%) |
| Total | 1,445 (100.0%) | 1,353 (100.0%) |
Housing Occupancy in Geneseo
Occupancy by Ownership in Geneseo
Of the total 2,960 dwellings in Geneseo, owner-occupied units account for 2,113 (71.4%), while renter-occupied units make up 847 (28.6%).
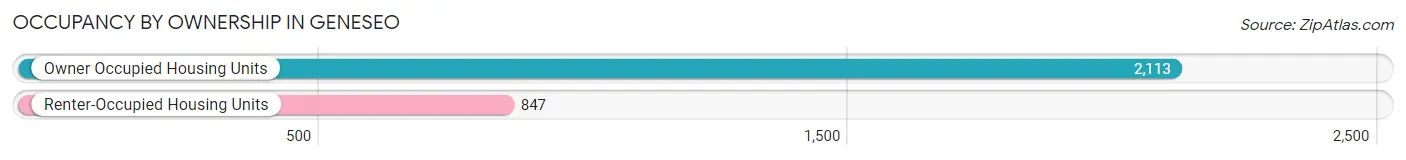
| Occupancy | # Housing Units | % Housing Units |
| Owner Occupied Housing Units | 2,113 | 71.4% |
| Renter-Occupied Housing Units | 847 | 28.6% |
| Total Occupied Housing Units | 2,960 | 100.0% |
Occupancy by Household Size in Geneseo
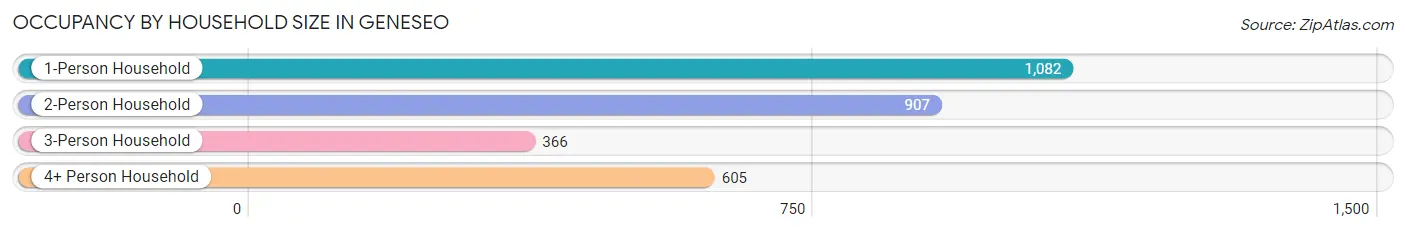
| Household Size | # Housing Units | % Housing Units |
| 1-Person Household | 1,082 | 36.5% |
| 2-Person Household | 907 | 30.6% |
| 3-Person Household | 366 | 12.4% |
| 4+ Person Household | 605 | 20.4% |
| Total Housing Units | 2,960 | 100.0% |
Occupancy by Ownership by Household Size in Geneseo
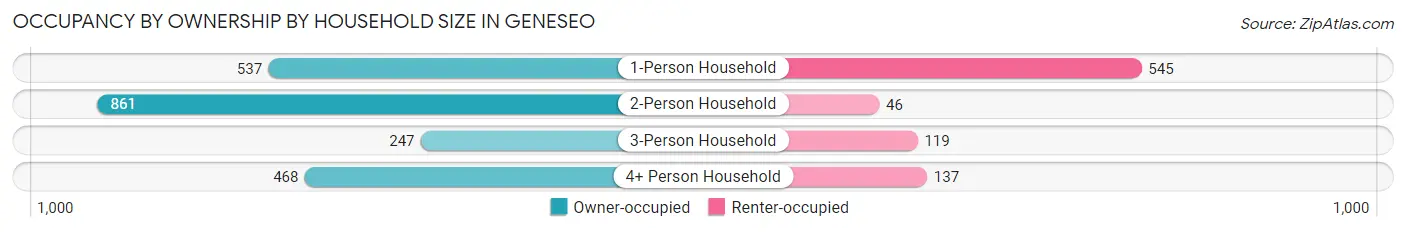
| Household Size | Owner-occupied | Renter-occupied |
| 1-Person Household | 537 (49.6%) | 545 (50.4%) |
| 2-Person Household | 861 (94.9%) | 46 (5.1%) |
| 3-Person Household | 247 (67.5%) | 119 (32.5%) |
| 4+ Person Household | 468 (77.4%) | 137 (22.6%) |
| Total Housing Units | 2,113 (71.4%) | 847 (28.6%) |
Occupancy by Educational Attainment in Geneseo
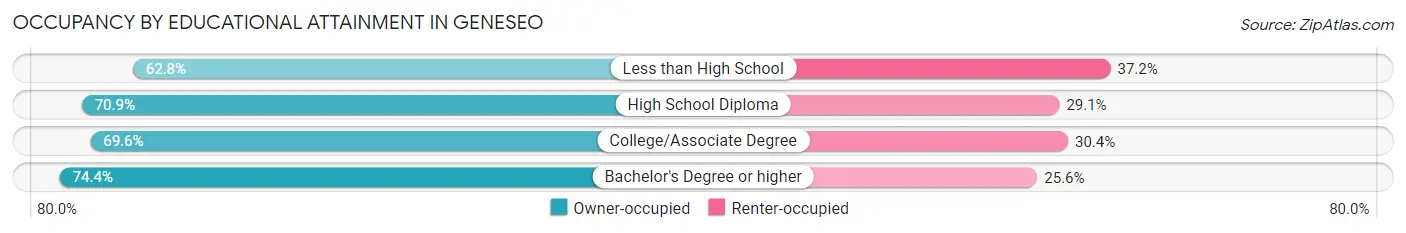
| Household Size | Owner-occupied | Renter-occupied |
| Less than High School | 49 (62.8%) | 29 (37.2%) |
| High School Diploma | 649 (70.9%) | 266 (29.1%) |
| College/Associate Degree | 702 (69.6%) | 307 (30.4%) |
| Bachelor's Degree or higher | 713 (74.4%) | 245 (25.6%) |
Occupancy by Age of Householder in Geneseo
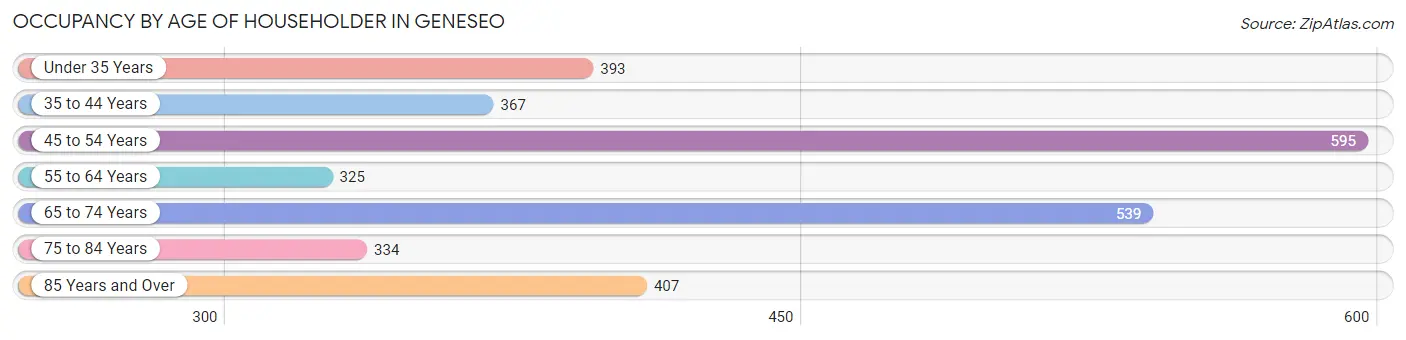
| Age Bracket | # Households | % Households |
| Under 35 Years | 393 | 13.3% |
| 35 to 44 Years | 367 | 12.4% |
| 45 to 54 Years | 595 | 20.1% |
| 55 to 64 Years | 325 | 11.0% |
| 65 to 74 Years | 539 | 18.2% |
| 75 to 84 Years | 334 | 11.3% |
| 85 Years and Over | 407 | 13.8% |
| Total | 2,960 | 100.0% |
Housing Finances in Geneseo
Median Income by Occupancy in Geneseo
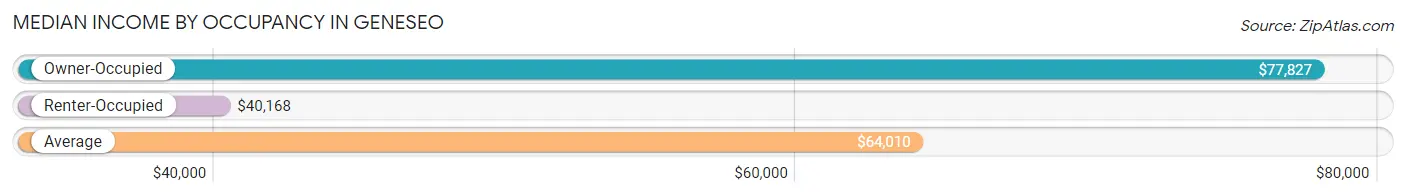
| Occupancy Type | # Households | Median Income |
| Owner-Occupied | 2,113 (71.4%) | $77,827 |
| Renter-Occupied | 847 (28.6%) | $40,168 |
| Average | 2,960 (100.0%) | $64,010 |
Occupancy by Householder Income Bracket in Geneseo
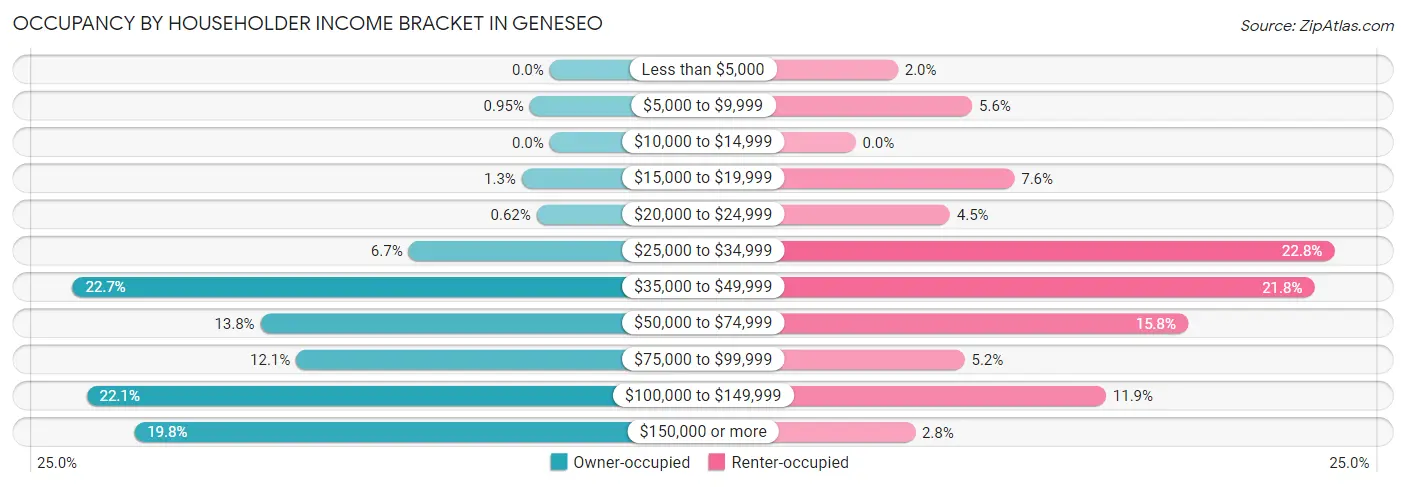
| Income Bracket | Owner-occupied | Renter-occupied |
| Less than $5,000 | 0 (0.0%) | 17 (2.0%) |
| $5,000 to $9,999 | 20 (0.9%) | 47 (5.6%) |
| $10,000 to $14,999 | 0 (0.0%) | 0 (0.0%) |
| $15,000 to $19,999 | 28 (1.3%) | 64 (7.6%) |
| $20,000 to $24,999 | 13 (0.6%) | 38 (4.5%) |
| $25,000 to $34,999 | 142 (6.7%) | 193 (22.8%) |
| $35,000 to $49,999 | 480 (22.7%) | 185 (21.8%) |
| $50,000 to $74,999 | 291 (13.8%) | 134 (15.8%) |
| $75,000 to $99,999 | 255 (12.1%) | 44 (5.2%) |
| $100,000 to $149,999 | 466 (22.1%) | 101 (11.9%) |
| $150,000 or more | 418 (19.8%) | 24 (2.8%) |
| Total | 2,113 (100.0%) | 847 (100.0%) |
Monthly Housing Cost Tiers in Geneseo
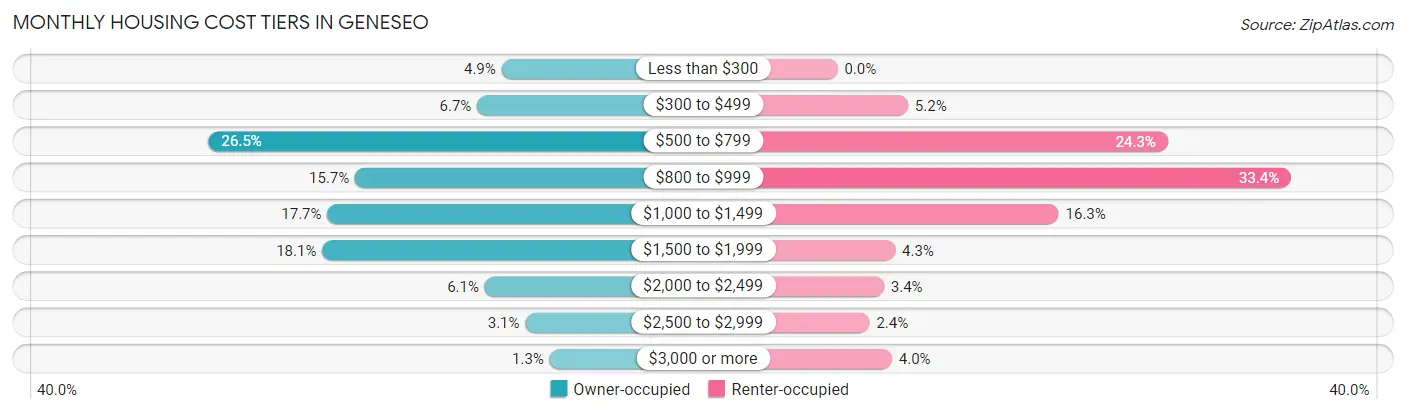
| Monthly Cost | Owner-occupied | Renter-occupied |
| Less than $300 | 103 (4.9%) | 0 (0.0%) |
| $300 to $499 | 141 (6.7%) | 44 (5.2%) |
| $500 to $799 | 559 (26.5%) | 206 (24.3%) |
| $800 to $999 | 331 (15.7%) | 283 (33.4%) |
| $1,000 to $1,499 | 374 (17.7%) | 138 (16.3%) |
| $1,500 to $1,999 | 382 (18.1%) | 36 (4.3%) |
| $2,000 to $2,499 | 129 (6.1%) | 29 (3.4%) |
| $2,500 to $2,999 | 66 (3.1%) | 20 (2.4%) |
| $3,000 or more | 28 (1.3%) | 34 (4.0%) |
| Total | 2,113 (100.0%) | 847 (100.0%) |
Physical Housing Characteristics in Geneseo
Housing Structures in Geneseo
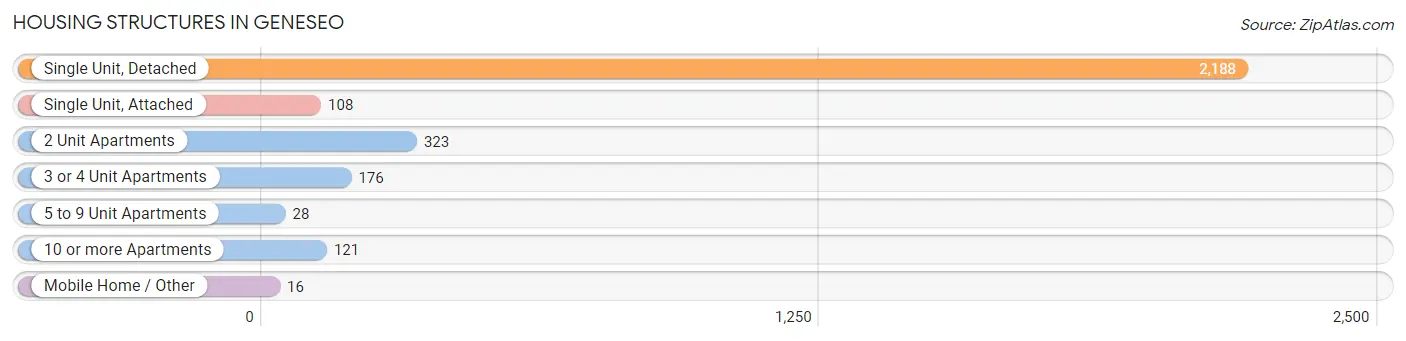
| Structure Type | # Housing Units | % Housing Units |
| Single Unit, Detached | 2,188 | 73.9% |
| Single Unit, Attached | 108 | 3.6% |
| 2 Unit Apartments | 323 | 10.9% |
| 3 or 4 Unit Apartments | 176 | 5.9% |
| 5 to 9 Unit Apartments | 28 | 0.9% |
| 10 or more Apartments | 121 | 4.1% |
| Mobile Home / Other | 16 | 0.5% |
| Total | 2,960 | 100.0% |
Housing Structures by Occupancy in Geneseo
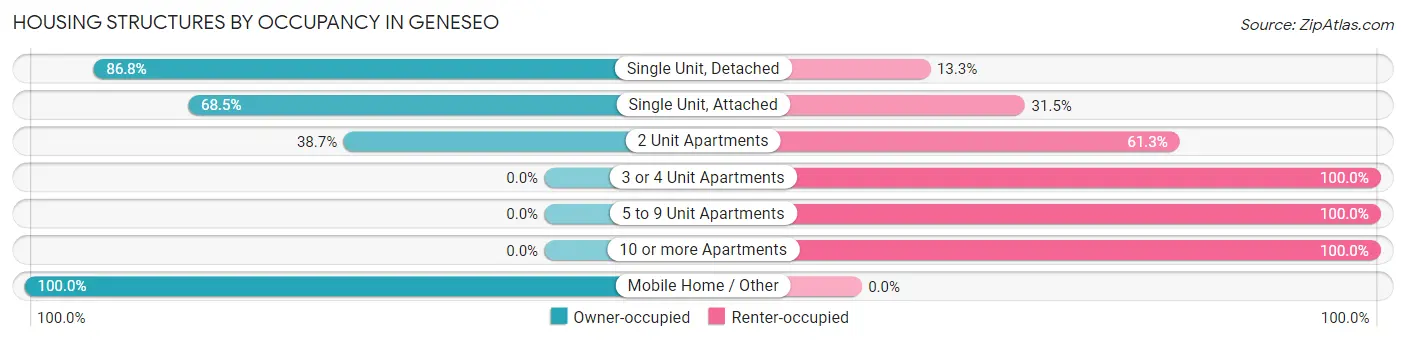
| Structure Type | Owner-occupied | Renter-occupied |
| Single Unit, Detached | 1,898 (86.8%) | 290 (13.3%) |
| Single Unit, Attached | 74 (68.5%) | 34 (31.5%) |
| 2 Unit Apartments | 125 (38.7%) | 198 (61.3%) |
| 3 or 4 Unit Apartments | 0 (0.0%) | 176 (100.0%) |
| 5 to 9 Unit Apartments | 0 (0.0%) | 28 (100.0%) |
| 10 or more Apartments | 0 (0.0%) | 121 (100.0%) |
| Mobile Home / Other | 16 (100.0%) | 0 (0.0%) |
| Total | 2,113 (71.4%) | 847 (28.6%) |
Housing Structures by Number of Rooms in Geneseo
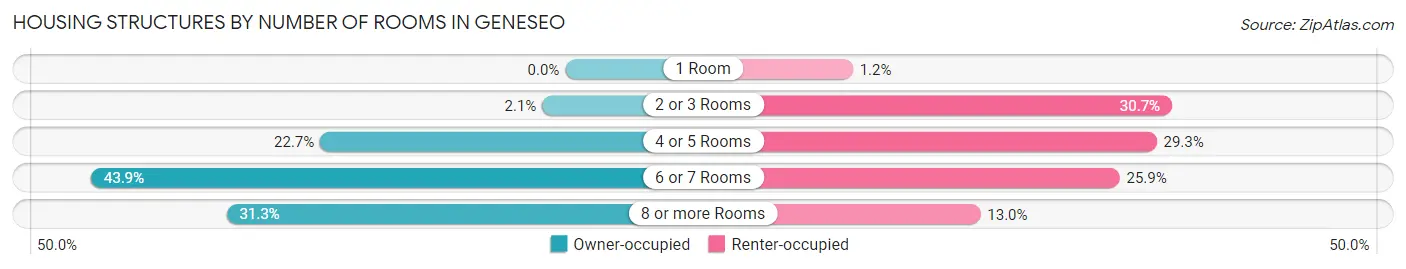
| Number of Rooms | Owner-occupied | Renter-occupied |
| 1 Room | 0 (0.0%) | 10 (1.2%) |
| 2 or 3 Rooms | 45 (2.1%) | 260 (30.7%) |
| 4 or 5 Rooms | 479 (22.7%) | 248 (29.3%) |
| 6 or 7 Rooms | 927 (43.9%) | 219 (25.9%) |
| 8 or more Rooms | 662 (31.3%) | 110 (13.0%) |
| Total | 2,113 (100.0%) | 847 (100.0%) |
Housing Structure by Heating Type in Geneseo
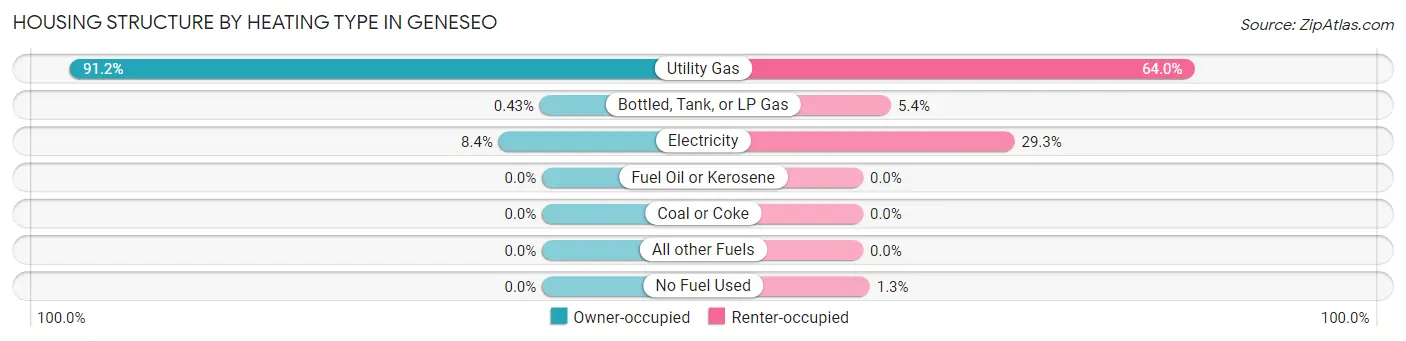
| Heating Type | Owner-occupied | Renter-occupied |
| Utility Gas | 1,927 (91.2%) | 542 (64.0%) |
| Bottled, Tank, or LP Gas | 9 (0.4%) | 46 (5.4%) |
| Electricity | 177 (8.4%) | 248 (29.3%) |
| Fuel Oil or Kerosene | 0 (0.0%) | 0 (0.0%) |
| Coal or Coke | 0 (0.0%) | 0 (0.0%) |
| All other Fuels | 0 (0.0%) | 0 (0.0%) |
| No Fuel Used | 0 (0.0%) | 11 (1.3%) |
| Total | 2,113 (100.0%) | 847 (100.0%) |
Household Vehicle Usage in Geneseo
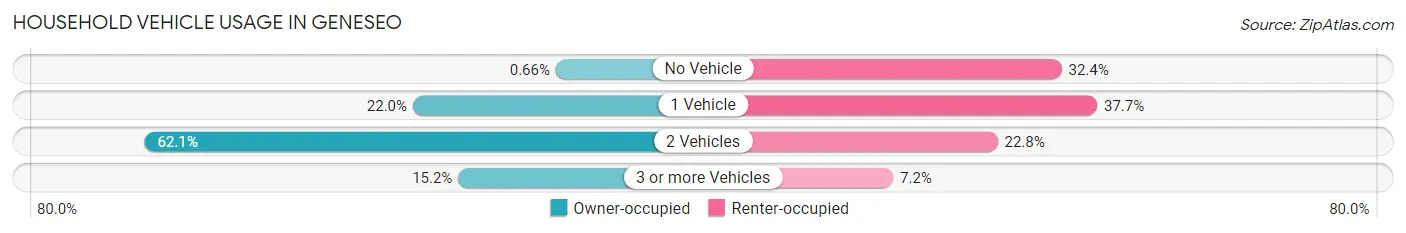
| Vehicles per Household | Owner-occupied | Renter-occupied |
| No Vehicle | 14 (0.7%) | 274 (32.4%) |
| 1 Vehicle | 465 (22.0%) | 319 (37.7%) |
| 2 Vehicles | 1,312 (62.1%) | 193 (22.8%) |
| 3 or more Vehicles | 322 (15.2%) | 61 (7.2%) |
| Total | 2,113 (100.0%) | 847 (100.0%) |
Real Estate & Mortgages in Geneseo
Real Estate and Mortgage Overview in Geneseo
| Characteristic | Without Mortgage | With Mortgage |
| Housing Units | 865 | 1,248 |
| Median Property Value | $184,800 | $171,400 |
| Median Household Income | $59,625 | $284 |
| Monthly Housing Costs | $655 | $28 |
| Real Estate Taxes | $3,593 | $0 |
Property Value by Mortgage Status in Geneseo
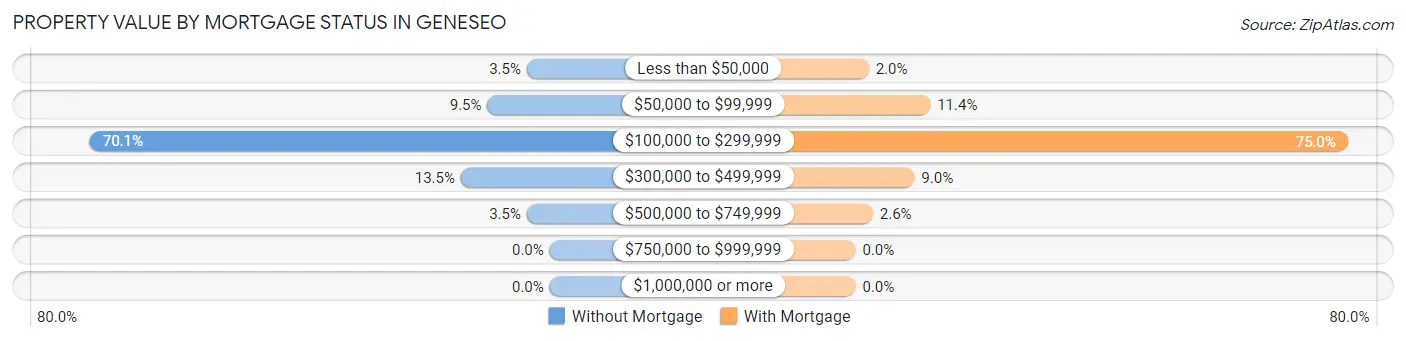
| Property Value | Without Mortgage | With Mortgage |
| Less than $50,000 | 30 (3.5%) | 25 (2.0%) |
| $50,000 to $99,999 | 82 (9.5%) | 142 (11.4%) |
| $100,000 to $299,999 | 606 (70.1%) | 936 (75.0%) |
| $300,000 to $499,999 | 117 (13.5%) | 112 (9.0%) |
| $500,000 to $749,999 | 30 (3.5%) | 33 (2.6%) |
| $750,000 to $999,999 | 0 (0.0%) | 0 (0.0%) |
| $1,000,000 or more | 0 (0.0%) | 0 (0.0%) |
| Total | 865 (100.0%) | 1,248 (100.0%) |
Household Income by Mortgage Status in Geneseo
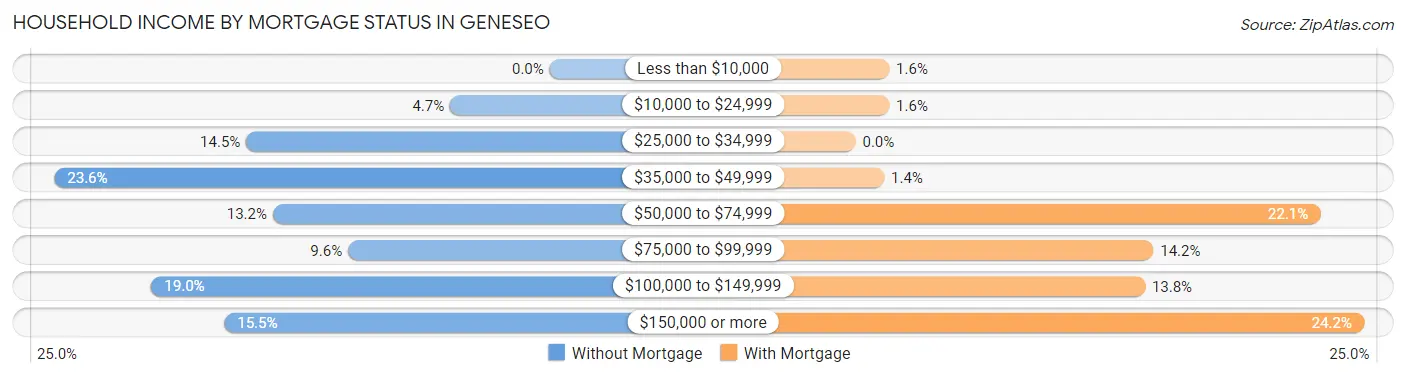
| Household Income | Without Mortgage | With Mortgage |
| Less than $10,000 | 0 (0.0%) | 20 (1.6%) |
| $10,000 to $24,999 | 41 (4.7%) | 20 (1.6%) |
| $25,000 to $34,999 | 125 (14.4%) | 0 (0.0%) |
| $35,000 to $49,999 | 204 (23.6%) | 17 (1.4%) |
| $50,000 to $74,999 | 114 (13.2%) | 276 (22.1%) |
| $75,000 to $99,999 | 83 (9.6%) | 177 (14.2%) |
| $100,000 to $149,999 | 164 (19.0%) | 172 (13.8%) |
| $150,000 or more | 134 (15.5%) | 302 (24.2%) |
| Total | 865 (100.0%) | 1,248 (100.0%) |
Property Value to Household Income Ratio in Geneseo
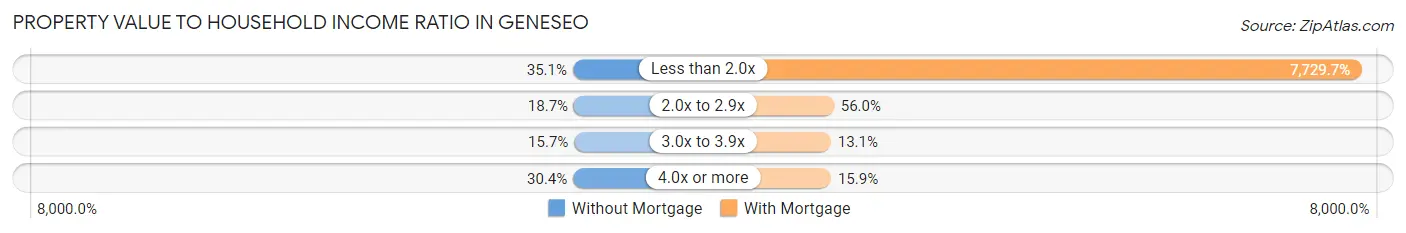
| Value-to-Income Ratio | Without Mortgage | With Mortgage |
| Less than 2.0x | 304 (35.1%) | 96,467 (7,729.7%) |
| 2.0x to 2.9x | 162 (18.7%) | 699 (56.0%) |
| 3.0x to 3.9x | 136 (15.7%) | 164 (13.1%) |
| 4.0x or more | 263 (30.4%) | 198 (15.9%) |
| Total | 865 (100.0%) | 1,248 (100.0%) |
Real Estate Taxes by Mortgage Status in Geneseo
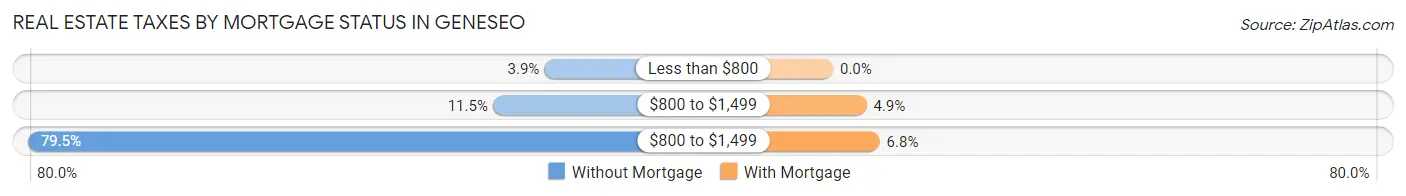
| Property Taxes | Without Mortgage | With Mortgage |
| Less than $800 | 34 (3.9%) | 0 (0.0%) |
| $800 to $1,499 | 99 (11.5%) | 61 (4.9%) |
| $800 to $1,499 | 688 (79.5%) | 85 (6.8%) |
| Total | 865 (100.0%) | 1,248 (100.0%) |
Health & Disability in Geneseo
Health Insurance Coverage by Age in Geneseo
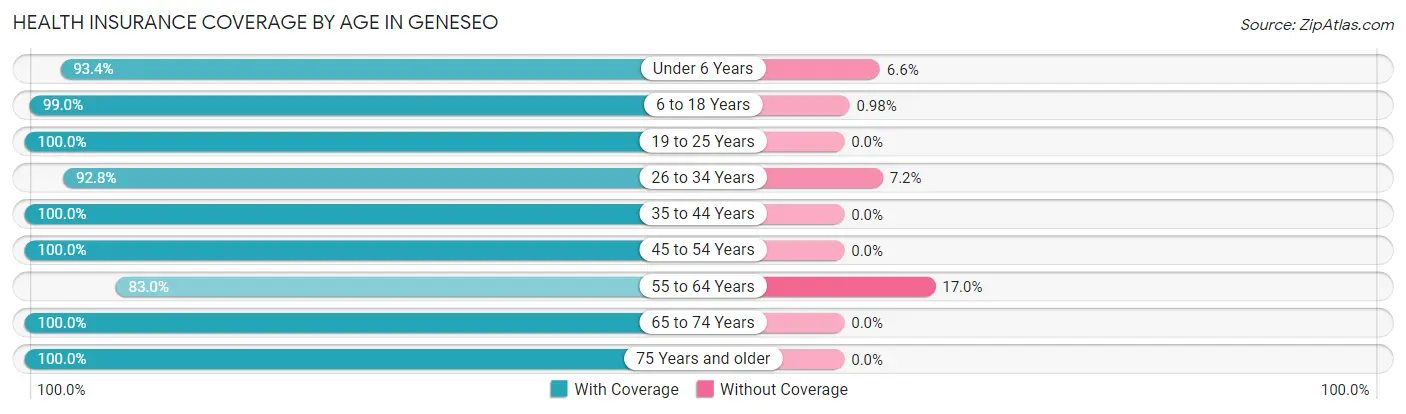
| Age Bracket | With Coverage | Without Coverage |
| Under 6 Years | 239 (93.4%) | 17 (6.6%) |
| 6 to 18 Years | 1,216 (99.0%) | 12 (1.0%) |
| 19 to 25 Years | 217 (100.0%) | 0 (0.0%) |
| 26 to 34 Years | 672 (92.8%) | 52 (7.2%) |
| 35 to 44 Years | 666 (100.0%) | 0 (0.0%) |
| 45 to 54 Years | 960 (100.0%) | 0 (0.0%) |
| 55 to 64 Years | 494 (83.0%) | 101 (17.0%) |
| 65 to 74 Years | 724 (100.0%) | 0 (0.0%) |
| 75 Years and older | 958 (100.0%) | 0 (0.0%) |
| Total | 6,146 (97.1%) | 182 (2.9%) |
Health Insurance Coverage by Citizenship Status in Geneseo
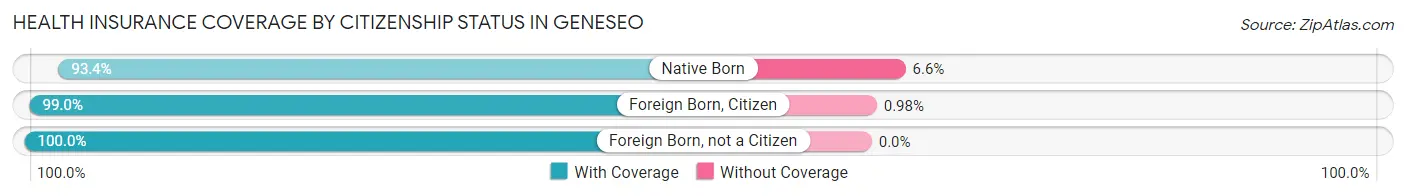
| Citizenship Status | With Coverage | Without Coverage |
| Native Born | 239 (93.4%) | 17 (6.6%) |
| Foreign Born, Citizen | 1,216 (99.0%) | 12 (1.0%) |
| Foreign Born, not a Citizen | 217 (100.0%) | 0 (0.0%) |
Health Insurance Coverage by Household Income in Geneseo
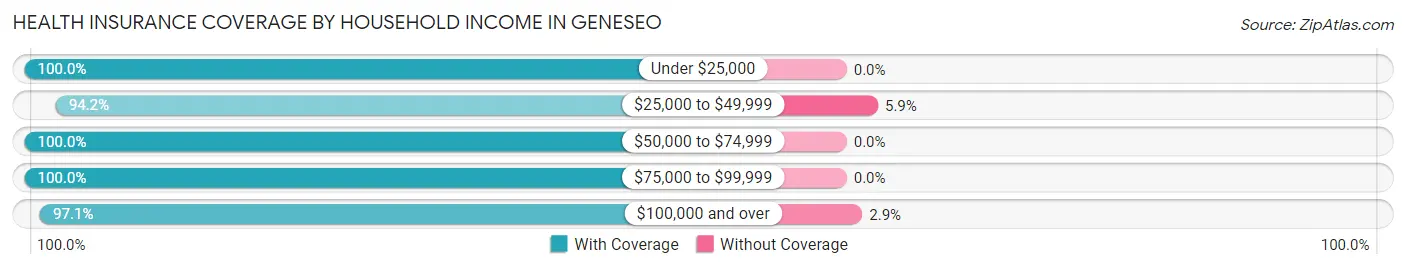
| Household Income | With Coverage | Without Coverage |
| Under $25,000 | 296 (100.0%) | 0 (0.0%) |
| $25,000 to $49,999 | 1,528 (94.2%) | 95 (5.9%) |
| $50,000 to $74,999 | 705 (100.0%) | 0 (0.0%) |
| $75,000 to $99,999 | 723 (100.0%) | 0 (0.0%) |
| $100,000 and over | 2,894 (97.1%) | 87 (2.9%) |
Public vs Private Health Insurance Coverage by Age in Geneseo
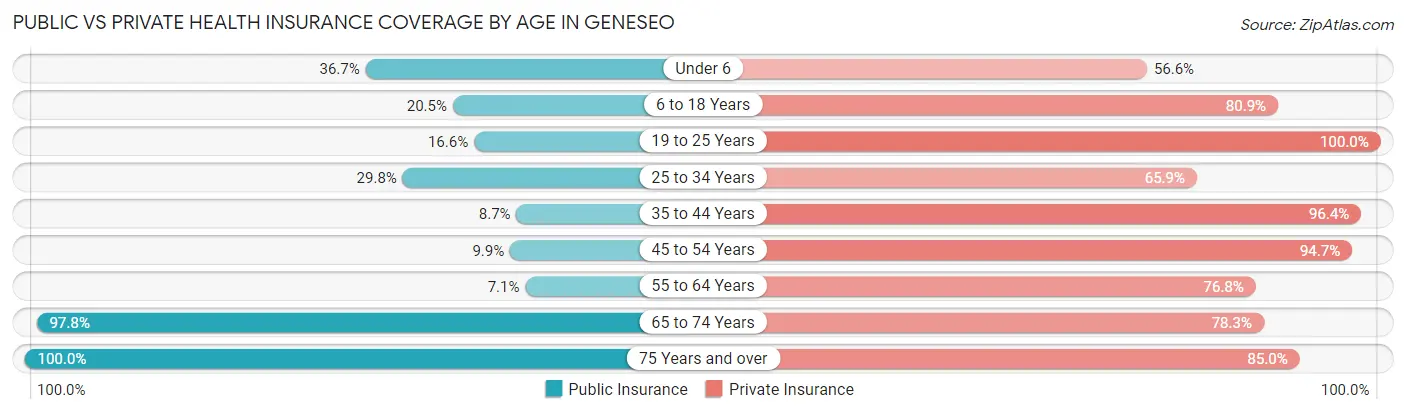
| Age Bracket | Public Insurance | Private Insurance |
| Under 6 | 94 (36.7%) | 145 (56.6%) |
| 6 to 18 Years | 252 (20.5%) | 994 (80.9%) |
| 19 to 25 Years | 36 (16.6%) | 217 (100.0%) |
| 25 to 34 Years | 216 (29.8%) | 477 (65.9%) |
| 35 to 44 Years | 58 (8.7%) | 642 (96.4%) |
| 45 to 54 Years | 95 (9.9%) | 909 (94.7%) |
| 55 to 64 Years | 42 (7.1%) | 457 (76.8%) |
| 65 to 74 Years | 708 (97.8%) | 567 (78.3%) |
| 75 Years and over | 958 (100.0%) | 814 (85.0%) |
| Total | 2,459 (38.9%) | 5,222 (82.5%) |
Disability Status by Sex by Age in Geneseo
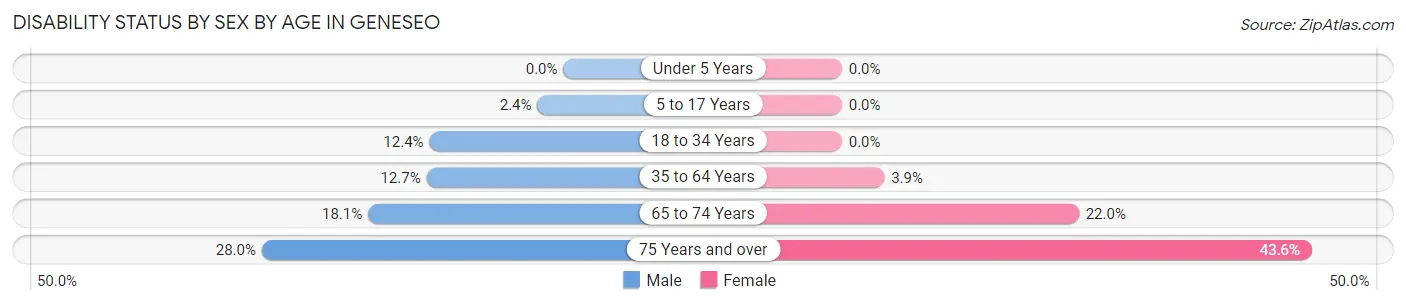
| Age Bracket | Male | Female |
| Under 5 Years | 0 (0.0%) | 0 (0.0%) |
| 5 to 17 Years | 13 (2.4%) | 0 (0.0%) |
| 18 to 34 Years | 67 (12.4%) | 0 (0.0%) |
| 35 to 64 Years | 150 (12.7%) | 41 (3.9%) |
| 65 to 74 Years | 62 (18.1%) | 84 (22.0%) |
| 75 Years and over | 75 (28.0%) | 301 (43.6%) |
Disability Class by Sex by Age in Geneseo
Disability Class: Hearing Difficulty
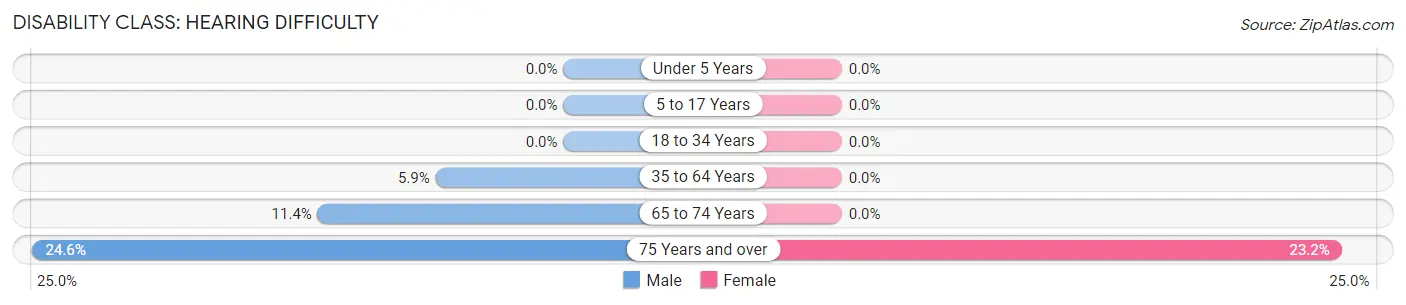
| Age Bracket | Male | Female |
| Under 5 Years | 0 (0.0%) | 0 (0.0%) |
| 5 to 17 Years | 0 (0.0%) | 0 (0.0%) |
| 18 to 34 Years | 0 (0.0%) | 0 (0.0%) |
| 35 to 64 Years | 70 (5.9%) | 0 (0.0%) |
| 65 to 74 Years | 39 (11.4%) | 0 (0.0%) |
| 75 Years and over | 66 (24.6%) | 160 (23.2%) |
Disability Class: Vision Difficulty
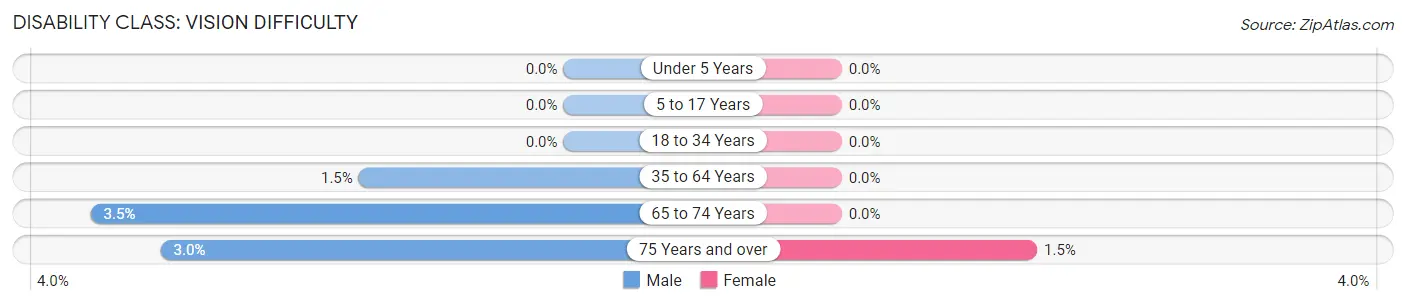
| Age Bracket | Male | Female |
| Under 5 Years | 0 (0.0%) | 0 (0.0%) |
| 5 to 17 Years | 0 (0.0%) | 0 (0.0%) |
| 18 to 34 Years | 0 (0.0%) | 0 (0.0%) |
| 35 to 64 Years | 18 (1.5%) | 0 (0.0%) |
| 65 to 74 Years | 12 (3.5%) | 0 (0.0%) |
| 75 Years and over | 8 (3.0%) | 10 (1.5%) |
Disability Class: Cognitive Difficulty
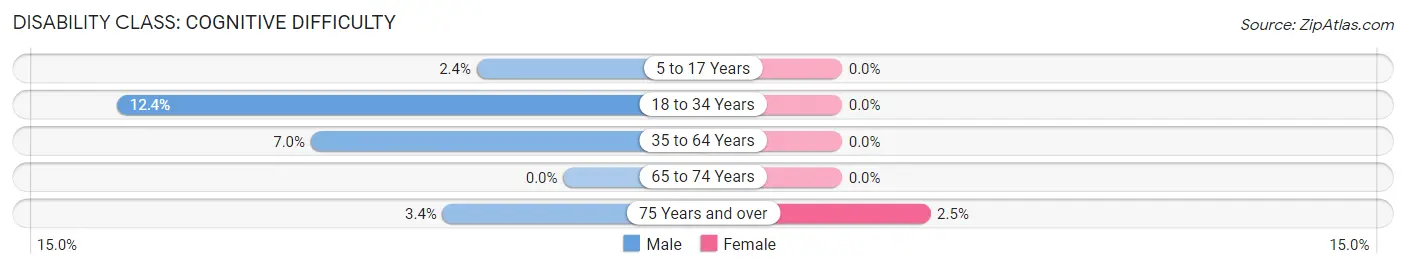
| Age Bracket | Male | Female |
| 5 to 17 Years | 13 (2.4%) | 0 (0.0%) |
| 18 to 34 Years | 67 (12.4%) | 0 (0.0%) |
| 35 to 64 Years | 83 (7.0%) | 0 (0.0%) |
| 65 to 74 Years | 0 (0.0%) | 0 (0.0%) |
| 75 Years and over | 9 (3.4%) | 17 (2.5%) |
Disability Class: Ambulatory Difficulty
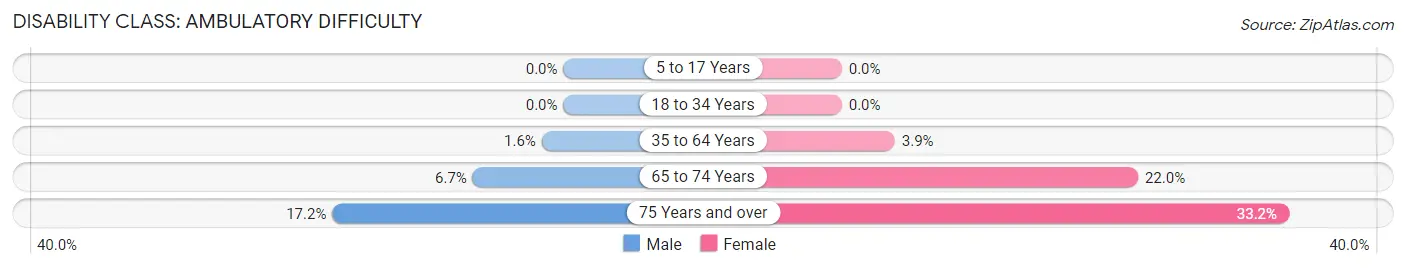
| Age Bracket | Male | Female |
| 5 to 17 Years | 0 (0.0%) | 0 (0.0%) |
| 18 to 34 Years | 0 (0.0%) | 0 (0.0%) |
| 35 to 64 Years | 19 (1.6%) | 41 (3.9%) |
| 65 to 74 Years | 23 (6.7%) | 84 (22.0%) |
| 75 Years and over | 46 (17.2%) | 229 (33.2%) |
Disability Class: Self-Care Difficulty
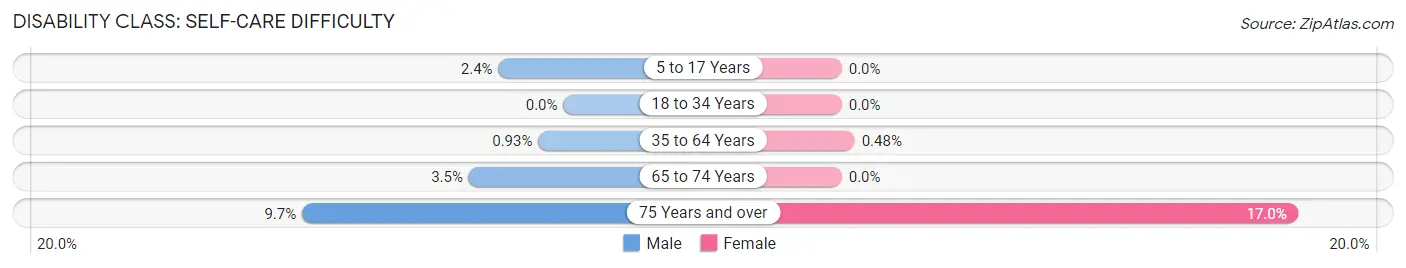
| Age Bracket | Male | Female |
| 5 to 17 Years | 13 (2.4%) | 0 (0.0%) |
| 18 to 34 Years | 0 (0.0%) | 0 (0.0%) |
| 35 to 64 Years | 11 (0.9%) | 5 (0.5%) |
| 65 to 74 Years | 12 (3.5%) | 0 (0.0%) |
| 75 Years and over | 26 (9.7%) | 117 (17.0%) |
Technology Access in Geneseo
Computing Device Access in Geneseo
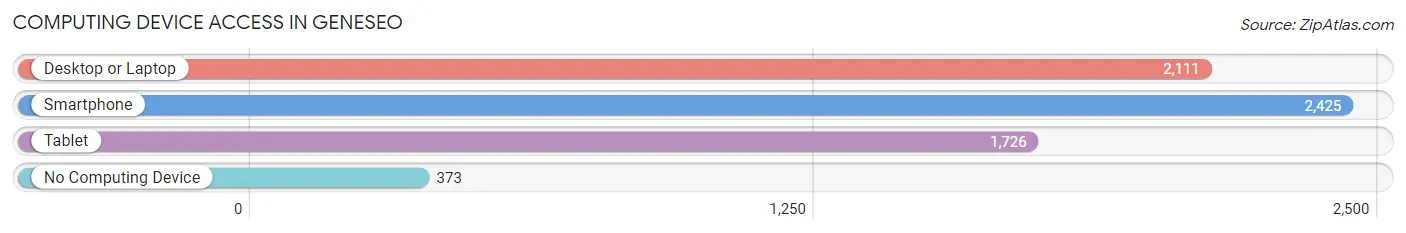
| Device Type | # Households | % Households |
| Desktop or Laptop | 2,111 | 71.3% |
| Smartphone | 2,425 | 81.9% |
| Tablet | 1,726 | 58.3% |
| No Computing Device | 373 | 12.6% |
| Total | 2,960 | 100.0% |
Internet Access in Geneseo
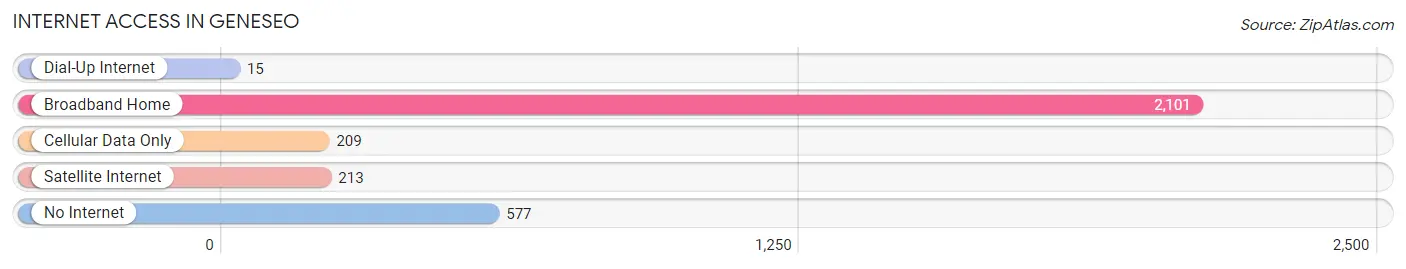
| Internet Type | # Households | % Households |
| Dial-Up Internet | 15 | 0.5% |
| Broadband Home | 2,101 | 71.0% |
| Cellular Data Only | 209 | 7.1% |
| Satellite Internet | 213 | 7.2% |
| No Internet | 577 | 19.5% |
| Total | 2,960 | 100.0% |
Geneseo Summary
Geneseo, Illinois is a small city located in Henry County, in the northwestern part of the state. It is situated on the banks of the Rock River, about 30 miles east of the Mississippi River. The city has a population of 5,586, according to the 2010 census.
Geneseo was founded in 1836 by settlers from New York. The city was named after Geneseo, New York, the hometown of many of the settlers. The city was incorporated in 1867.
Geography
Geneseo is located at 41°30'N, 90°17'W (41.50, -90.28). It is situated on the banks of the Rock River, about 30 miles east of the Mississippi River. The city has a total area of 4.2 square miles, all of which is land.
The city is located in the Midwest, in the Central Time Zone. The climate is humid continental, with hot summers and cold winters. The average annual temperature is 51°F, and the average annual precipitation is 36 inches.
Economy
Geneseo’s economy is largely based on agriculture and manufacturing. The city is home to several large agricultural companies, including Cargill, ADM, and Monsanto. The city also has several manufacturing companies, including John Deere, Caterpillar, and International Harvester.
The city also has a thriving tourism industry. Geneseo is home to several historic sites, including the Geneseo Historic District, the Geneseo Courthouse, and the Geneseo State Bank. The city also has several parks and recreational areas, including the Geneseo City Park, the Geneseo Nature Preserve, and the Geneseo Riverwalk.
Demographics
According to the 2010 census, Geneseo has a population of 5,586. The racial makeup of the city is 97.2% White, 0.7% African American, 0.3% Native American, 0.4% Asian, 0.1% Pacific Islander, 0.4% from other races, and 0.9% from two or more races. Hispanic or Latino of any race were 1.7% of the population.
The median income for a household in Geneseo is $50,945, and the median income for a family is $60,945. The per capita income for the city is $22,945. About 8.2% of families and 10.2% of the population are below the poverty line.
Geneseo is served by the Geneseo Community Unit School District 228. The city is home to several schools, including Geneseo High School, Geneseo Middle School, and Geneseo Elementary School. The city also has several private schools, including Geneseo Christian Academy and Geneseo Montessori School.
Common Questions
What is Per Capita Income in Geneseo?
Per Capita income in Geneseo is $40,287.
What is the Median Family Income in Geneseo?
Median Family Income in Geneseo is $95,734.
What is the Median Household income in Geneseo?
Median Household Income in Geneseo is $64,010.
What is Income or Wage Gap in Geneseo?
Income or Wage Gap in Geneseo is 23.5%.
Women in Geneseo earn 76.5 cents for every dollar earned by a man.
What is Inequality or Gini Index in Geneseo?
Inequality or Gini Index in Geneseo is 0.40.
What is the Total Population of Geneseo?
Total Population of Geneseo is 6,421.
What is the Total Male Population of Geneseo?
Total Male Population of Geneseo is 3,003.
What is the Total Female Population of Geneseo?
Total Female Population of Geneseo is 3,418.
What is the Ratio of Males per 100 Females in Geneseo?
There are 87.86 Males per 100 Females in Geneseo.
What is the Ratio of Females per 100 Males in Geneseo?
There are 113.82 Females per 100 Males in Geneseo.
What is the Median Population Age in Geneseo?
Median Population Age in Geneseo is 46.5 Years.
What is the Average Family Size in Geneseo
Average Family Size in Geneseo is 2.8 People.
What is the Average Household Size in Geneseo
Average Household Size in Geneseo is 2.1 People.
How Large is the Labor Force in Geneseo?
There are 3,114 People in the Labor Forcein in Geneseo.
What is the Percentage of People in the Labor Force in Geneseo?
61.6% of People are in the Labor Force in Geneseo.
What is the Unemployment Rate in Geneseo?
Unemployment Rate in Geneseo is 5.1%.