Millstadt, IL Map & Demographics
Millstadt Map
Millstadt Overview
$51,362
PER CAPITA INCOME
$116,392
AVG FAMILY INCOME
$97,031
AVG HOUSEHOLD INCOME
0.8%
WAGE / INCOME GAP [ % ]
99.2¢/ $1
WAGE / INCOME GAP [ $ ]
0.41
INEQUALITY / GINI INDEX
4,035
TOTAL POPULATION
1,892
MALE POPULATION
2,143
FEMALE POPULATION
88.29
MALES / 100 FEMALES
113.27
FEMALES / 100 MALES
44.4
MEDIAN AGE
3.0
AVG FAMILY SIZE
2.5
AVG HOUSEHOLD SIZE
2,457
LABOR FORCE [ PEOPLE ]
69.8%
PERCENT IN LABOR FORCE
4.5%
UNEMPLOYMENT RATE
Millstadt Zip Codes
Millstadt Area Codes
Income in Millstadt
Income Overview in Millstadt
Per Capita Income in Millstadt is $51,362, while median incomes of families and households are $116,392 and $97,031 respectively.
| Characteristic | Number | Measure |
| Per Capita Income | 4,035 | $51,362 |
| Median Family Income | 1,151 | $116,392 |
| Mean Family Income | 1,151 | $135,293 |
| Median Household Income | 1,595 | $97,031 |
| Mean Household Income | 1,595 | $124,122 |
| Income Deficit | 1,151 | $0 |
| Wage / Income Gap (%) | 4,035 | 0.79% |
| Wage / Income Gap ($) | 4,035 | 99.21¢ per $1 |
| Gini / Inequality Index | 4,035 | 0.41 |
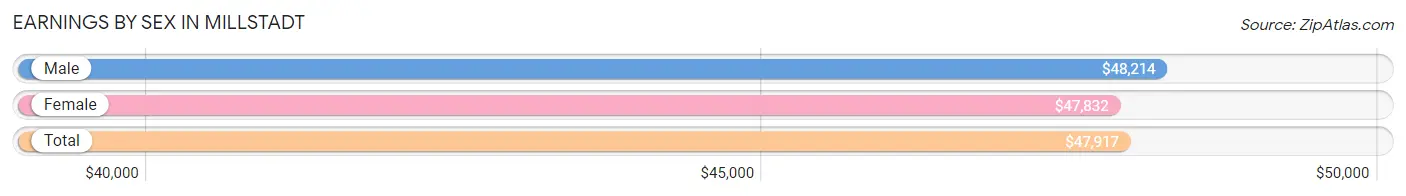
Earnings by Sex in Millstadt
Average Earnings in Millstadt are $47,917, $48,214 for men and $47,832 for women, a difference of 0.8%.
| Sex | Number | Average Earnings |
| Male | 1,396 (55.9%) | $48,214 |
| Female | 1,103 (44.1%) | $47,832 |
| Total | 2,499 (100.0%) | $47,917 |
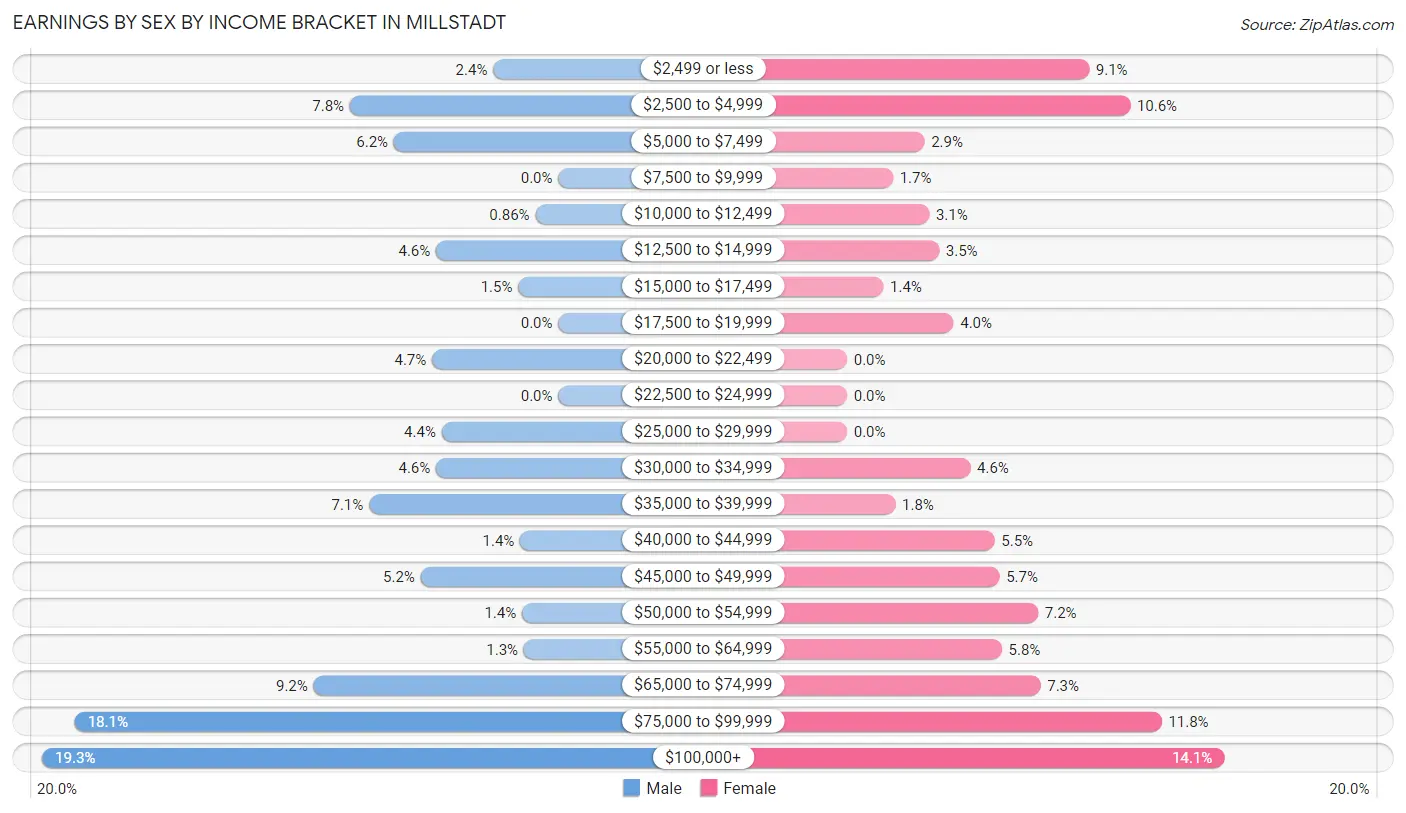
Earnings by Sex by Income Bracket in Millstadt
The most common earnings brackets in Millstadt are $100,000+ for men (270 | 19.3%) and $100,000+ for women (156 | 14.1%).
| Income | Male | Female |
| $2,499 or less | 34 (2.4%) | 100 (9.1%) |
| $2,500 to $4,999 | 109 (7.8%) | 117 (10.6%) |
| $5,000 to $7,499 | 86 (6.2%) | 32 (2.9%) |
| $7,500 to $9,999 | 0 (0.0%) | 19 (1.7%) |
| $10,000 to $12,499 | 12 (0.9%) | 34 (3.1%) |
| $12,500 to $14,999 | 64 (4.6%) | 38 (3.5%) |
| $15,000 to $17,499 | 21 (1.5%) | 15 (1.4%) |
| $17,500 to $19,999 | 0 (0.0%) | 44 (4.0%) |
| $20,000 to $22,499 | 66 (4.7%) | 0 (0.0%) |
| $22,500 to $24,999 | 0 (0.0%) | 0 (0.0%) |
| $25,000 to $29,999 | 61 (4.4%) | 0 (0.0%) |
| $30,000 to $34,999 | 64 (4.6%) | 51 (4.6%) |
| $35,000 to $39,999 | 99 (7.1%) | 20 (1.8%) |
| $40,000 to $44,999 | 20 (1.4%) | 61 (5.5%) |
| $45,000 to $49,999 | 72 (5.2%) | 63 (5.7%) |
| $50,000 to $54,999 | 19 (1.4%) | 79 (7.2%) |
| $55,000 to $64,999 | 18 (1.3%) | 64 (5.8%) |
| $65,000 to $74,999 | 128 (9.2%) | 80 (7.2%) |
| $75,000 to $99,999 | 253 (18.1%) | 130 (11.8%) |
| $100,000+ | 270 (19.3%) | 156 (14.1%) |
| Total | 1,396 (100.0%) | 1,103 (100.0%) |
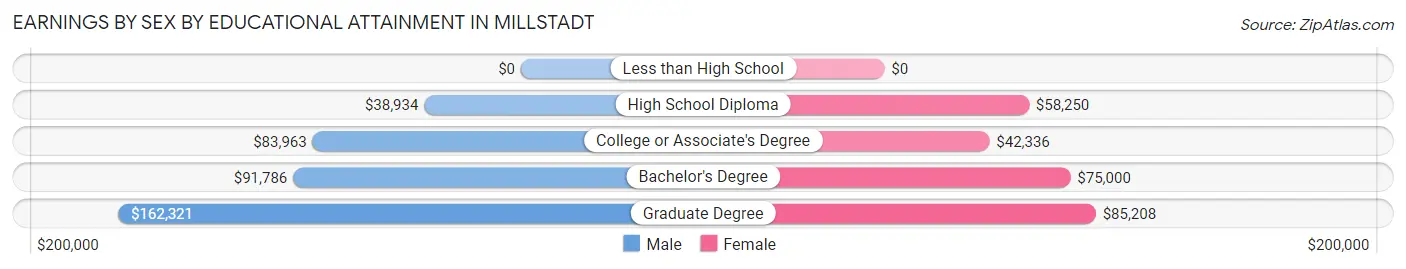
Earnings by Sex by Educational Attainment in Millstadt
Average earnings in Millstadt are $79,097 for men and $52,258 for women, a difference of 33.9%. Men with an educational attainment of graduate degree enjoy the highest average annual earnings of $162,321, while those with high school diploma education earn the least with $38,934. Women with an educational attainment of graduate degree earn the most with the average annual earnings of $85,208, while those with college or associate's degree education have the smallest earnings of $42,336.
| Educational Attainment | Male Income | Female Income |
| Less than High School | - | - |
| High School Diploma | $38,934 | $58,250 |
| College or Associate's Degree | $83,963 | $42,336 |
| Bachelor's Degree | $91,786 | $75,000 |
| Graduate Degree | $162,321 | $85,208 |
| Total | $79,097 | $52,258 |
Family Income in Millstadt
Family Income Brackets in Millstadt
According to the Millstadt family income data, there are 296 families falling into the $75,000 to $99,999 income range, which is the most common income bracket and makes up 25.7% of all families.
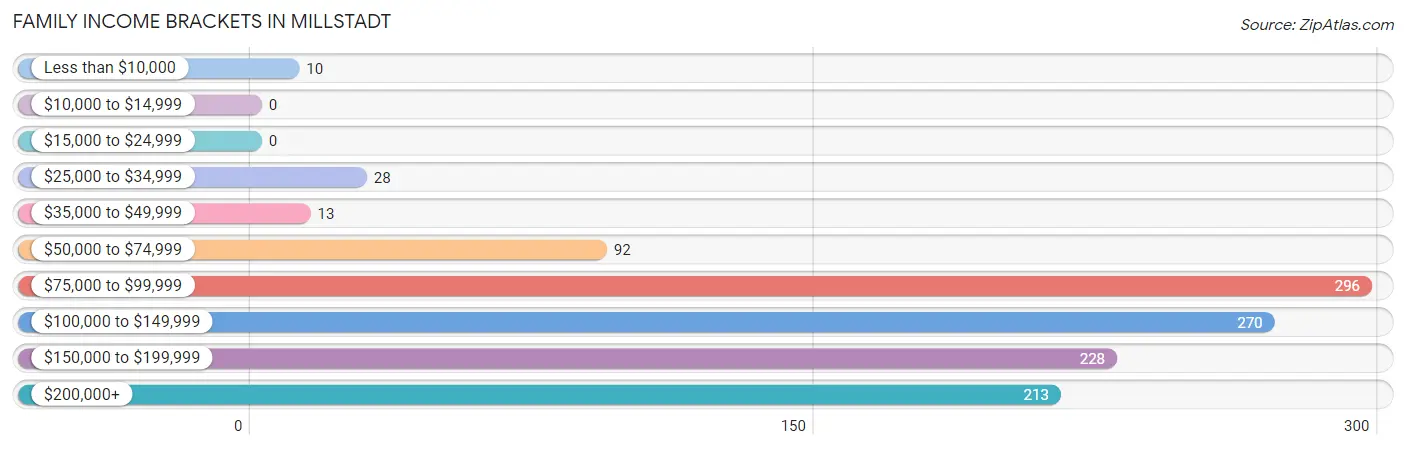
| Income Bracket | # Families | % Families |
| Less than $10,000 | 10 | 0.9% |
| $10,000 to $14,999 | 0 | 0.0% |
| $15,000 to $24,999 | 0 | 0.0% |
| $25,000 to $34,999 | 28 | 2.4% |
| $35,000 to $49,999 | 13 | 1.1% |
| $50,000 to $74,999 | 92 | 8.0% |
| $75,000 to $99,999 | 296 | 25.7% |
| $100,000 to $149,999 | 270 | 23.5% |
| $150,000 to $199,999 | 228 | 19.8% |
| $200,000+ | 213 | 18.5% |
Family Income by Famaliy Size in Millstadt
5-person families (82 | 7.1%) account for the highest median family income in Millstadt with $179,485 per family, while 2-person families (563 | 48.9%) have the highest median income of $54,118 per family member.
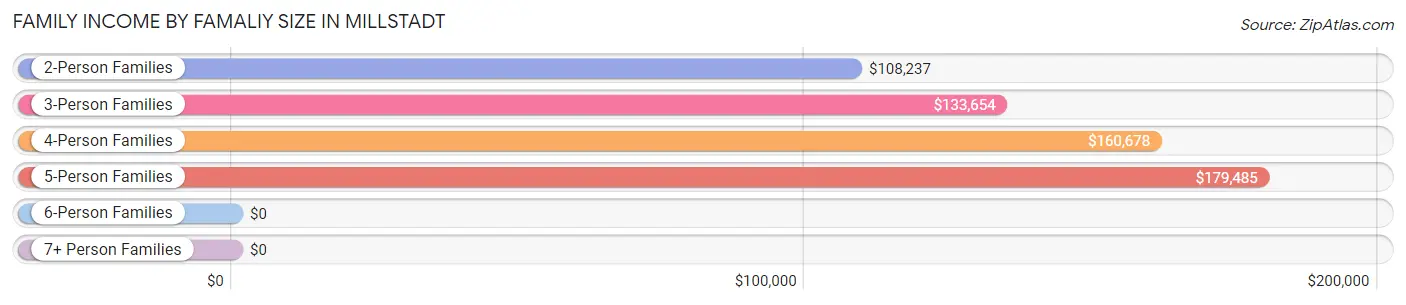
| Income Bracket | # Families | Median Income |
| 2-Person Families | 563 (48.9%) | $108,237 |
| 3-Person Families | 120 (10.4%) | $133,654 |
| 4-Person Families | 375 (32.6%) | $160,678 |
| 5-Person Families | 82 (7.1%) | $179,485 |
| 6-Person Families | 11 (1.0%) | $0 |
| 7+ Person Families | 0 (0.0%) | $0 |
| Total | 1,151 (100.0%) | $116,392 |
Family Income by Number of Earners in Millstadt
The median family income in Millstadt is $116,392, with families comprising 3+ earners (328) having the highest median family income of $161,024, while families with no earners (167) have the lowest median family income of $84,875, accounting for 28.5% and 14.5% of families, respectively.
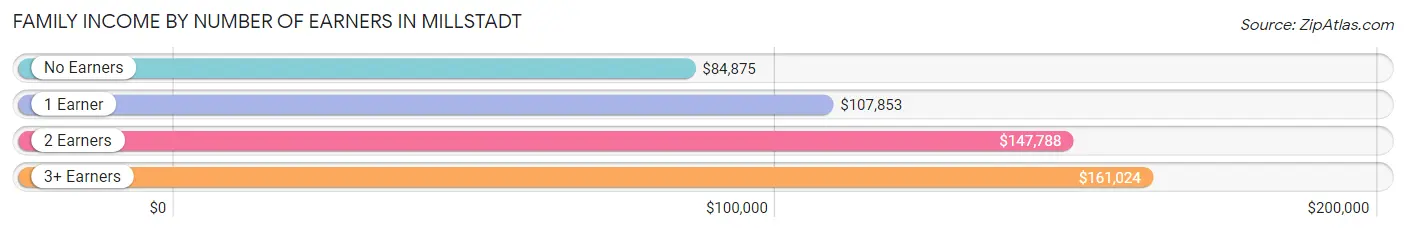
| Number of Earners | # Families | Median Income |
| No Earners | 167 (14.5%) | $84,875 |
| 1 Earner | 225 (19.6%) | $107,853 |
| 2 Earners | 431 (37.4%) | $147,788 |
| 3+ Earners | 328 (28.5%) | $161,024 |
| Total | 1,151 (100.0%) | $116,392 |
Household Income in Millstadt
Household Income Brackets in Millstadt
With 313 households falling in the category, the $100,000 to $149,999 income range is the most frequent in Millstadt, accounting for 19.6% of all households. In contrast, only 18 households (1.1%) fall into the $10,000 to $14,999 income bracket, making it the least populous group.
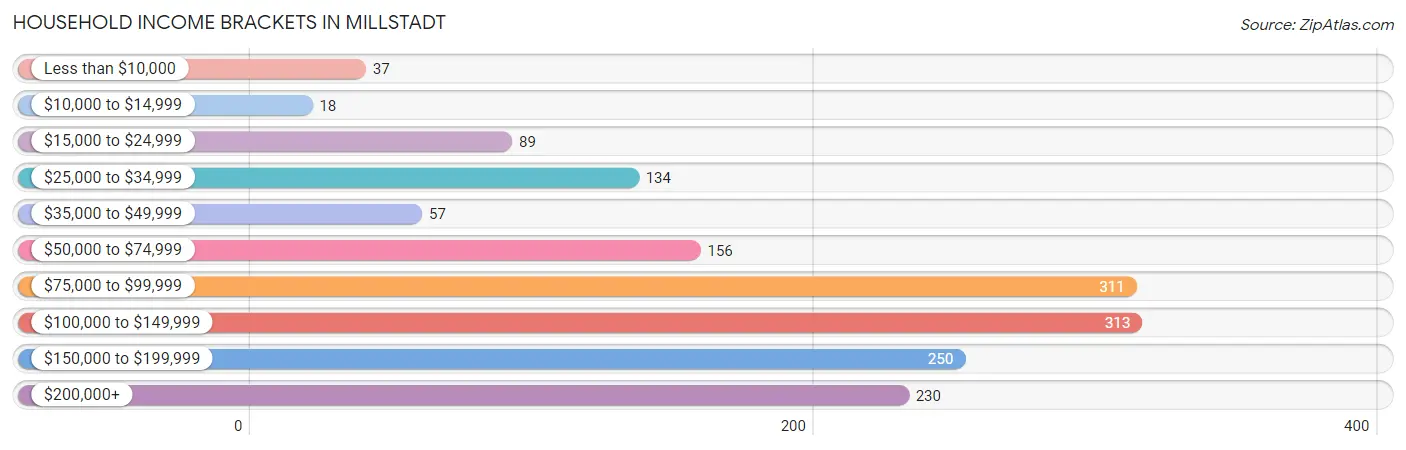
| Income Bracket | # Households | % Households |
| Less than $10,000 | 37 | 2.3% |
| $10,000 to $14,999 | 18 | 1.1% |
| $15,000 to $24,999 | 89 | 5.6% |
| $25,000 to $34,999 | 134 | 8.4% |
| $35,000 to $49,999 | 57 | 3.6% |
| $50,000 to $74,999 | 156 | 9.8% |
| $75,000 to $99,999 | 311 | 19.5% |
| $100,000 to $149,999 | 313 | 19.6% |
| $150,000 to $199,999 | 250 | 15.7% |
| $200,000+ | 230 | 14.4% |
Household Income by Householder Age in Millstadt
The median household income in Millstadt is $97,031, with the highest median household income of $120,417 found in the 45 to 64 years age bracket for the primary householder. A total of 716 households (44.9%) fall into this category.
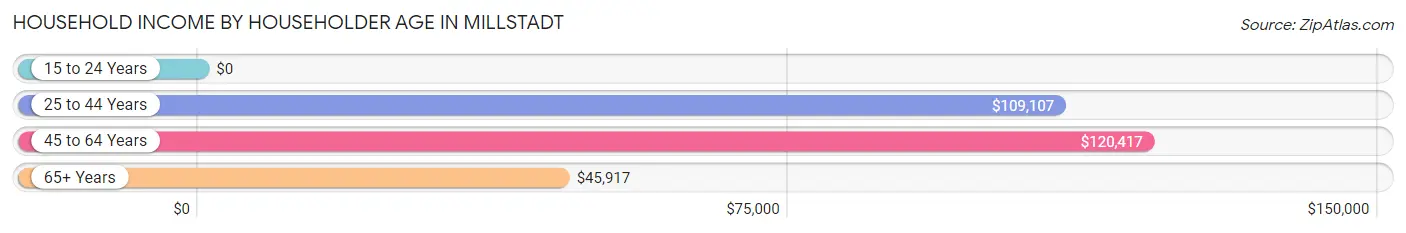
| Income Bracket | # Households | Median Income |
| 15 to 24 Years | 0 (0.0%) | $0 |
| 25 to 44 Years | 390 (24.4%) | $109,107 |
| 45 to 64 Years | 716 (44.9%) | $120,417 |
| 65+ Years | 489 (30.7%) | $45,917 |
| Total | 1,595 (100.0%) | $97,031 |
Poverty in Millstadt
Income Below Poverty by Sex and Age in Millstadt
With 2.0% poverty level for males and 3.2% for females among the residents of Millstadt, 75 year old and over males and under 5 year old females are the most vulnerable to poverty, with 9 males (11.7%) and 11 females (12.9%) in their respective age groups living below the poverty level.
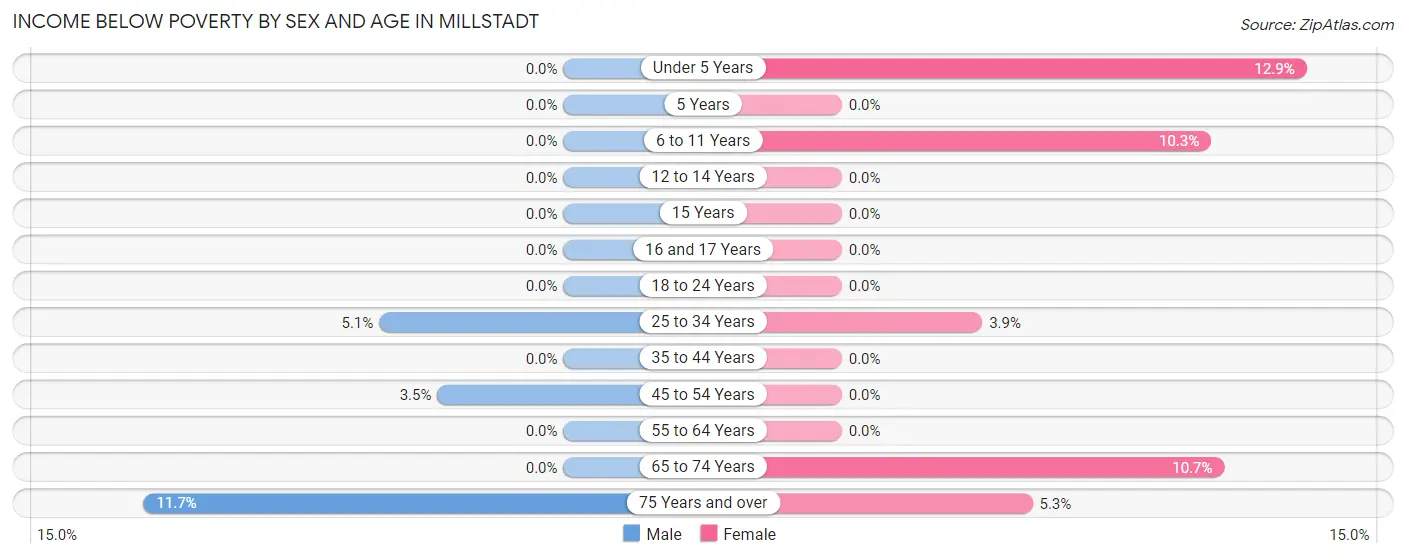
| Age Bracket | Male | Female |
| Under 5 Years | 0 (0.0%) | 11 (12.9%) |
| 5 Years | 0 (0.0%) | 0 (0.0%) |
| 6 to 11 Years | 0 (0.0%) | 11 (10.3%) |
| 12 to 14 Years | 0 (0.0%) | 0 (0.0%) |
| 15 Years | 0 (0.0%) | 0 (0.0%) |
| 16 and 17 Years | 0 (0.0%) | 0 (0.0%) |
| 18 to 24 Years | 0 (0.0%) | 0 (0.0%) |
| 25 to 34 Years | 12 (5.1%) | 10 (3.9%) |
| 35 to 44 Years | 0 (0.0%) | 0 (0.0%) |
| 45 to 54 Years | 16 (3.5%) | 0 (0.0%) |
| 55 to 64 Years | 0 (0.0%) | 0 (0.0%) |
| 65 to 74 Years | 0 (0.0%) | 23 (10.6%) |
| 75 Years and over | 9 (11.7%) | 13 (5.3%) |
| Total | 37 (2.0%) | 68 (3.2%) |
Income Above Poverty by Sex and Age in Millstadt
According to the poverty statistics in Millstadt, males aged under 5 years and females aged 12 to 14 years are the age groups that are most secure financially, with 100.0% of males and 100.0% of females in these age groups living above the poverty line.
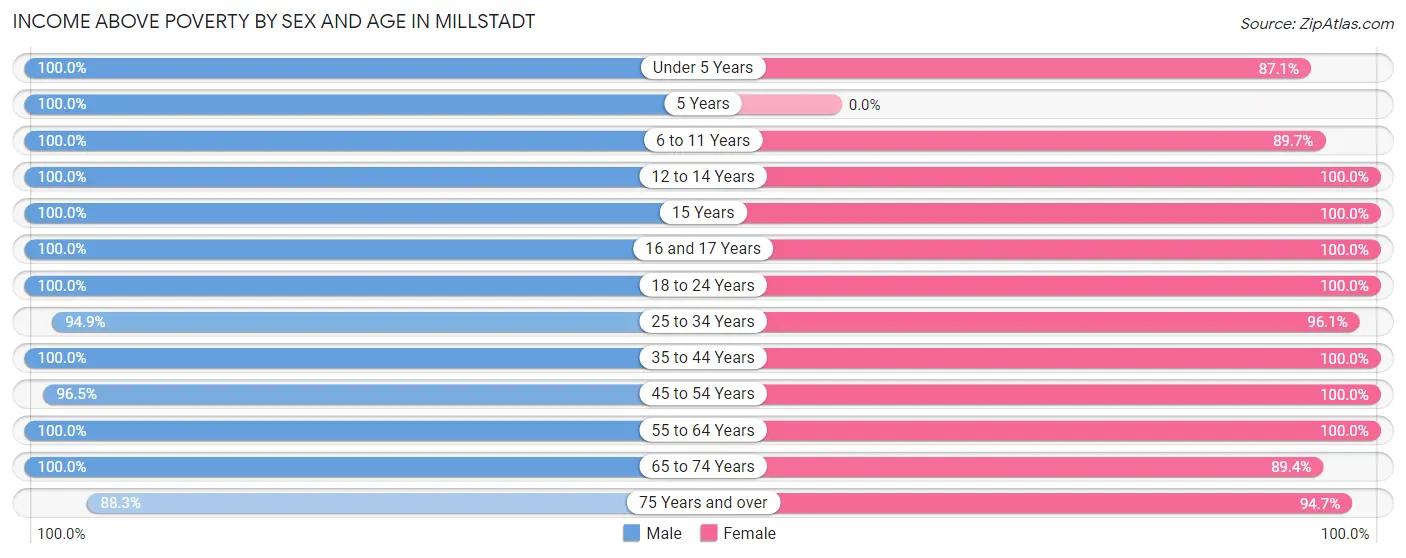
| Age Bracket | Male | Female |
| Under 5 Years | 59 (100.0%) | 74 (87.1%) |
| 5 Years | 12 (100.0%) | 0 (0.0%) |
| 6 to 11 Years | 87 (100.0%) | 96 (89.7%) |
| 12 to 14 Years | 44 (100.0%) | 32 (100.0%) |
| 15 Years | 20 (100.0%) | 69 (100.0%) |
| 16 and 17 Years | 173 (100.0%) | 122 (100.0%) |
| 18 to 24 Years | 200 (100.0%) | 93 (100.0%) |
| 25 to 34 Years | 222 (94.9%) | 246 (96.1%) |
| 35 to 44 Years | 138 (100.0%) | 296 (100.0%) |
| 45 to 54 Years | 440 (96.5%) | 326 (100.0%) |
| 55 to 64 Years | 246 (100.0%) | 296 (100.0%) |
| 65 to 74 Years | 146 (100.0%) | 193 (89.3%) |
| 75 Years and over | 68 (88.3%) | 232 (94.7%) |
| Total | 1,855 (98.0%) | 2,075 (96.8%) |
Income Below Poverty Among Married-Couple Families in Millstadt
The poverty statistics for married-couple families in Millstadt show that 2.2% or 22 of the total 985 families live below the poverty line. Families with 1 or 2 children have the highest poverty rate of 2.6%, comprising of 12 families. On the other hand, families with 3 or 4 children have the lowest poverty rate of 0.0%, which includes 0 families.
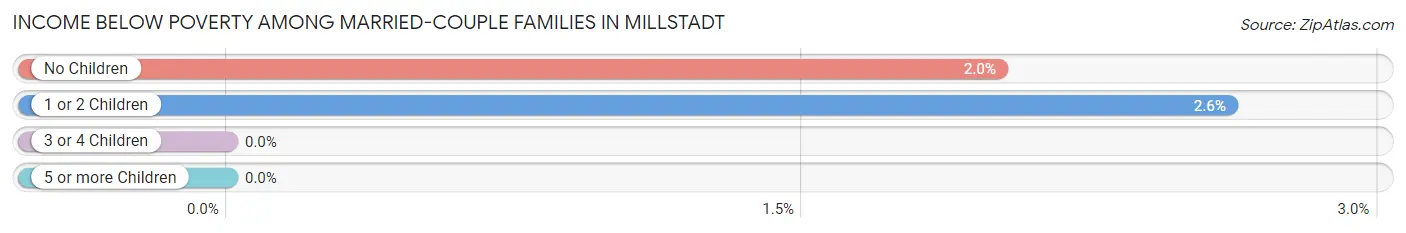
| Children | Above Poverty | Below Poverty |
| No Children | 488 (98.0%) | 10 (2.0%) |
| 1 or 2 Children | 447 (97.4%) | 12 (2.6%) |
| 3 or 4 Children | 28 (100.0%) | 0 (0.0%) |
| 5 or more Children | 0 (0.0%) | 0 (0.0%) |
| Total | 963 (97.8%) | 22 (2.2%) |
Income Below Poverty Among Single-Parent Households in Millstadt
| Children | Single Father | Single Mother |
| No Children | 0 (0.0%) | 0 (0.0%) |
| 1 or 2 Children | 0 (0.0%) | 0 (0.0%) |
| 3 or 4 Children | 0 (0.0%) | 0 (0.0%) |
| 5 or more Children | 0 (0.0%) | 0 (0.0%) |
| Total | 0 (0.0%) | 0 (0.0%) |
Income Below Poverty Among Married-Couple vs Single-Parent Households in Millstadt
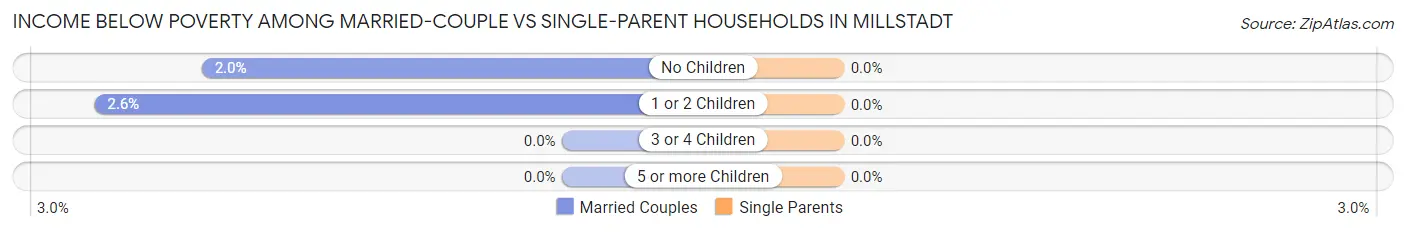
| Children | Married-Couple Families | Single-Parent Households |
| No Children | 10 (2.0%) | 0 (0.0%) |
| 1 or 2 Children | 12 (2.6%) | 0 (0.0%) |
| 3 or 4 Children | 0 (0.0%) | 0 (0.0%) |
| 5 or more Children | 0 (0.0%) | 0 (0.0%) |
| Total | 22 (2.2%) | 0 (0.0%) |
Race in Millstadt
The most populous races in Millstadt are White / Caucasian (3,869 | 95.9%), Native / Alaskan (66 | 1.6%), and Two or more Races (63 | 1.6%).
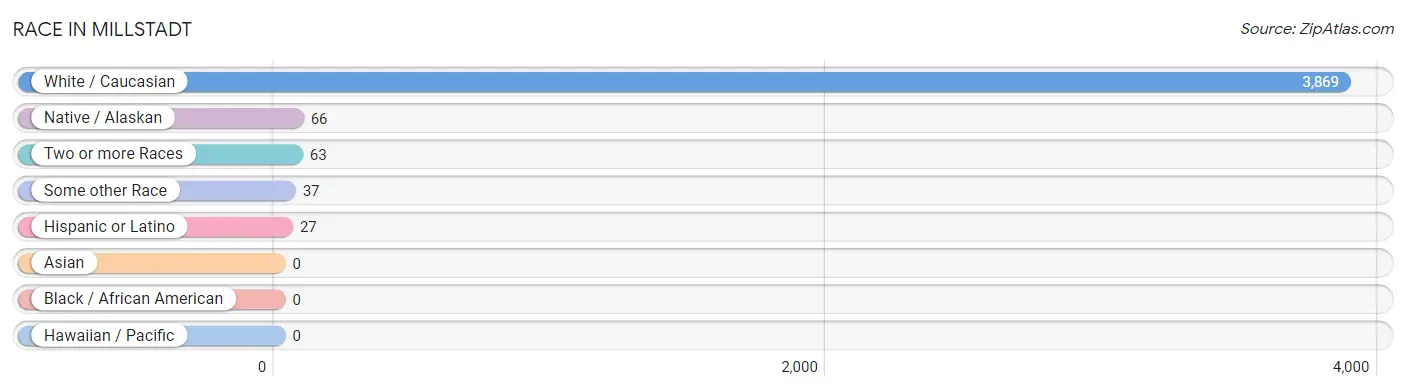
| Race | # Population | % Population |
| Asian | 0 | 0.0% |
| Black / African American | 0 | 0.0% |
| Hawaiian / Pacific | 0 | 0.0% |
| Hispanic or Latino | 27 | 0.7% |
| Native / Alaskan | 66 | 1.6% |
| White / Caucasian | 3,869 | 95.9% |
| Two or more Races | 63 | 1.6% |
| Some other Race | 37 | 0.9% |
| Total | 4,035 | 100.0% |
Ancestry in Millstadt
The most populous ancestries reported in Millstadt are German (1,670 | 41.4%), Irish (553 | 13.7%), Italian (410 | 10.2%), English (287 | 7.1%), and American (209 | 5.2%), together accounting for 77.5% of all Millstadt residents.
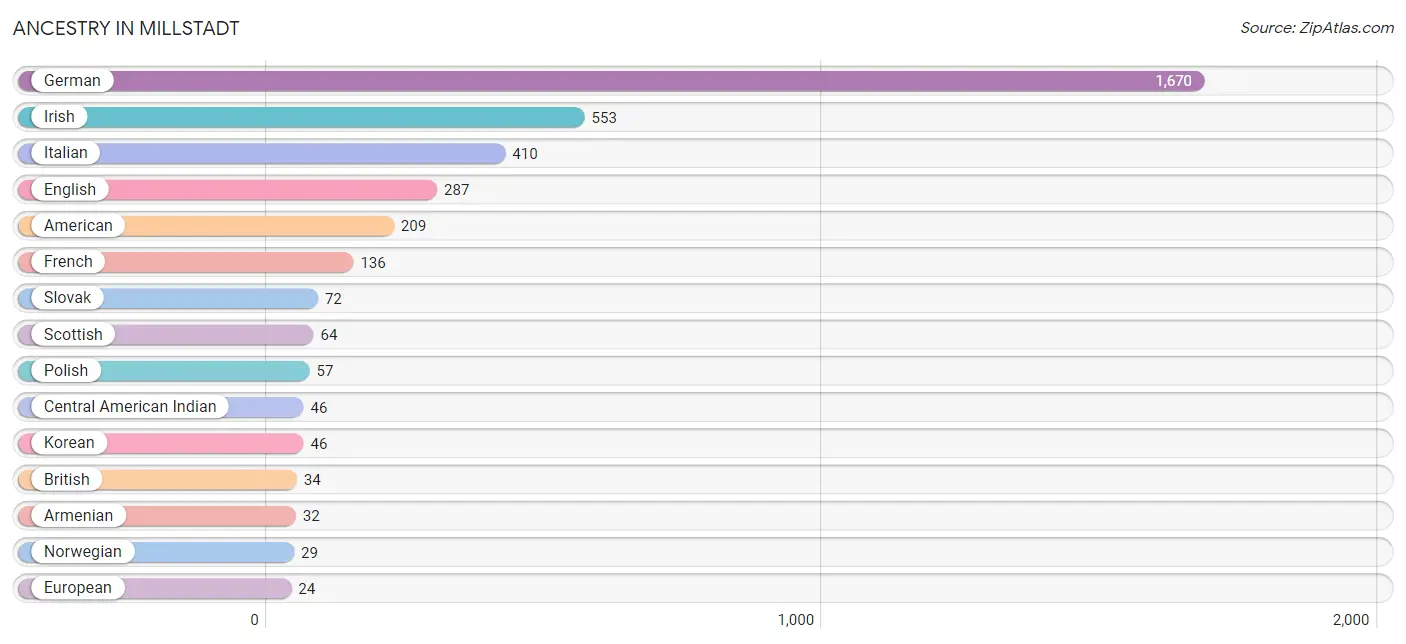
| Ancestry | # Population | % Population |
| American | 209 | 5.2% |
| Armenian | 32 | 0.8% |
| British | 34 | 0.8% |
| Central American | 17 | 0.4% |
| Central American Indian | 46 | 1.1% |
| English | 287 | 7.1% |
| European | 24 | 0.6% |
| French | 136 | 3.4% |
| German | 1,670 | 41.4% |
| Guatemalan | 17 | 0.4% |
| Irish | 553 | 13.7% |
| Italian | 410 | 10.2% |
| Korean | 46 | 1.1% |
| Mexican | 10 | 0.3% |
| Northern European | 14 | 0.4% |
| Norwegian | 29 | 0.7% |
| Polish | 57 | 1.4% |
| Romanian | 15 | 0.4% |
| Scotch-Irish | 17 | 0.4% |
| Scottish | 64 | 1.6% |
| Serbian | 15 | 0.4% |
| Slovak | 72 | 1.8% |
| Swedish | 10 | 0.3% |
| Welsh | 23 | 0.6% | View All 24 Rows |
Immigrants in Millstadt
The most numerous immigrant groups reported in Millstadt came from , and Oceania (17 | 0.4%), together accounting for 0.4% of all Millstadt residents.

| Immigration Origin | # Population | % Population |
| Oceania | 17 | 0.4% | View All 1 Rows |
Sex and Age in Millstadt
Sex and Age in Millstadt
The most populous age groups in Millstadt are 15 to 19 Years (367 | 19.4%) for men and 15 to 19 Years (252 | 11.8%) for women.
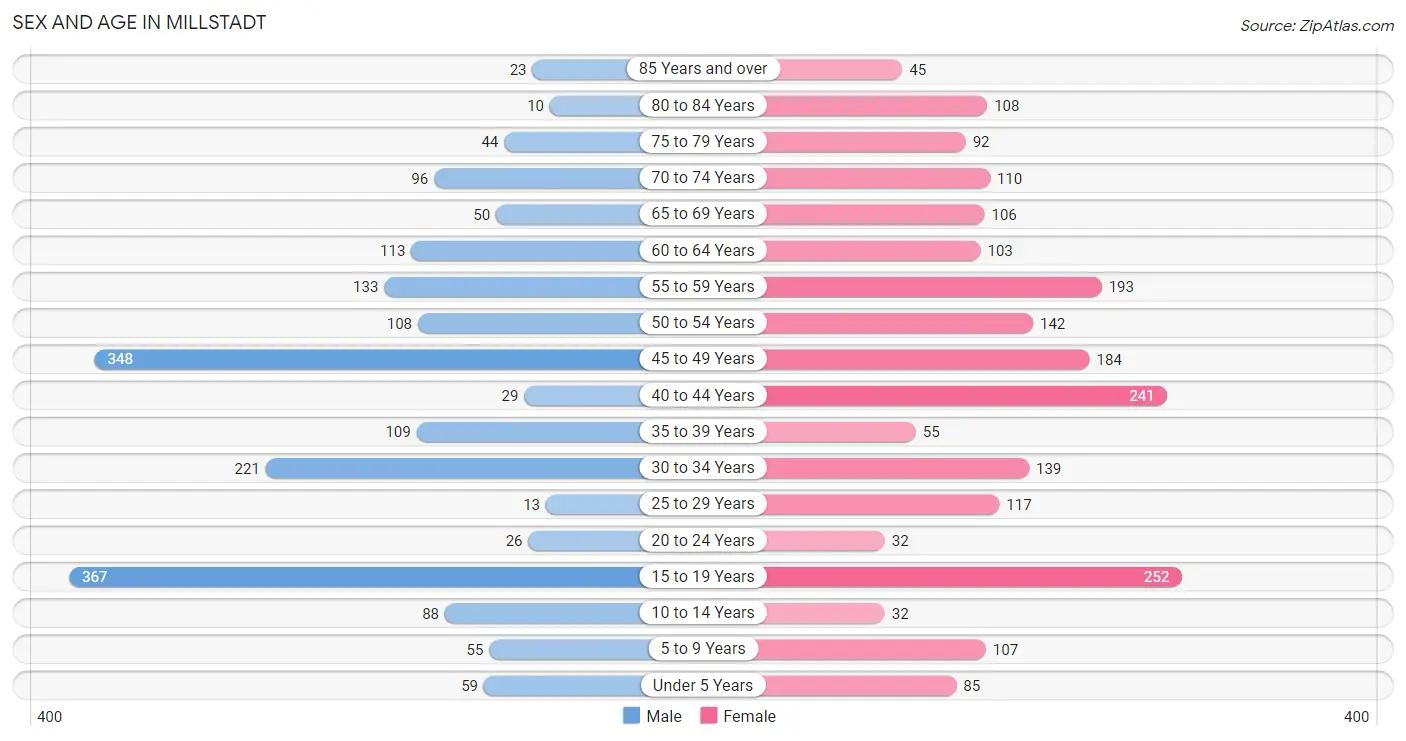
| Age Bracket | Male | Female |
| Under 5 Years | 59 (3.1%) | 85 (4.0%) |
| 5 to 9 Years | 55 (2.9%) | 107 (5.0%) |
| 10 to 14 Years | 88 (4.6%) | 32 (1.5%) |
| 15 to 19 Years | 367 (19.4%) | 252 (11.8%) |
| 20 to 24 Years | 26 (1.4%) | 32 (1.5%) |
| 25 to 29 Years | 13 (0.7%) | 117 (5.5%) |
| 30 to 34 Years | 221 (11.7%) | 139 (6.5%) |
| 35 to 39 Years | 109 (5.8%) | 55 (2.6%) |
| 40 to 44 Years | 29 (1.5%) | 241 (11.3%) |
| 45 to 49 Years | 348 (18.4%) | 184 (8.6%) |
| 50 to 54 Years | 108 (5.7%) | 142 (6.6%) |
| 55 to 59 Years | 133 (7.0%) | 193 (9.0%) |
| 60 to 64 Years | 113 (6.0%) | 103 (4.8%) |
| 65 to 69 Years | 50 (2.6%) | 106 (5.0%) |
| 70 to 74 Years | 96 (5.1%) | 110 (5.1%) |
| 75 to 79 Years | 44 (2.3%) | 92 (4.3%) |
| 80 to 84 Years | 10 (0.5%) | 108 (5.0%) |
| 85 Years and over | 23 (1.2%) | 45 (2.1%) |
| Total | 1,892 (100.0%) | 2,143 (100.0%) |
Families and Households in Millstadt
Median Family Size in Millstadt
The median family size in Millstadt is 3.05 persons per family, with married-couple families (985 | 85.6%) accounting for the largest median family size of 3.14 persons per family. On the other hand, single male/father families (51 | 4.4%) represent the smallest median family size with 1.96 persons per family.
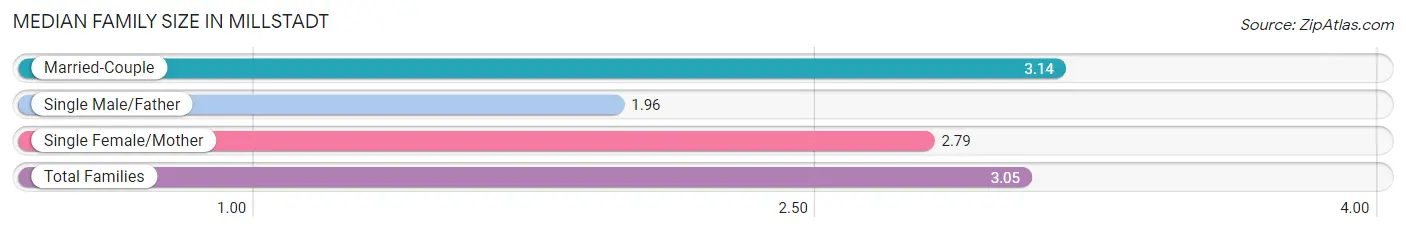
| Family Type | # Families | Family Size |
| Married-Couple | 985 (85.6%) | 3.14 |
| Single Male/Father | 51 (4.4%) | 1.96 |
| Single Female/Mother | 115 (10.0%) | 2.79 |
| Total Families | 1,151 (100.0%) | 3.05 |
Median Household Size in Millstadt
The median household size in Millstadt is 2.53 persons per household, with married-couple households (985 | 61.8%) accounting for the largest median household size of 3.14 persons per household. non-family households (444 | 27.8%) represent the smallest median household size with 1.12 persons per household.
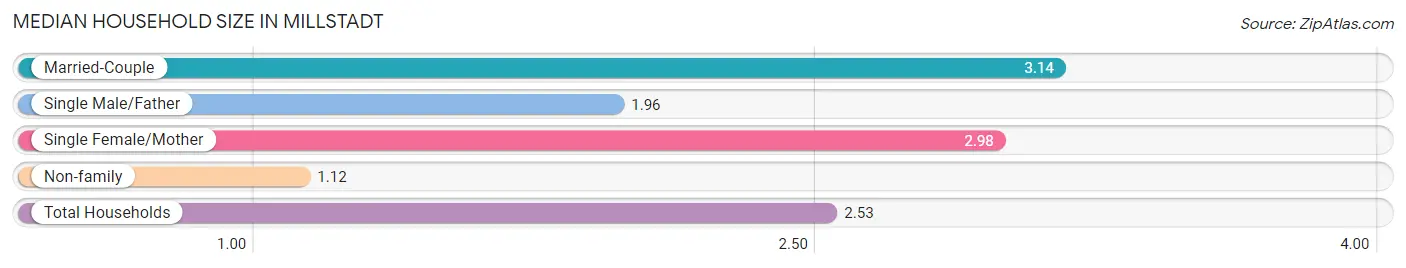
| Household Type | # Households | Household Size |
| Married-Couple | 985 (61.8%) | 3.14 |
| Single Male/Father | 51 (3.2%) | 1.96 |
| Single Female/Mother | 115 (7.2%) | 2.98 |
| Non-family | 444 (27.8%) | 1.12 |
| Total Households | 1,595 (100.0%) | 2.53 |
Household Size by Marriage Status in Millstadt
Out of a total of 1,595 households in Millstadt, 1,151 (72.2%) are family households, while 444 (27.8%) are nonfamily households. The most numerous type of family households are 2-person households, comprising 563, and the most common type of nonfamily households are 1-person households, comprising 393.
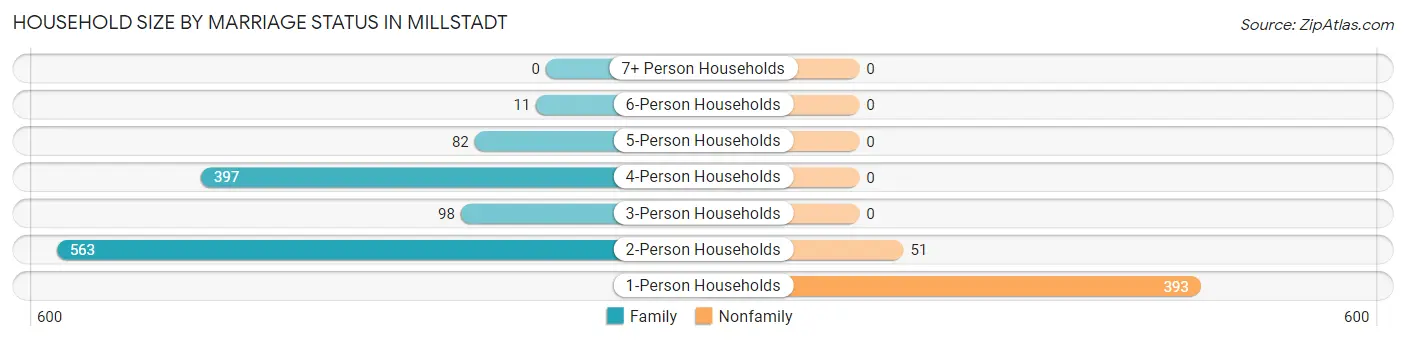
| Household Size | Family Households | Nonfamily Households |
| 1-Person Households | - | 393 (24.6%) |
| 2-Person Households | 563 (35.3%) | 51 (3.2%) |
| 3-Person Households | 98 (6.1%) | 0 (0.0%) |
| 4-Person Households | 397 (24.9%) | 0 (0.0%) |
| 5-Person Households | 82 (5.1%) | 0 (0.0%) |
| 6-Person Households | 11 (0.7%) | 0 (0.0%) |
| 7+ Person Households | 0 (0.0%) | 0 (0.0%) |
| Total | 1,151 (72.2%) | 444 (27.8%) |
Female Fertility in Millstadt
Fertility by Age in Millstadt
Average fertility rate in Millstadt is 32.0 births per 1,000 women. Women in the age bracket of 20 to 34 years have the highest fertility rate with 49.0 births per 1,000 women. Women in the age bracket of 35 to 50 years acount for 57.6% of all women with births.
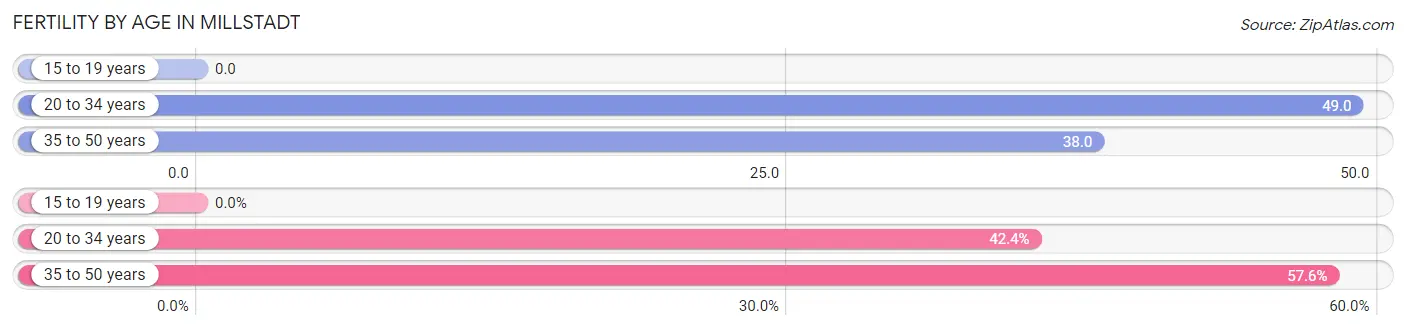
| Age Bracket | Women with Births | Births / 1,000 Women |
| 15 to 19 years | 0 (0.0%) | 0.0 |
| 20 to 34 years | 14 (42.4%) | 49.0 |
| 35 to 50 years | 19 (57.6%) | 38.0 |
| Total | 33 (100.0%) | 32.0 |
Fertility by Age by Marriage Status in Millstadt
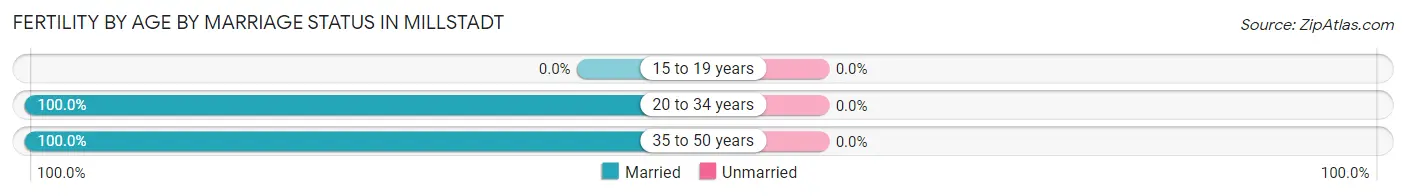
| Age Bracket | Married | Unmarried |
| 15 to 19 years | 0 (0.0%) | 0 (0.0%) |
| 20 to 34 years | 14 (100.0%) | 0 (0.0%) |
| 35 to 50 years | 19 (100.0%) | 0 (0.0%) |
| Total | 33 (100.0%) | 0 (0.0%) |
Fertility by Education in Millstadt
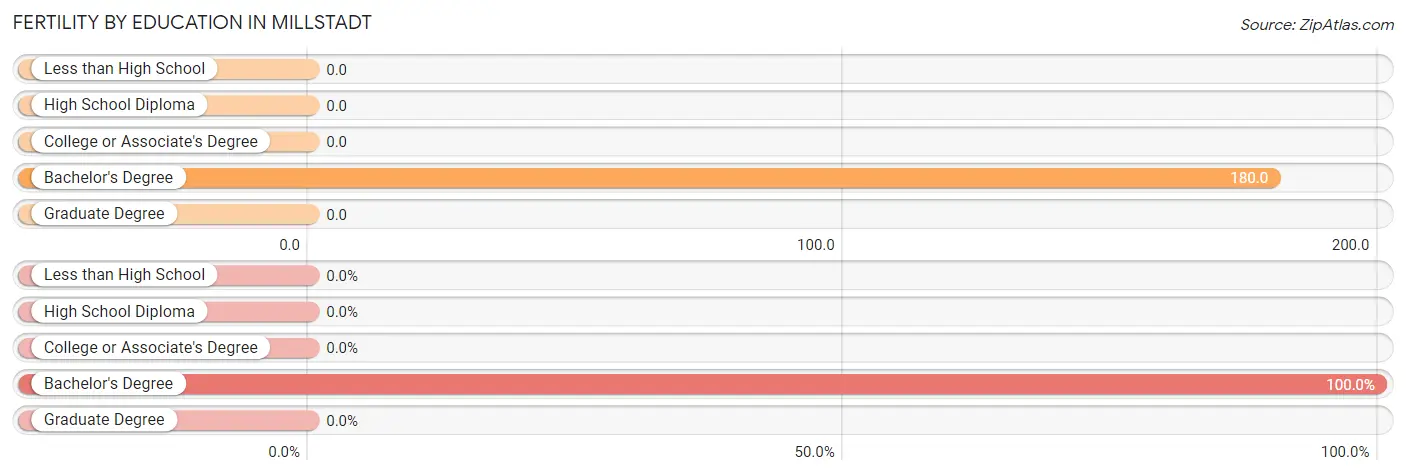
| Educational Attainment | Women with Births | Births / 1,000 Women |
| Less than High School | 0 (0.0%) | 0.0 |
| High School Diploma | 0 (0.0%) | 0.0 |
| College or Associate's Degree | 0 (0.0%) | 0.0 |
| Bachelor's Degree | 33 (100.0%) | 180.0 |
| Graduate Degree | 0 (0.0%) | 0.0 |
| Total | 33 (100.0%) | 32.0 |
Fertility by Education by Marriage Status in Millstadt
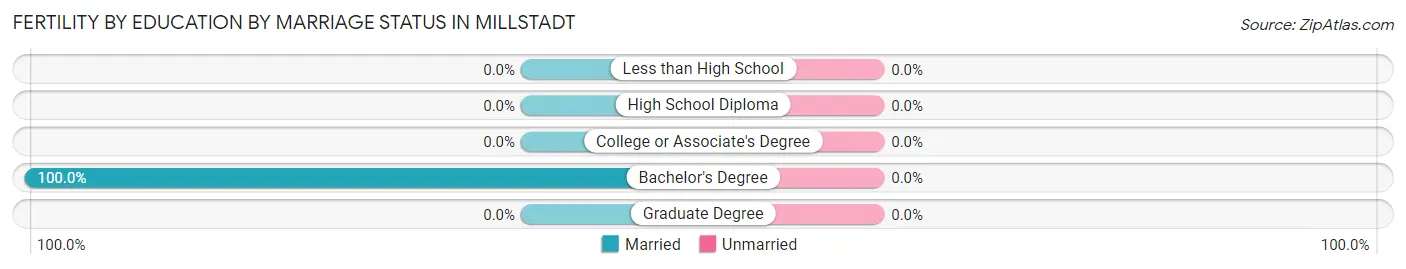
| Educational Attainment | Married | Unmarried |
| Less than High School | 0 (0.0%) | 0 (0.0%) |
| High School Diploma | 0 (0.0%) | 0 (0.0%) |
| College or Associate's Degree | 0 (0.0%) | 0 (0.0%) |
| Bachelor's Degree | 33 (100.0%) | 0 (0.0%) |
| Graduate Degree | 0 (0.0%) | 0 (0.0%) |
| Total | 33 (100.0%) | 0 (0.0%) |
Employment Characteristics in Millstadt
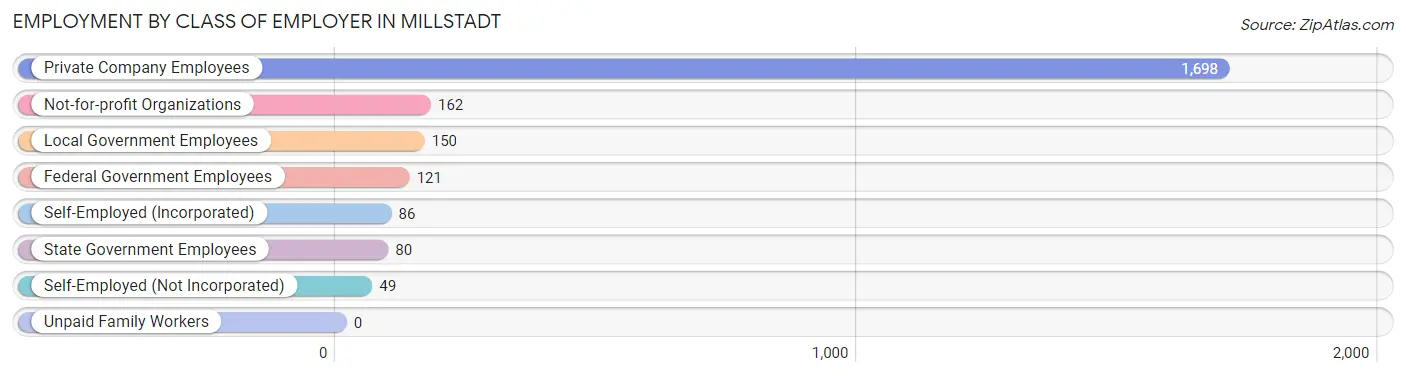
Employment by Class of Employer in Millstadt
Among the 2,346 employed individuals in Millstadt, private company employees (1,698 | 72.4%), not-for-profit organizations (162 | 6.9%), and local government employees (150 | 6.4%) make up the most common classes of employment.
| Employer Class | # Employees | % Employees |
| Private Company Employees | 1,698 | 72.4% |
| Self-Employed (Incorporated) | 86 | 3.7% |
| Self-Employed (Not Incorporated) | 49 | 2.1% |
| Not-for-profit Organizations | 162 | 6.9% |
| Local Government Employees | 150 | 6.4% |
| State Government Employees | 80 | 3.4% |
| Federal Government Employees | 121 | 5.2% |
| Unpaid Family Workers | 0 | 0.0% |
| Total | 2,346 | 100.0% |
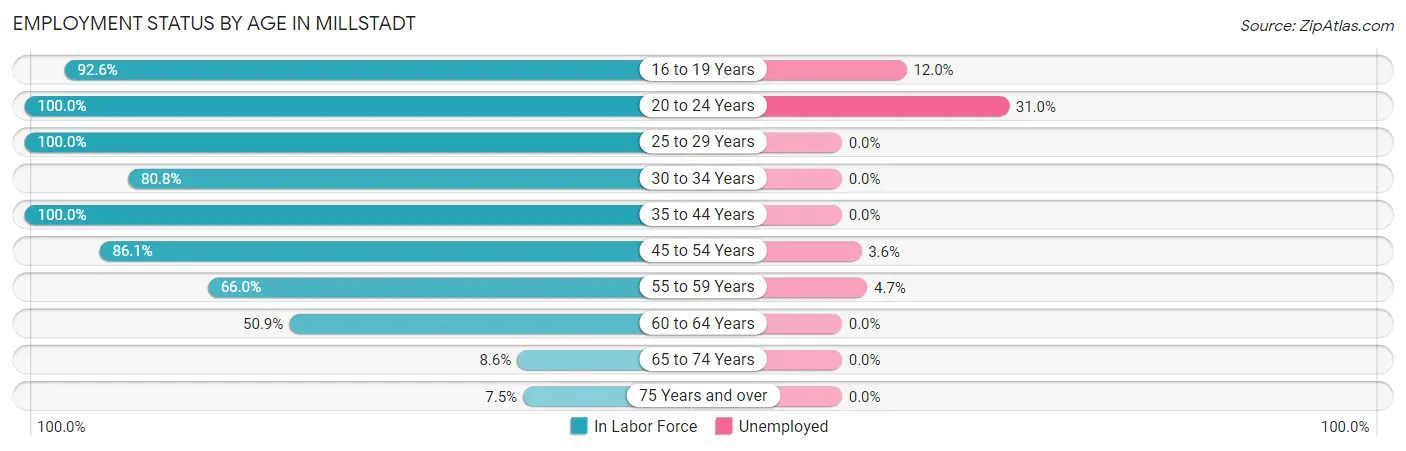
Employment Status by Age in Millstadt
According to the labor force statistics for Millstadt, out of the total population over 16 years of age (3,520), 69.8% or 2,457 individuals are in the labor force, with 4.5% or 111 of them unemployed. The age group with the highest labor force participation rate is 20 to 24 years, with 100.0% or 58 individuals in the labor force. Within the labor force, the 20 to 24 years age range has the highest percentage of unemployed individuals, with 31.0% or 18 of them being unemployed.
| Age Bracket | In Labor Force | Unemployed |
| 16 to 19 Years | 491 (92.6%) | 59 (12.0%) |
| 20 to 24 Years | 58 (100.0%) | 18 (31.0%) |
| 25 to 29 Years | 130 (100.0%) | 0 (0.0%) |
| 30 to 34 Years | 291 (80.8%) | 0 (0.0%) |
| 35 to 44 Years | 434 (100.0%) | 0 (0.0%) |
| 45 to 54 Years | 673 (86.1%) | 24 (3.6%) |
| 55 to 59 Years | 215 (66.0%) | 10 (4.7%) |
| 60 to 64 Years | 110 (50.9%) | 0 (0.0%) |
| 65 to 74 Years | 31 (8.6%) | 0 (0.0%) |
| 75 Years and over | 24 (7.5%) | 0 (0.0%) |
| Total | 2,457 (69.8%) | 111 (4.5%) |
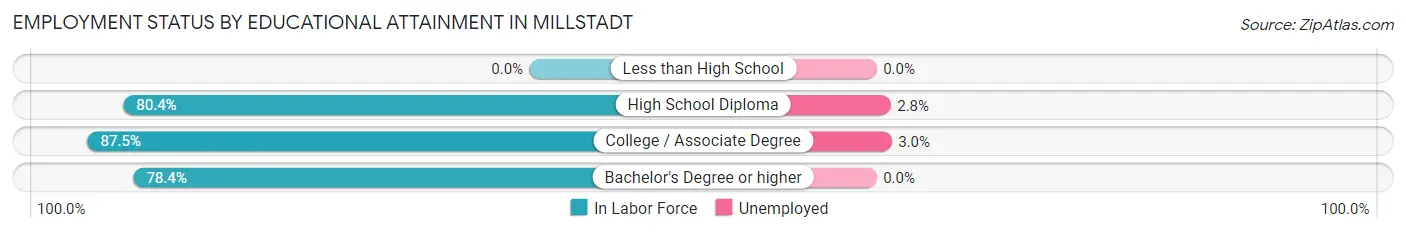
Employment Status by Educational Attainment in Millstadt
According to labor force statistics for Millstadt, 82.4% of individuals (1,852) out of the total population between 25 and 64 years of age (2,248) are in the labor force, with 1.8% or 33 of them being unemployed. The group with the highest labor force participation rate are those with the educational attainment of college / associate degree, with 87.5% or 791 individuals in the labor force. Within the labor force, individuals with college / associate degree education have the highest percentage of unemployment, with 3.0% or 24 of them being unemployed.
| Educational Attainment | In Labor Force | Unemployed |
| Less than High School | 0 (0.0%) | 0 (0.0%) |
| High School Diploma | 356 (80.4%) | 12 (2.8%) |
| College / Associate Degree | 791 (87.5%) | 27 (3.0%) |
| Bachelor's Degree or higher | 706 (78.4%) | 0 (0.0%) |
| Total | 1,852 (82.4%) | 40 (1.8%) |
Employment Occupations by Sex in Millstadt
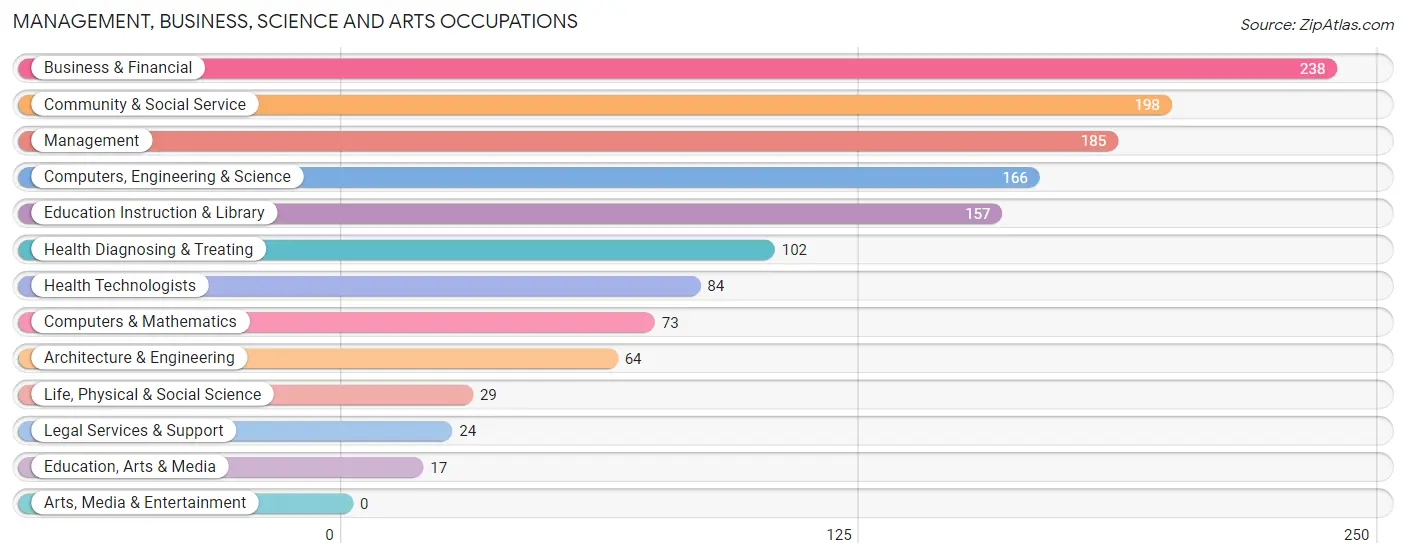
Management, Business, Science and Arts Occupations
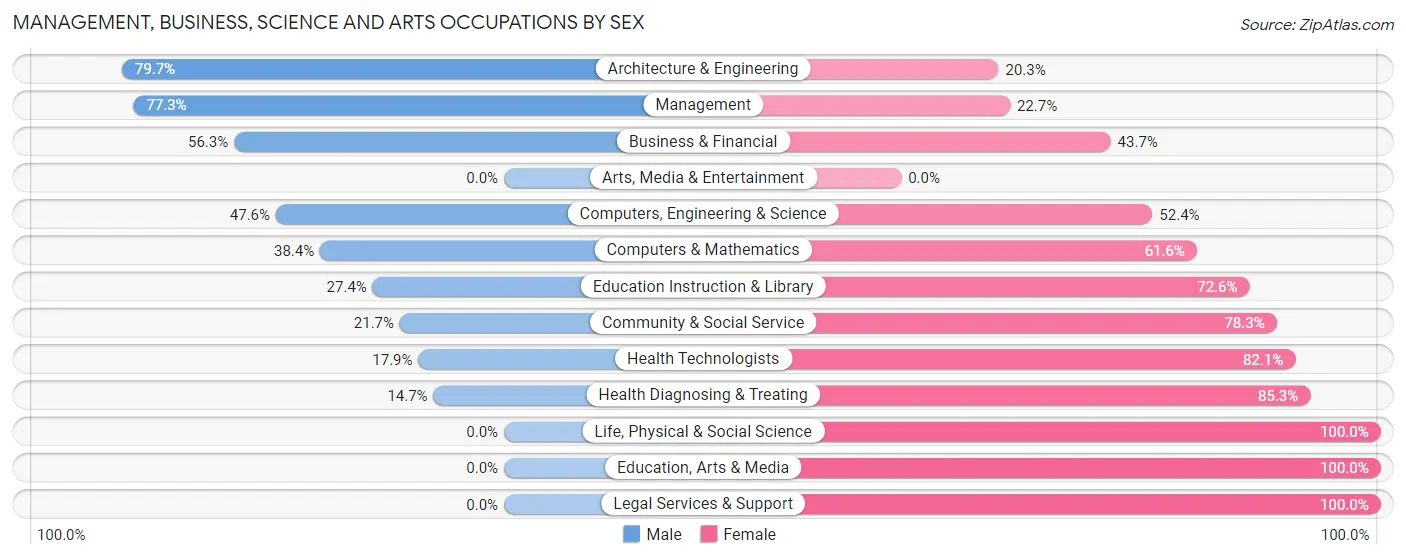
The most common Management, Business, Science and Arts occupations in Millstadt are Business & Financial (238 | 10.1%), Community & Social Service (198 | 8.4%), Management (185 | 7.9%), Computers, Engineering & Science (166 | 7.1%), and Education Instruction & Library (157 | 6.7%).
Management, Business, Science and Arts Occupations by Sex
Within the Management, Business, Science and Arts occupations in Millstadt, the most male-oriented occupations are Architecture & Engineering (79.7%), Management (77.3%), and Business & Financial (56.3%), while the most female-oriented occupations are Life, Physical & Social Science (100.0%), Education, Arts & Media (100.0%), and Legal Services & Support (100.0%).
| Occupation | Male | Female |
| Management | 143 (77.3%) | 42 (22.7%) |
| Business & Financial | 134 (56.3%) | 104 (43.7%) |
| Computers, Engineering & Science | 79 (47.6%) | 87 (52.4%) |
| Computers & Mathematics | 28 (38.4%) | 45 (61.6%) |
| Architecture & Engineering | 51 (79.7%) | 13 (20.3%) |
| Life, Physical & Social Science | 0 (0.0%) | 29 (100.0%) |
| Community & Social Service | 43 (21.7%) | 155 (78.3%) |
| Education, Arts & Media | 0 (0.0%) | 17 (100.0%) |
| Legal Services & Support | 0 (0.0%) | 24 (100.0%) |
| Education Instruction & Library | 43 (27.4%) | 114 (72.6%) |
| Arts, Media & Entertainment | 0 (0.0%) | 0 (0.0%) |
| Health Diagnosing & Treating | 15 (14.7%) | 87 (85.3%) |
| Health Technologists | 15 (17.9%) | 69 (82.1%) |
| Total (Category) | 414 (46.6%) | 475 (53.4%) |
| Total (Overall) | 1,329 (56.7%) | 1,017 (43.3%) |
Services Occupations
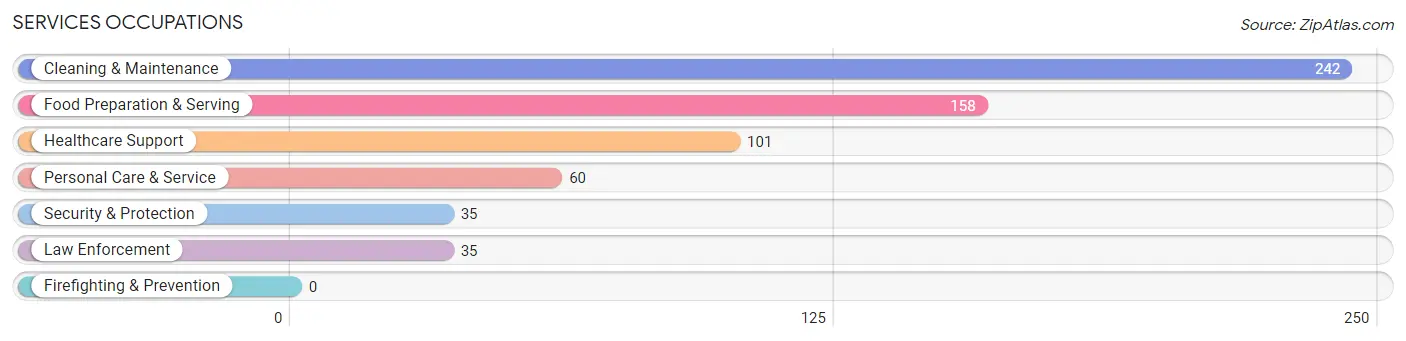
The most common Services occupations in Millstadt are Cleaning & Maintenance (242 | 10.3%), Food Preparation & Serving (158 | 6.7%), Healthcare Support (101 | 4.3%), Personal Care & Service (60 | 2.6%), and Security & Protection (35 | 1.5%).
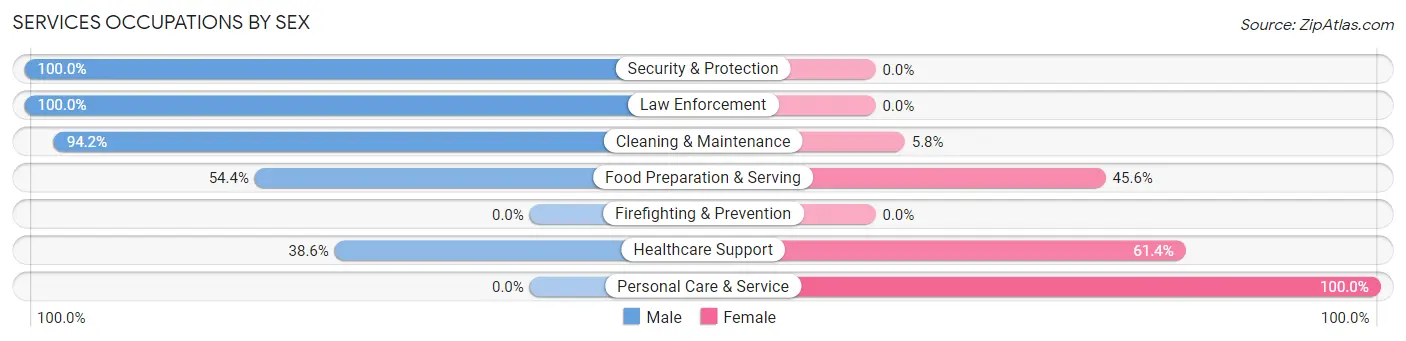
Services Occupations by Sex
Within the Services occupations in Millstadt, the most male-oriented occupations are Security & Protection (100.0%), Law Enforcement (100.0%), and Cleaning & Maintenance (94.2%), while the most female-oriented occupations are Personal Care & Service (100.0%), Healthcare Support (61.4%), and Food Preparation & Serving (45.6%).
| Occupation | Male | Female |
| Healthcare Support | 39 (38.6%) | 62 (61.4%) |
| Security & Protection | 35 (100.0%) | 0 (0.0%) |
| Firefighting & Prevention | 0 (0.0%) | 0 (0.0%) |
| Law Enforcement | 35 (100.0%) | 0 (0.0%) |
| Food Preparation & Serving | 86 (54.4%) | 72 (45.6%) |
| Cleaning & Maintenance | 228 (94.2%) | 14 (5.8%) |
| Personal Care & Service | 0 (0.0%) | 60 (100.0%) |
| Total (Category) | 388 (65.1%) | 208 (34.9%) |
| Total (Overall) | 1,329 (56.7%) | 1,017 (43.3%) |
Sales and Office Occupations
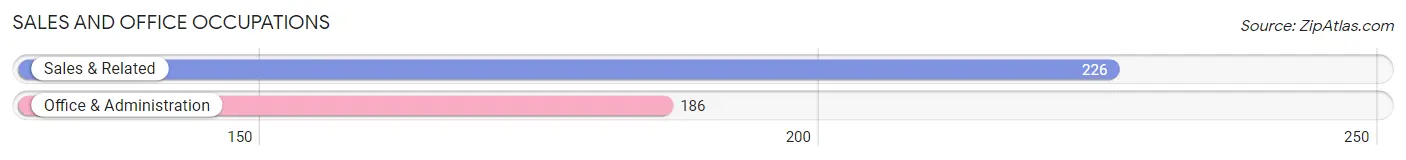
The most common Sales and Office occupations in Millstadt are Sales & Related (226 | 9.6%), and Office & Administration (186 | 7.9%).
Sales and Office Occupations by Sex
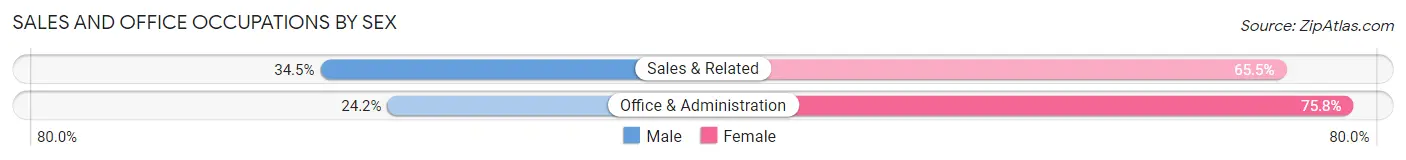
| Occupation | Male | Female |
| Sales & Related | 78 (34.5%) | 148 (65.5%) |
| Office & Administration | 45 (24.2%) | 141 (75.8%) |
| Total (Category) | 123 (29.8%) | 289 (70.2%) |
| Total (Overall) | 1,329 (56.7%) | 1,017 (43.3%) |
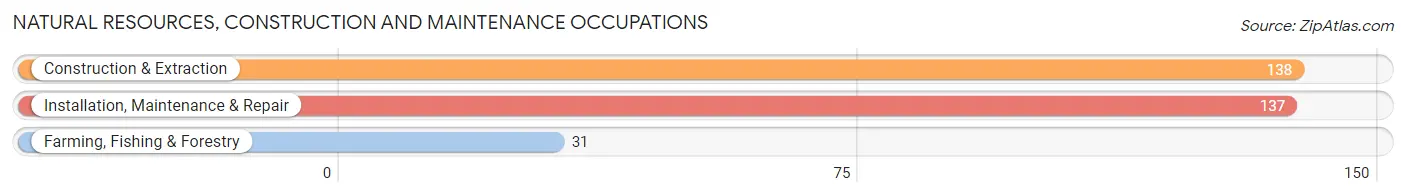
Natural Resources, Construction and Maintenance Occupations
The most common Natural Resources, Construction and Maintenance occupations in Millstadt are Construction & Extraction (138 | 5.9%), Installation, Maintenance & Repair (137 | 5.8%), and Farming, Fishing & Forestry (31 | 1.3%).
Natural Resources, Construction and Maintenance Occupations by Sex
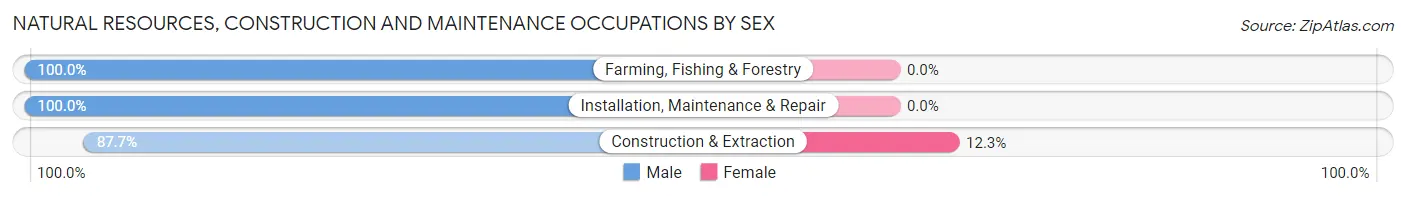
| Occupation | Male | Female |
| Farming, Fishing & Forestry | 31 (100.0%) | 0 (0.0%) |
| Construction & Extraction | 121 (87.7%) | 17 (12.3%) |
| Installation, Maintenance & Repair | 137 (100.0%) | 0 (0.0%) |
| Total (Category) | 289 (94.4%) | 17 (5.6%) |
| Total (Overall) | 1,329 (56.7%) | 1,017 (43.3%) |
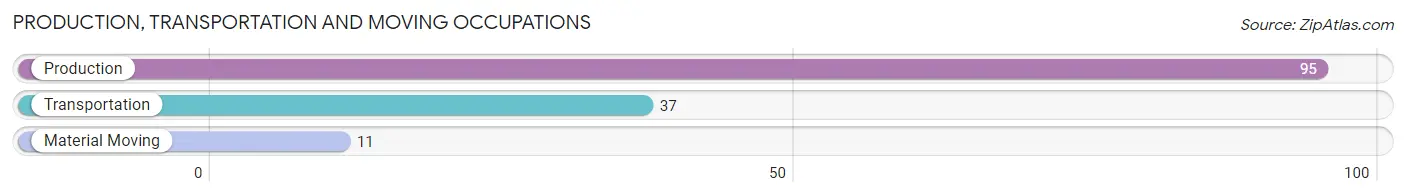
Production, Transportation and Moving Occupations
The most common Production, Transportation and Moving occupations in Millstadt are Production (95 | 4.1%), Transportation (37 | 1.6%), and Material Moving (11 | 0.5%).
Production, Transportation and Moving Occupations by Sex
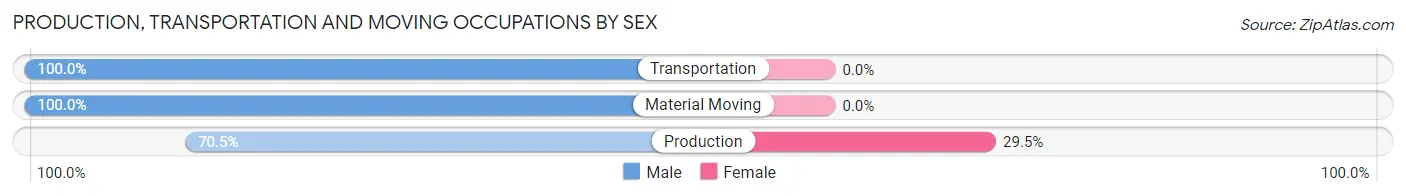
| Occupation | Male | Female |
| Production | 67 (70.5%) | 28 (29.5%) |
| Transportation | 37 (100.0%) | 0 (0.0%) |
| Material Moving | 11 (100.0%) | 0 (0.0%) |
| Total (Category) | 115 (80.4%) | 28 (19.6%) |
| Total (Overall) | 1,329 (56.7%) | 1,017 (43.3%) |
Employment Industries by Sex in Millstadt
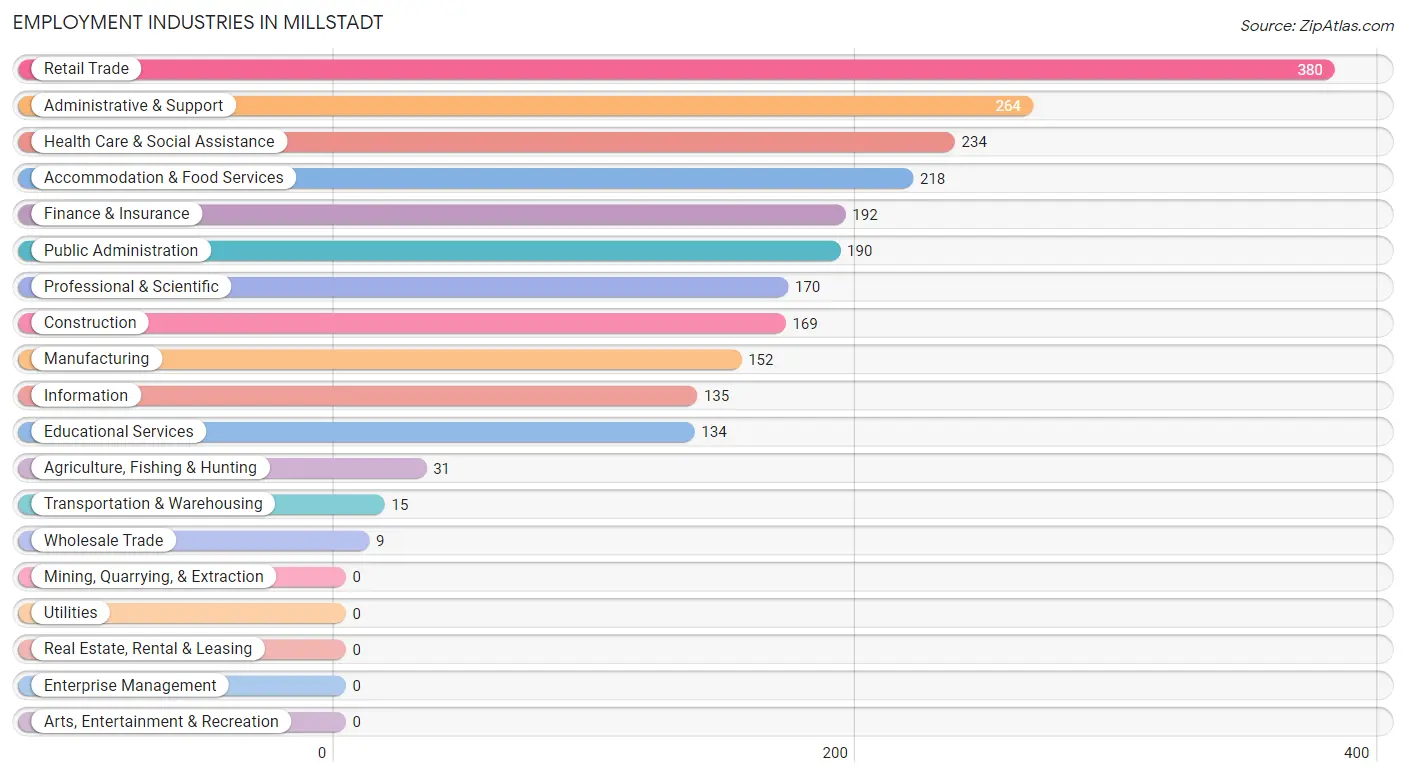
Employment Industries in Millstadt
The major employment industries in Millstadt include Retail Trade (380 | 16.2%), Administrative & Support (264 | 11.3%), Health Care & Social Assistance (234 | 10.0%), Accommodation & Food Services (218 | 9.3%), and Finance & Insurance (192 | 8.2%).
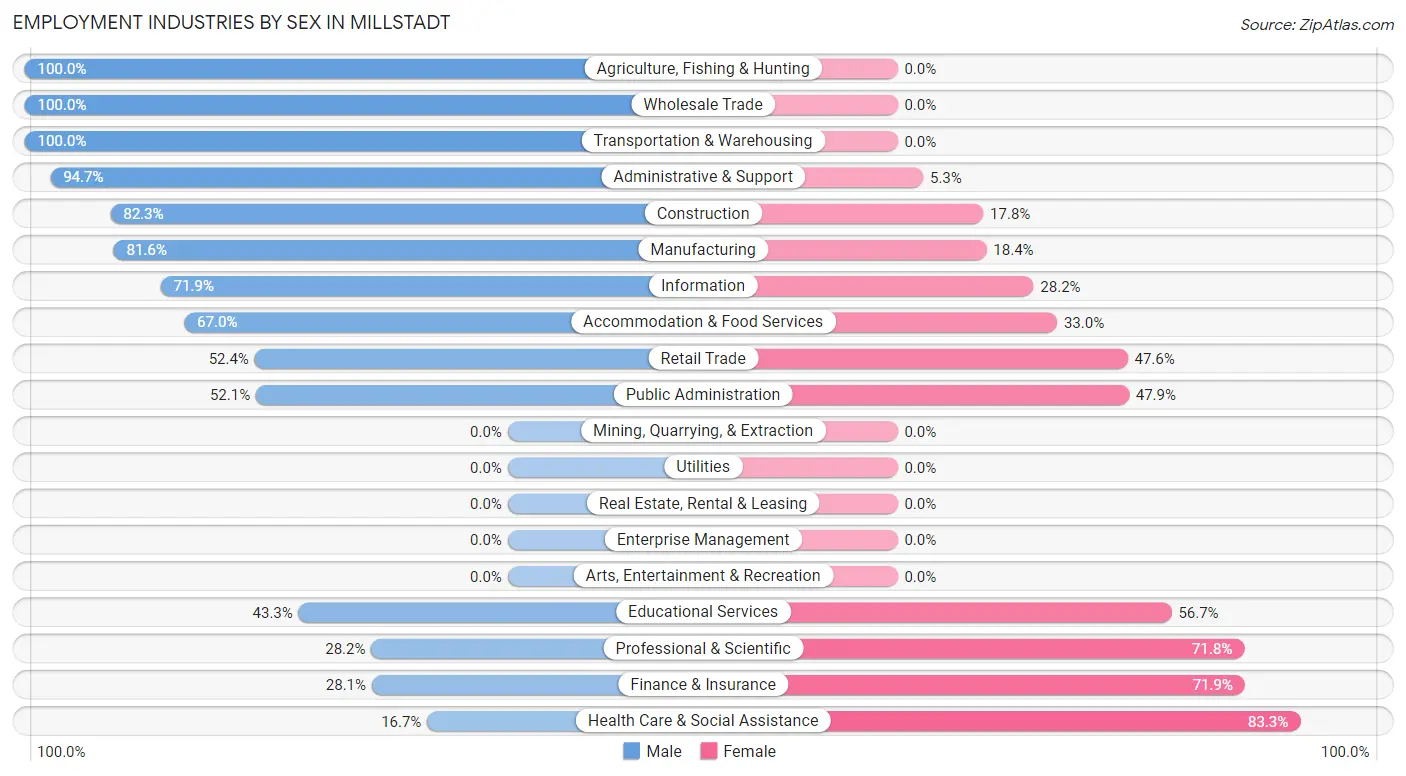
Employment Industries by Sex in Millstadt
The Millstadt industries that see more men than women are Agriculture, Fishing & Hunting (100.0%), Wholesale Trade (100.0%), and Transportation & Warehousing (100.0%), whereas the industries that tend to have a higher number of women are Health Care & Social Assistance (83.3%), Finance & Insurance (71.9%), and Professional & Scientific (71.8%).
| Industry | Male | Female |
| Agriculture, Fishing & Hunting | 31 (100.0%) | 0 (0.0%) |
| Mining, Quarrying, & Extraction | 0 (0.0%) | 0 (0.0%) |
| Construction | 139 (82.3%) | 30 (17.7%) |
| Manufacturing | 124 (81.6%) | 28 (18.4%) |
| Wholesale Trade | 9 (100.0%) | 0 (0.0%) |
| Retail Trade | 199 (52.4%) | 181 (47.6%) |
| Transportation & Warehousing | 15 (100.0%) | 0 (0.0%) |
| Utilities | 0 (0.0%) | 0 (0.0%) |
| Information | 97 (71.9%) | 38 (28.1%) |
| Finance & Insurance | 54 (28.1%) | 138 (71.9%) |
| Real Estate, Rental & Leasing | 0 (0.0%) | 0 (0.0%) |
| Professional & Scientific | 48 (28.2%) | 122 (71.8%) |
| Enterprise Management | 0 (0.0%) | 0 (0.0%) |
| Administrative & Support | 250 (94.7%) | 14 (5.3%) |
| Educational Services | 58 (43.3%) | 76 (56.7%) |
| Health Care & Social Assistance | 39 (16.7%) | 195 (83.3%) |
| Arts, Entertainment & Recreation | 0 (0.0%) | 0 (0.0%) |
| Accommodation & Food Services | 146 (67.0%) | 72 (33.0%) |
| Public Administration | 99 (52.1%) | 91 (47.9%) |
| Total | 1,329 (56.7%) | 1,017 (43.3%) |
Education in Millstadt
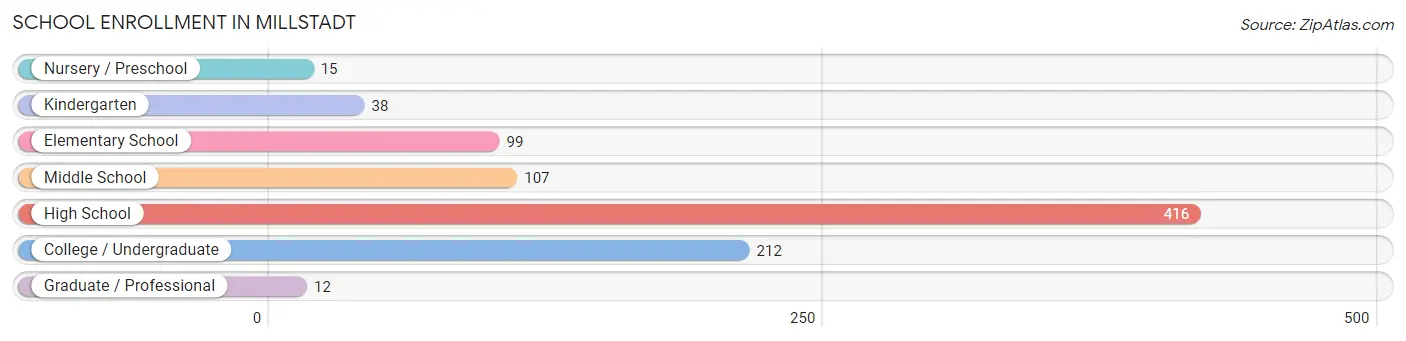
School Enrollment in Millstadt
The most common levels of schooling among the 899 students in Millstadt are high school (416 | 46.3%), college / undergraduate (212 | 23.6%), and middle school (107 | 11.9%).
| School Level | # Students | % Students |
| Nursery / Preschool | 15 | 1.7% |
| Kindergarten | 38 | 4.2% |
| Elementary School | 99 | 11.0% |
| Middle School | 107 | 11.9% |
| High School | 416 | 46.3% |
| College / Undergraduate | 212 | 23.6% |
| Graduate / Professional | 12 | 1.3% |
| Total | 899 | 100.0% |
School Enrollment by Age by Funding Source in Millstadt
Out of a total of 899 students who are enrolled in schools in Millstadt, 57 (6.3%) attend a private institution, while the remaining 842 (93.7%) are enrolled in public schools. The age group of 3 to 4 year olds has the highest likelihood of being enrolled in private schools, with 15 (100.0% in the age bracket) enrolled. Conversely, the age group of 5 to 9 year old has the lowest likelihood of being enrolled in a private school, with 137 (100.0% in the age bracket) attending a public institution.
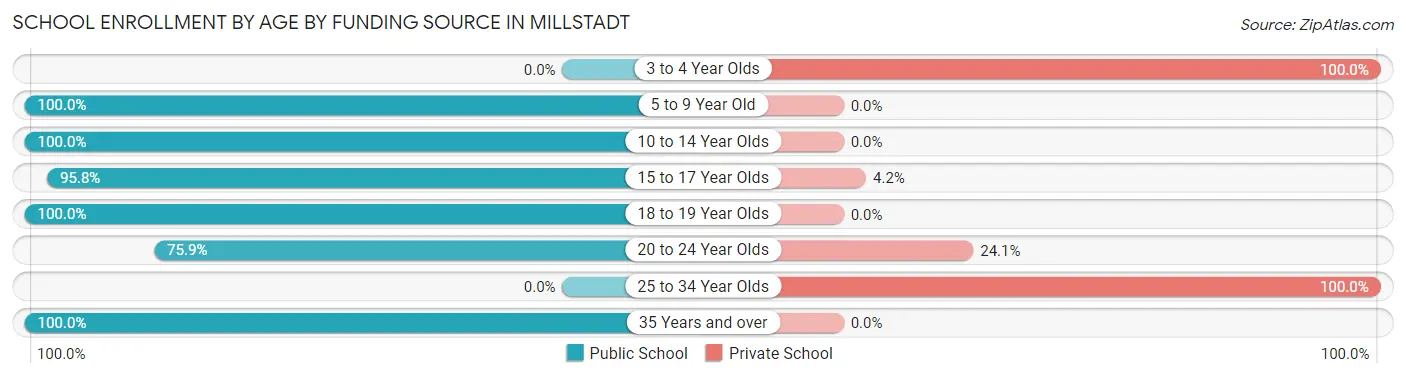
| Age Bracket | Public School | Private School |
| 3 to 4 Year Olds | 0 (0.0%) | 15 (100.0%) |
| 5 to 9 Year Old | 137 (100.0%) | 0 (0.0%) |
| 10 to 14 Year Olds | 120 (100.0%) | 0 (0.0%) |
| 15 to 17 Year Olds | 368 (95.8%) | 16 (4.2%) |
| 18 to 19 Year Olds | 130 (100.0%) | 0 (0.0%) |
| 20 to 24 Year Olds | 44 (75.9%) | 14 (24.1%) |
| 25 to 34 Year Olds | 0 (0.0%) | 12 (100.0%) |
| 35 Years and over | 43 (100.0%) | 0 (0.0%) |
| Total | 842 (93.7%) | 57 (6.3%) |
Educational Attainment by Field of Study in Millstadt
Business (314 | 28.8%), education (253 | 23.2%), communications (101 | 9.3%), science & technology (96 | 8.8%), and engineering (85 | 7.8%) are the most common fields of study among 1,090 individuals in Millstadt who have obtained a bachelor's degree or higher.
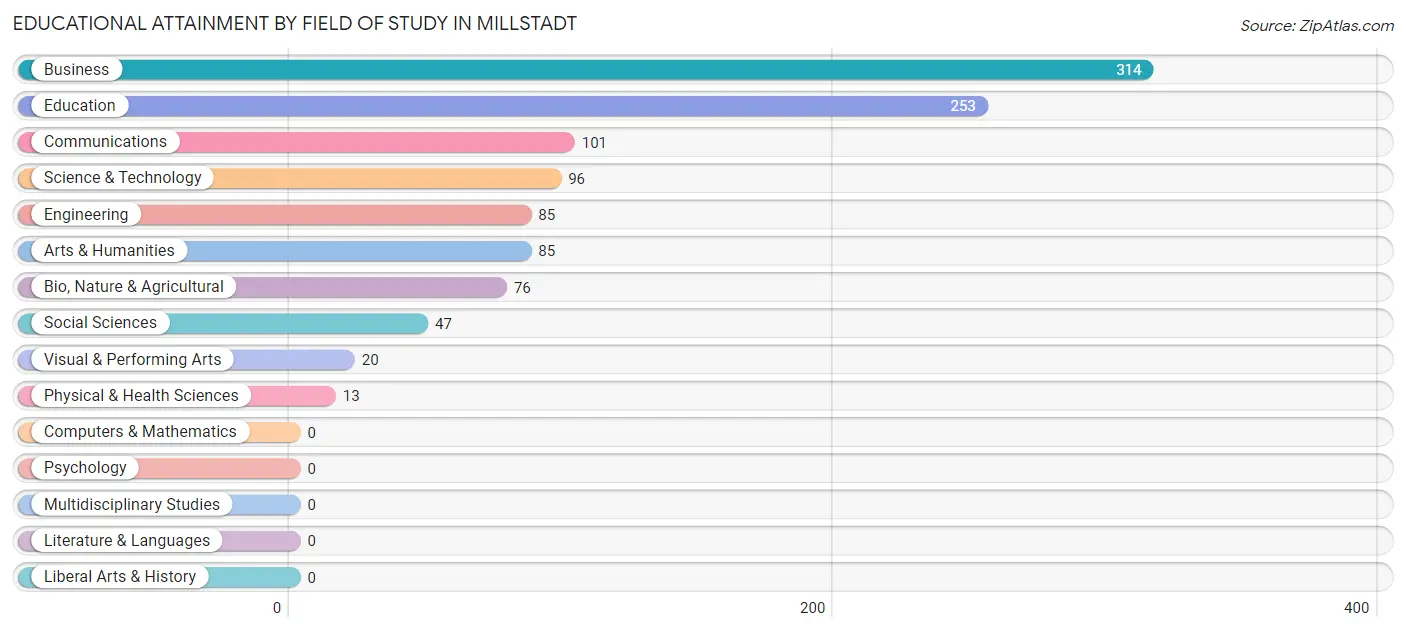
| Field of Study | # Graduates | % Graduates |
| Computers & Mathematics | 0 | 0.0% |
| Bio, Nature & Agricultural | 76 | 7.0% |
| Physical & Health Sciences | 13 | 1.2% |
| Psychology | 0 | 0.0% |
| Social Sciences | 47 | 4.3% |
| Engineering | 85 | 7.8% |
| Multidisciplinary Studies | 0 | 0.0% |
| Science & Technology | 96 | 8.8% |
| Business | 314 | 28.8% |
| Education | 253 | 23.2% |
| Literature & Languages | 0 | 0.0% |
| Liberal Arts & History | 0 | 0.0% |
| Visual & Performing Arts | 20 | 1.8% |
| Communications | 101 | 9.3% |
| Arts & Humanities | 85 | 7.8% |
| Total | 1,090 | 100.0% |
Transportation & Commute in Millstadt
Vehicle Availability by Sex in Millstadt
The most prevalent vehicle ownership categories in Millstadt are males with 2 vehicles (476, accounting for 35.8%) and females with 2 vehicles (379, making up 46.8%).
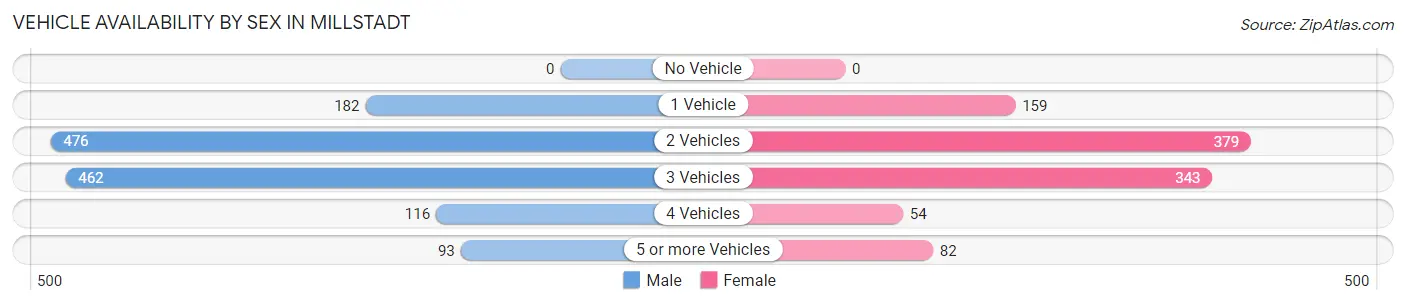
| Vehicles Available | Male | Female |
| No Vehicle | 0 (0.0%) | 0 (0.0%) |
| 1 Vehicle | 182 (13.7%) | 159 (15.6%) |
| 2 Vehicles | 476 (35.8%) | 379 (37.3%) |
| 3 Vehicles | 462 (34.8%) | 343 (33.7%) |
| 4 Vehicles | 116 (8.7%) | 54 (5.3%) |
| 5 or more Vehicles | 93 (7.0%) | 82 (8.1%) |
| Total | 1,329 (100.0%) | 1,017 (100.0%) |
Commute Time in Millstadt
The most frequently occuring commute durations in Millstadt are 20 to 24 minutes (461 commuters, 21.3%), 10 to 14 minutes (319 commuters, 14.8%), and 45 to 59 minutes (247 commuters, 11.4%).
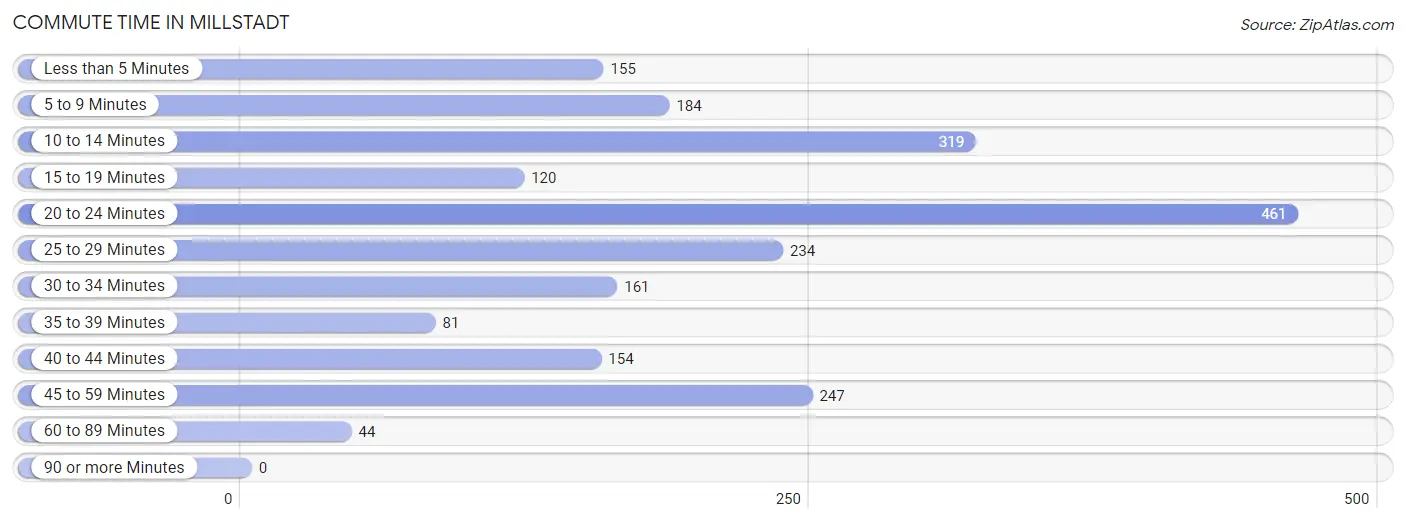
| Commute Time | # Commuters | % Commuters |
| Less than 5 Minutes | 155 | 7.2% |
| 5 to 9 Minutes | 184 | 8.5% |
| 10 to 14 Minutes | 319 | 14.8% |
| 15 to 19 Minutes | 120 | 5.6% |
| 20 to 24 Minutes | 461 | 21.3% |
| 25 to 29 Minutes | 234 | 10.8% |
| 30 to 34 Minutes | 161 | 7.4% |
| 35 to 39 Minutes | 81 | 3.7% |
| 40 to 44 Minutes | 154 | 7.1% |
| 45 to 59 Minutes | 247 | 11.4% |
| 60 to 89 Minutes | 44 | 2.0% |
| 90 or more Minutes | 0 | 0.0% |
Commute Time by Sex in Millstadt
The most common commute times in Millstadt are 20 to 24 minutes (378 commuters, 29.2%) for males and 30 to 34 minutes (132 commuters, 15.2%) for females.
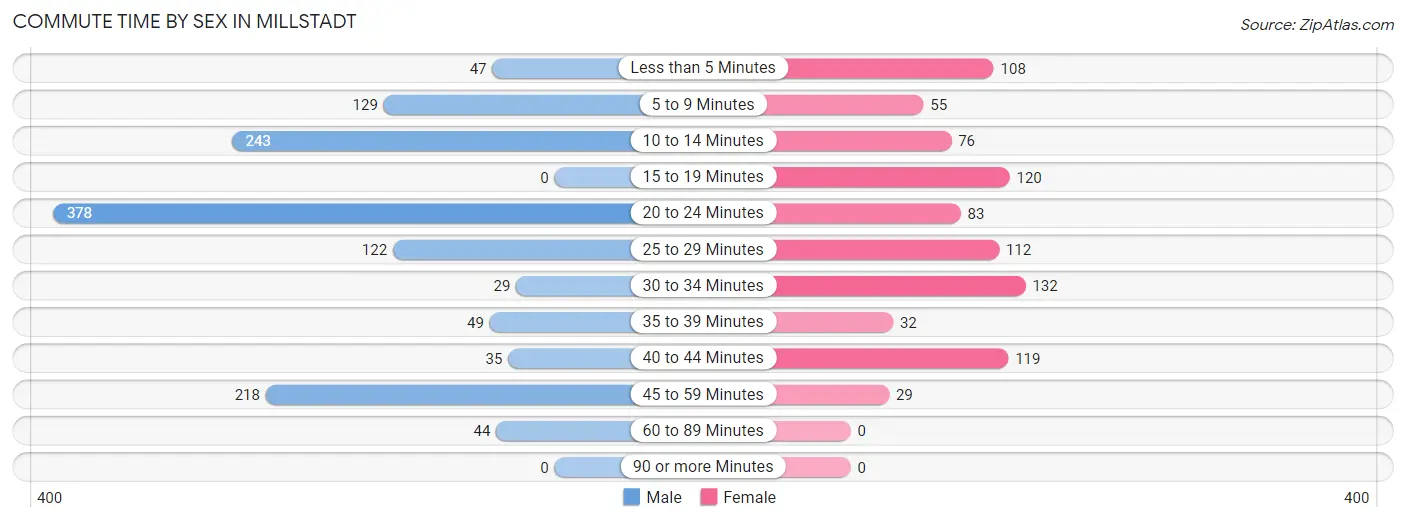
| Commute Time | Male | Female |
| Less than 5 Minutes | 47 (3.6%) | 108 (12.5%) |
| 5 to 9 Minutes | 129 (10.0%) | 55 (6.4%) |
| 10 to 14 Minutes | 243 (18.8%) | 76 (8.8%) |
| 15 to 19 Minutes | 0 (0.0%) | 120 (13.9%) |
| 20 to 24 Minutes | 378 (29.2%) | 83 (9.6%) |
| 25 to 29 Minutes | 122 (9.4%) | 112 (12.9%) |
| 30 to 34 Minutes | 29 (2.2%) | 132 (15.2%) |
| 35 to 39 Minutes | 49 (3.8%) | 32 (3.7%) |
| 40 to 44 Minutes | 35 (2.7%) | 119 (13.7%) |
| 45 to 59 Minutes | 218 (16.9%) | 29 (3.4%) |
| 60 to 89 Minutes | 44 (3.4%) | 0 (0.0%) |
| 90 or more Minutes | 0 (0.0%) | 0 (0.0%) |
Time of Departure to Work by Sex in Millstadt
The most frequent times of departure to work in Millstadt are 5:30 AM to 5:59 AM (204, 15.8%) for males and 7:30 AM to 7:59 AM (253, 29.2%) for females.
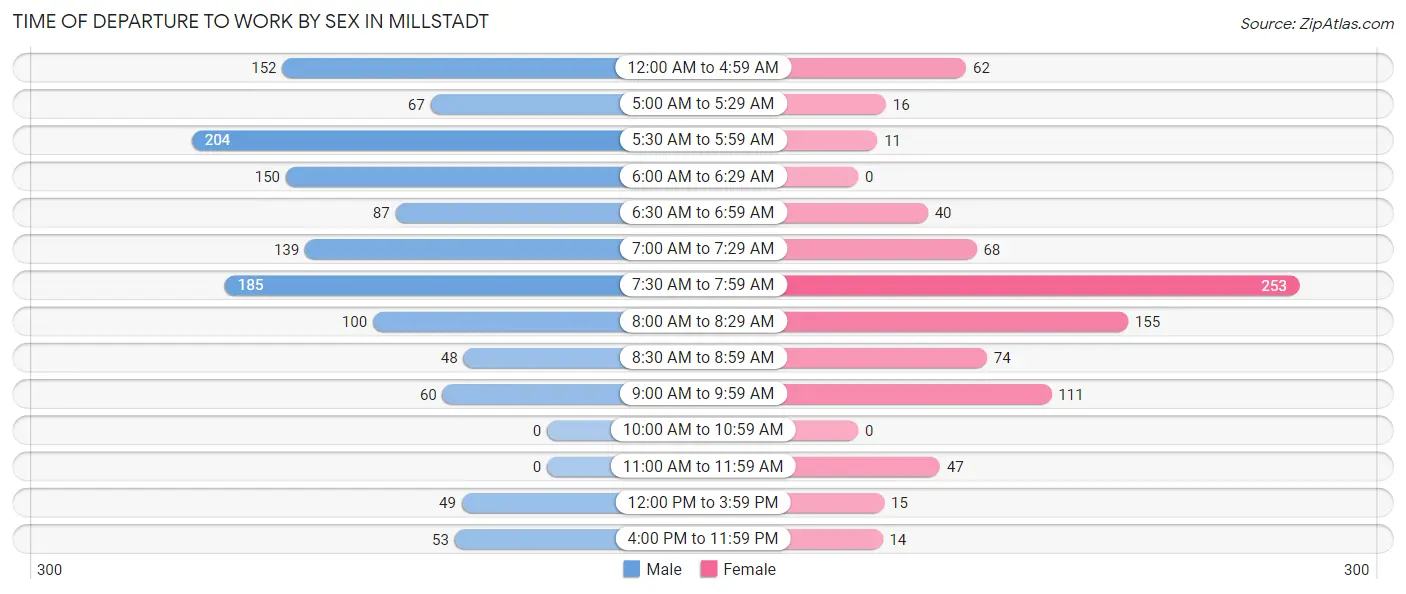
| Time of Departure | Male | Female |
| 12:00 AM to 4:59 AM | 152 (11.7%) | 62 (7.2%) |
| 5:00 AM to 5:29 AM | 67 (5.2%) | 16 (1.8%) |
| 5:30 AM to 5:59 AM | 204 (15.8%) | 11 (1.3%) |
| 6:00 AM to 6:29 AM | 150 (11.6%) | 0 (0.0%) |
| 6:30 AM to 6:59 AM | 87 (6.7%) | 40 (4.6%) |
| 7:00 AM to 7:29 AM | 139 (10.7%) | 68 (7.9%) |
| 7:30 AM to 7:59 AM | 185 (14.3%) | 253 (29.2%) |
| 8:00 AM to 8:29 AM | 100 (7.7%) | 155 (17.9%) |
| 8:30 AM to 8:59 AM | 48 (3.7%) | 74 (8.6%) |
| 9:00 AM to 9:59 AM | 60 (4.6%) | 111 (12.8%) |
| 10:00 AM to 10:59 AM | 0 (0.0%) | 0 (0.0%) |
| 11:00 AM to 11:59 AM | 0 (0.0%) | 47 (5.4%) |
| 12:00 PM to 3:59 PM | 49 (3.8%) | 15 (1.7%) |
| 4:00 PM to 11:59 PM | 53 (4.1%) | 14 (1.6%) |
| Total | 1,294 (100.0%) | 866 (100.0%) |
Housing Occupancy in Millstadt
Occupancy by Ownership in Millstadt
Of the total 1,595 dwellings in Millstadt, owner-occupied units account for 1,381 (86.6%), while renter-occupied units make up 214 (13.4%).
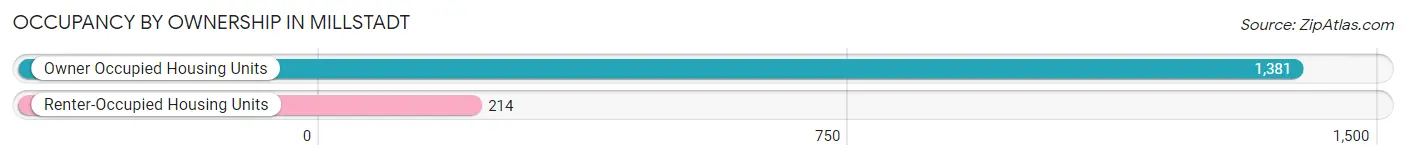
| Occupancy | # Housing Units | % Housing Units |
| Owner Occupied Housing Units | 1,381 | 86.6% |
| Renter-Occupied Housing Units | 214 | 13.4% |
| Total Occupied Housing Units | 1,595 | 100.0% |
Occupancy by Household Size in Millstadt
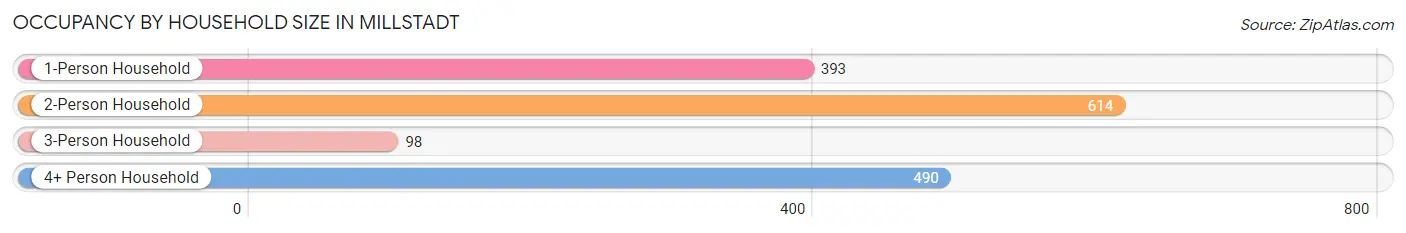
| Household Size | # Housing Units | % Housing Units |
| 1-Person Household | 393 | 24.6% |
| 2-Person Household | 614 | 38.5% |
| 3-Person Household | 98 | 6.1% |
| 4+ Person Household | 490 | 30.7% |
| Total Housing Units | 1,595 | 100.0% |
Occupancy by Ownership by Household Size in Millstadt
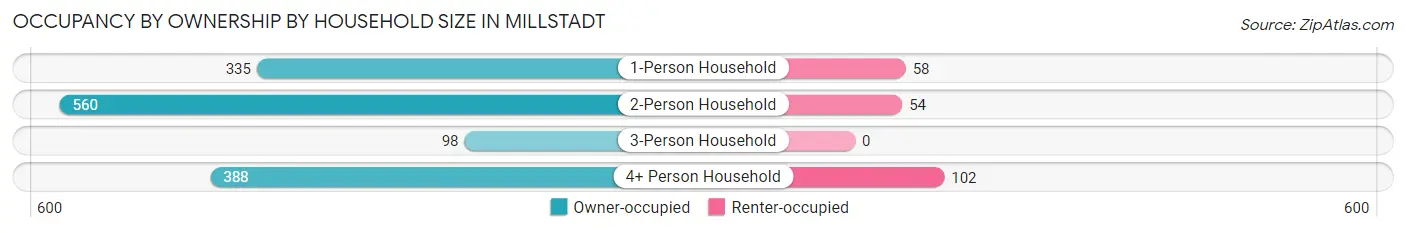
| Household Size | Owner-occupied | Renter-occupied |
| 1-Person Household | 335 (85.2%) | 58 (14.8%) |
| 2-Person Household | 560 (91.2%) | 54 (8.8%) |
| 3-Person Household | 98 (100.0%) | 0 (0.0%) |
| 4+ Person Household | 388 (79.2%) | 102 (20.8%) |
| Total Housing Units | 1,381 (86.6%) | 214 (13.4%) |
Occupancy by Educational Attainment in Millstadt
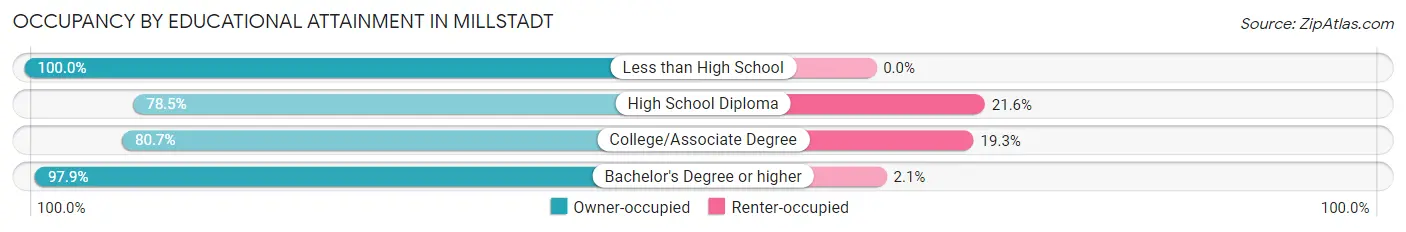
| Household Size | Owner-occupied | Renter-occupied |
| Less than High School | 15 (100.0%) | 0 (0.0%) |
| High School Diploma | 313 (78.4%) | 86 (21.5%) |
| College/Associate Degree | 484 (80.7%) | 116 (19.3%) |
| Bachelor's Degree or higher | 569 (97.9%) | 12 (2.1%) |
Occupancy by Age of Householder in Millstadt
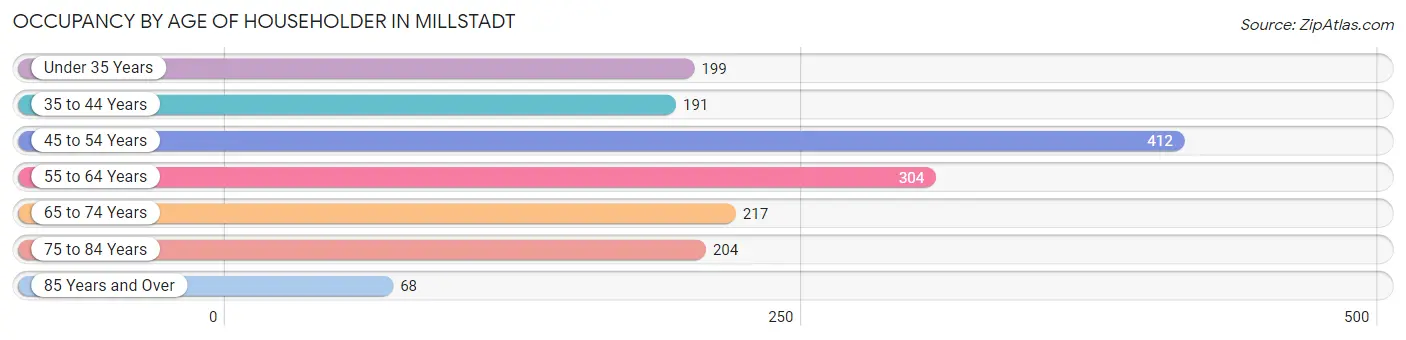
| Age Bracket | # Households | % Households |
| Under 35 Years | 199 | 12.5% |
| 35 to 44 Years | 191 | 12.0% |
| 45 to 54 Years | 412 | 25.8% |
| 55 to 64 Years | 304 | 19.1% |
| 65 to 74 Years | 217 | 13.6% |
| 75 to 84 Years | 204 | 12.8% |
| 85 Years and Over | 68 | 4.3% |
| Total | 1,595 | 100.0% |
Housing Finances in Millstadt
Median Income by Occupancy in Millstadt
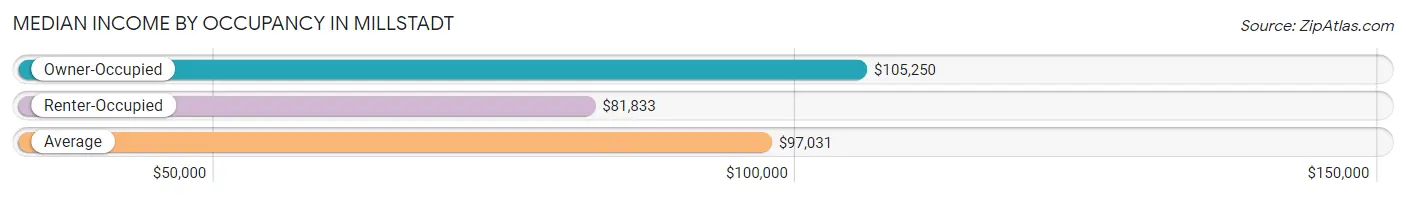
| Occupancy Type | # Households | Median Income |
| Owner-Occupied | 1,381 (86.6%) | $105,250 |
| Renter-Occupied | 214 (13.4%) | $81,833 |
| Average | 1,595 (100.0%) | $97,031 |
Occupancy by Householder Income Bracket in Millstadt
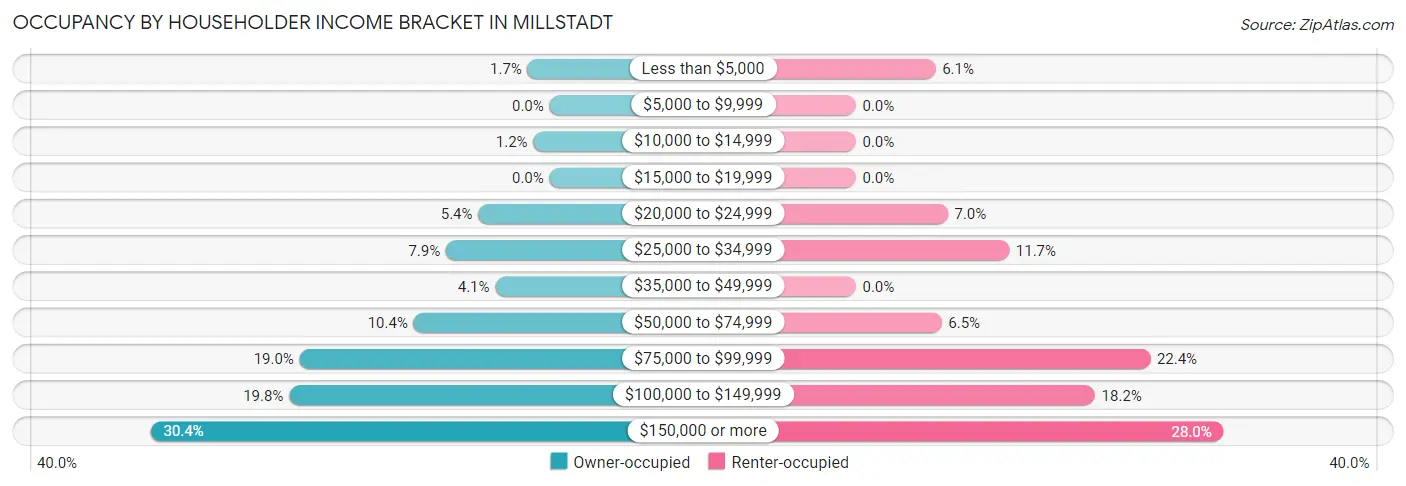
| Income Bracket | Owner-occupied | Renter-occupied |
| Less than $5,000 | 23 (1.7%) | 13 (6.1%) |
| $5,000 to $9,999 | 0 (0.0%) | 0 (0.0%) |
| $10,000 to $14,999 | 17 (1.2%) | 0 (0.0%) |
| $15,000 to $19,999 | 0 (0.0%) | 0 (0.0%) |
| $20,000 to $24,999 | 75 (5.4%) | 15 (7.0%) |
| $25,000 to $34,999 | 109 (7.9%) | 25 (11.7%) |
| $35,000 to $49,999 | 57 (4.1%) | 0 (0.0%) |
| $50,000 to $74,999 | 143 (10.3%) | 14 (6.5%) |
| $75,000 to $99,999 | 263 (19.0%) | 48 (22.4%) |
| $100,000 to $149,999 | 274 (19.8%) | 39 (18.2%) |
| $150,000 or more | 420 (30.4%) | 60 (28.0%) |
| Total | 1,381 (100.0%) | 214 (100.0%) |
Monthly Housing Cost Tiers in Millstadt
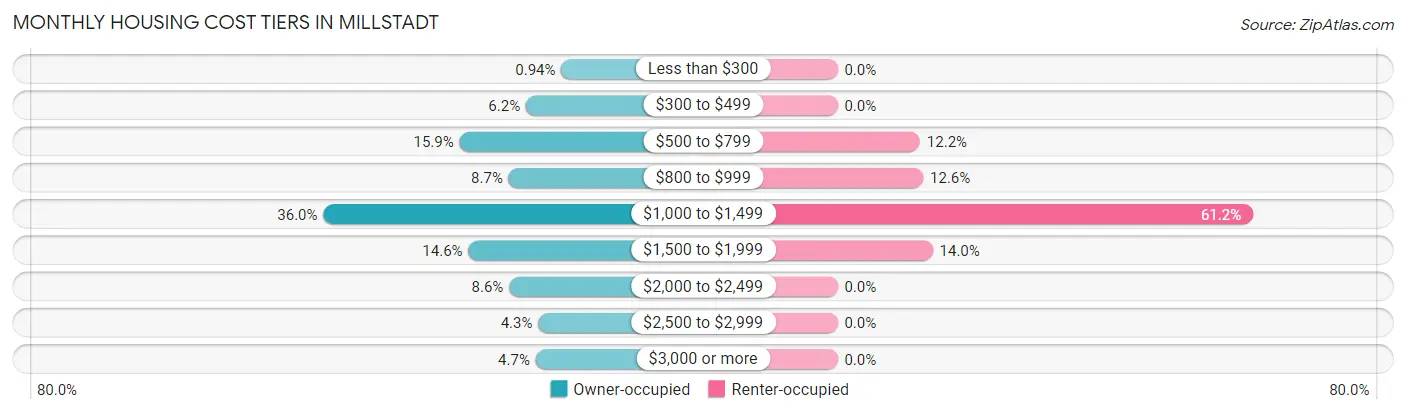
| Monthly Cost | Owner-occupied | Renter-occupied |
| Less than $300 | 13 (0.9%) | 0 (0.0%) |
| $300 to $499 | 85 (6.1%) | 0 (0.0%) |
| $500 to $799 | 220 (15.9%) | 26 (12.1%) |
| $800 to $999 | 120 (8.7%) | 27 (12.6%) |
| $1,000 to $1,499 | 497 (36.0%) | 131 (61.2%) |
| $1,500 to $1,999 | 202 (14.6%) | 30 (14.0%) |
| $2,000 to $2,499 | 119 (8.6%) | 0 (0.0%) |
| $2,500 to $2,999 | 60 (4.3%) | 0 (0.0%) |
| $3,000 or more | 65 (4.7%) | 0 (0.0%) |
| Total | 1,381 (100.0%) | 214 (100.0%) |
Physical Housing Characteristics in Millstadt
Housing Structures in Millstadt
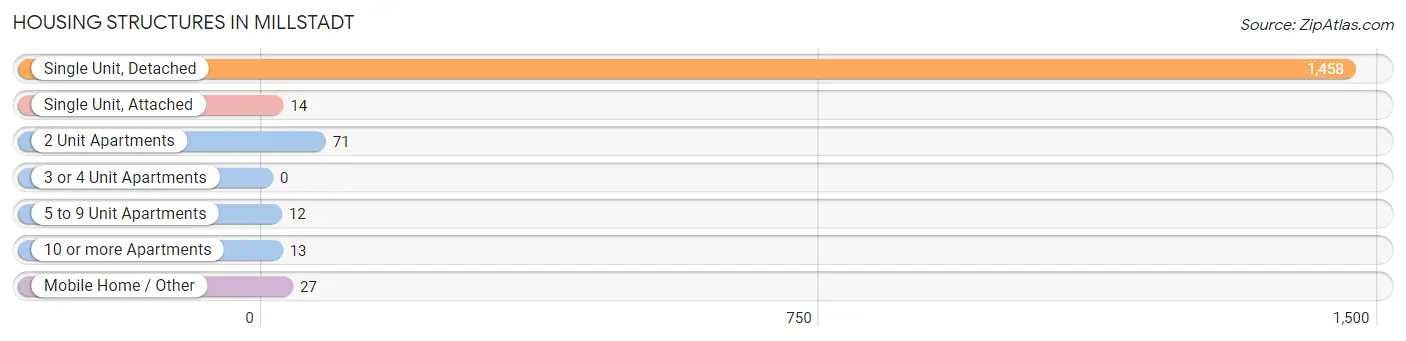
| Structure Type | # Housing Units | % Housing Units |
| Single Unit, Detached | 1,458 | 91.4% |
| Single Unit, Attached | 14 | 0.9% |
| 2 Unit Apartments | 71 | 4.4% |
| 3 or 4 Unit Apartments | 0 | 0.0% |
| 5 to 9 Unit Apartments | 12 | 0.7% |
| 10 or more Apartments | 13 | 0.8% |
| Mobile Home / Other | 27 | 1.7% |
| Total | 1,595 | 100.0% |
Housing Structures by Occupancy in Millstadt
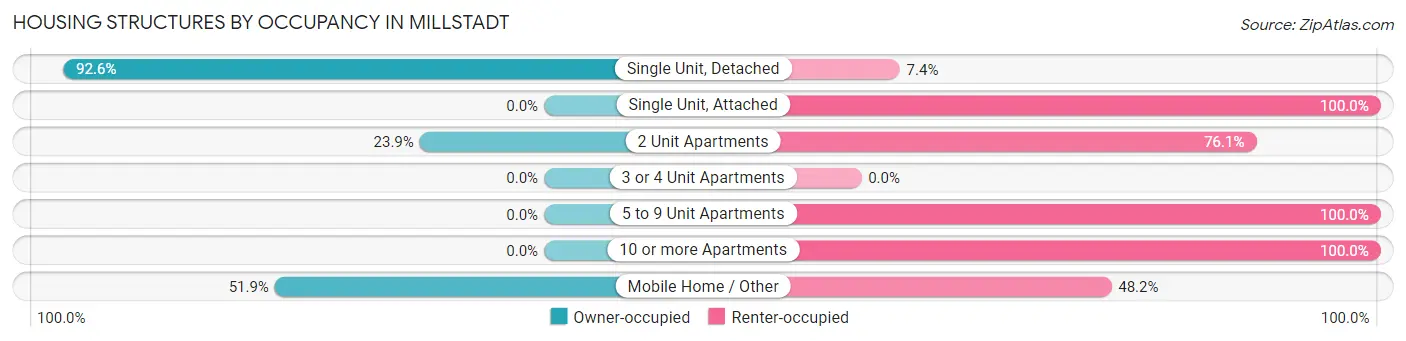
| Structure Type | Owner-occupied | Renter-occupied |
| Single Unit, Detached | 1,350 (92.6%) | 108 (7.4%) |
| Single Unit, Attached | 0 (0.0%) | 14 (100.0%) |
| 2 Unit Apartments | 17 (23.9%) | 54 (76.1%) |
| 3 or 4 Unit Apartments | 0 (0.0%) | 0 (0.0%) |
| 5 to 9 Unit Apartments | 0 (0.0%) | 12 (100.0%) |
| 10 or more Apartments | 0 (0.0%) | 13 (100.0%) |
| Mobile Home / Other | 14 (51.8%) | 13 (48.1%) |
| Total | 1,381 (86.6%) | 214 (13.4%) |
Housing Structures by Number of Rooms in Millstadt
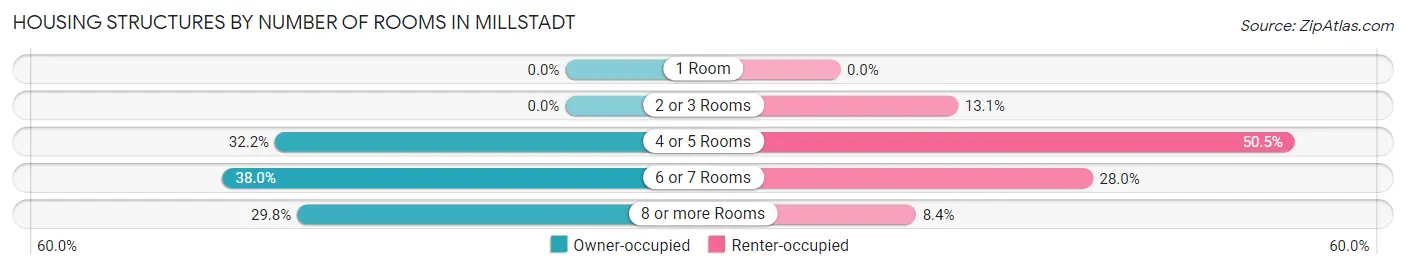
| Number of Rooms | Owner-occupied | Renter-occupied |
| 1 Room | 0 (0.0%) | 0 (0.0%) |
| 2 or 3 Rooms | 0 (0.0%) | 28 (13.1%) |
| 4 or 5 Rooms | 445 (32.2%) | 108 (50.5%) |
| 6 or 7 Rooms | 525 (38.0%) | 60 (28.0%) |
| 8 or more Rooms | 411 (29.8%) | 18 (8.4%) |
| Total | 1,381 (100.0%) | 214 (100.0%) |
Housing Structure by Heating Type in Millstadt
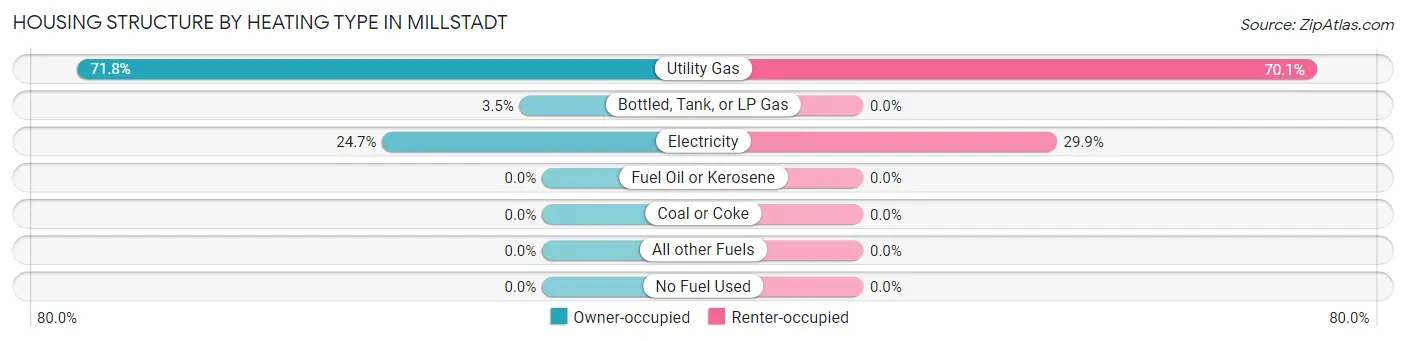
| Heating Type | Owner-occupied | Renter-occupied |
| Utility Gas | 992 (71.8%) | 150 (70.1%) |
| Bottled, Tank, or LP Gas | 48 (3.5%) | 0 (0.0%) |
| Electricity | 341 (24.7%) | 64 (29.9%) |
| Fuel Oil or Kerosene | 0 (0.0%) | 0 (0.0%) |
| Coal or Coke | 0 (0.0%) | 0 (0.0%) |
| All other Fuels | 0 (0.0%) | 0 (0.0%) |
| No Fuel Used | 0 (0.0%) | 0 (0.0%) |
| Total | 1,381 (100.0%) | 214 (100.0%) |
Household Vehicle Usage in Millstadt
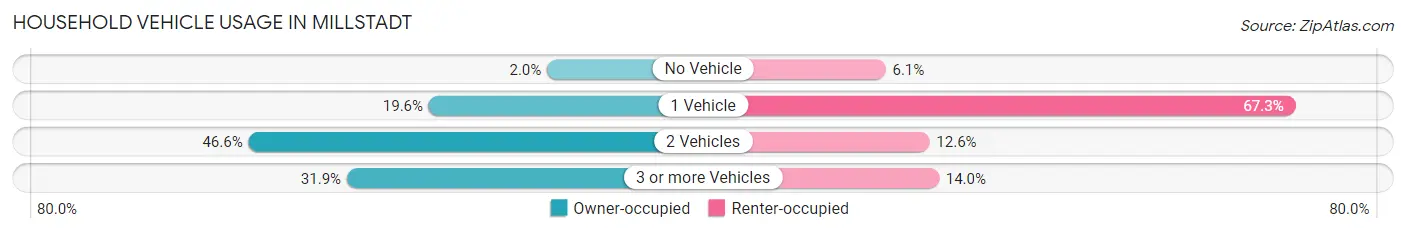
| Vehicles per Household | Owner-occupied | Renter-occupied |
| No Vehicle | 27 (2.0%) | 13 (6.1%) |
| 1 Vehicle | 271 (19.6%) | 144 (67.3%) |
| 2 Vehicles | 643 (46.6%) | 27 (12.6%) |
| 3 or more Vehicles | 440 (31.9%) | 30 (14.0%) |
| Total | 1,381 (100.0%) | 214 (100.0%) |
Real Estate & Mortgages in Millstadt
Real Estate and Mortgage Overview in Millstadt
| Characteristic | Without Mortgage | With Mortgage |
| Housing Units | 439 | 942 |
| Median Property Value | $211,800 | $192,700 |
| Median Household Income | $83,125 | $309 |
| Monthly Housing Costs | $702 | $65 |
| Real Estate Taxes | $3,982 | $40 |
Property Value by Mortgage Status in Millstadt
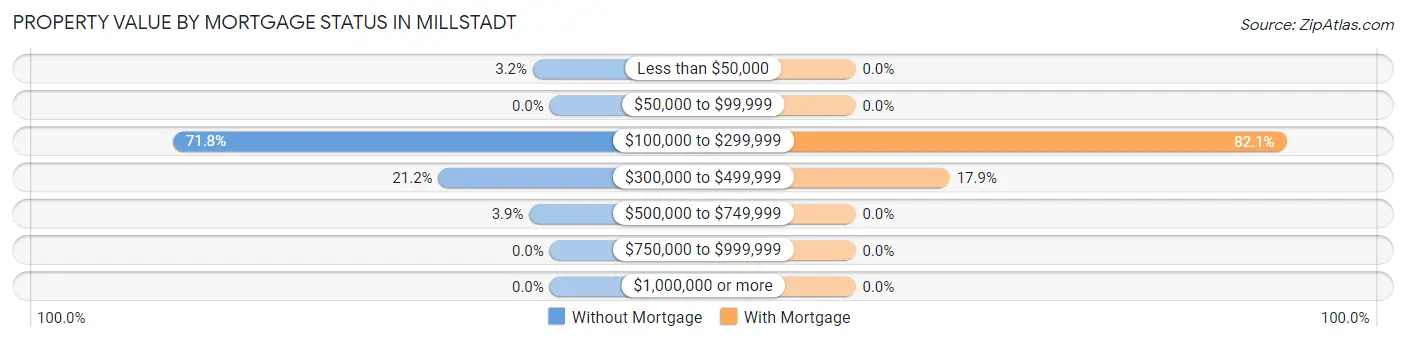
| Property Value | Without Mortgage | With Mortgage |
| Less than $50,000 | 14 (3.2%) | 0 (0.0%) |
| $50,000 to $99,999 | 0 (0.0%) | 0 (0.0%) |
| $100,000 to $299,999 | 315 (71.8%) | 773 (82.1%) |
| $300,000 to $499,999 | 93 (21.2%) | 169 (17.9%) |
| $500,000 to $749,999 | 17 (3.9%) | 0 (0.0%) |
| $750,000 to $999,999 | 0 (0.0%) | 0 (0.0%) |
| $1,000,000 or more | 0 (0.0%) | 0 (0.0%) |
| Total | 439 (100.0%) | 942 (100.0%) |
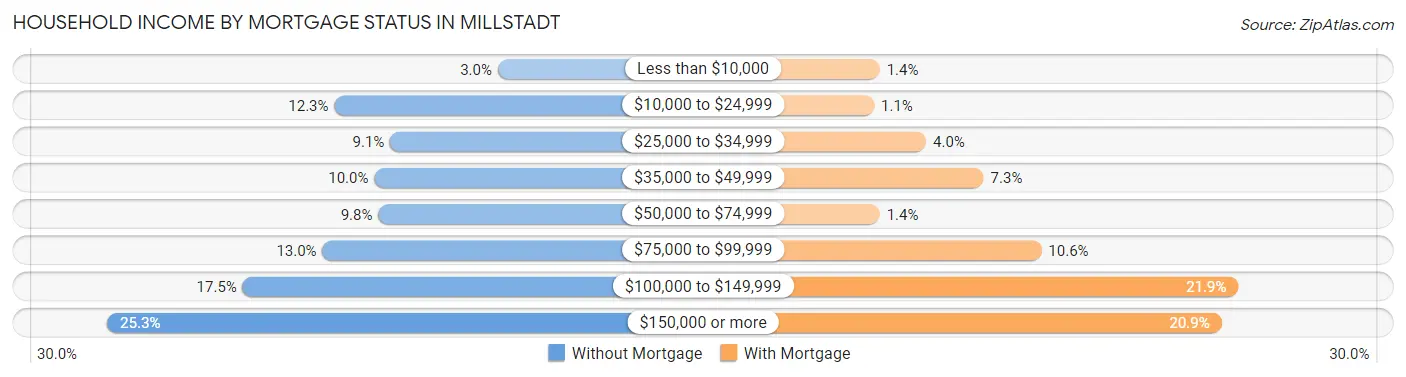
Household Income by Mortgage Status in Millstadt
| Household Income | Without Mortgage | With Mortgage |
| Less than $10,000 | 13 (3.0%) | 13 (1.4%) |
| $10,000 to $24,999 | 54 (12.3%) | 10 (1.1%) |
| $25,000 to $34,999 | 40 (9.1%) | 38 (4.0%) |
| $35,000 to $49,999 | 44 (10.0%) | 69 (7.3%) |
| $50,000 to $74,999 | 43 (9.8%) | 13 (1.4%) |
| $75,000 to $99,999 | 57 (13.0%) | 100 (10.6%) |
| $100,000 to $149,999 | 77 (17.5%) | 206 (21.9%) |
| $150,000 or more | 111 (25.3%) | 197 (20.9%) |
| Total | 439 (100.0%) | 942 (100.0%) |
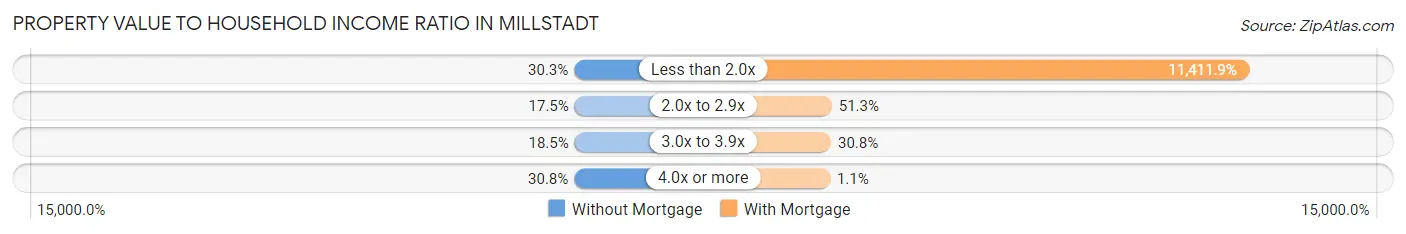
Property Value to Household Income Ratio in Millstadt
| Value-to-Income Ratio | Without Mortgage | With Mortgage |
| Less than 2.0x | 133 (30.3%) | 107,500 (11,411.9%) |
| 2.0x to 2.9x | 77 (17.5%) | 483 (51.3%) |
| 3.0x to 3.9x | 81 (18.4%) | 290 (30.8%) |
| 4.0x or more | 135 (30.7%) | 10 (1.1%) |
| Total | 439 (100.0%) | 942 (100.0%) |
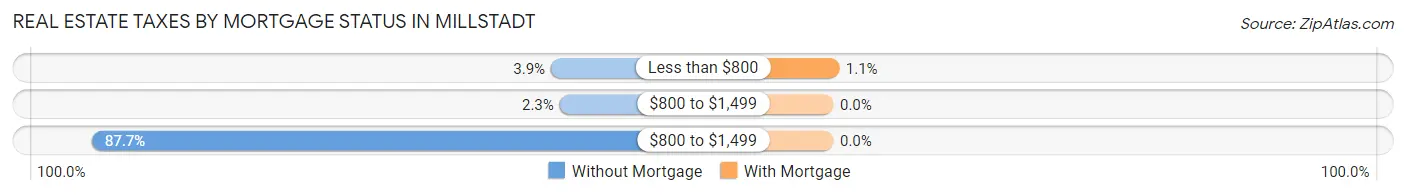
Real Estate Taxes by Mortgage Status in Millstadt
| Property Taxes | Without Mortgage | With Mortgage |
| Less than $800 | 17 (3.9%) | 10 (1.1%) |
| $800 to $1,499 | 10 (2.3%) | 0 (0.0%) |
| $800 to $1,499 | 385 (87.7%) | 0 (0.0%) |
| Total | 439 (100.0%) | 942 (100.0%) |
Health & Disability in Millstadt
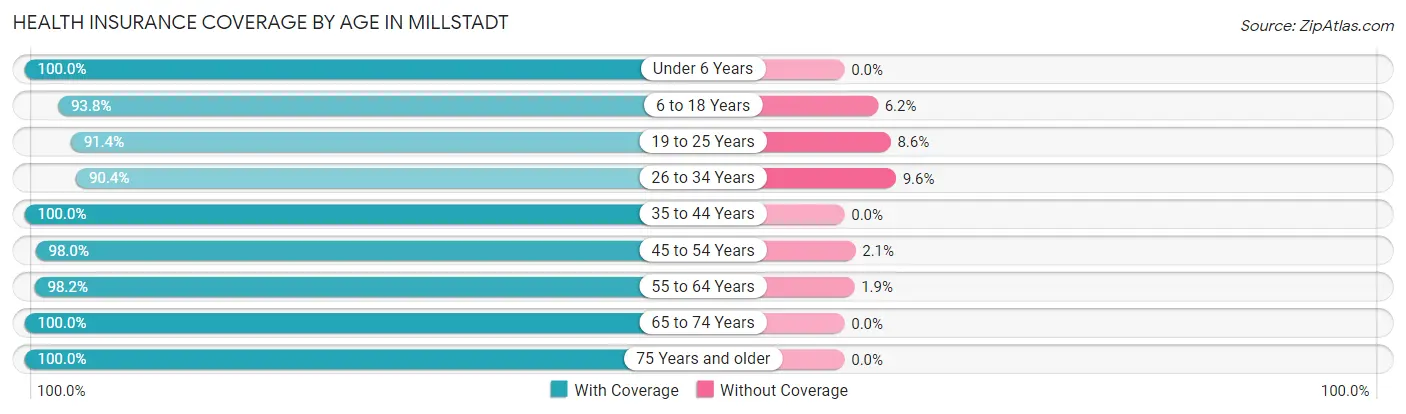
Health Insurance Coverage by Age in Millstadt
| Age Bracket | With Coverage | Without Coverage |
| Under 6 Years | 156 (100.0%) | 0 (0.0%) |
| 6 to 18 Years | 692 (93.8%) | 46 (6.2%) |
| 19 to 25 Years | 191 (91.4%) | 18 (8.6%) |
| 26 to 34 Years | 443 (90.4%) | 47 (9.6%) |
| 35 to 44 Years | 434 (100.0%) | 0 (0.0%) |
| 45 to 54 Years | 766 (98.0%) | 16 (2.1%) |
| 55 to 64 Years | 532 (98.2%) | 10 (1.8%) |
| 65 to 74 Years | 362 (100.0%) | 0 (0.0%) |
| 75 Years and older | 322 (100.0%) | 0 (0.0%) |
| Total | 3,898 (96.6%) | 137 (3.4%) |
Health Insurance Coverage by Citizenship Status in Millstadt
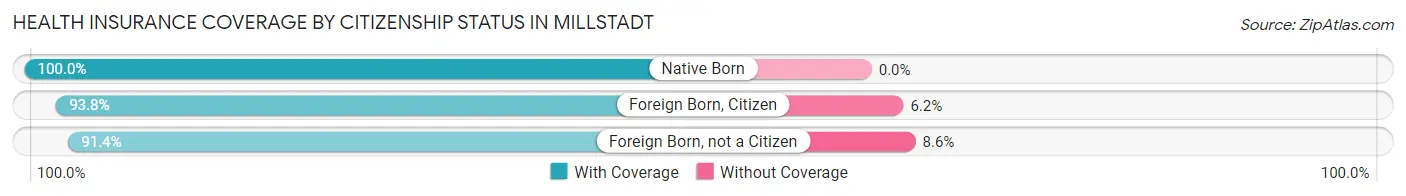
| Citizenship Status | With Coverage | Without Coverage |
| Native Born | 156 (100.0%) | 0 (0.0%) |
| Foreign Born, Citizen | 692 (93.8%) | 46 (6.2%) |
| Foreign Born, not a Citizen | 191 (91.4%) | 18 (8.6%) |
Health Insurance Coverage by Household Income in Millstadt
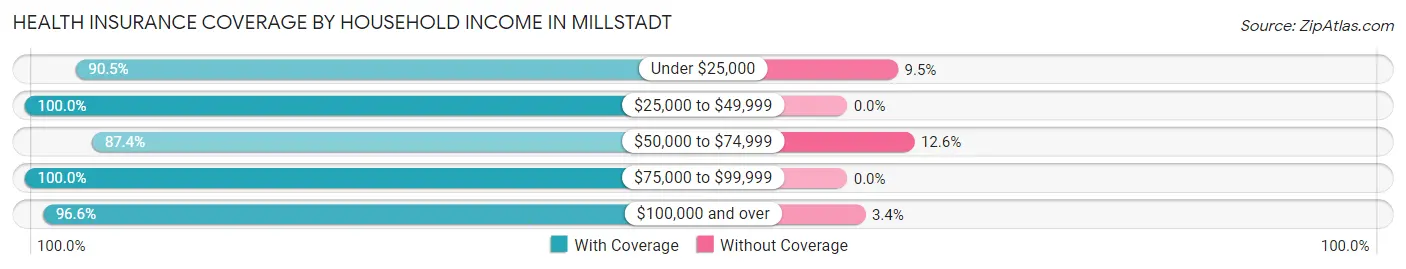
| Household Income | With Coverage | Without Coverage |
| Under $25,000 | 152 (90.5%) | 16 (9.5%) |
| $25,000 to $49,999 | 251 (100.0%) | 0 (0.0%) |
| $50,000 to $74,999 | 257 (87.4%) | 37 (12.6%) |
| $75,000 to $99,999 | 848 (100.0%) | 0 (0.0%) |
| $100,000 and over | 2,390 (96.6%) | 84 (3.4%) |
Public vs Private Health Insurance Coverage by Age in Millstadt
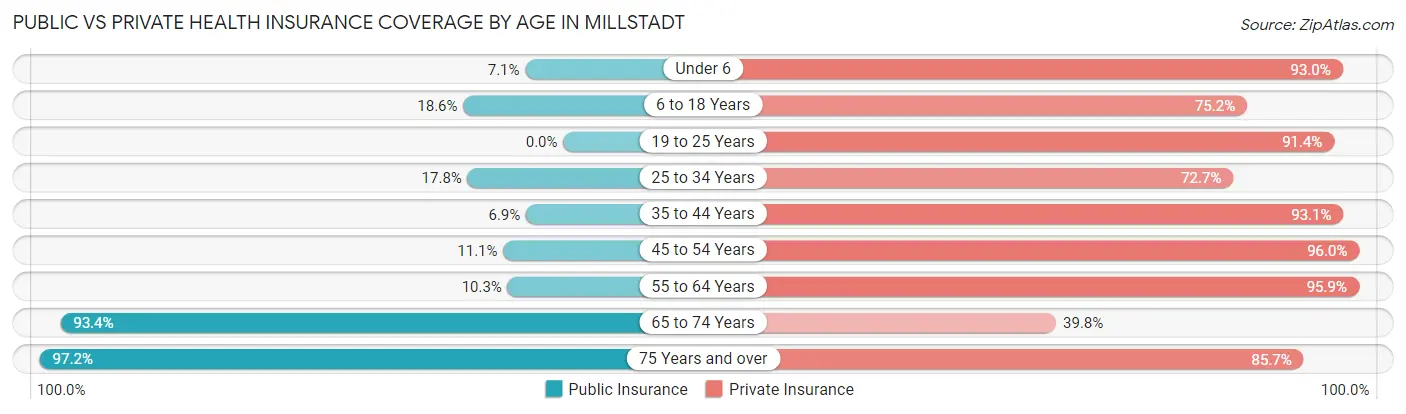
| Age Bracket | Public Insurance | Private Insurance |
| Under 6 | 11 (7.0%) | 145 (92.9%) |
| 6 to 18 Years | 137 (18.6%) | 555 (75.2%) |
| 19 to 25 Years | 0 (0.0%) | 191 (91.4%) |
| 25 to 34 Years | 87 (17.8%) | 356 (72.7%) |
| 35 to 44 Years | 30 (6.9%) | 404 (93.1%) |
| 45 to 54 Years | 87 (11.1%) | 751 (96.0%) |
| 55 to 64 Years | 56 (10.3%) | 520 (95.9%) |
| 65 to 74 Years | 338 (93.4%) | 144 (39.8%) |
| 75 Years and over | 313 (97.2%) | 276 (85.7%) |
| Total | 1,059 (26.3%) | 3,342 (82.8%) |
Disability Status by Sex by Age in Millstadt
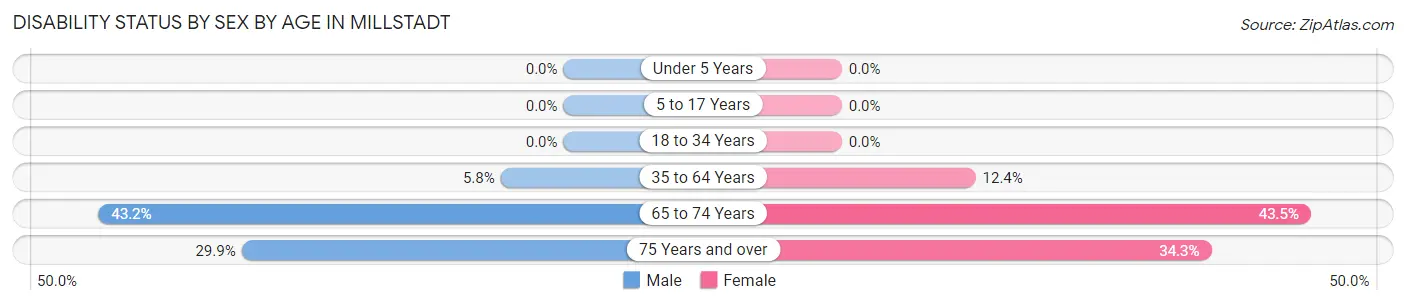
| Age Bracket | Male | Female |
| Under 5 Years | 0 (0.0%) | 0 (0.0%) |
| 5 to 17 Years | 0 (0.0%) | 0 (0.0%) |
| 18 to 34 Years | 0 (0.0%) | 0 (0.0%) |
| 35 to 64 Years | 49 (5.8%) | 114 (12.4%) |
| 65 to 74 Years | 63 (43.1%) | 94 (43.5%) |
| 75 Years and over | 23 (29.9%) | 84 (34.3%) |
Disability Class by Sex by Age in Millstadt
Disability Class: Hearing Difficulty
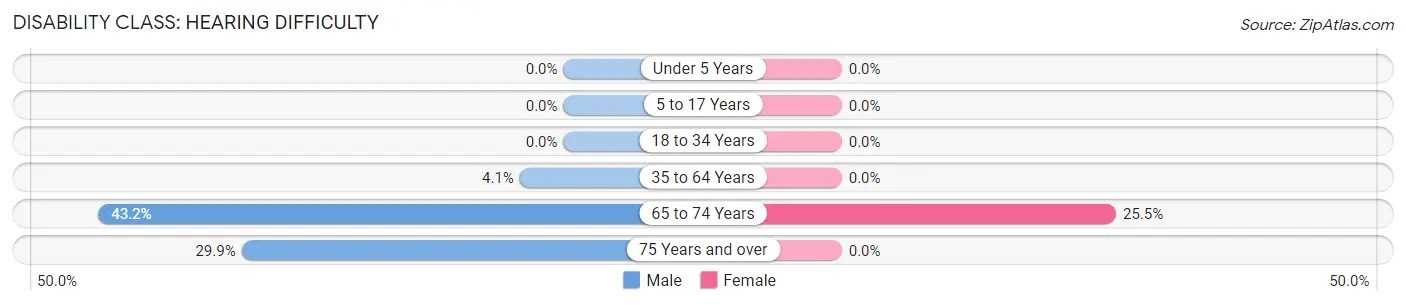
| Age Bracket | Male | Female |
| Under 5 Years | 0 (0.0%) | 0 (0.0%) |
| 5 to 17 Years | 0 (0.0%) | 0 (0.0%) |
| 18 to 34 Years | 0 (0.0%) | 0 (0.0%) |
| 35 to 64 Years | 34 (4.1%) | 0 (0.0%) |
| 65 to 74 Years | 63 (43.1%) | 55 (25.5%) |
| 75 Years and over | 23 (29.9%) | 0 (0.0%) |
Disability Class: Vision Difficulty
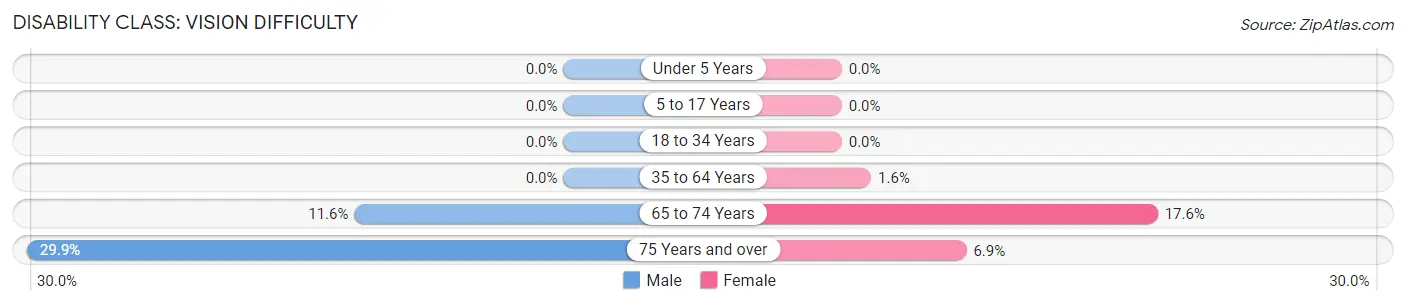
| Age Bracket | Male | Female |
| Under 5 Years | 0 (0.0%) | 0 (0.0%) |
| 5 to 17 Years | 0 (0.0%) | 0 (0.0%) |
| 18 to 34 Years | 0 (0.0%) | 0 (0.0%) |
| 35 to 64 Years | 0 (0.0%) | 15 (1.6%) |
| 65 to 74 Years | 17 (11.6%) | 38 (17.6%) |
| 75 Years and over | 23 (29.9%) | 17 (6.9%) |
Disability Class: Cognitive Difficulty
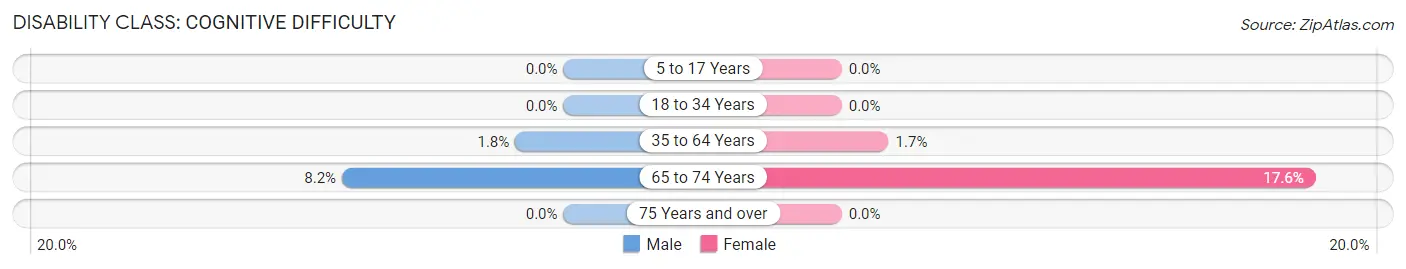
| Age Bracket | Male | Female |
| 5 to 17 Years | 0 (0.0%) | 0 (0.0%) |
| 18 to 34 Years | 0 (0.0%) | 0 (0.0%) |
| 35 to 64 Years | 15 (1.8%) | 16 (1.7%) |
| 65 to 74 Years | 12 (8.2%) | 38 (17.6%) |
| 75 Years and over | 0 (0.0%) | 0 (0.0%) |
Disability Class: Ambulatory Difficulty
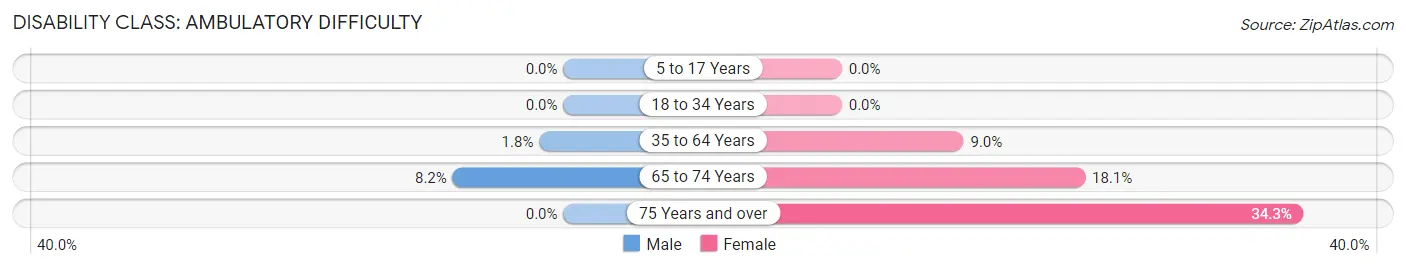
| Age Bracket | Male | Female |
| 5 to 17 Years | 0 (0.0%) | 0 (0.0%) |
| 18 to 34 Years | 0 (0.0%) | 0 (0.0%) |
| 35 to 64 Years | 15 (1.8%) | 83 (9.0%) |
| 65 to 74 Years | 12 (8.2%) | 39 (18.1%) |
| 75 Years and over | 0 (0.0%) | 84 (34.3%) |
Disability Class: Self-Care Difficulty
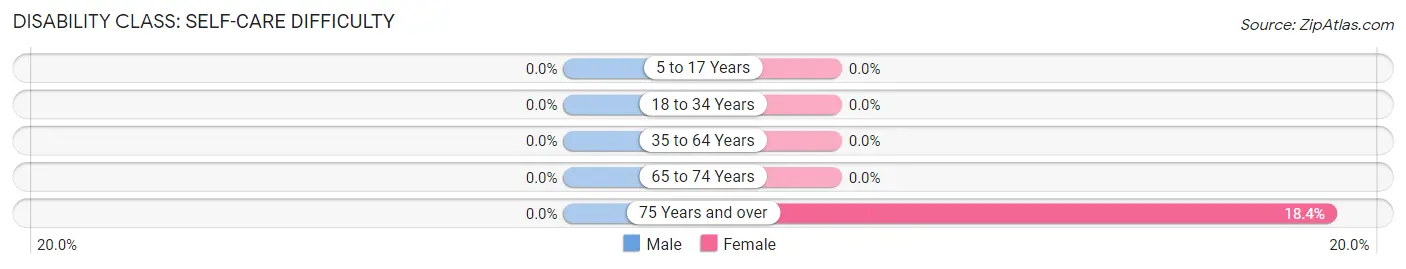
| Age Bracket | Male | Female |
| 5 to 17 Years | 0 (0.0%) | 0 (0.0%) |
| 18 to 34 Years | 0 (0.0%) | 0 (0.0%) |
| 35 to 64 Years | 0 (0.0%) | 0 (0.0%) |
| 65 to 74 Years | 0 (0.0%) | 0 (0.0%) |
| 75 Years and over | 0 (0.0%) | 45 (18.4%) |
Technology Access in Millstadt
Computing Device Access in Millstadt
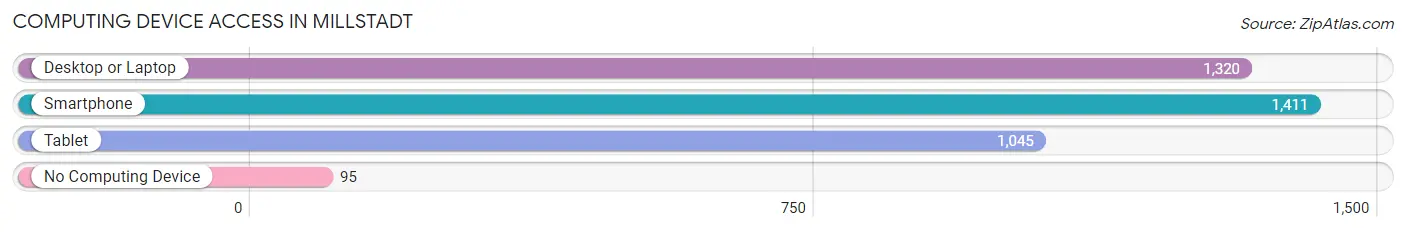
| Device Type | # Households | % Households |
| Desktop or Laptop | 1,320 | 82.8% |
| Smartphone | 1,411 | 88.5% |
| Tablet | 1,045 | 65.5% |
| No Computing Device | 95 | 6.0% |
| Total | 1,595 | 100.0% |
Internet Access in Millstadt
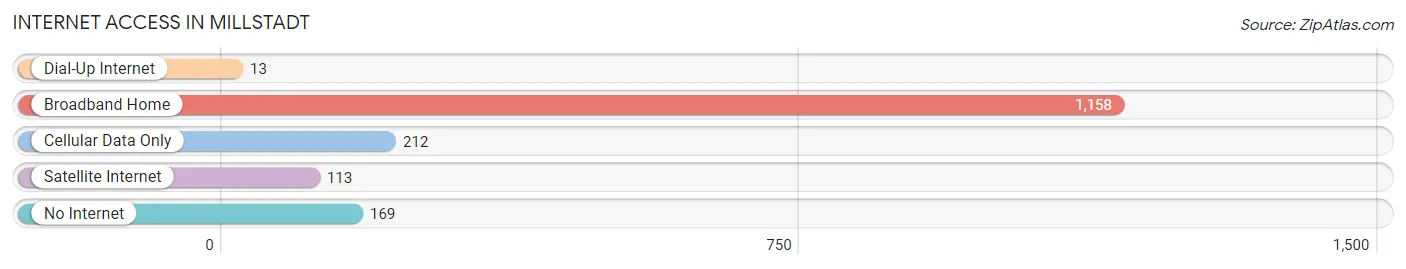
| Internet Type | # Households | % Households |
| Dial-Up Internet | 13 | 0.8% |
| Broadband Home | 1,158 | 72.6% |
| Cellular Data Only | 212 | 13.3% |
| Satellite Internet | 113 | 7.1% |
| No Internet | 169 | 10.6% |
| Total | 1,595 | 100.0% |
Millstadt Summary
History
The village of Millstadt, Illinois is located in St. Clair County, approximately 20 miles east of St. Louis. The village was founded in 1855 by German immigrants who had come to the area to work in the coal mines. The village was named after the nearby Mill Creek, which was used to power the local grist mill. The village was incorporated in 1867 and has since grown to a population of over 4,000 people.
The village of Millstadt has a rich history of industry and agriculture. In the late 1800s, the village was home to several coal mines, brickyards, and a brewery. The village was also home to several large farms, which produced a variety of crops, including corn, wheat, and hay. In the early 1900s, the village was home to several large manufacturing companies, including a shoe factory, a canning factory, and a furniture factory.
The village of Millstadt has also been home to several notable people, including former Illinois Governor Richard Ogilvie, who was born in the village in 1930. The village is also home to the Millstadt Historical Society, which was founded in 1975 and is dedicated to preserving the history of the village.
Geography
Millstadt is located in St. Clair County, Illinois, approximately 20 miles east of St. Louis. The village is situated on the banks of Mill Creek, which flows through the village and is used to power the local grist mill. The village is located in the American Bottom region of the state, which is characterized by flat, fertile land. The village is surrounded by several small towns, including Belleville, Freeburg, and O’Fallon.
The village of Millstadt covers an area of 1.3 square miles and has a population of over 4,000 people. The village is located at an elevation of 590 feet above sea level. The climate in Millstadt is characterized by hot, humid summers and cold, wet winters.
Economy
The economy of Millstadt is largely based on agriculture and manufacturing. The village is home to several large farms, which produce a variety of crops, including corn, wheat, and hay. The village is also home to several manufacturing companies, including a shoe factory, a canning factory, and a furniture factory.
The village is also home to several small businesses, including restaurants, shops, and service providers. The village is also home to several large employers, including the Millstadt School District, the Millstadt Public Library, and the Millstadt Medical Center.
Demographics
As of the 2010 census, the village of Millstadt had a population of 4,068 people. The population is largely white (94.3%), with small percentages of African American (2.2%), Asian (1.2%), and Hispanic (1.3%) residents. The median household income in the village is $50,945, and the median age is 40.7 years. The village has a high rate of homeownership (77.3%) and a low rate of poverty (7.2%).
Common Questions
What is Per Capita Income in Millstadt?
Per Capita income in Millstadt is $51,362.
What is the Median Family Income in Millstadt?
Median Family Income in Millstadt is $116,392.
What is the Median Household income in Millstadt?
Median Household Income in Millstadt is $97,031.
What is Income or Wage Gap in Millstadt?
Income or Wage Gap in Millstadt is 0.8%.
Women in Millstadt earn 99.2 cents for every dollar earned by a man.
What is Inequality or Gini Index in Millstadt?
Inequality or Gini Index in Millstadt is 0.41.
What is the Total Population of Millstadt?
Total Population of Millstadt is 4,035.
What is the Total Male Population of Millstadt?
Total Male Population of Millstadt is 1,892.
What is the Total Female Population of Millstadt?
Total Female Population of Millstadt is 2,143.
What is the Ratio of Males per 100 Females in Millstadt?
There are 88.29 Males per 100 Females in Millstadt.
What is the Ratio of Females per 100 Males in Millstadt?
There are 113.27 Females per 100 Males in Millstadt.
What is the Median Population Age in Millstadt?
Median Population Age in Millstadt is 44.4 Years.
What is the Average Family Size in Millstadt
Average Family Size in Millstadt is 3.0 People.
What is the Average Household Size in Millstadt
Average Household Size in Millstadt is 2.5 People.
How Large is the Labor Force in Millstadt?
There are 2,457 People in the Labor Forcein in Millstadt.
What is the Percentage of People in the Labor Force in Millstadt?
69.8% of People are in the Labor Force in Millstadt.
What is the Unemployment Rate in Millstadt?
Unemployment Rate in Millstadt is 4.5%.