Little York, IL Map & Demographics
Little York Map
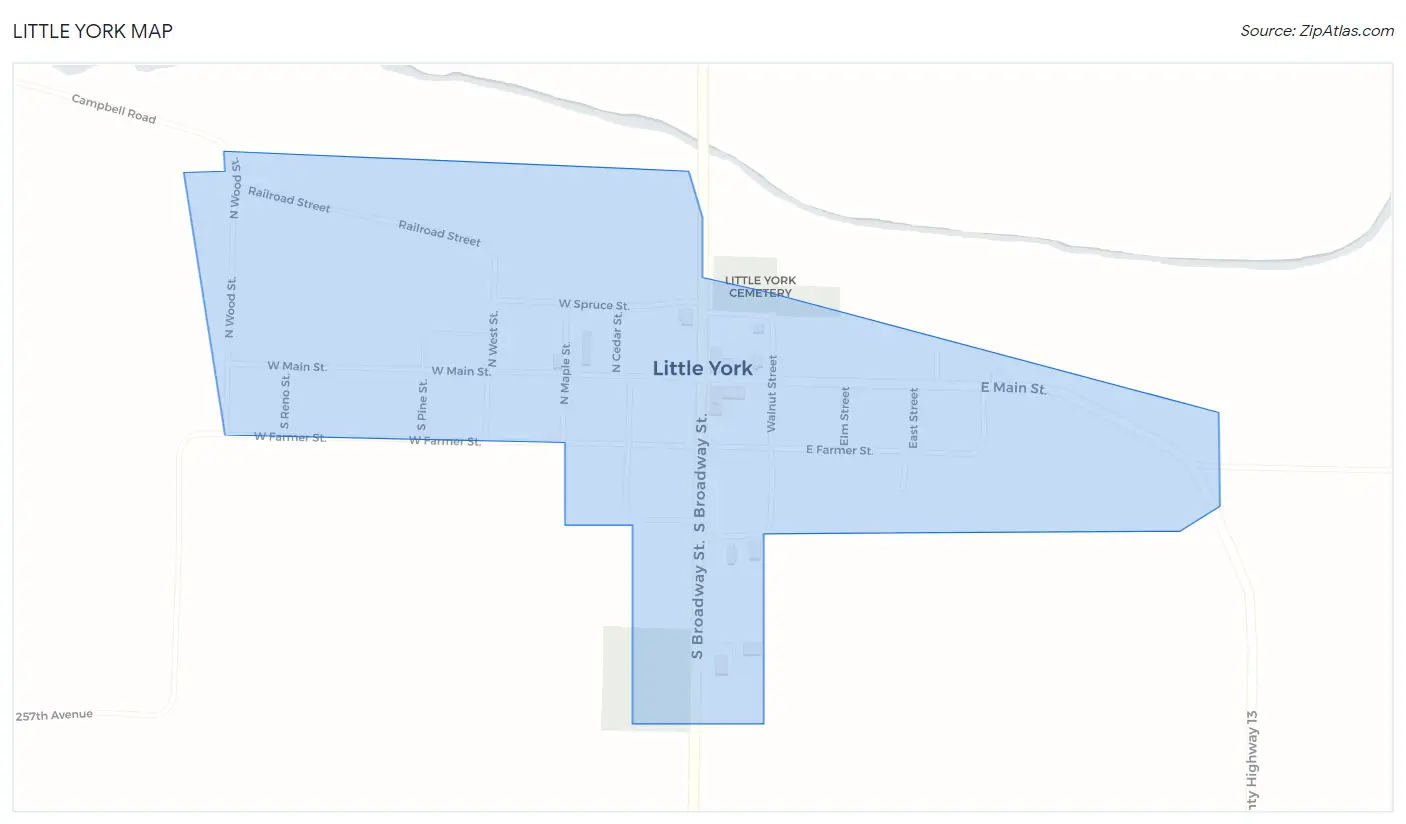
Little York Overview
$30,071
PER CAPITA INCOME
$61,875
AVG FAMILY INCOME
$52,375
AVG HOUSEHOLD INCOME
9.3%
WAGE / INCOME GAP [ % ]
90.7¢/ $1
WAGE / INCOME GAP [ $ ]
0.41
INEQUALITY / GINI INDEX
402
TOTAL POPULATION
200
MALE POPULATION
202
FEMALE POPULATION
99.01
MALES / 100 FEMALES
101.00
FEMALES / 100 MALES
27.3
MEDIAN AGE
3.2
AVG FAMILY SIZE
2.5
AVG HOUSEHOLD SIZE
198
LABOR FORCE [ PEOPLE ]
63.9%
PERCENT IN LABOR FORCE
2.0%
UNEMPLOYMENT RATE
Little York Zip Codes
Little York Area Codes
Income in Little York
Income Overview in Little York
Per Capita Income in Little York is $30,071, while median incomes of families and households are $61,875 and $52,375 respectively.
| Characteristic | Number | Measure |
| Per Capita Income | 402 | $30,071 |
| Median Family Income | 99 | $61,875 |
| Mean Family Income | 99 | $88,055 |
| Median Household Income | 163 | $52,375 |
| Mean Household Income | 163 | $74,055 |
| Income Deficit | 99 | $0 |
| Wage / Income Gap (%) | 402 | 9.30% |
| Wage / Income Gap ($) | 402 | 90.70¢ per $1 |
| Gini / Inequality Index | 402 | 0.41 |
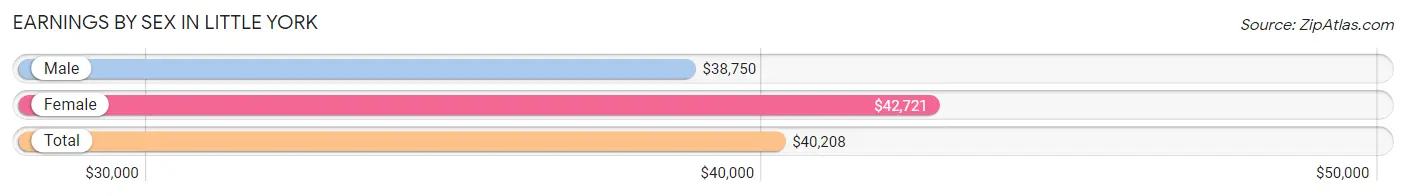
Earnings by Sex in Little York
Average Earnings in Little York are $40,208, $38,750 for men and $42,721 for women, a difference of 9.3%.
| Sex | Number | Average Earnings |
| Male | 102 (49.8%) | $38,750 |
| Female | 103 (50.2%) | $42,721 |
| Total | 205 (100.0%) | $40,208 |
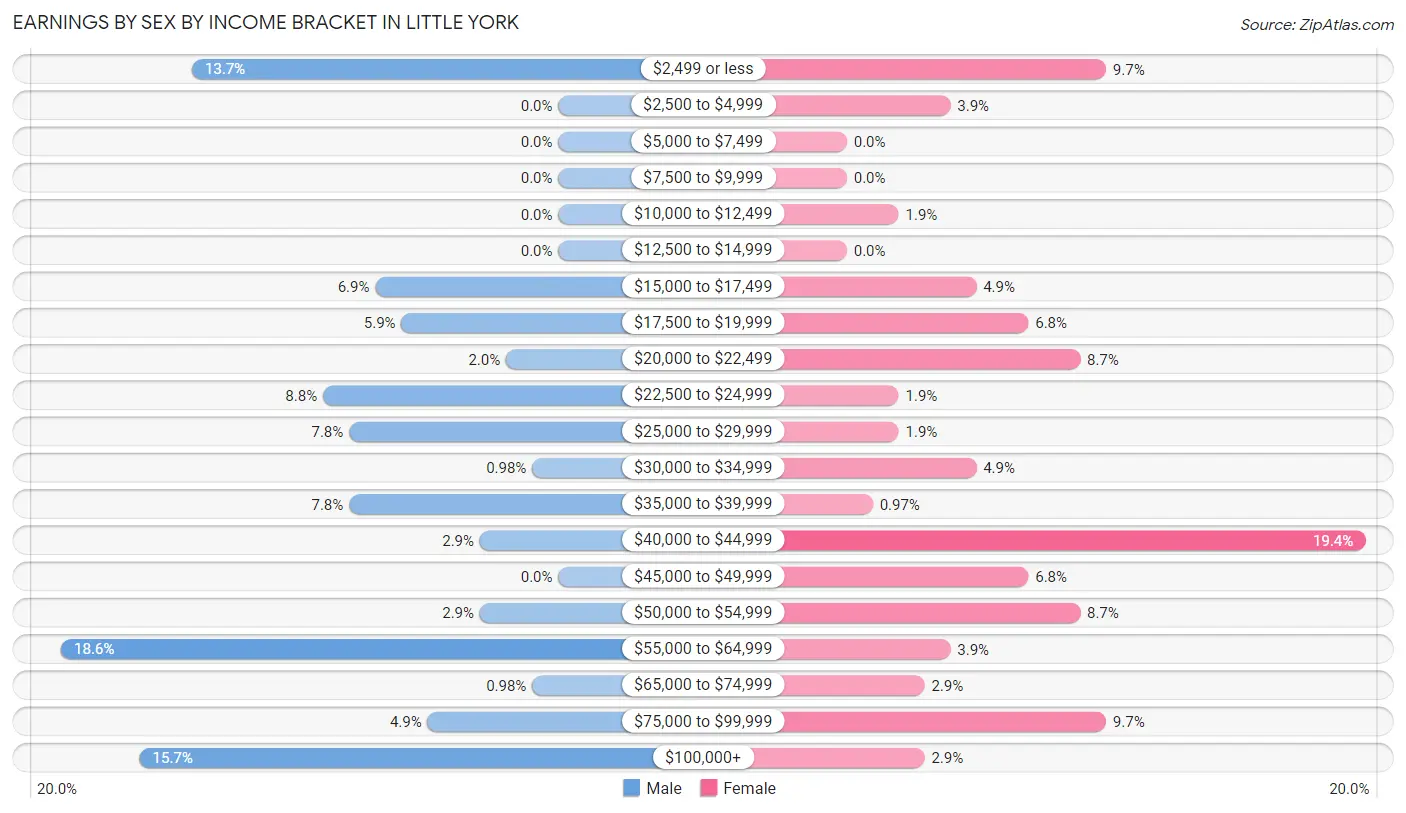
Earnings by Sex by Income Bracket in Little York
The most common earnings brackets in Little York are $55,000 to $64,999 for men (19 | 18.6%) and $40,000 to $44,999 for women (20 | 19.4%).
| Income | Male | Female |
| $2,499 or less | 14 (13.7%) | 10 (9.7%) |
| $2,500 to $4,999 | 0 (0.0%) | 4 (3.9%) |
| $5,000 to $7,499 | 0 (0.0%) | 0 (0.0%) |
| $7,500 to $9,999 | 0 (0.0%) | 0 (0.0%) |
| $10,000 to $12,499 | 0 (0.0%) | 2 (1.9%) |
| $12,500 to $14,999 | 0 (0.0%) | 0 (0.0%) |
| $15,000 to $17,499 | 7 (6.9%) | 5 (4.9%) |
| $17,500 to $19,999 | 6 (5.9%) | 7 (6.8%) |
| $20,000 to $22,499 | 2 (2.0%) | 9 (8.7%) |
| $22,500 to $24,999 | 9 (8.8%) | 2 (1.9%) |
| $25,000 to $29,999 | 8 (7.8%) | 2 (1.9%) |
| $30,000 to $34,999 | 1 (1.0%) | 5 (4.9%) |
| $35,000 to $39,999 | 8 (7.8%) | 1 (1.0%) |
| $40,000 to $44,999 | 3 (2.9%) | 20 (19.4%) |
| $45,000 to $49,999 | 0 (0.0%) | 7 (6.8%) |
| $50,000 to $54,999 | 3 (2.9%) | 9 (8.7%) |
| $55,000 to $64,999 | 19 (18.6%) | 4 (3.9%) |
| $65,000 to $74,999 | 1 (1.0%) | 3 (2.9%) |
| $75,000 to $99,999 | 5 (4.9%) | 10 (9.7%) |
| $100,000+ | 16 (15.7%) | 3 (2.9%) |
| Total | 102 (100.0%) | 103 (100.0%) |
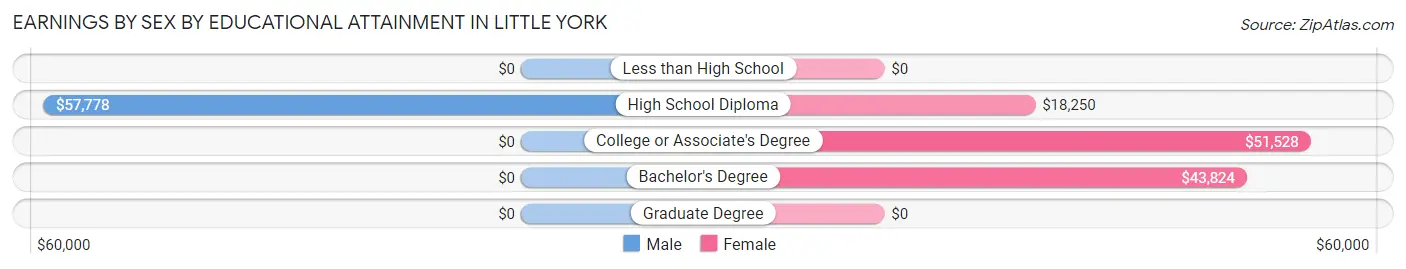
Earnings by Sex by Educational Attainment in Little York
Average earnings in Little York are $55,000 for men and $43,750 for women, a difference of 20.4%. Men with an educational attainment of high school diploma enjoy the highest average annual earnings of $57,778, while those with high school diploma education earn the least with $57,778. Women with an educational attainment of college or associate's degree earn the most with the average annual earnings of $51,528, while those with high school diploma education have the smallest earnings of $18,250.
| Educational Attainment | Male Income | Female Income |
| Less than High School | - | - |
| High School Diploma | $57,778 | $18,250 |
| College or Associate's Degree | - | - |
| Bachelor's Degree | - | - |
| Graduate Degree | - | - |
| Total | $55,000 | $43,750 |
Family Income in Little York
Family Income Brackets in Little York
According to the Little York family income data, there are 29 families falling into the $35,000 to $49,999 income range, which is the most common income bracket and makes up 29.3% of all families.
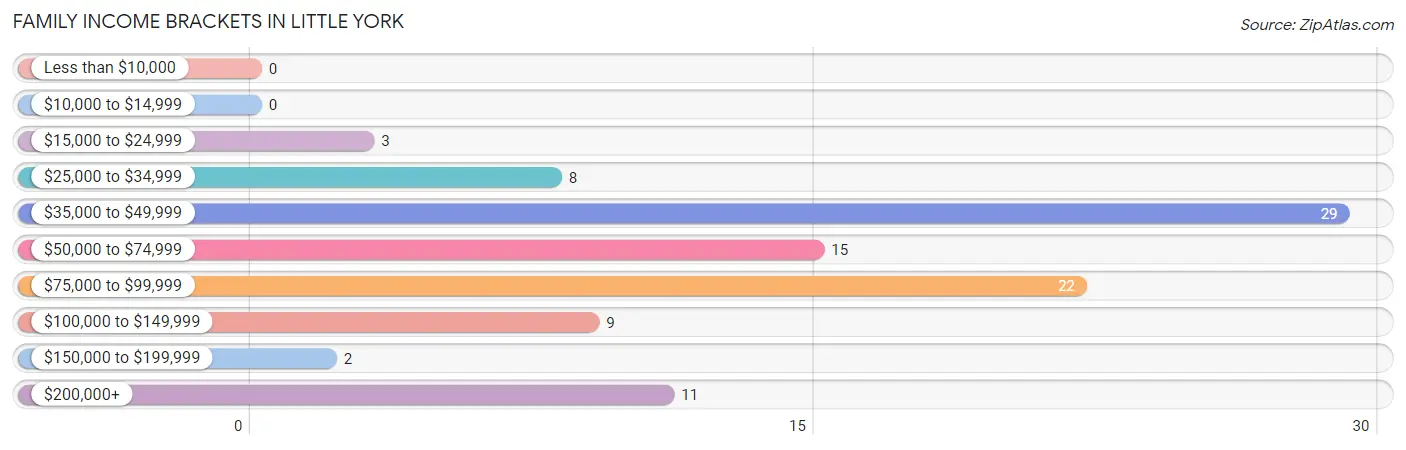
| Income Bracket | # Families | % Families |
| Less than $10,000 | 0 | 0.0% |
| $10,000 to $14,999 | 0 | 0.0% |
| $15,000 to $24,999 | 3 | 3.0% |
| $25,000 to $34,999 | 8 | 8.1% |
| $35,000 to $49,999 | 29 | 29.3% |
| $50,000 to $74,999 | 15 | 15.2% |
| $75,000 to $99,999 | 22 | 22.2% |
| $100,000 to $149,999 | 9 | 9.1% |
| $150,000 to $199,999 | 2 | 2.0% |
| $200,000+ | 11 | 11.1% |
Family Income by Famaliy Size in Little York
4-person families (31 | 31.3%) account for the highest median family income in Little York with $70,625 per family, while 2-person families (42 | 42.4%) have the highest median income of $28,125 per family member.
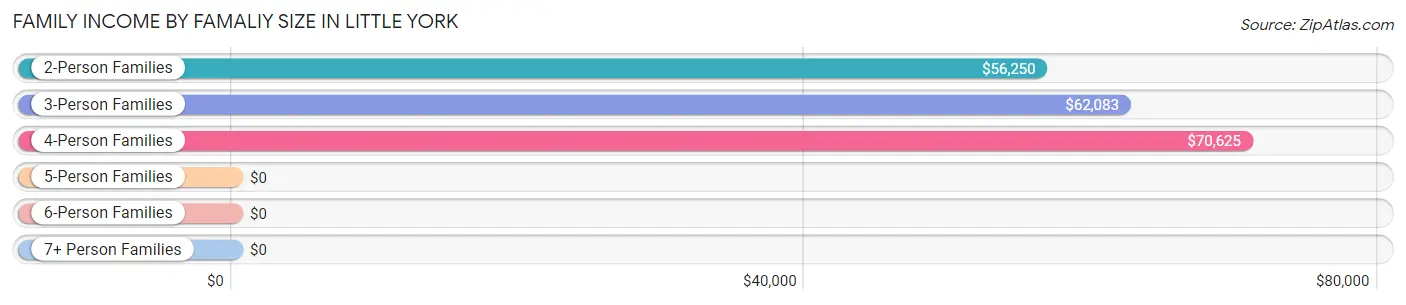
| Income Bracket | # Families | Median Income |
| 2-Person Families | 42 (42.4%) | $56,250 |
| 3-Person Families | 23 (23.2%) | $62,083 |
| 4-Person Families | 31 (31.3%) | $70,625 |
| 5-Person Families | 0 (0.0%) | $0 |
| 6-Person Families | 1 (1.0%) | $0 |
| 7+ Person Families | 2 (2.0%) | $0 |
| Total | 99 (100.0%) | $61,875 |
Family Income by Number of Earners in Little York
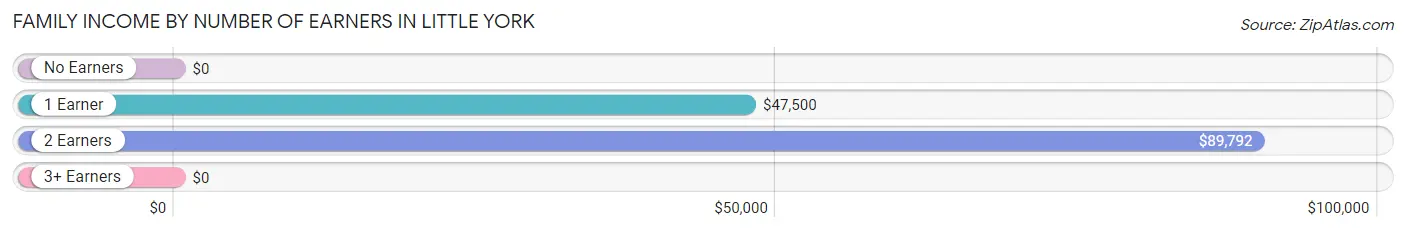
| Number of Earners | # Families | Median Income |
| No Earners | 5 (5.1%) | $0 |
| 1 Earner | 64 (64.6%) | $47,500 |
| 2 Earners | 23 (23.2%) | $89,792 |
| 3+ Earners | 7 (7.1%) | $0 |
| Total | 99 (100.0%) | $61,875 |
Household Income in Little York
Household Income Brackets in Little York
With 46 households falling in the category, the $35,000 to $49,999 income range is the most frequent in Little York, accounting for 28.2% of all households. In contrast, only 3 households (1.8%) fall into the $25,000 to $34,999 income bracket, making it the least populous group.
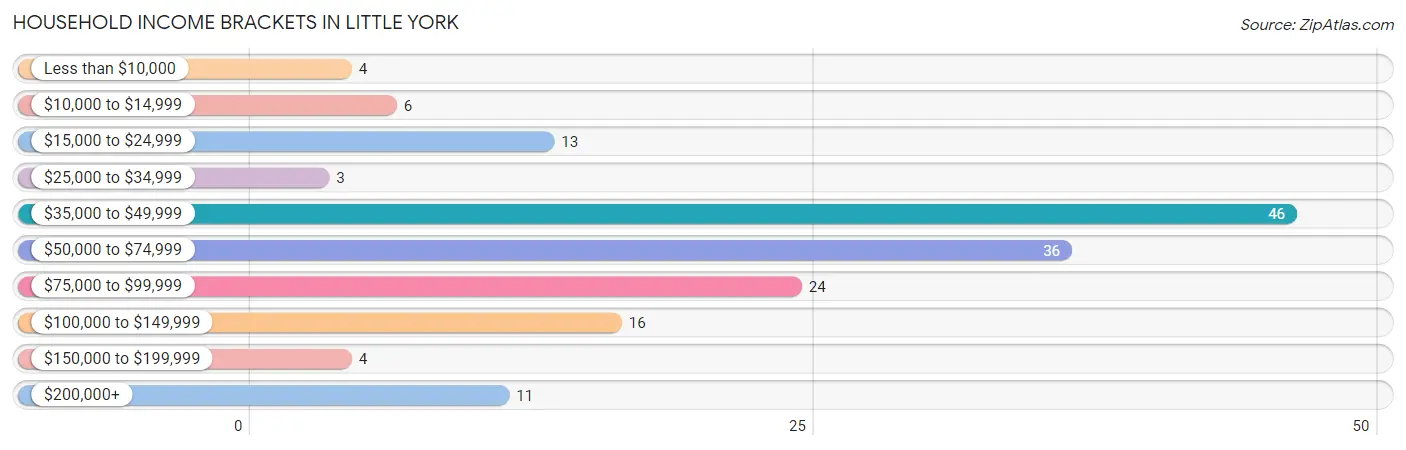
| Income Bracket | # Households | % Households |
| Less than $10,000 | 4 | 2.5% |
| $10,000 to $14,999 | 6 | 3.7% |
| $15,000 to $24,999 | 13 | 8.0% |
| $25,000 to $34,999 | 3 | 1.8% |
| $35,000 to $49,999 | 46 | 28.2% |
| $50,000 to $74,999 | 36 | 22.1% |
| $75,000 to $99,999 | 24 | 14.7% |
| $100,000 to $149,999 | 16 | 9.8% |
| $150,000 to $199,999 | 4 | 2.5% |
| $200,000+ | 11 | 6.7% |
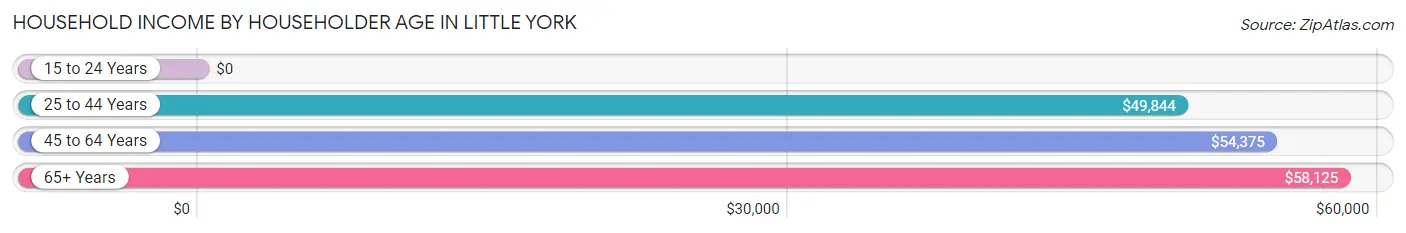
Household Income by Householder Age in Little York
The median household income in Little York is $52,375, with the highest median household income of $58,125 found in the 65+ years age bracket for the primary householder. A total of 30 households (18.4%) fall into this category. Meanwhile, the 15 to 24 years age bracket for the primary householder has the lowest median household income of $0, with 10 households (6.1%) in this group.
| Income Bracket | # Households | Median Income |
| 15 to 24 Years | 10 (6.1%) | $0 |
| 25 to 44 Years | 71 (43.6%) | $49,844 |
| 45 to 64 Years | 52 (31.9%) | $54,375 |
| 65+ Years | 30 (18.4%) | $58,125 |
| Total | 163 (100.0%) | $52,375 |
Poverty in Little York
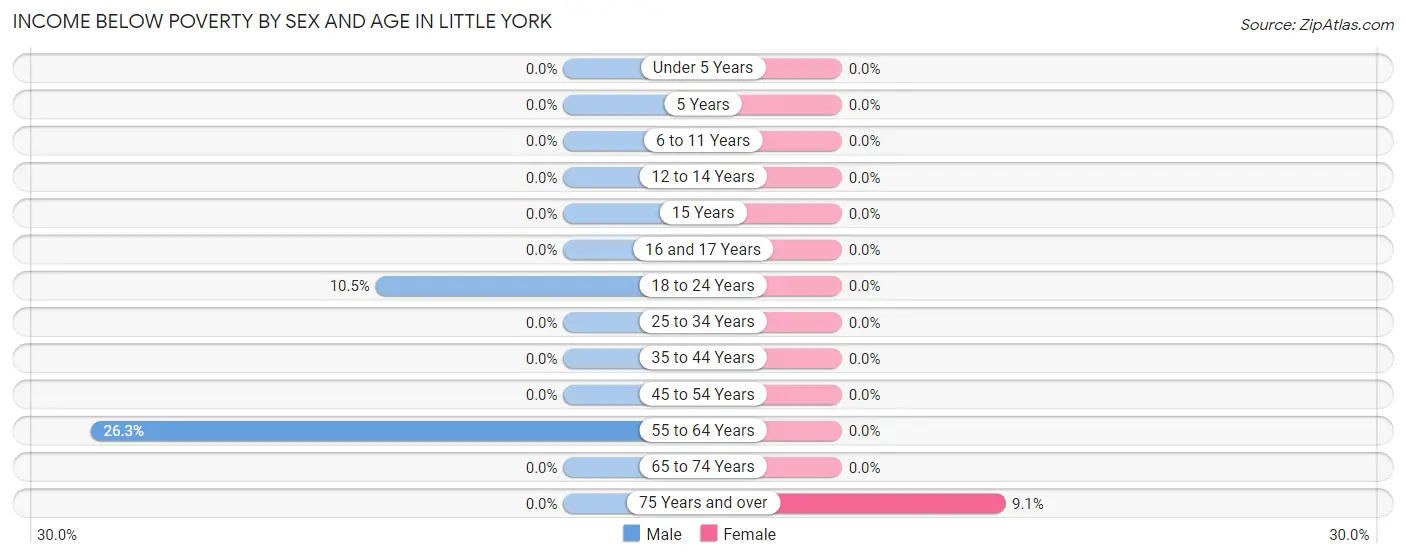
Income Below Poverty by Sex and Age in Little York
With 6.0% poverty level for males and 0.5% for females among the residents of Little York, 55 to 64 year old males and 75 year old and over females are the most vulnerable to poverty, with 5 males (26.3%) and 1 females (9.1%) in their respective age groups living below the poverty level.
| Age Bracket | Male | Female |
| Under 5 Years | 0 (0.0%) | 0 (0.0%) |
| 5 Years | 0 (0.0%) | 0 (0.0%) |
| 6 to 11 Years | 0 (0.0%) | 0 (0.0%) |
| 12 to 14 Years | 0 (0.0%) | 0 (0.0%) |
| 15 Years | 0 (0.0%) | 0 (0.0%) |
| 16 and 17 Years | 0 (0.0%) | 0 (0.0%) |
| 18 to 24 Years | 7 (10.4%) | 0 (0.0%) |
| 25 to 34 Years | 0 (0.0%) | 0 (0.0%) |
| 35 to 44 Years | 0 (0.0%) | 0 (0.0%) |
| 45 to 54 Years | 0 (0.0%) | 0 (0.0%) |
| 55 to 64 Years | 5 (26.3%) | 0 (0.0%) |
| 65 to 74 Years | 0 (0.0%) | 0 (0.0%) |
| 75 Years and over | 0 (0.0%) | 1 (9.1%) |
| Total | 12 (6.0%) | 1 (0.5%) |
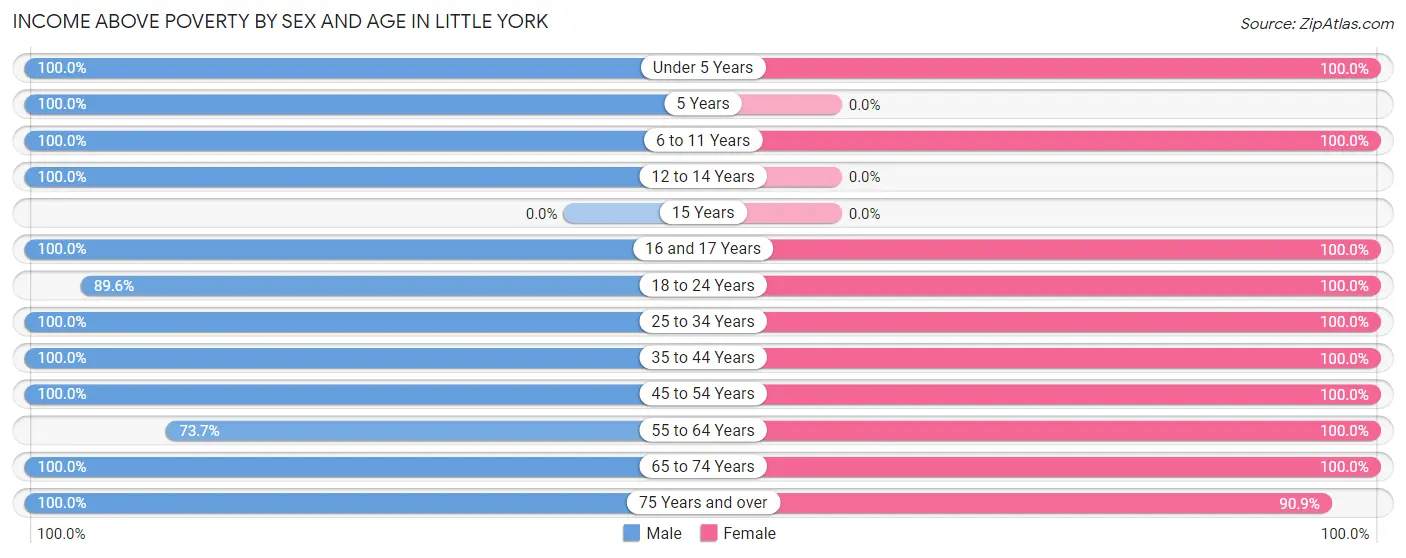
Income Above Poverty by Sex and Age in Little York
According to the poverty statistics in Little York, males aged under 5 years and females aged under 5 years are the age groups that are most secure financially, with 100.0% of males and 100.0% of females in these age groups living above the poverty line.
| Age Bracket | Male | Female |
| Under 5 Years | 15 (100.0%) | 45 (100.0%) |
| 5 Years | 2 (100.0%) | 0 (0.0%) |
| 6 to 11 Years | 12 (100.0%) | 13 (100.0%) |
| 12 to 14 Years | 5 (100.0%) | 0 (0.0%) |
| 15 Years | 0 (0.0%) | 0 (0.0%) |
| 16 and 17 Years | 6 (100.0%) | 3 (100.0%) |
| 18 to 24 Years | 60 (89.5%) | 11 (100.0%) |
| 25 to 34 Years | 22 (100.0%) | 36 (100.0%) |
| 35 to 44 Years | 8 (100.0%) | 29 (100.0%) |
| 45 to 54 Years | 20 (100.0%) | 14 (100.0%) |
| 55 to 64 Years | 14 (73.7%) | 26 (100.0%) |
| 65 to 74 Years | 17 (100.0%) | 14 (100.0%) |
| 75 Years and over | 7 (100.0%) | 10 (90.9%) |
| Total | 188 (94.0%) | 201 (99.5%) |
Income Below Poverty Among Married-Couple Families in Little York
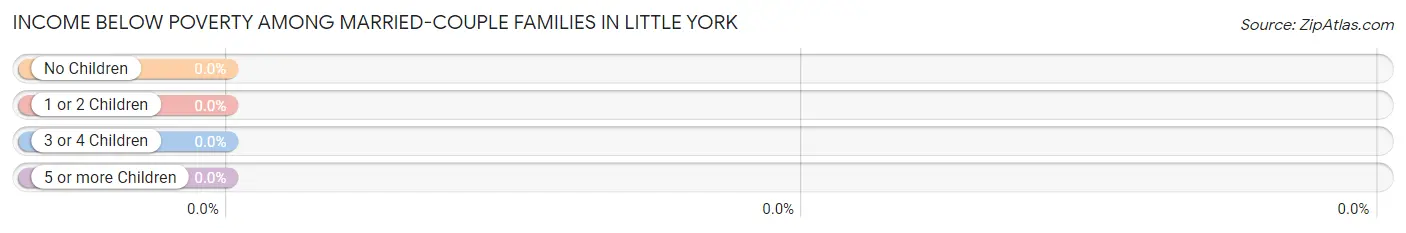
| Children | Above Poverty | Below Poverty |
| No Children | 36 (100.0%) | 0 (0.0%) |
| 1 or 2 Children | 7 (100.0%) | 0 (0.0%) |
| 3 or 4 Children | 1 (100.0%) | 0 (0.0%) |
| 5 or more Children | 2 (100.0%) | 0 (0.0%) |
| Total | 46 (100.0%) | 0 (0.0%) |
Income Below Poverty Among Single-Parent Households in Little York
| Children | Single Father | Single Mother |
| No Children | 0 (0.0%) | 0 (0.0%) |
| 1 or 2 Children | 0 (0.0%) | 0 (0.0%) |
| 3 or 4 Children | 0 (0.0%) | 0 (0.0%) |
| 5 or more Children | 0 (0.0%) | 0 (0.0%) |
| Total | 0 (0.0%) | 0 (0.0%) |
Income Below Poverty Among Married-Couple vs Single-Parent Households in Little York
| Children | Married-Couple Families | Single-Parent Households |
| No Children | 0 (0.0%) | 0 (0.0%) |
| 1 or 2 Children | 0 (0.0%) | 0 (0.0%) |
| 3 or 4 Children | 0 (0.0%) | 0 (0.0%) |
| 5 or more Children | 0 (0.0%) | 0 (0.0%) |
| Total | 0 (0.0%) | 0 (0.0%) |
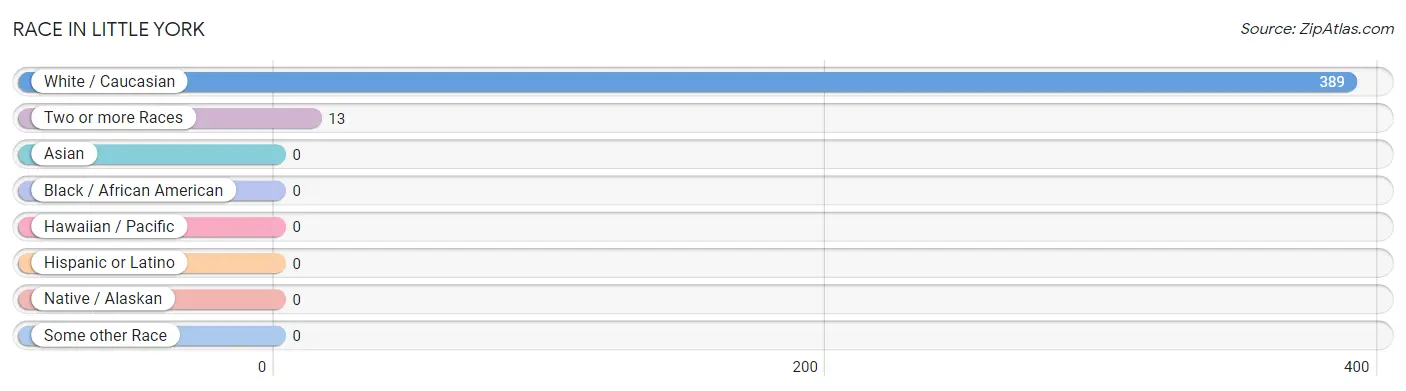
Race in Little York
The most populous races in Little York are White / Caucasian (389 | 96.8%), and Two or more Races (13 | 3.2%).
| Race | # Population | % Population |
| Asian | 0 | 0.0% |
| Black / African American | 0 | 0.0% |
| Hawaiian / Pacific | 0 | 0.0% |
| Hispanic or Latino | 0 | 0.0% |
| Native / Alaskan | 0 | 0.0% |
| White / Caucasian | 389 | 96.8% |
| Two or more Races | 13 | 3.2% |
| Some other Race | 0 | 0.0% |
| Total | 402 | 100.0% |
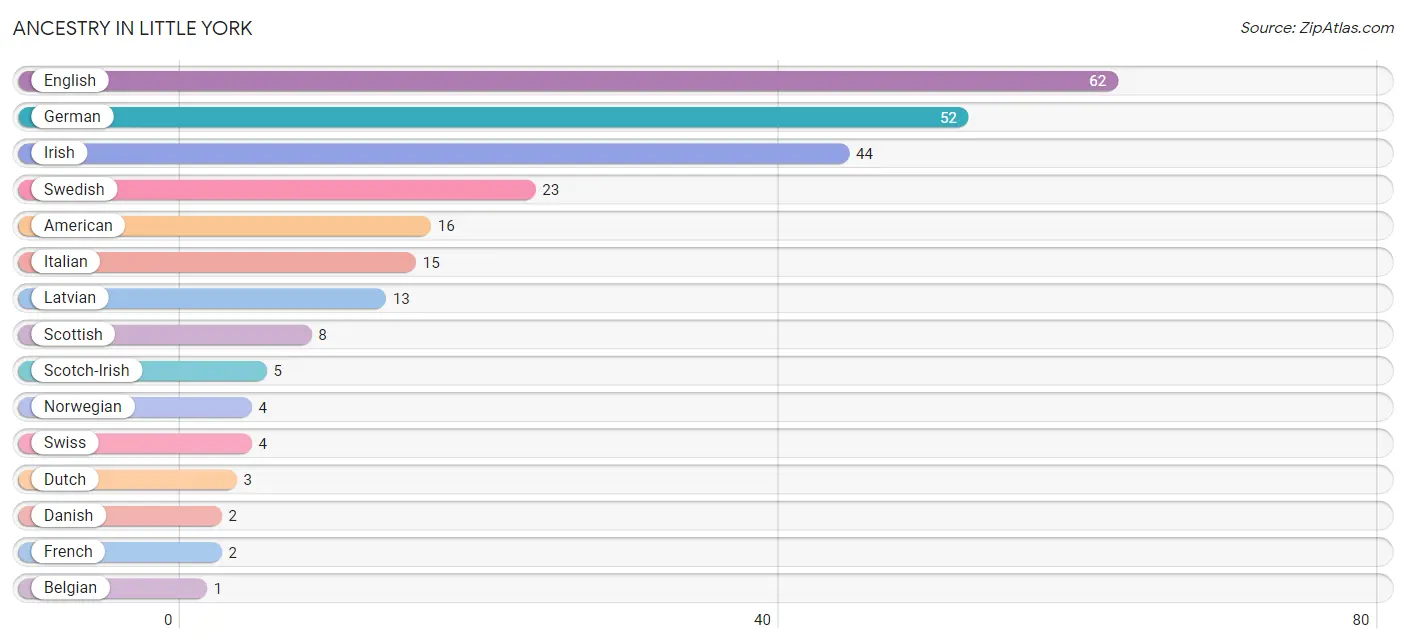
Ancestry in Little York
The most populous ancestries reported in Little York are English (62 | 15.4%), German (52 | 12.9%), Irish (44 | 11.0%), Swedish (23 | 5.7%), and American (16 | 4.0%), together accounting for 49.0% of all Little York residents.
| Ancestry | # Population | % Population |
| American | 16 | 4.0% |
| Belgian | 1 | 0.3% |
| Danish | 2 | 0.5% |
| Dutch | 3 | 0.7% |
| English | 62 | 15.4% |
| European | 1 | 0.3% |
| French | 2 | 0.5% |
| German | 52 | 12.9% |
| Irish | 44 | 11.0% |
| Italian | 15 | 3.7% |
| Latvian | 13 | 3.2% |
| Norwegian | 4 | 1.0% |
| Scotch-Irish | 5 | 1.2% |
| Scottish | 8 | 2.0% |
| Swedish | 23 | 5.7% |
| Swiss | 4 | 1.0% | View All 16 Rows |
Immigrants in Little York

| Immigration Origin | # Population | % Population | View All 0 Rows |
Sex and Age in Little York
Sex and Age in Little York
The most populous age groups in Little York are 15 to 19 Years (55 | 27.5%) for men and Under 5 Years (45 | 22.3%) for women.
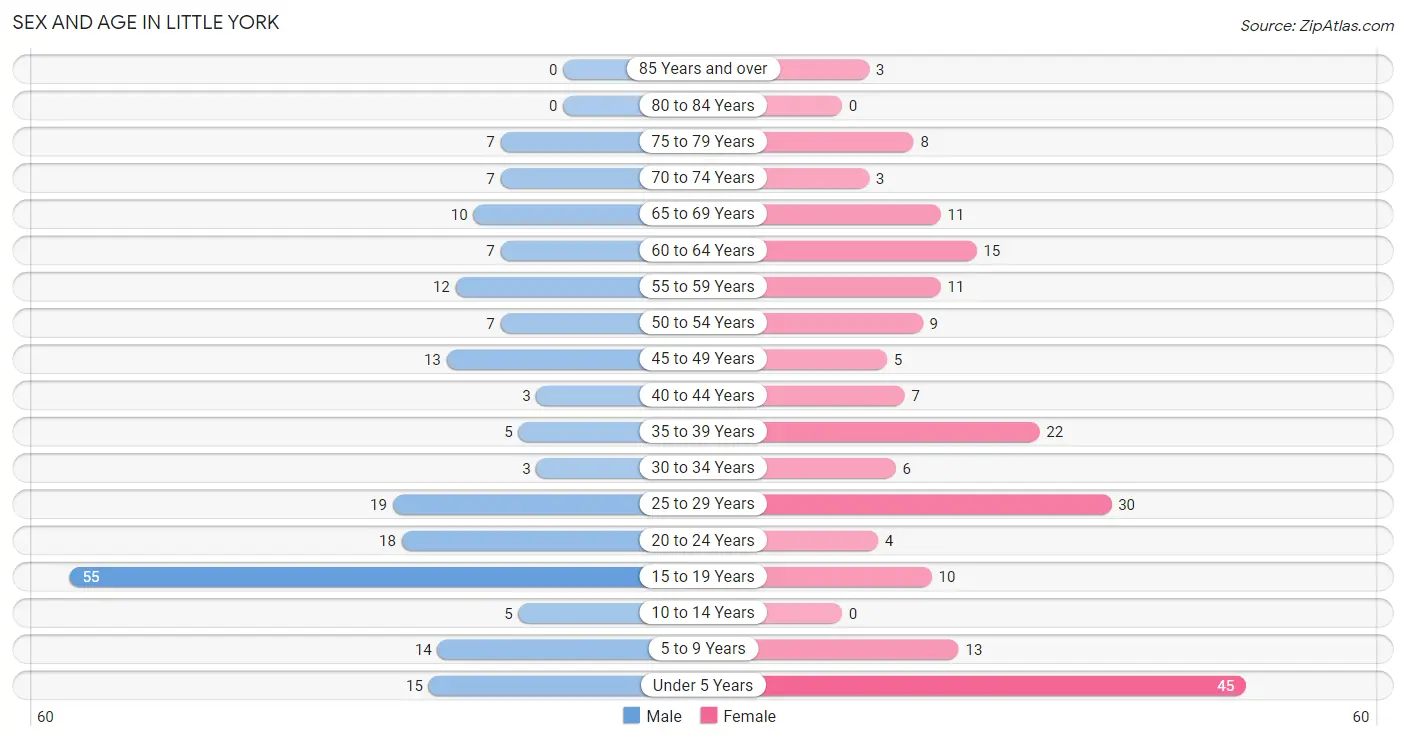
| Age Bracket | Male | Female |
| Under 5 Years | 15 (7.5%) | 45 (22.3%) |
| 5 to 9 Years | 14 (7.0%) | 13 (6.4%) |
| 10 to 14 Years | 5 (2.5%) | 0 (0.0%) |
| 15 to 19 Years | 55 (27.5%) | 10 (5.0%) |
| 20 to 24 Years | 18 (9.0%) | 4 (2.0%) |
| 25 to 29 Years | 19 (9.5%) | 30 (14.8%) |
| 30 to 34 Years | 3 (1.5%) | 6 (3.0%) |
| 35 to 39 Years | 5 (2.5%) | 22 (10.9%) |
| 40 to 44 Years | 3 (1.5%) | 7 (3.5%) |
| 45 to 49 Years | 13 (6.5%) | 5 (2.5%) |
| 50 to 54 Years | 7 (3.5%) | 9 (4.5%) |
| 55 to 59 Years | 12 (6.0%) | 11 (5.4%) |
| 60 to 64 Years | 7 (3.5%) | 15 (7.4%) |
| 65 to 69 Years | 10 (5.0%) | 11 (5.4%) |
| 70 to 74 Years | 7 (3.5%) | 3 (1.5%) |
| 75 to 79 Years | 7 (3.5%) | 8 (4.0%) |
| 80 to 84 Years | 0 (0.0%) | 0 (0.0%) |
| 85 Years and over | 0 (0.0%) | 3 (1.5%) |
| Total | 200 (100.0%) | 202 (100.0%) |
Families and Households in Little York
Median Family Size in Little York
The median family size in Little York is 3.19 persons per family, with single female/mother families (30 | 30.3%) accounting for the largest median family size of 4.2 persons per family. On the other hand, single male/father families (23 | 23.2%) represent the smallest median family size with 2.43 persons per family.
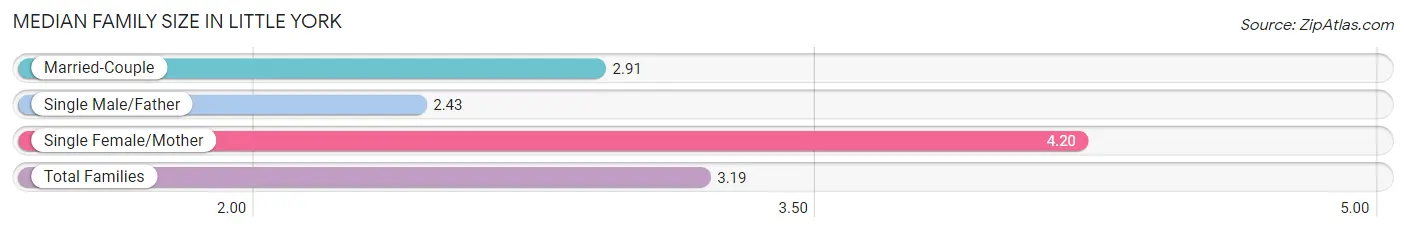
| Family Type | # Families | Family Size |
| Married-Couple | 46 (46.5%) | 2.91 |
| Single Male/Father | 23 (23.2%) | 2.43 |
| Single Female/Mother | 30 (30.3%) | 4.20 |
| Total Families | 99 (100.0%) | 3.19 |
Median Household Size in Little York
The median household size in Little York is 2.47 persons per household, with single female/mother households (30 | 18.4%) accounting for the largest median household size of 4.27 persons per household. non-family households (64 | 39.3%) represent the smallest median household size with 1.11 persons per household.
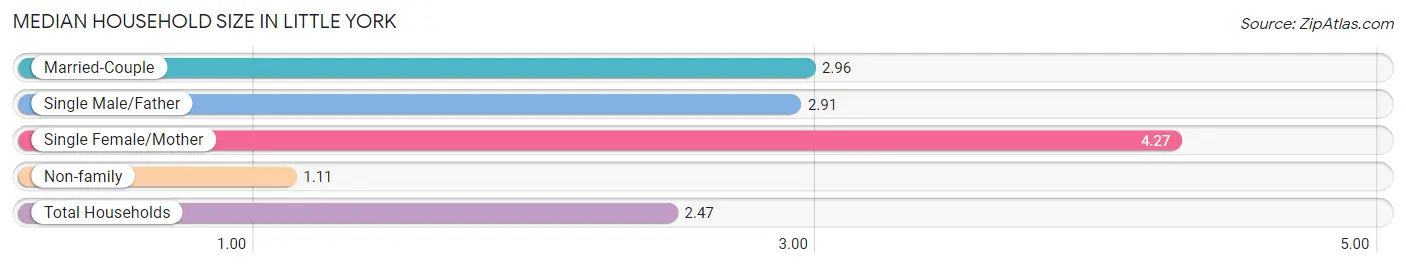
| Household Type | # Households | Household Size |
| Married-Couple | 46 (28.2%) | 2.96 |
| Single Male/Father | 23 (14.1%) | 2.91 |
| Single Female/Mother | 30 (18.4%) | 4.27 |
| Non-family | 64 (39.3%) | 1.11 |
| Total Households | 163 (100.0%) | 2.47 |
Household Size by Marriage Status in Little York
Out of a total of 163 households in Little York, 99 (60.7%) are family households, while 64 (39.3%) are nonfamily households. The most numerous type of family households are 3-person households, comprising 32, and the most common type of nonfamily households are 1-person households, comprising 53.
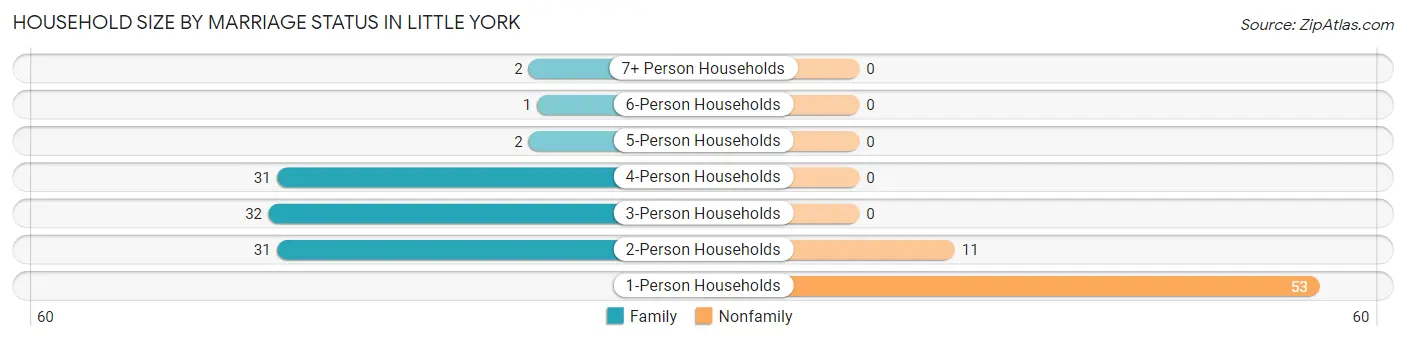
| Household Size | Family Households | Nonfamily Households |
| 1-Person Households | - | 53 (32.5%) |
| 2-Person Households | 31 (19.0%) | 11 (6.8%) |
| 3-Person Households | 32 (19.6%) | 0 (0.0%) |
| 4-Person Households | 31 (19.0%) | 0 (0.0%) |
| 5-Person Households | 2 (1.2%) | 0 (0.0%) |
| 6-Person Households | 1 (0.6%) | 0 (0.0%) |
| 7+ Person Households | 2 (1.2%) | 0 (0.0%) |
| Total | 99 (60.7%) | 64 (39.3%) |
Female Fertility in Little York
Fertility by Age in Little York
Average fertility rate in Little York is 131.0 births per 1,000 women. Women in the age bracket of 20 to 34 years have the highest fertility rate with 275.0 births per 1,000 women. Women in the age bracket of 20 to 34 years acount for 100.0% of all women with births.
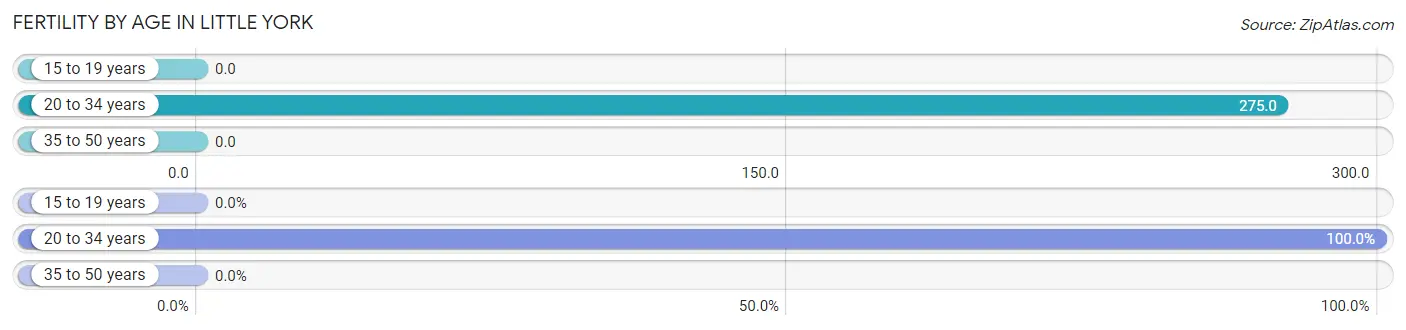
| Age Bracket | Women with Births | Births / 1,000 Women |
| 15 to 19 years | 0 (0.0%) | 0.0 |
| 20 to 34 years | 11 (100.0%) | 275.0 |
| 35 to 50 years | 0 (0.0%) | 0.0 |
| Total | 11 (100.0%) | 131.0 |
Fertility by Age by Marriage Status in Little York
18.2% of women with births (11) in Little York are married. The highest percentage of unmarried women with births falls into 20 to 34 years age bracket with 81.8% of them unmarried at the time of birth, while the lowest percentage of unmarried women with births belong to 20 to 34 years age bracket with 81.8% of them unmarried.
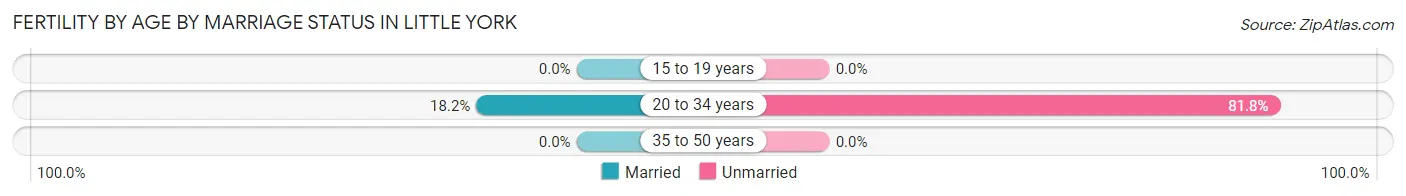
| Age Bracket | Married | Unmarried |
| 15 to 19 years | 0 (0.0%) | 0 (0.0%) |
| 20 to 34 years | 2 (18.2%) | 9 (81.8%) |
| 35 to 50 years | 0 (0.0%) | 0 (0.0%) |
| Total | 2 (18.2%) | 9 (81.8%) |
Fertility by Education in Little York
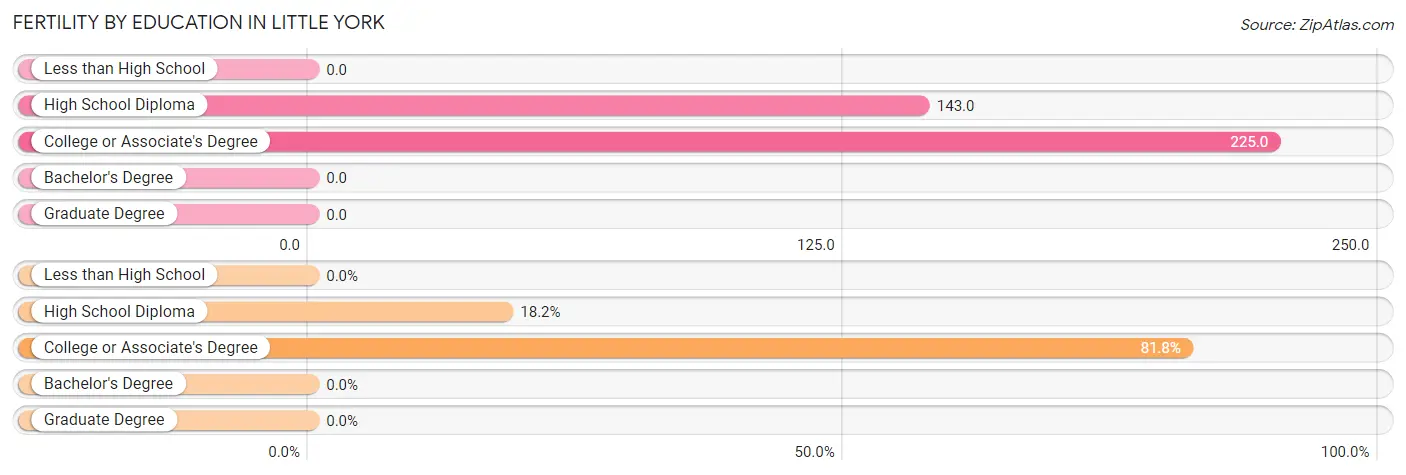
| Educational Attainment | Women with Births | Births / 1,000 Women |
| Less than High School | 0 (0.0%) | 0.0 |
| High School Diploma | 2 (18.2%) | 143.0 |
| College or Associate's Degree | 9 (81.8%) | 225.0 |
| Bachelor's Degree | 0 (0.0%) | 0.0 |
| Graduate Degree | 0 (0.0%) | 0.0 |
| Total | 11 (100.0%) | 131.0 |
Fertility by Education by Marriage Status in Little York
81.8% of women with births in Little York are unmarried. Women with the educational attainment of high school diploma are most likely to be married with 100.0% of them married at childbirth, while women with the educational attainment of college or associate's degree are least likely to be married with 100.0% of them unmarried at childbirth.
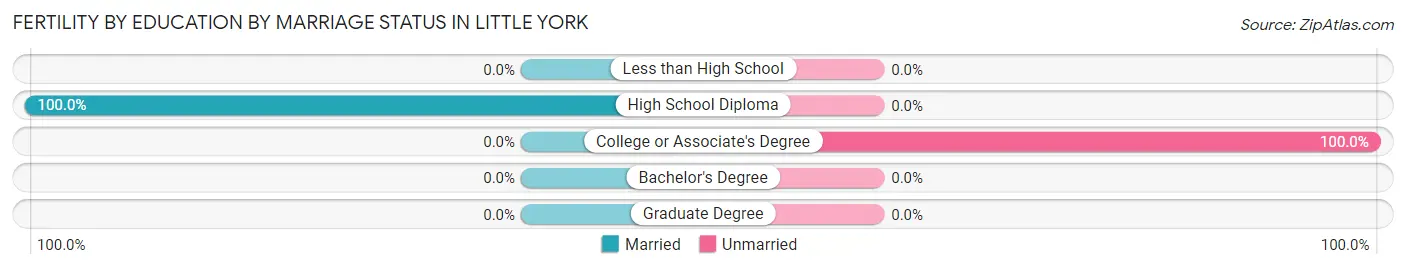
| Educational Attainment | Married | Unmarried |
| Less than High School | 0 (0.0%) | 0 (0.0%) |
| High School Diploma | 2 (100.0%) | 0 (0.0%) |
| College or Associate's Degree | 0 (0.0%) | 9 (100.0%) |
| Bachelor's Degree | 0 (0.0%) | 0 (0.0%) |
| Graduate Degree | 0 (0.0%) | 0 (0.0%) |
| Total | 2 (18.2%) | 9 (81.8%) |
Employment Characteristics in Little York
Employment by Class of Employer in Little York
Among the 192 employed individuals in Little York, private company employees (116 | 60.4%), not-for-profit organizations (38 | 19.8%), and self-employed (not incorporated) (16 | 8.3%) make up the most common classes of employment.
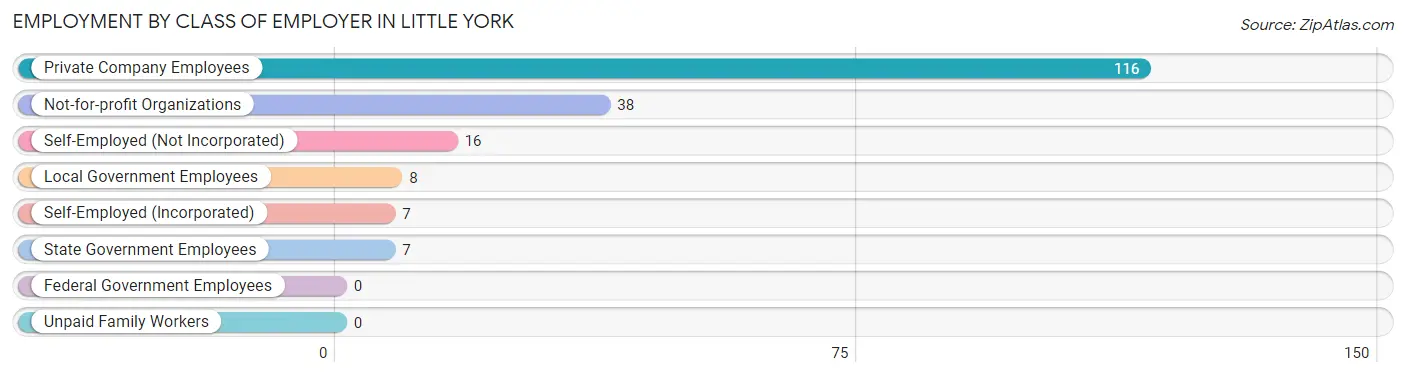
| Employer Class | # Employees | % Employees |
| Private Company Employees | 116 | 60.4% |
| Self-Employed (Incorporated) | 7 | 3.6% |
| Self-Employed (Not Incorporated) | 16 | 8.3% |
| Not-for-profit Organizations | 38 | 19.8% |
| Local Government Employees | 8 | 4.2% |
| State Government Employees | 7 | 3.6% |
| Federal Government Employees | 0 | 0.0% |
| Unpaid Family Workers | 0 | 0.0% |
| Total | 192 | 100.0% |
Employment Status by Age in Little York
According to the labor force statistics for Little York, out of the total population over 16 years of age (310), 63.9% or 198 individuals are in the labor force, with 2.0% or 4 of them unemployed. The age group with the highest labor force participation rate is 30 to 34 years, with 100.0% or 9 individuals in the labor force. Within the labor force, the 16 to 19 years age range has the highest percentage of unemployed individuals, with 20.0% or 4 of them being unemployed.
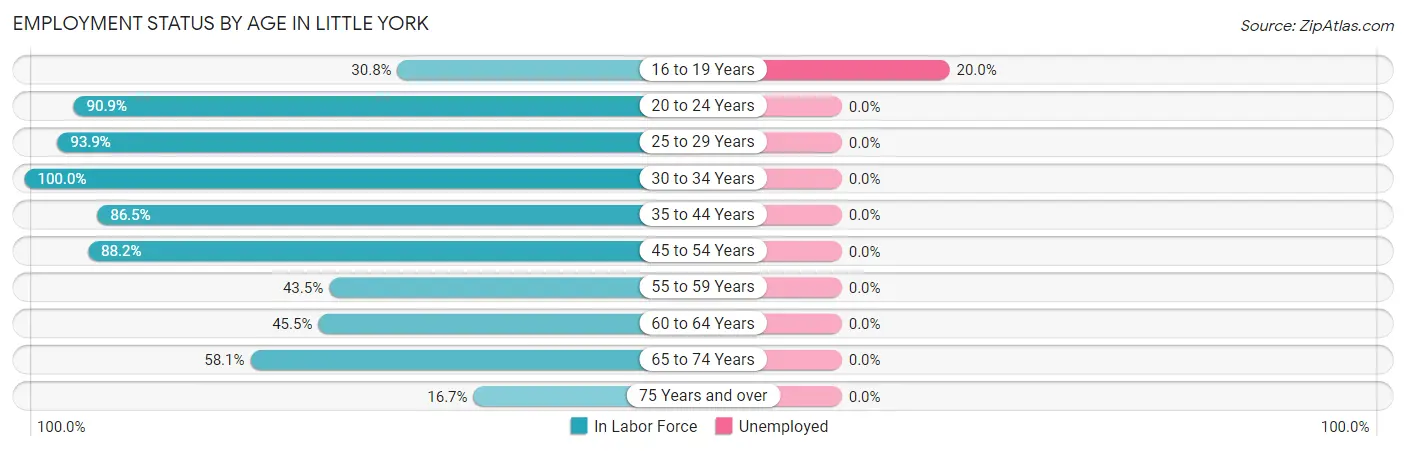
| Age Bracket | In Labor Force | Unemployed |
| 16 to 19 Years | 20 (30.8%) | 4 (20.0%) |
| 20 to 24 Years | 20 (90.9%) | 0 (0.0%) |
| 25 to 29 Years | 46 (93.9%) | 0 (0.0%) |
| 30 to 34 Years | 9 (100.0%) | 0 (0.0%) |
| 35 to 44 Years | 32 (86.5%) | 0 (0.0%) |
| 45 to 54 Years | 30 (88.2%) | 0 (0.0%) |
| 55 to 59 Years | 10 (43.5%) | 0 (0.0%) |
| 60 to 64 Years | 10 (45.5%) | 0 (0.0%) |
| 65 to 74 Years | 18 (58.1%) | 0 (0.0%) |
| 75 Years and over | 3 (16.7%) | 0 (0.0%) |
| Total | 198 (63.9%) | 4 (2.0%) |
Employment Status by Educational Attainment in Little York
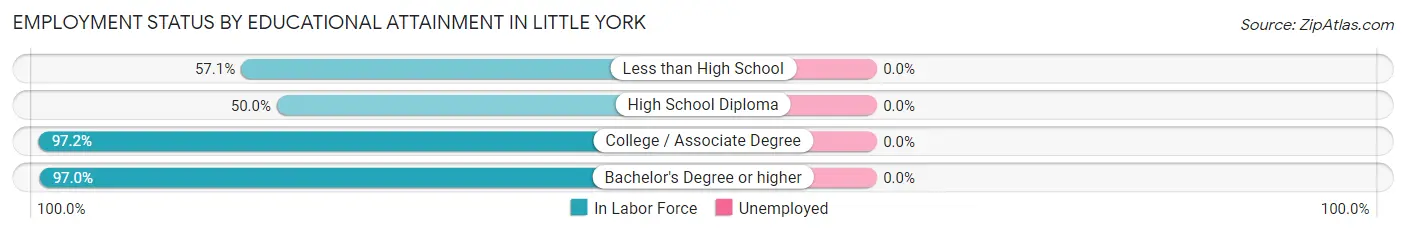
| Educational Attainment | In Labor Force | Unemployed |
| Less than High School | 4 (57.1%) | 0 (0.0%) |
| High School Diploma | 31 (50.0%) | 0 (0.0%) |
| College / Associate Degree | 70 (97.2%) | 0 (0.0%) |
| Bachelor's Degree or higher | 32 (97.0%) | 0 (0.0%) |
| Total | 137 (78.7%) | 0 (0.0%) |
Employment Occupations by Sex in Little York
Management, Business, Science and Arts Occupations
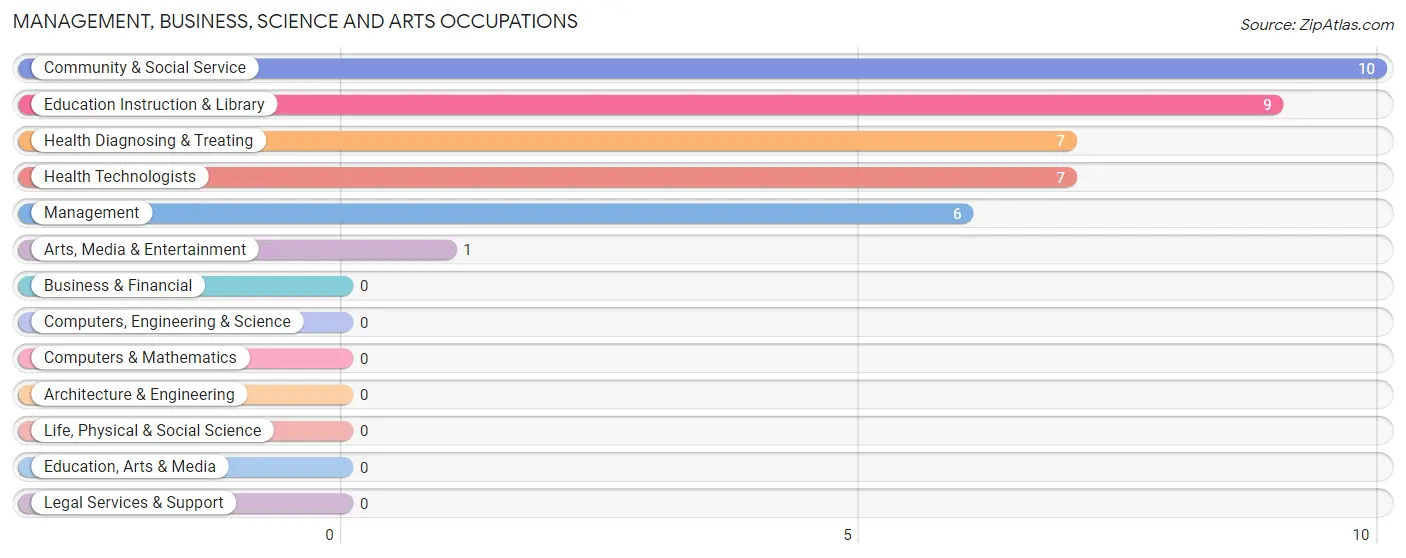
The most common Management, Business, Science and Arts occupations in Little York are Community & Social Service (10 | 5.1%), Education Instruction & Library (9 | 4.6%), Health Diagnosing & Treating (7 | 3.6%), Health Technologists (7 | 3.6%), and Management (6 | 3.1%).
Management, Business, Science and Arts Occupations by Sex
Within the Management, Business, Science and Arts occupations in Little York, the most male-oriented occupations are Arts, Media & Entertainment (100.0%), Community & Social Service (80.0%), and Education Instruction & Library (77.8%), while the most female-oriented occupations are Management (100.0%), Health Diagnosing & Treating (100.0%), and Health Technologists (100.0%).
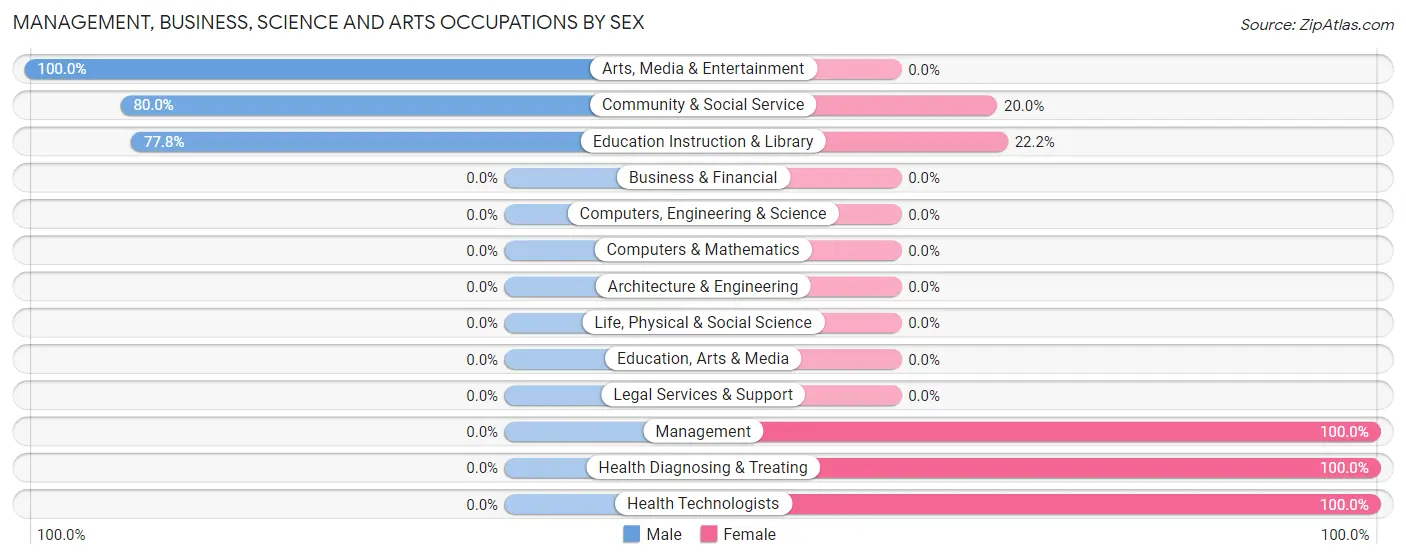
| Occupation | Male | Female |
| Management | 0 (0.0%) | 6 (100.0%) |
| Business & Financial | 0 (0.0%) | 0 (0.0%) |
| Computers, Engineering & Science | 0 (0.0%) | 0 (0.0%) |
| Computers & Mathematics | 0 (0.0%) | 0 (0.0%) |
| Architecture & Engineering | 0 (0.0%) | 0 (0.0%) |
| Life, Physical & Social Science | 0 (0.0%) | 0 (0.0%) |
| Community & Social Service | 8 (80.0%) | 2 (20.0%) |
| Education, Arts & Media | 0 (0.0%) | 0 (0.0%) |
| Legal Services & Support | 0 (0.0%) | 0 (0.0%) |
| Education Instruction & Library | 7 (77.8%) | 2 (22.2%) |
| Arts, Media & Entertainment | 1 (100.0%) | 0 (0.0%) |
| Health Diagnosing & Treating | 0 (0.0%) | 7 (100.0%) |
| Health Technologists | 0 (0.0%) | 7 (100.0%) |
| Total (Category) | 8 (34.8%) | 15 (65.2%) |
| Total (Overall) | 99 (51.0%) | 95 (49.0%) |
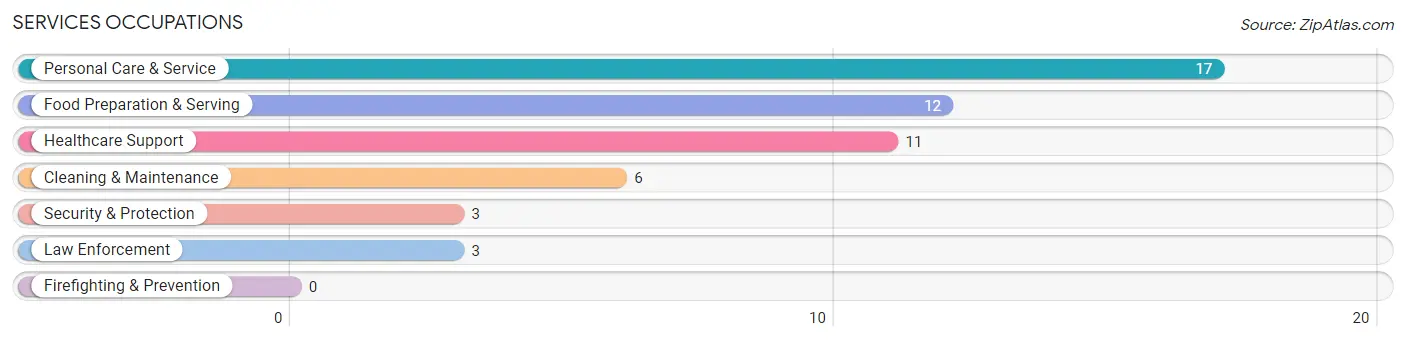
Services Occupations
The most common Services occupations in Little York are Personal Care & Service (17 | 8.8%), Food Preparation & Serving (12 | 6.2%), Healthcare Support (11 | 5.7%), Cleaning & Maintenance (6 | 3.1%), and Security & Protection (3 | 1.5%).
Services Occupations by Sex
Within the Services occupations in Little York, the most male-oriented occupations are Security & Protection (100.0%), Law Enforcement (100.0%), and Cleaning & Maintenance (50.0%), while the most female-oriented occupations are Healthcare Support (100.0%), Food Preparation & Serving (100.0%), and Personal Care & Service (100.0%).
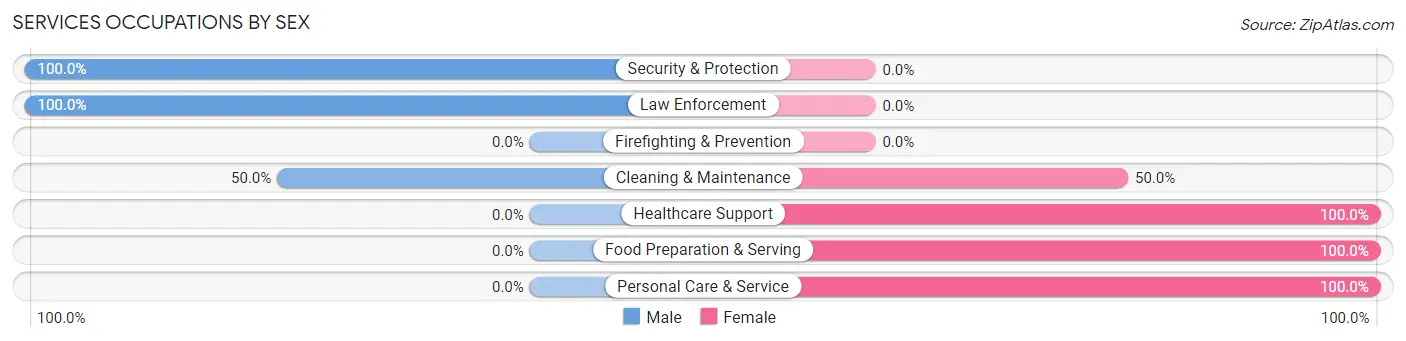
| Occupation | Male | Female |
| Healthcare Support | 0 (0.0%) | 11 (100.0%) |
| Security & Protection | 3 (100.0%) | 0 (0.0%) |
| Firefighting & Prevention | 0 (0.0%) | 0 (0.0%) |
| Law Enforcement | 3 (100.0%) | 0 (0.0%) |
| Food Preparation & Serving | 0 (0.0%) | 12 (100.0%) |
| Cleaning & Maintenance | 3 (50.0%) | 3 (50.0%) |
| Personal Care & Service | 0 (0.0%) | 17 (100.0%) |
| Total (Category) | 6 (12.2%) | 43 (87.8%) |
| Total (Overall) | 99 (51.0%) | 95 (49.0%) |
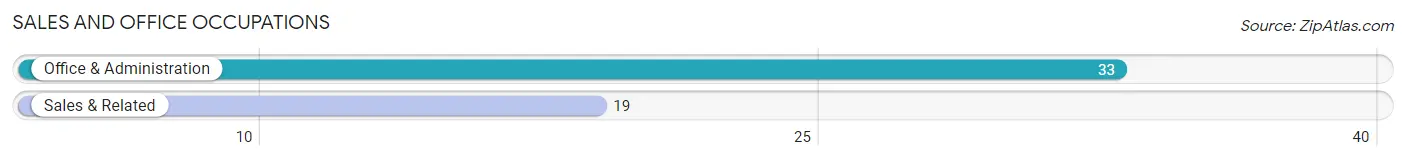
Sales and Office Occupations
The most common Sales and Office occupations in Little York are Office & Administration (33 | 17.0%), and Sales & Related (19 | 9.8%).
Sales and Office Occupations by Sex
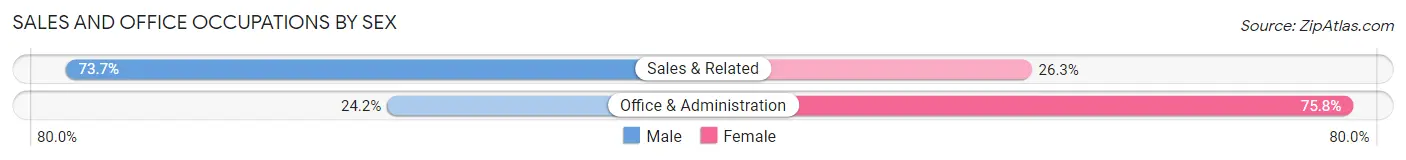
| Occupation | Male | Female |
| Sales & Related | 14 (73.7%) | 5 (26.3%) |
| Office & Administration | 8 (24.2%) | 25 (75.8%) |
| Total (Category) | 22 (42.3%) | 30 (57.7%) |
| Total (Overall) | 99 (51.0%) | 95 (49.0%) |
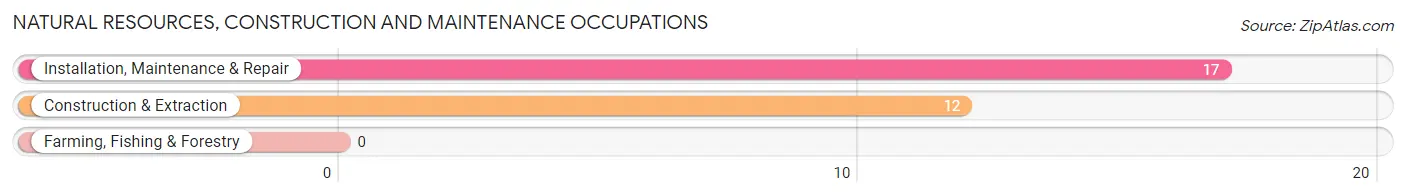
Natural Resources, Construction and Maintenance Occupations
The most common Natural Resources, Construction and Maintenance occupations in Little York are Installation, Maintenance & Repair (17 | 8.8%), and Construction & Extraction (12 | 6.2%).
Natural Resources, Construction and Maintenance Occupations by Sex
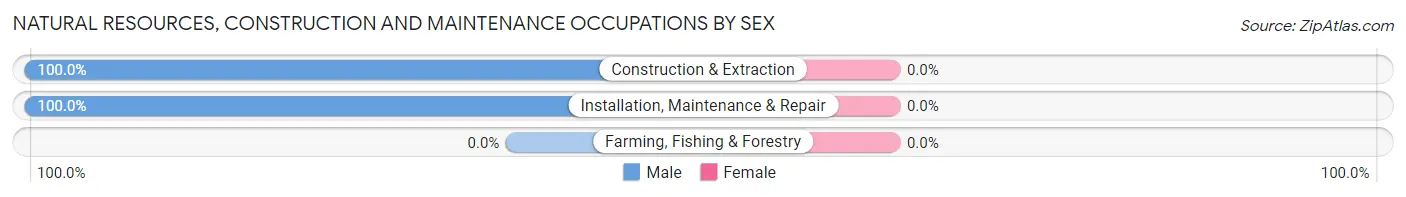
| Occupation | Male | Female |
| Farming, Fishing & Forestry | 0 (0.0%) | 0 (0.0%) |
| Construction & Extraction | 12 (100.0%) | 0 (0.0%) |
| Installation, Maintenance & Repair | 17 (100.0%) | 0 (0.0%) |
| Total (Category) | 29 (100.0%) | 0 (0.0%) |
| Total (Overall) | 99 (51.0%) | 95 (49.0%) |
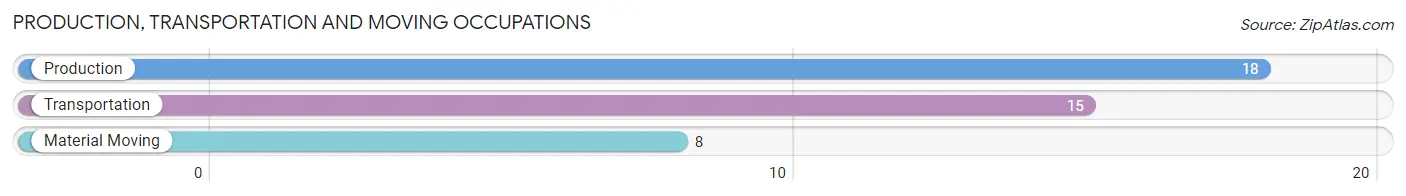
Production, Transportation and Moving Occupations
The most common Production, Transportation and Moving occupations in Little York are Production (18 | 9.3%), Transportation (15 | 7.7%), and Material Moving (8 | 4.1%).
Production, Transportation and Moving Occupations by Sex
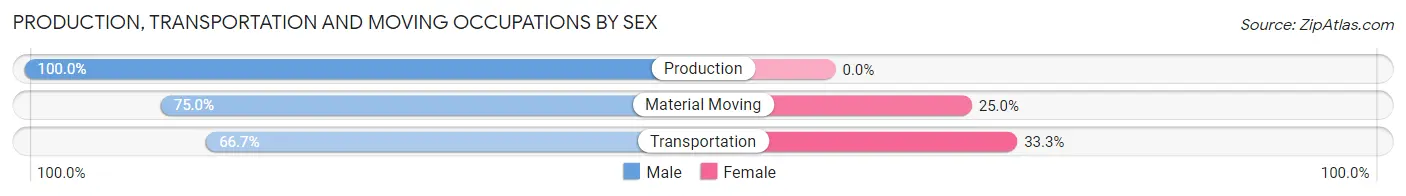
| Occupation | Male | Female |
| Production | 18 (100.0%) | 0 (0.0%) |
| Transportation | 10 (66.7%) | 5 (33.3%) |
| Material Moving | 6 (75.0%) | 2 (25.0%) |
| Total (Category) | 34 (82.9%) | 7 (17.1%) |
| Total (Overall) | 99 (51.0%) | 95 (49.0%) |
Employment Industries by Sex in Little York
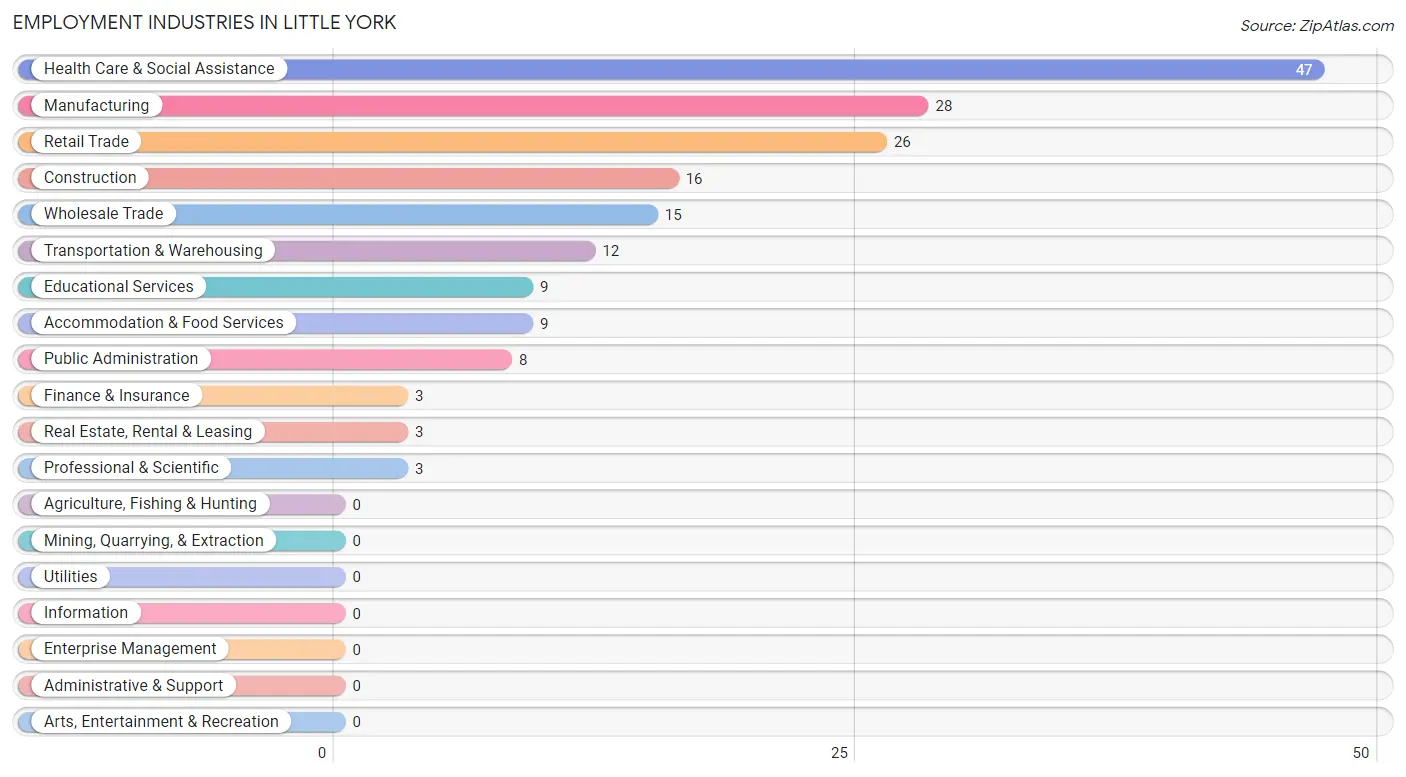
Employment Industries in Little York
The major employment industries in Little York include Health Care & Social Assistance (47 | 24.2%), Manufacturing (28 | 14.4%), Retail Trade (26 | 13.4%), Construction (16 | 8.3%), and Wholesale Trade (15 | 7.7%).
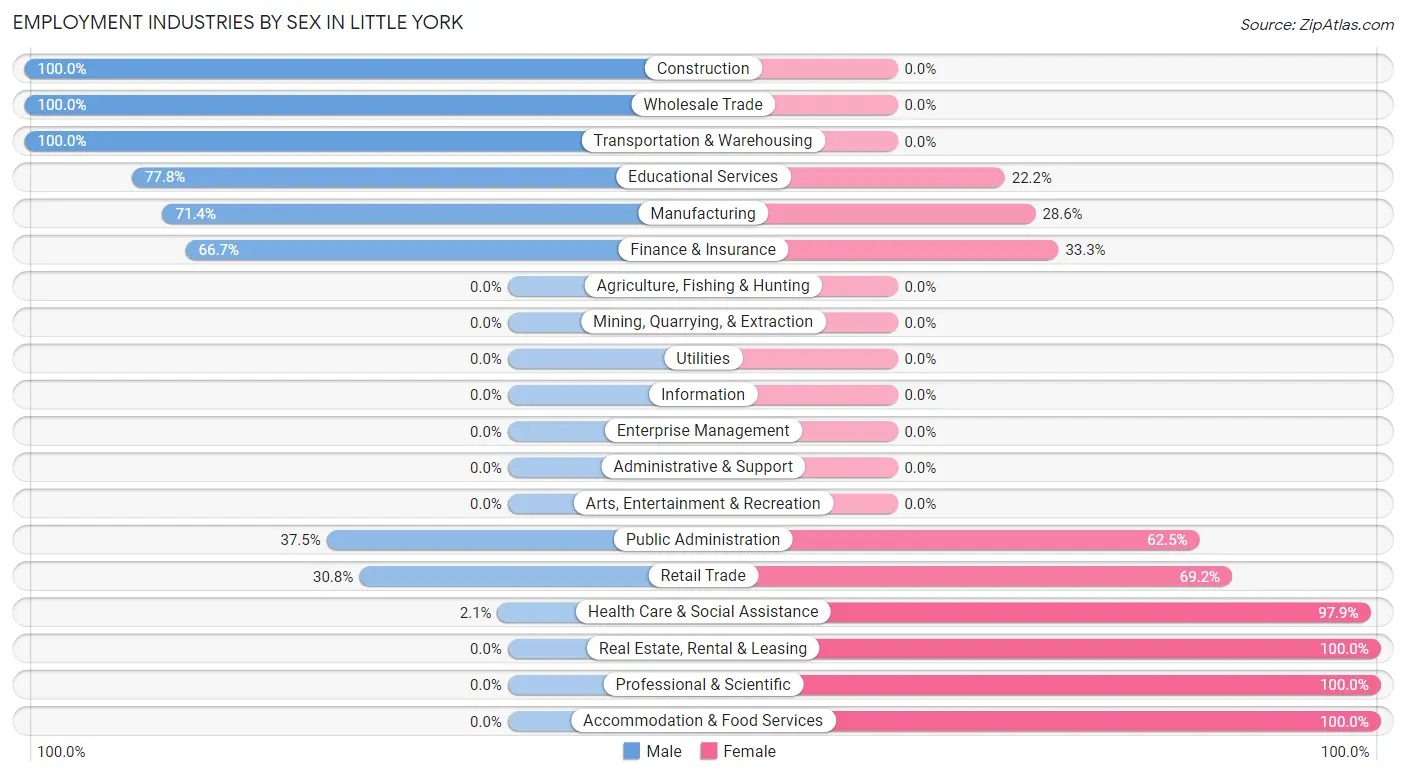
Employment Industries by Sex in Little York
The Little York industries that see more men than women are Construction (100.0%), Wholesale Trade (100.0%), and Transportation & Warehousing (100.0%), whereas the industries that tend to have a higher number of women are Real Estate, Rental & Leasing (100.0%), Professional & Scientific (100.0%), and Accommodation & Food Services (100.0%).
| Industry | Male | Female |
| Agriculture, Fishing & Hunting | 0 (0.0%) | 0 (0.0%) |
| Mining, Quarrying, & Extraction | 0 (0.0%) | 0 (0.0%) |
| Construction | 16 (100.0%) | 0 (0.0%) |
| Manufacturing | 20 (71.4%) | 8 (28.6%) |
| Wholesale Trade | 15 (100.0%) | 0 (0.0%) |
| Retail Trade | 8 (30.8%) | 18 (69.2%) |
| Transportation & Warehousing | 12 (100.0%) | 0 (0.0%) |
| Utilities | 0 (0.0%) | 0 (0.0%) |
| Information | 0 (0.0%) | 0 (0.0%) |
| Finance & Insurance | 2 (66.7%) | 1 (33.3%) |
| Real Estate, Rental & Leasing | 0 (0.0%) | 3 (100.0%) |
| Professional & Scientific | 0 (0.0%) | 3 (100.0%) |
| Enterprise Management | 0 (0.0%) | 0 (0.0%) |
| Administrative & Support | 0 (0.0%) | 0 (0.0%) |
| Educational Services | 7 (77.8%) | 2 (22.2%) |
| Health Care & Social Assistance | 1 (2.1%) | 46 (97.9%) |
| Arts, Entertainment & Recreation | 0 (0.0%) | 0 (0.0%) |
| Accommodation & Food Services | 0 (0.0%) | 9 (100.0%) |
| Public Administration | 3 (37.5%) | 5 (62.5%) |
| Total | 99 (51.0%) | 95 (49.0%) |
Education in Little York
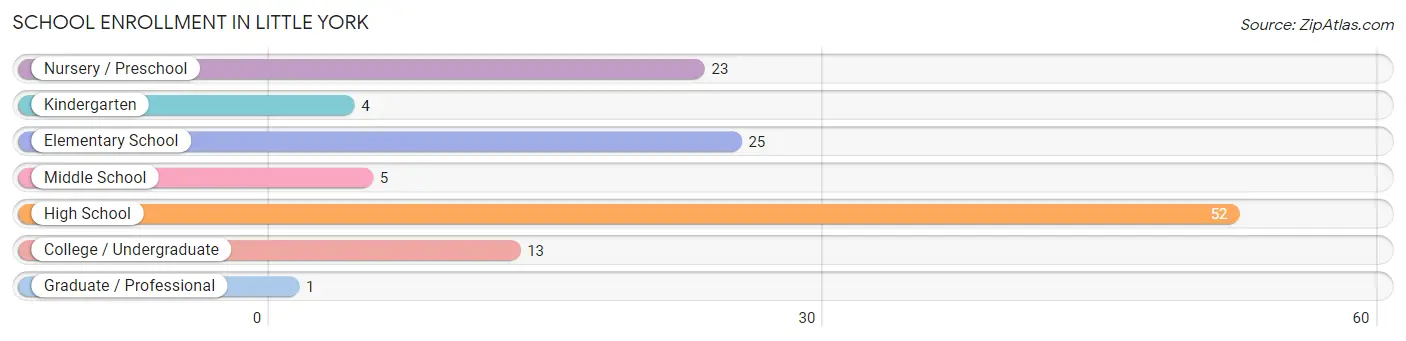
School Enrollment in Little York
The most common levels of schooling among the 123 students in Little York are high school (52 | 42.3%), elementary school (25 | 20.3%), and nursery / preschool (23 | 18.7%).
| School Level | # Students | % Students |
| Nursery / Preschool | 23 | 18.7% |
| Kindergarten | 4 | 3.3% |
| Elementary School | 25 | 20.3% |
| Middle School | 5 | 4.1% |
| High School | 52 | 42.3% |
| College / Undergraduate | 13 | 10.6% |
| Graduate / Professional | 1 | 0.8% |
| Total | 123 | 100.0% |
School Enrollment by Age by Funding Source in Little York
Out of a total of 123 students who are enrolled in schools in Little York, 4 (3.3%) attend a private institution, while the remaining 119 (96.7%) are enrolled in public schools. The age group of 5 to 9 year old has the highest likelihood of being enrolled in private schools, with 4 (14.8% in the age bracket) enrolled. Conversely, the age group of 3 to 4 year olds has the lowest likelihood of being enrolled in a private school, with 25 (100.0% in the age bracket) attending a public institution.
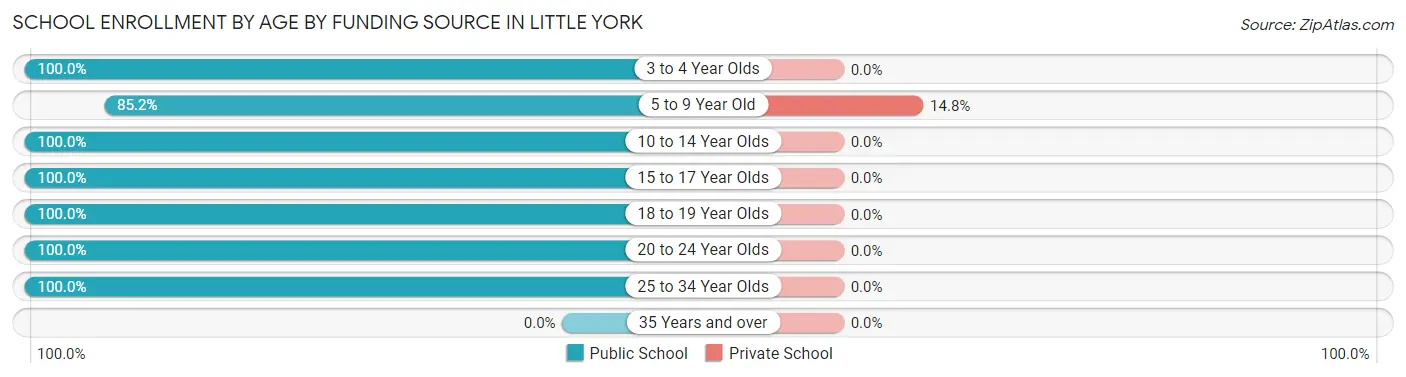
| Age Bracket | Public School | Private School |
| 3 to 4 Year Olds | 25 (100.0%) | 0 (0.0%) |
| 5 to 9 Year Old | 23 (85.2%) | 4 (14.8%) |
| 10 to 14 Year Olds | 5 (100.0%) | 0 (0.0%) |
| 15 to 17 Year Olds | 9 (100.0%) | 0 (0.0%) |
| 18 to 19 Year Olds | 54 (100.0%) | 0 (0.0%) |
| 20 to 24 Year Olds | 2 (100.0%) | 0 (0.0%) |
| 25 to 34 Year Olds | 1 (100.0%) | 0 (0.0%) |
| 35 Years and over | 0 (0.0%) | 0 (0.0%) |
| Total | 119 (96.7%) | 4 (3.3%) |
Educational Attainment by Field of Study in Little York
Education (17 | 51.5%), science & technology (6 | 18.2%), business (5 | 15.1%), social sciences (2 | 6.1%), and bio, nature & agricultural (1 | 3.0%) are the most common fields of study among 33 individuals in Little York who have obtained a bachelor's degree or higher.
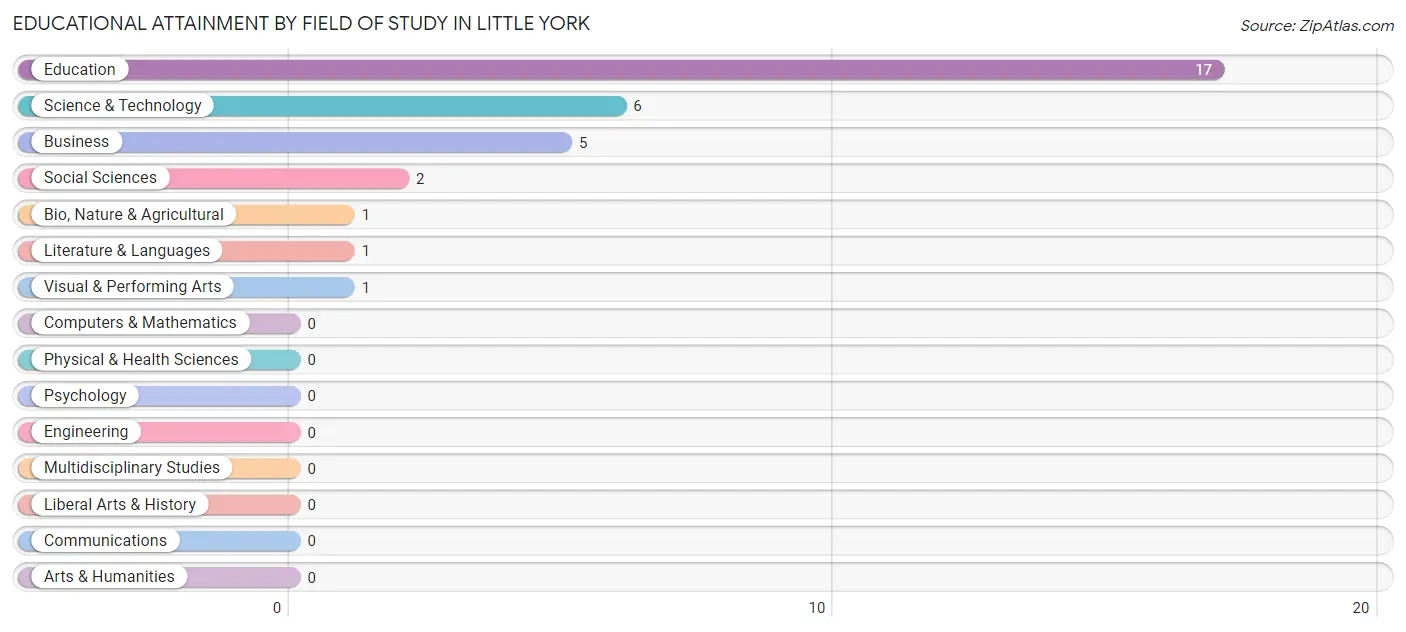
| Field of Study | # Graduates | % Graduates |
| Computers & Mathematics | 0 | 0.0% |
| Bio, Nature & Agricultural | 1 | 3.0% |
| Physical & Health Sciences | 0 | 0.0% |
| Psychology | 0 | 0.0% |
| Social Sciences | 2 | 6.1% |
| Engineering | 0 | 0.0% |
| Multidisciplinary Studies | 0 | 0.0% |
| Science & Technology | 6 | 18.2% |
| Business | 5 | 15.1% |
| Education | 17 | 51.5% |
| Literature & Languages | 1 | 3.0% |
| Liberal Arts & History | 0 | 0.0% |
| Visual & Performing Arts | 1 | 3.0% |
| Communications | 0 | 0.0% |
| Arts & Humanities | 0 | 0.0% |
| Total | 33 | 100.0% |
Transportation & Commute in Little York
Vehicle Availability by Sex in Little York
The most prevalent vehicle ownership categories in Little York are males with 2 vehicles (61, accounting for 61.6%) and females with 2 vehicles (46, making up 65.6%).
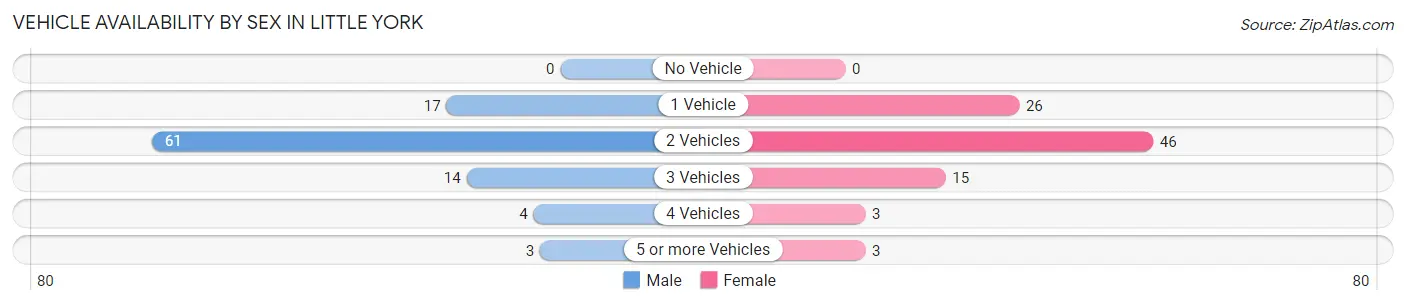
| Vehicles Available | Male | Female |
| No Vehicle | 0 (0.0%) | 0 (0.0%) |
| 1 Vehicle | 17 (17.2%) | 26 (28.0%) |
| 2 Vehicles | 61 (61.6%) | 46 (49.5%) |
| 3 Vehicles | 14 (14.1%) | 15 (16.1%) |
| 4 Vehicles | 4 (4.0%) | 3 (3.2%) |
| 5 or more Vehicles | 3 (3.0%) | 3 (3.2%) |
| Total | 99 (100.0%) | 93 (100.0%) |
Commute Time in Little York
The most frequently occuring commute durations in Little York are 20 to 24 minutes (43 commuters, 22.6%), 15 to 19 minutes (36 commuters, 19.0%), and 30 to 34 minutes (32 commuters, 16.8%).
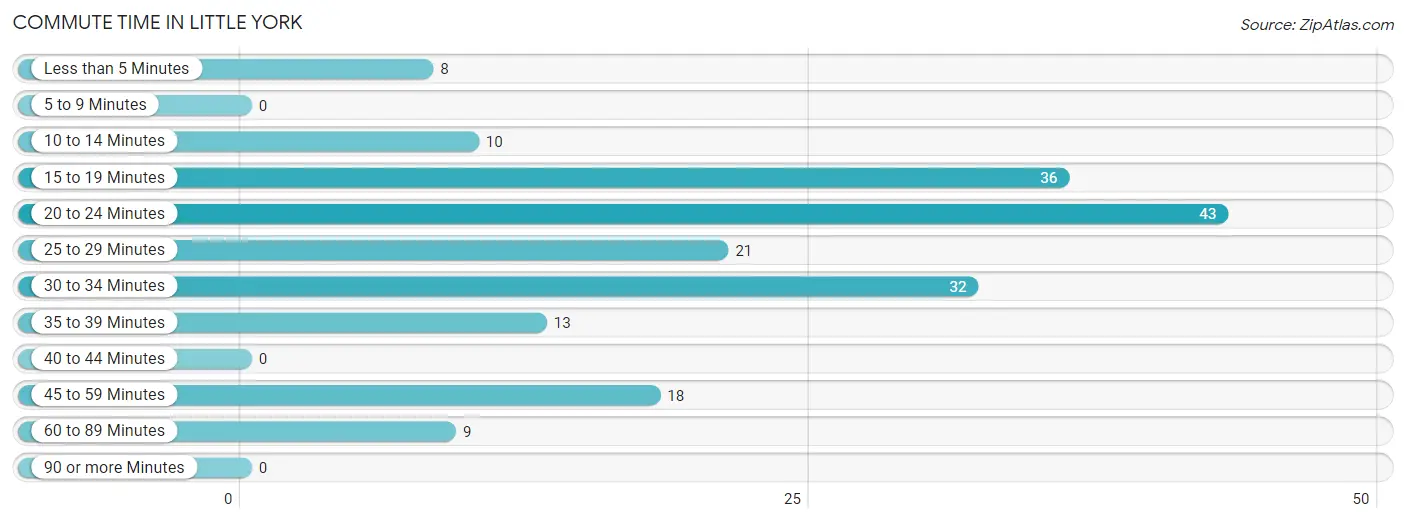
| Commute Time | # Commuters | % Commuters |
| Less than 5 Minutes | 8 | 4.2% |
| 5 to 9 Minutes | 0 | 0.0% |
| 10 to 14 Minutes | 10 | 5.3% |
| 15 to 19 Minutes | 36 | 19.0% |
| 20 to 24 Minutes | 43 | 22.6% |
| 25 to 29 Minutes | 21 | 11.1% |
| 30 to 34 Minutes | 32 | 16.8% |
| 35 to 39 Minutes | 13 | 6.8% |
| 40 to 44 Minutes | 0 | 0.0% |
| 45 to 59 Minutes | 18 | 9.5% |
| 60 to 89 Minutes | 9 | 4.7% |
| 90 or more Minutes | 0 | 0.0% |
Commute Time by Sex in Little York
The most common commute times in Little York are 15 to 19 minutes (24 commuters, 24.2%) for males and 20 to 24 minutes (25 commuters, 27.5%) for females.
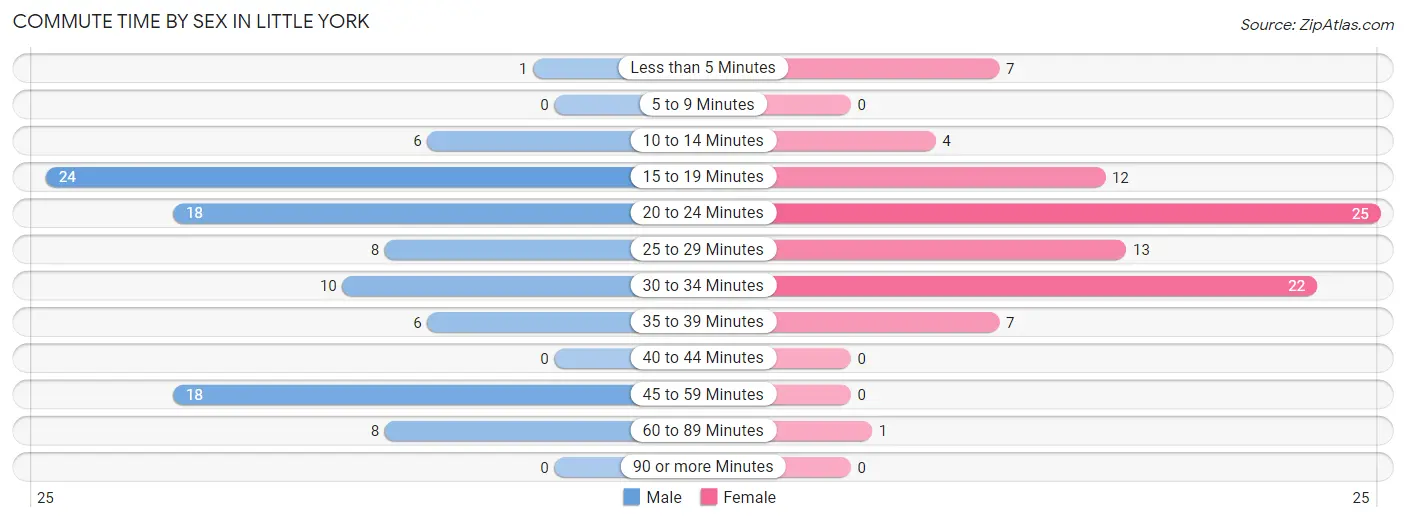
| Commute Time | Male | Female |
| Less than 5 Minutes | 1 (1.0%) | 7 (7.7%) |
| 5 to 9 Minutes | 0 (0.0%) | 0 (0.0%) |
| 10 to 14 Minutes | 6 (6.1%) | 4 (4.4%) |
| 15 to 19 Minutes | 24 (24.2%) | 12 (13.2%) |
| 20 to 24 Minutes | 18 (18.2%) | 25 (27.5%) |
| 25 to 29 Minutes | 8 (8.1%) | 13 (14.3%) |
| 30 to 34 Minutes | 10 (10.1%) | 22 (24.2%) |
| 35 to 39 Minutes | 6 (6.1%) | 7 (7.7%) |
| 40 to 44 Minutes | 0 (0.0%) | 0 (0.0%) |
| 45 to 59 Minutes | 18 (18.2%) | 0 (0.0%) |
| 60 to 89 Minutes | 8 (8.1%) | 1 (1.1%) |
| 90 or more Minutes | 0 (0.0%) | 0 (0.0%) |
Time of Departure to Work by Sex in Little York
The most frequent times of departure to work in Little York are 6:00 AM to 6:29 AM (33, 33.3%) for males and 7:00 AM to 7:29 AM (20, 22.0%) for females.
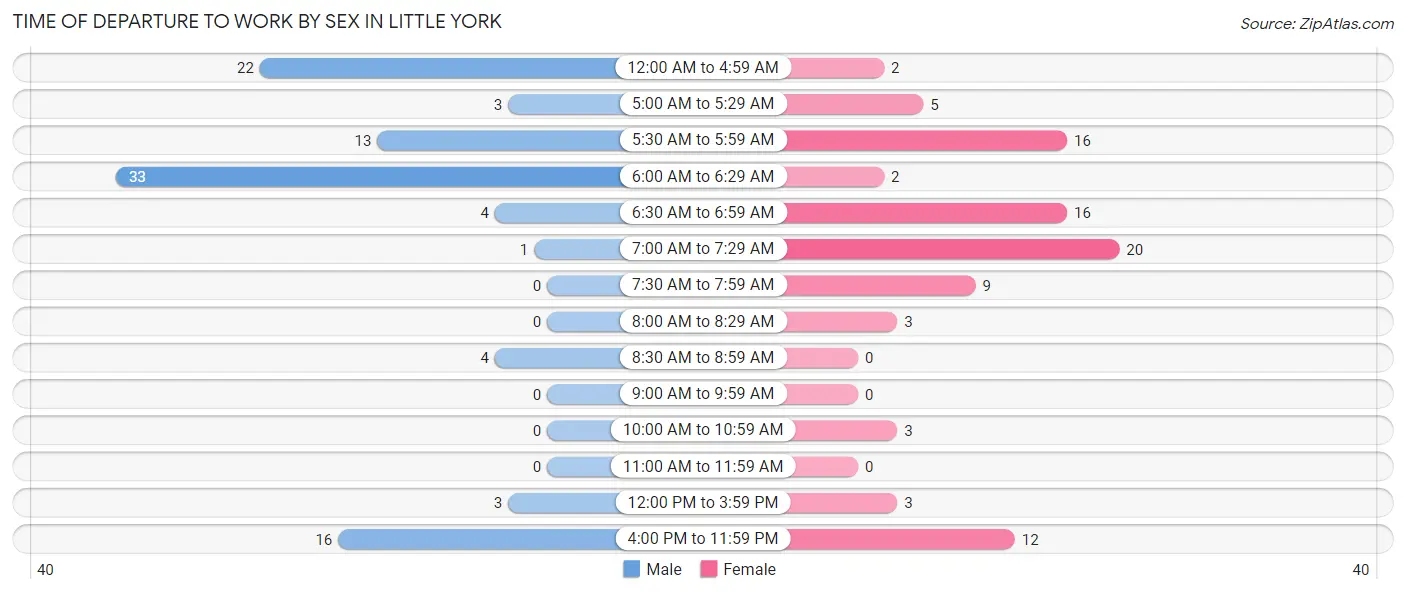
| Time of Departure | Male | Female |
| 12:00 AM to 4:59 AM | 22 (22.2%) | 2 (2.2%) |
| 5:00 AM to 5:29 AM | 3 (3.0%) | 5 (5.5%) |
| 5:30 AM to 5:59 AM | 13 (13.1%) | 16 (17.6%) |
| 6:00 AM to 6:29 AM | 33 (33.3%) | 2 (2.2%) |
| 6:30 AM to 6:59 AM | 4 (4.0%) | 16 (17.6%) |
| 7:00 AM to 7:29 AM | 1 (1.0%) | 20 (22.0%) |
| 7:30 AM to 7:59 AM | 0 (0.0%) | 9 (9.9%) |
| 8:00 AM to 8:29 AM | 0 (0.0%) | 3 (3.3%) |
| 8:30 AM to 8:59 AM | 4 (4.0%) | 0 (0.0%) |
| 9:00 AM to 9:59 AM | 0 (0.0%) | 0 (0.0%) |
| 10:00 AM to 10:59 AM | 0 (0.0%) | 3 (3.3%) |
| 11:00 AM to 11:59 AM | 0 (0.0%) | 0 (0.0%) |
| 12:00 PM to 3:59 PM | 3 (3.0%) | 3 (3.3%) |
| 4:00 PM to 11:59 PM | 16 (16.2%) | 12 (13.2%) |
| Total | 99 (100.0%) | 91 (100.0%) |
Housing Occupancy in Little York
Occupancy by Ownership in Little York
Of the total 163 dwellings in Little York, owner-occupied units account for 129 (79.1%), while renter-occupied units make up 34 (20.9%).
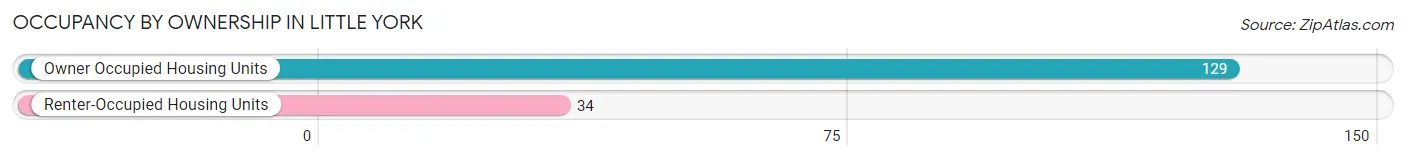
| Occupancy | # Housing Units | % Housing Units |
| Owner Occupied Housing Units | 129 | 79.1% |
| Renter-Occupied Housing Units | 34 | 20.9% |
| Total Occupied Housing Units | 163 | 100.0% |
Occupancy by Household Size in Little York
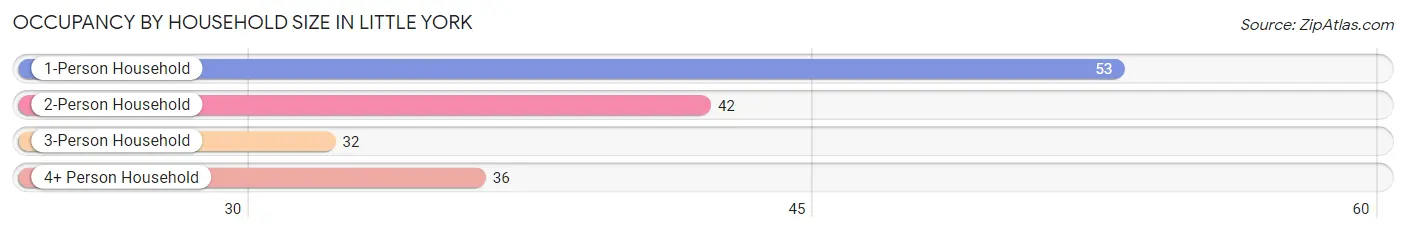
| Household Size | # Housing Units | % Housing Units |
| 1-Person Household | 53 | 32.5% |
| 2-Person Household | 42 | 25.8% |
| 3-Person Household | 32 | 19.6% |
| 4+ Person Household | 36 | 22.1% |
| Total Housing Units | 163 | 100.0% |
Occupancy by Ownership by Household Size in Little York
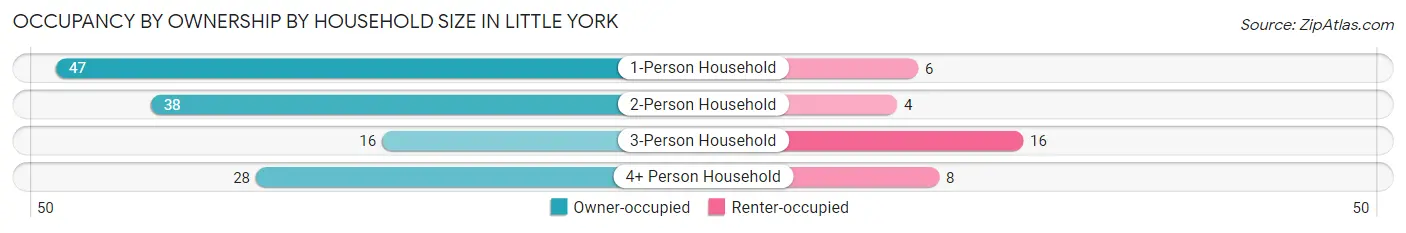
| Household Size | Owner-occupied | Renter-occupied |
| 1-Person Household | 47 (88.7%) | 6 (11.3%) |
| 2-Person Household | 38 (90.5%) | 4 (9.5%) |
| 3-Person Household | 16 (50.0%) | 16 (50.0%) |
| 4+ Person Household | 28 (77.8%) | 8 (22.2%) |
| Total Housing Units | 129 (79.1%) | 34 (20.9%) |
Occupancy by Educational Attainment in Little York
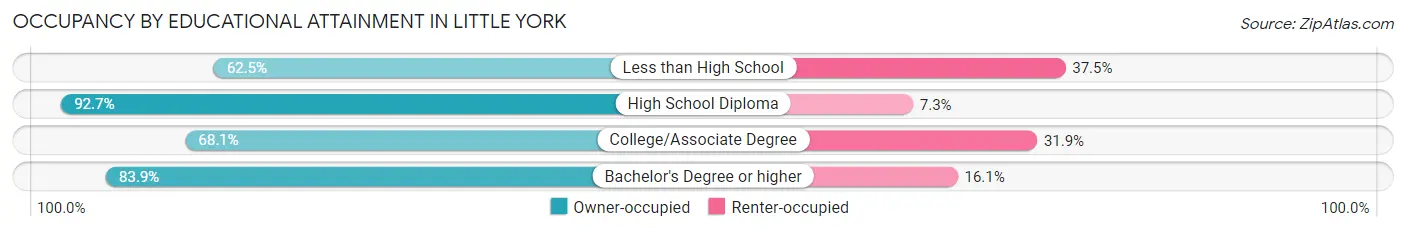
| Household Size | Owner-occupied | Renter-occupied |
| Less than High School | 5 (62.5%) | 3 (37.5%) |
| High School Diploma | 51 (92.7%) | 4 (7.3%) |
| College/Associate Degree | 47 (68.1%) | 22 (31.9%) |
| Bachelor's Degree or higher | 26 (83.9%) | 5 (16.1%) |
Occupancy by Age of Householder in Little York
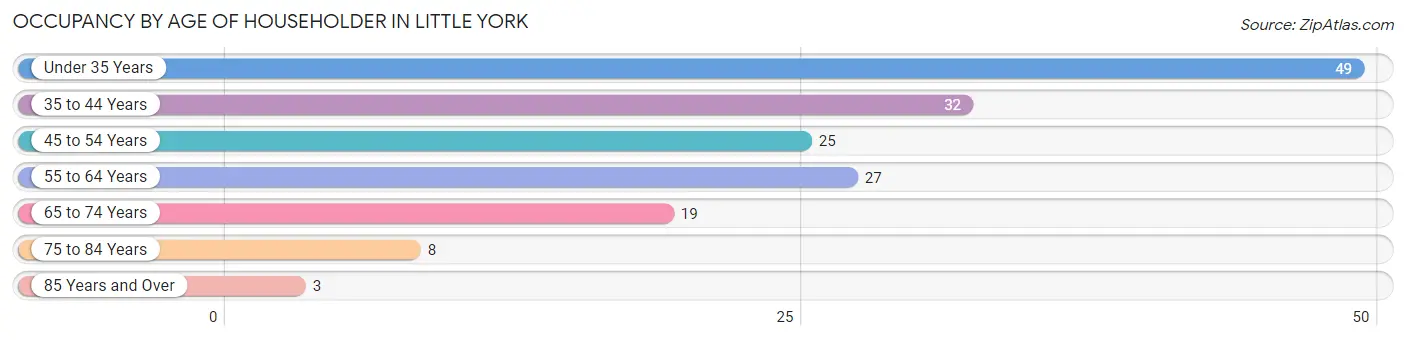
| Age Bracket | # Households | % Households |
| Under 35 Years | 49 | 30.1% |
| 35 to 44 Years | 32 | 19.6% |
| 45 to 54 Years | 25 | 15.3% |
| 55 to 64 Years | 27 | 16.6% |
| 65 to 74 Years | 19 | 11.7% |
| 75 to 84 Years | 8 | 4.9% |
| 85 Years and Over | 3 | 1.8% |
| Total | 163 | 100.0% |
Housing Finances in Little York
Median Income by Occupancy in Little York
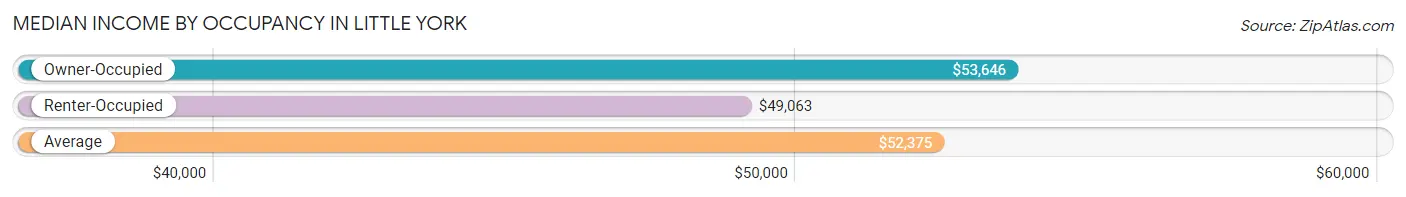
| Occupancy Type | # Households | Median Income |
| Owner-Occupied | 129 (79.1%) | $53,646 |
| Renter-Occupied | 34 (20.9%) | $49,063 |
| Average | 163 (100.0%) | $52,375 |
Occupancy by Householder Income Bracket in Little York
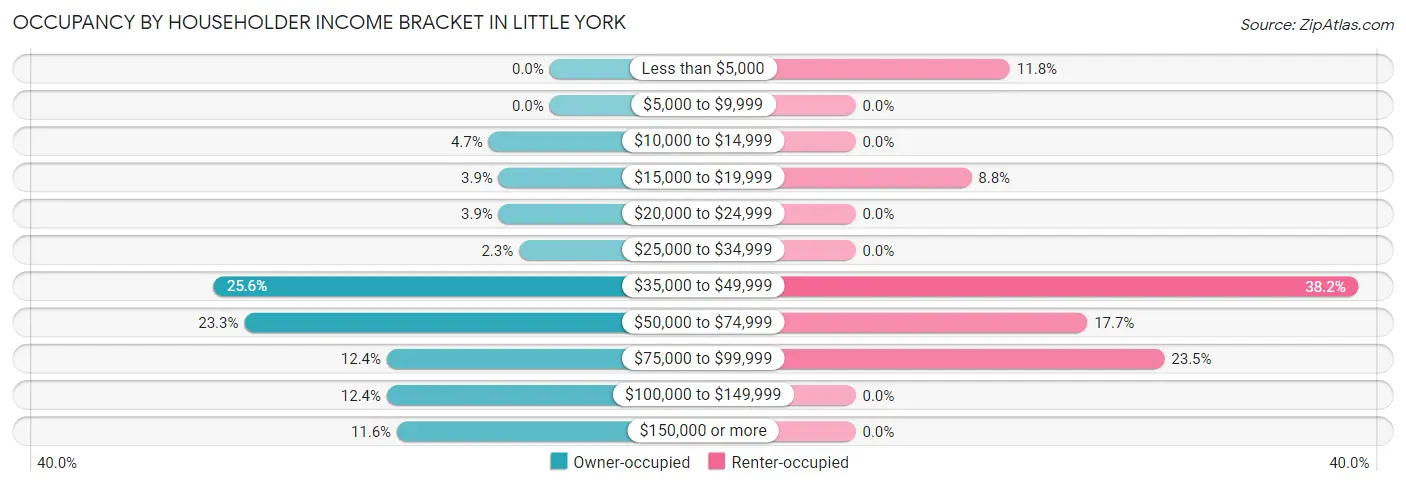
| Income Bracket | Owner-occupied | Renter-occupied |
| Less than $5,000 | 0 (0.0%) | 4 (11.8%) |
| $5,000 to $9,999 | 0 (0.0%) | 0 (0.0%) |
| $10,000 to $14,999 | 6 (4.6%) | 0 (0.0%) |
| $15,000 to $19,999 | 5 (3.9%) | 3 (8.8%) |
| $20,000 to $24,999 | 5 (3.9%) | 0 (0.0%) |
| $25,000 to $34,999 | 3 (2.3%) | 0 (0.0%) |
| $35,000 to $49,999 | 33 (25.6%) | 13 (38.2%) |
| $50,000 to $74,999 | 30 (23.3%) | 6 (17.6%) |
| $75,000 to $99,999 | 16 (12.4%) | 8 (23.5%) |
| $100,000 to $149,999 | 16 (12.4%) | 0 (0.0%) |
| $150,000 or more | 15 (11.6%) | 0 (0.0%) |
| Total | 129 (100.0%) | 34 (100.0%) |
Monthly Housing Cost Tiers in Little York
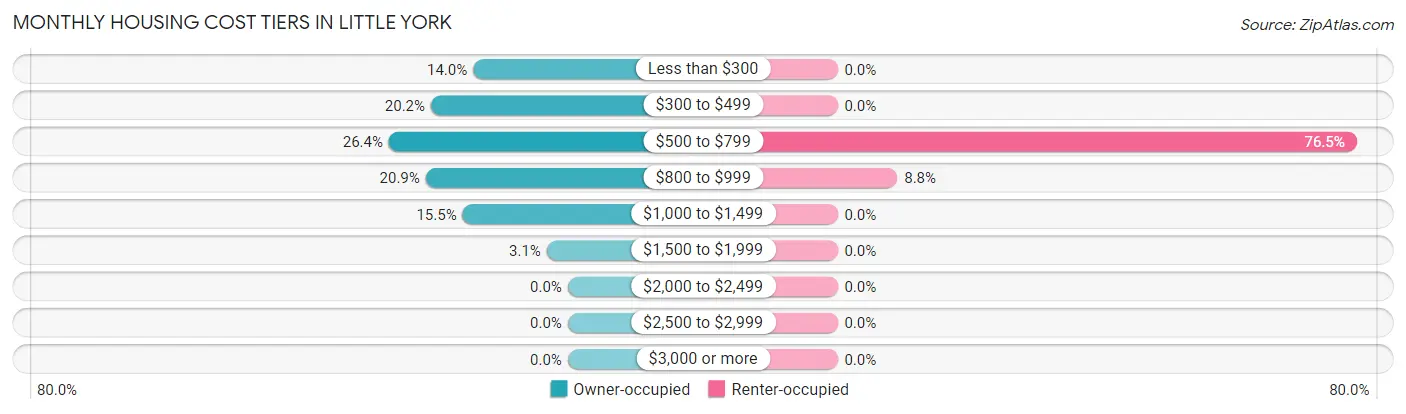
| Monthly Cost | Owner-occupied | Renter-occupied |
| Less than $300 | 18 (14.0%) | 0 (0.0%) |
| $300 to $499 | 26 (20.2%) | 0 (0.0%) |
| $500 to $799 | 34 (26.4%) | 26 (76.5%) |
| $800 to $999 | 27 (20.9%) | 3 (8.8%) |
| $1,000 to $1,499 | 20 (15.5%) | 0 (0.0%) |
| $1,500 to $1,999 | 4 (3.1%) | 0 (0.0%) |
| $2,000 to $2,499 | 0 (0.0%) | 0 (0.0%) |
| $2,500 to $2,999 | 0 (0.0%) | 0 (0.0%) |
| $3,000 or more | 0 (0.0%) | 0 (0.0%) |
| Total | 129 (100.0%) | 34 (100.0%) |
Physical Housing Characteristics in Little York
Housing Structures in Little York
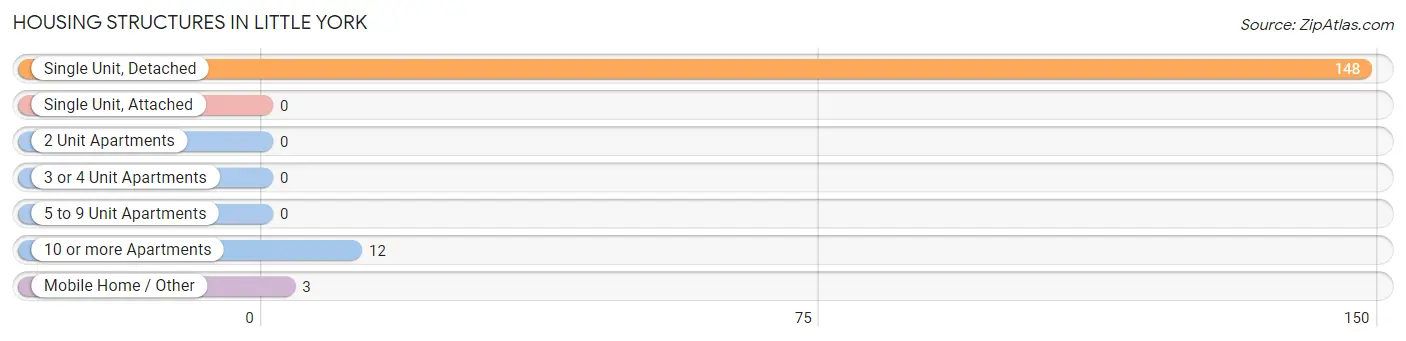
| Structure Type | # Housing Units | % Housing Units |
| Single Unit, Detached | 148 | 90.8% |
| Single Unit, Attached | 0 | 0.0% |
| 2 Unit Apartments | 0 | 0.0% |
| 3 or 4 Unit Apartments | 0 | 0.0% |
| 5 to 9 Unit Apartments | 0 | 0.0% |
| 10 or more Apartments | 12 | 7.4% |
| Mobile Home / Other | 3 | 1.8% |
| Total | 163 | 100.0% |
Housing Structures by Occupancy in Little York
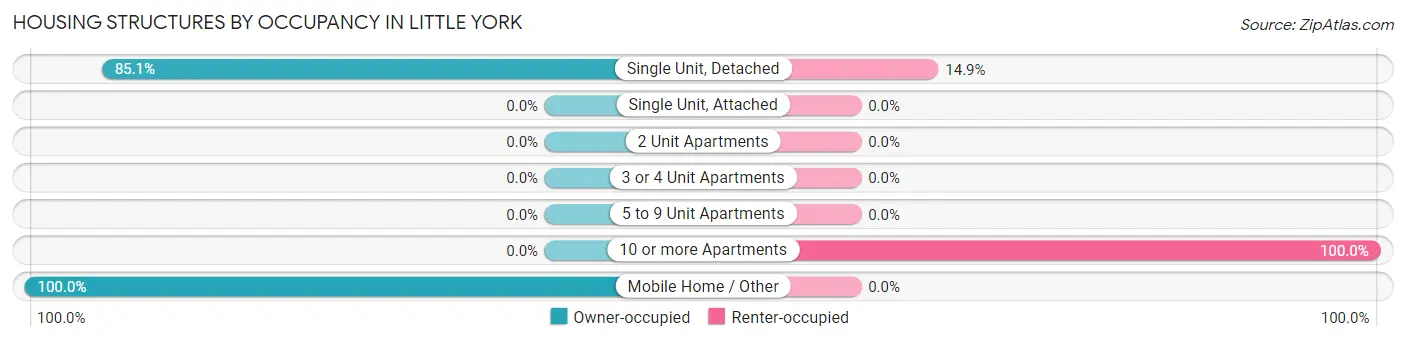
| Structure Type | Owner-occupied | Renter-occupied |
| Single Unit, Detached | 126 (85.1%) | 22 (14.9%) |
| Single Unit, Attached | 0 (0.0%) | 0 (0.0%) |
| 2 Unit Apartments | 0 (0.0%) | 0 (0.0%) |
| 3 or 4 Unit Apartments | 0 (0.0%) | 0 (0.0%) |
| 5 to 9 Unit Apartments | 0 (0.0%) | 0 (0.0%) |
| 10 or more Apartments | 0 (0.0%) | 12 (100.0%) |
| Mobile Home / Other | 3 (100.0%) | 0 (0.0%) |
| Total | 129 (79.1%) | 34 (20.9%) |
Housing Structures by Number of Rooms in Little York
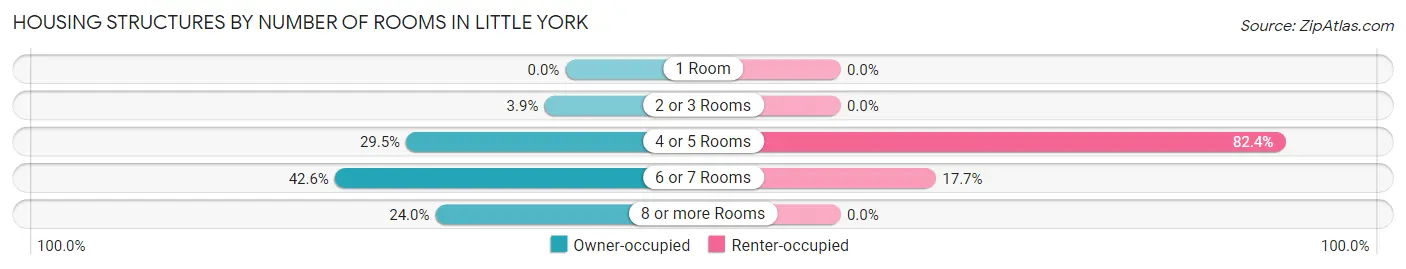
| Number of Rooms | Owner-occupied | Renter-occupied |
| 1 Room | 0 (0.0%) | 0 (0.0%) |
| 2 or 3 Rooms | 5 (3.9%) | 0 (0.0%) |
| 4 or 5 Rooms | 38 (29.5%) | 28 (82.4%) |
| 6 or 7 Rooms | 55 (42.6%) | 6 (17.6%) |
| 8 or more Rooms | 31 (24.0%) | 0 (0.0%) |
| Total | 129 (100.0%) | 34 (100.0%) |
Housing Structure by Heating Type in Little York
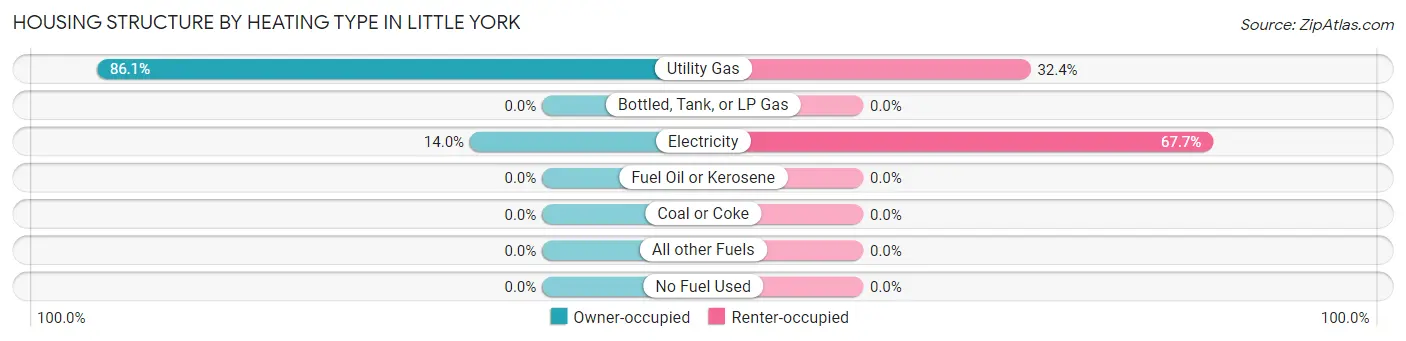
| Heating Type | Owner-occupied | Renter-occupied |
| Utility Gas | 111 (86.1%) | 11 (32.4%) |
| Bottled, Tank, or LP Gas | 0 (0.0%) | 0 (0.0%) |
| Electricity | 18 (14.0%) | 23 (67.6%) |
| Fuel Oil or Kerosene | 0 (0.0%) | 0 (0.0%) |
| Coal or Coke | 0 (0.0%) | 0 (0.0%) |
| All other Fuels | 0 (0.0%) | 0 (0.0%) |
| No Fuel Used | 0 (0.0%) | 0 (0.0%) |
| Total | 129 (100.0%) | 34 (100.0%) |
Household Vehicle Usage in Little York
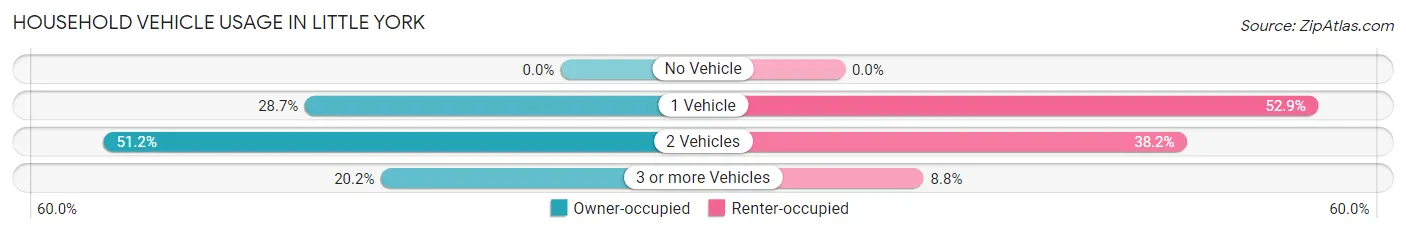
| Vehicles per Household | Owner-occupied | Renter-occupied |
| No Vehicle | 0 (0.0%) | 0 (0.0%) |
| 1 Vehicle | 37 (28.7%) | 18 (52.9%) |
| 2 Vehicles | 66 (51.2%) | 13 (38.2%) |
| 3 or more Vehicles | 26 (20.2%) | 3 (8.8%) |
| Total | 129 (100.0%) | 34 (100.0%) |
Real Estate & Mortgages in Little York
Real Estate and Mortgage Overview in Little York
| Characteristic | Without Mortgage | With Mortgage |
| Housing Units | 65 | 64 |
| Median Property Value | $71,500 | $84,200 |
| Median Household Income | $53,438 | $4 |
| Monthly Housing Costs | $398 | $0 |
| Real Estate Taxes | $657 | $0 |
Property Value by Mortgage Status in Little York
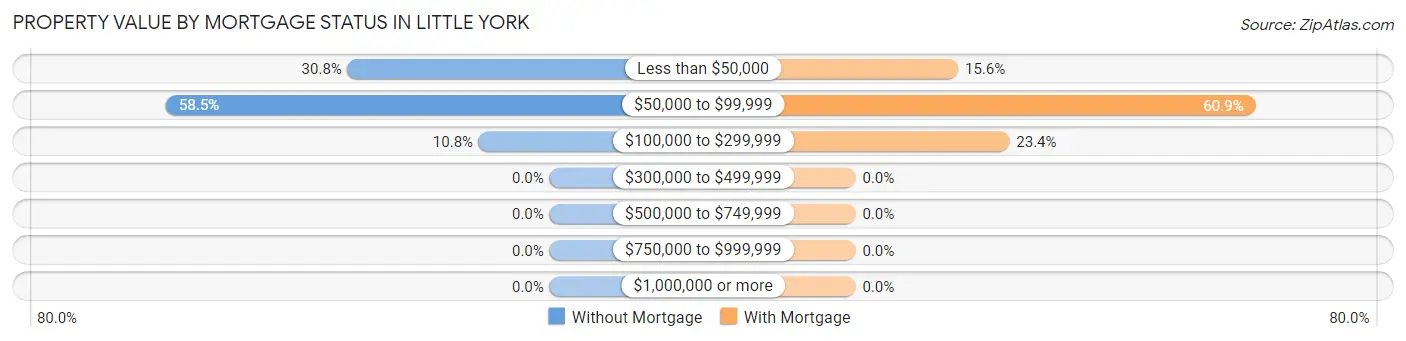
| Property Value | Without Mortgage | With Mortgage |
| Less than $50,000 | 20 (30.8%) | 10 (15.6%) |
| $50,000 to $99,999 | 38 (58.5%) | 39 (60.9%) |
| $100,000 to $299,999 | 7 (10.8%) | 15 (23.4%) |
| $300,000 to $499,999 | 0 (0.0%) | 0 (0.0%) |
| $500,000 to $749,999 | 0 (0.0%) | 0 (0.0%) |
| $750,000 to $999,999 | 0 (0.0%) | 0 (0.0%) |
| $1,000,000 or more | 0 (0.0%) | 0 (0.0%) |
| Total | 65 (100.0%) | 64 (100.0%) |
Household Income by Mortgage Status in Little York
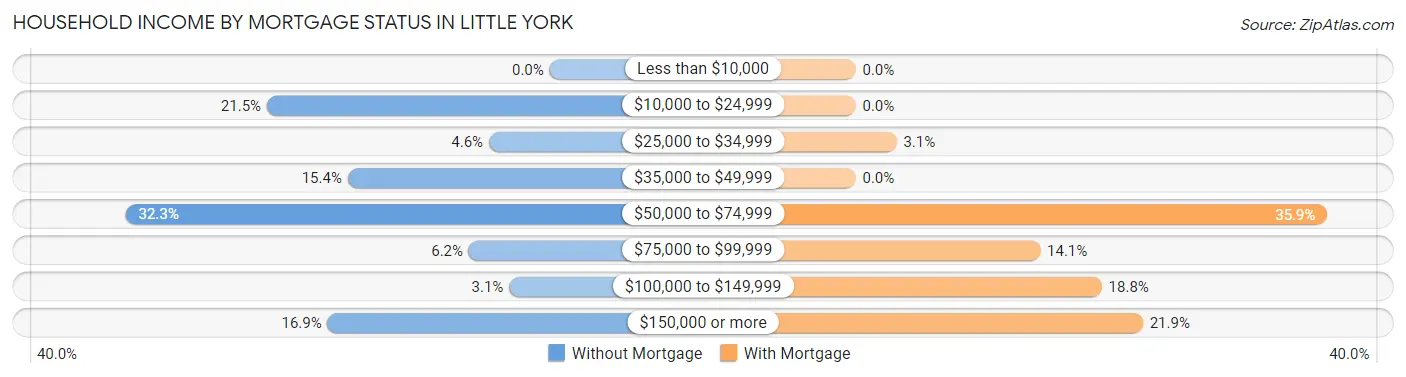
| Household Income | Without Mortgage | With Mortgage |
| Less than $10,000 | 0 (0.0%) | 0 (0.0%) |
| $10,000 to $24,999 | 14 (21.5%) | 0 (0.0%) |
| $25,000 to $34,999 | 3 (4.6%) | 2 (3.1%) |
| $35,000 to $49,999 | 10 (15.4%) | 0 (0.0%) |
| $50,000 to $74,999 | 21 (32.3%) | 23 (35.9%) |
| $75,000 to $99,999 | 4 (6.1%) | 9 (14.1%) |
| $100,000 to $149,999 | 2 (3.1%) | 12 (18.8%) |
| $150,000 or more | 11 (16.9%) | 14 (21.9%) |
| Total | 65 (100.0%) | 64 (100.0%) |
Property Value to Household Income Ratio in Little York
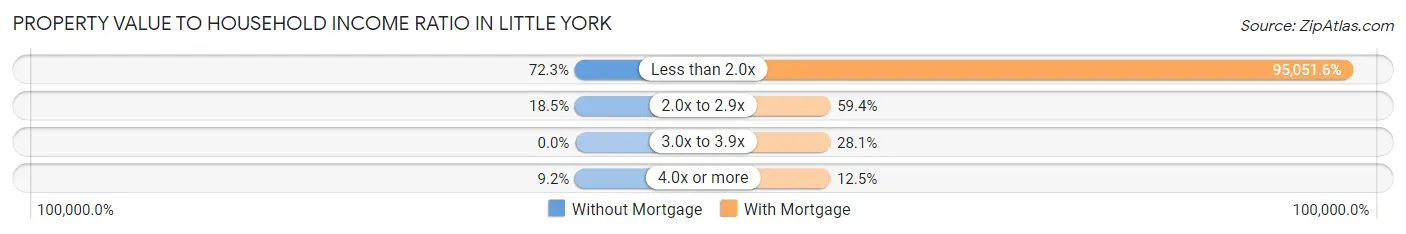
| Value-to-Income Ratio | Without Mortgage | With Mortgage |
| Less than 2.0x | 47 (72.3%) | 60,833 (95,051.6%) |
| 2.0x to 2.9x | 12 (18.5%) | 38 (59.4%) |
| 3.0x to 3.9x | 0 (0.0%) | 18 (28.1%) |
| 4.0x or more | 6 (9.2%) | 8 (12.5%) |
| Total | 65 (100.0%) | 64 (100.0%) |
Real Estate Taxes by Mortgage Status in Little York
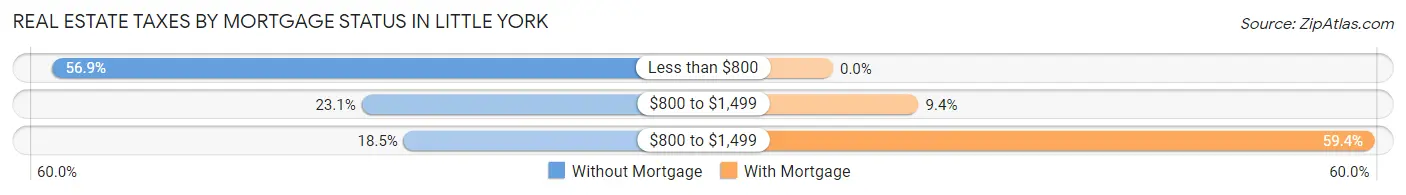
| Property Taxes | Without Mortgage | With Mortgage |
| Less than $800 | 37 (56.9%) | 0 (0.0%) |
| $800 to $1,499 | 15 (23.1%) | 6 (9.4%) |
| $800 to $1,499 | 12 (18.5%) | 38 (59.4%) |
| Total | 65 (100.0%) | 64 (100.0%) |
Health & Disability in Little York
Health Insurance Coverage by Age in Little York
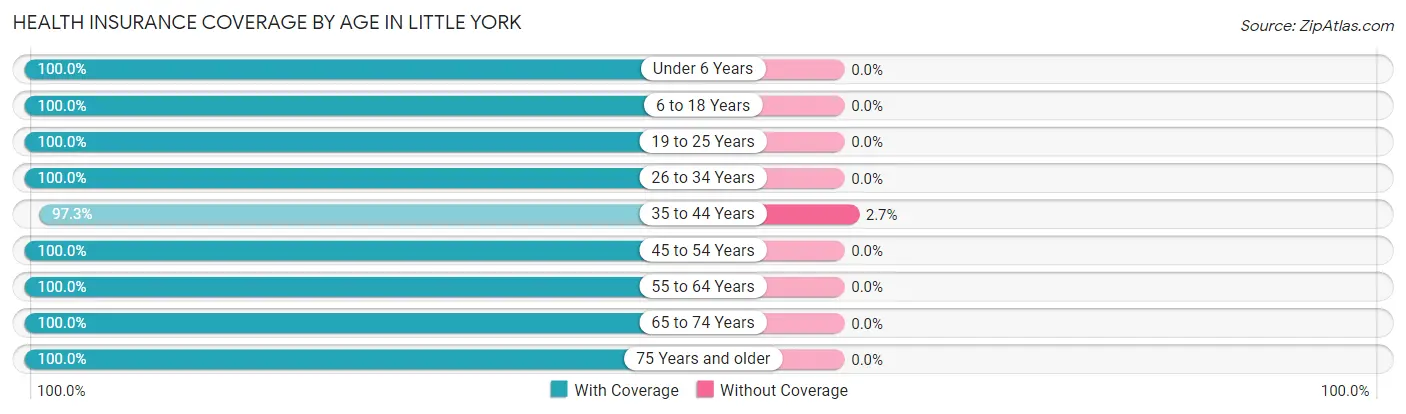
| Age Bracket | With Coverage | Without Coverage |
| Under 6 Years | 62 (100.0%) | 0 (0.0%) |
| 6 to 18 Years | 86 (100.0%) | 0 (0.0%) |
| 19 to 25 Years | 33 (100.0%) | 0 (0.0%) |
| 26 to 34 Years | 56 (100.0%) | 0 (0.0%) |
| 35 to 44 Years | 36 (97.3%) | 1 (2.7%) |
| 45 to 54 Years | 34 (100.0%) | 0 (0.0%) |
| 55 to 64 Years | 45 (100.0%) | 0 (0.0%) |
| 65 to 74 Years | 31 (100.0%) | 0 (0.0%) |
| 75 Years and older | 18 (100.0%) | 0 (0.0%) |
| Total | 401 (99.8%) | 1 (0.3%) |
Health Insurance Coverage by Citizenship Status in Little York
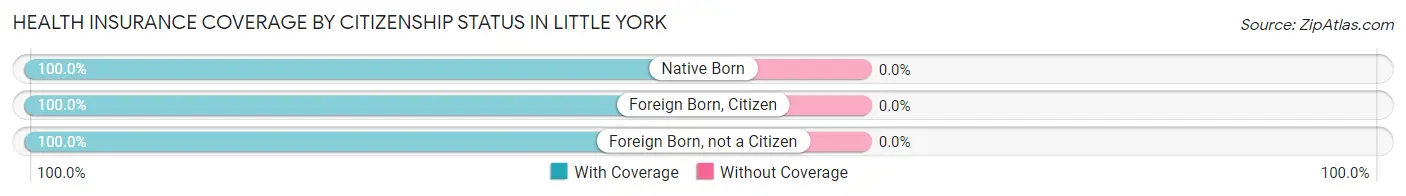
| Citizenship Status | With Coverage | Without Coverage |
| Native Born | 62 (100.0%) | 0 (0.0%) |
| Foreign Born, Citizen | 86 (100.0%) | 0 (0.0%) |
| Foreign Born, not a Citizen | 33 (100.0%) | 0 (0.0%) |
Health Insurance Coverage by Household Income in Little York
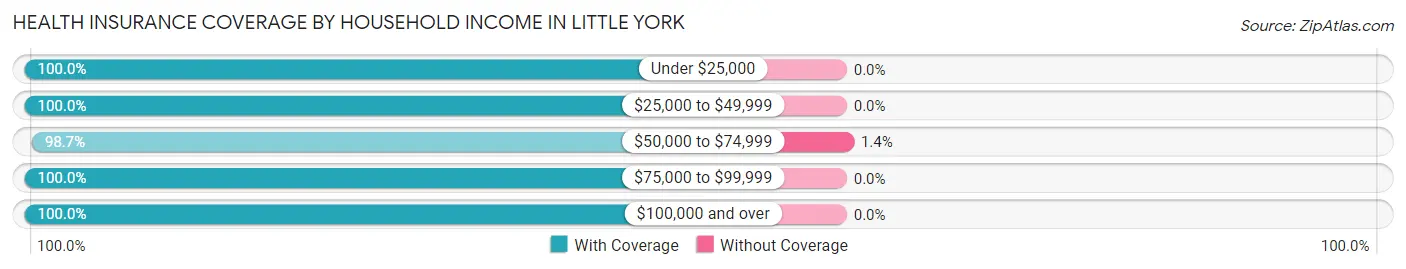
| Household Income | With Coverage | Without Coverage |
| Under $25,000 | 28 (100.0%) | 0 (0.0%) |
| $25,000 to $49,999 | 146 (100.0%) | 0 (0.0%) |
| $50,000 to $74,999 | 73 (98.7%) | 1 (1.3%) |
| $75,000 to $99,999 | 76 (100.0%) | 0 (0.0%) |
| $100,000 and over | 78 (100.0%) | 0 (0.0%) |
Public vs Private Health Insurance Coverage by Age in Little York
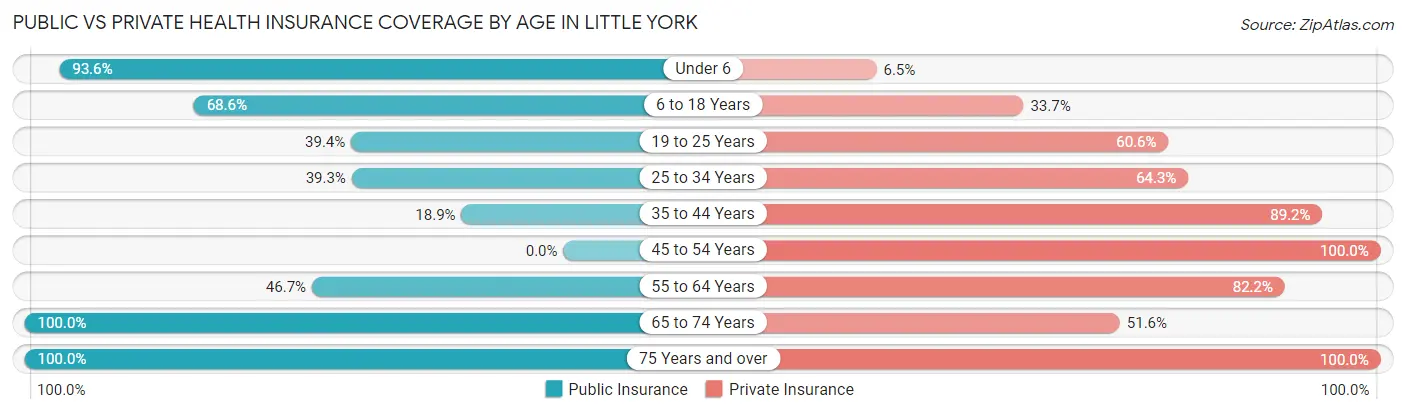
| Age Bracket | Public Insurance | Private Insurance |
| Under 6 | 58 (93.5%) | 4 (6.5%) |
| 6 to 18 Years | 59 (68.6%) | 29 (33.7%) |
| 19 to 25 Years | 13 (39.4%) | 20 (60.6%) |
| 25 to 34 Years | 22 (39.3%) | 36 (64.3%) |
| 35 to 44 Years | 7 (18.9%) | 33 (89.2%) |
| 45 to 54 Years | 0 (0.0%) | 34 (100.0%) |
| 55 to 64 Years | 21 (46.7%) | 37 (82.2%) |
| 65 to 74 Years | 31 (100.0%) | 16 (51.6%) |
| 75 Years and over | 18 (100.0%) | 18 (100.0%) |
| Total | 229 (57.0%) | 227 (56.5%) |
Disability Status by Sex by Age in Little York
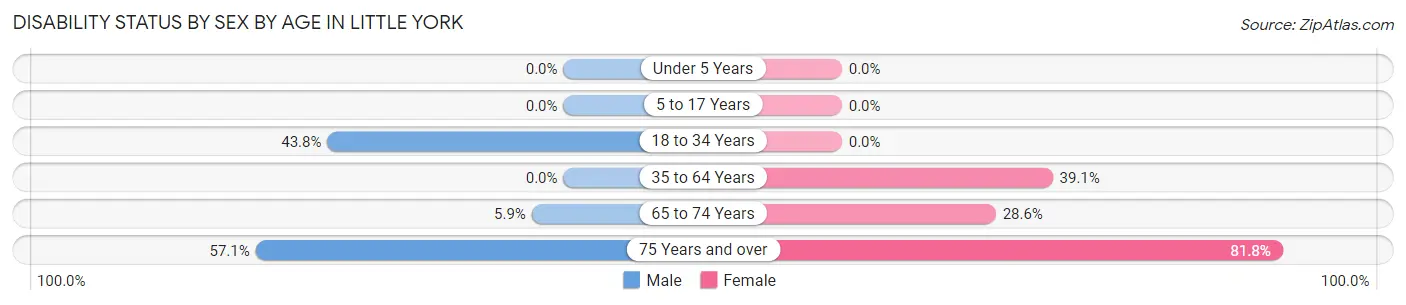
| Age Bracket | Male | Female |
| Under 5 Years | 0 (0.0%) | 0 (0.0%) |
| 5 to 17 Years | 0 (0.0%) | 0 (0.0%) |
| 18 to 34 Years | 39 (43.8%) | 0 (0.0%) |
| 35 to 64 Years | 0 (0.0%) | 27 (39.1%) |
| 65 to 74 Years | 1 (5.9%) | 4 (28.6%) |
| 75 Years and over | 4 (57.1%) | 9 (81.8%) |
Disability Class by Sex by Age in Little York
Disability Class: Hearing Difficulty
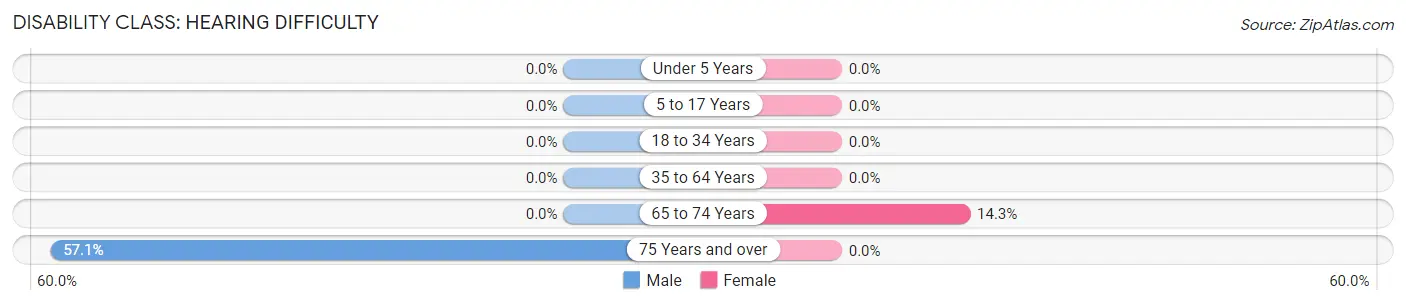
| Age Bracket | Male | Female |
| Under 5 Years | 0 (0.0%) | 0 (0.0%) |
| 5 to 17 Years | 0 (0.0%) | 0 (0.0%) |
| 18 to 34 Years | 0 (0.0%) | 0 (0.0%) |
| 35 to 64 Years | 0 (0.0%) | 0 (0.0%) |
| 65 to 74 Years | 0 (0.0%) | 2 (14.3%) |
| 75 Years and over | 4 (57.1%) | 0 (0.0%) |
Disability Class: Vision Difficulty
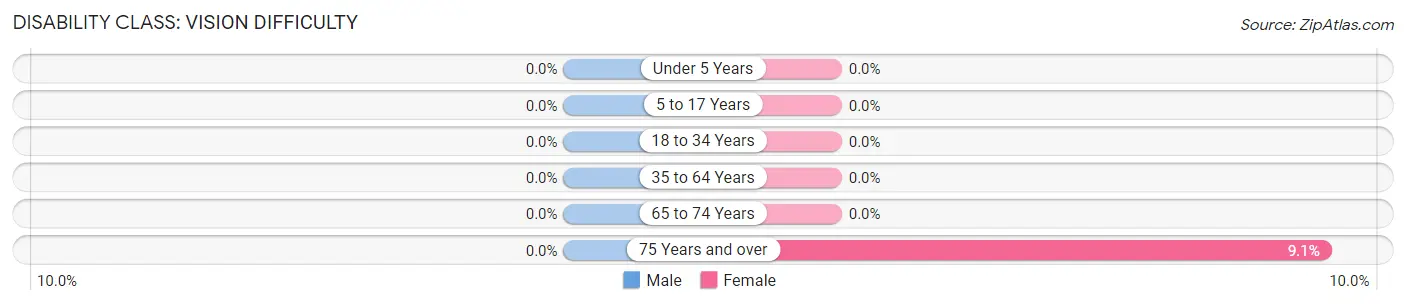
| Age Bracket | Male | Female |
| Under 5 Years | 0 (0.0%) | 0 (0.0%) |
| 5 to 17 Years | 0 (0.0%) | 0 (0.0%) |
| 18 to 34 Years | 0 (0.0%) | 0 (0.0%) |
| 35 to 64 Years | 0 (0.0%) | 0 (0.0%) |
| 65 to 74 Years | 0 (0.0%) | 0 (0.0%) |
| 75 Years and over | 0 (0.0%) | 1 (9.1%) |
Disability Class: Cognitive Difficulty
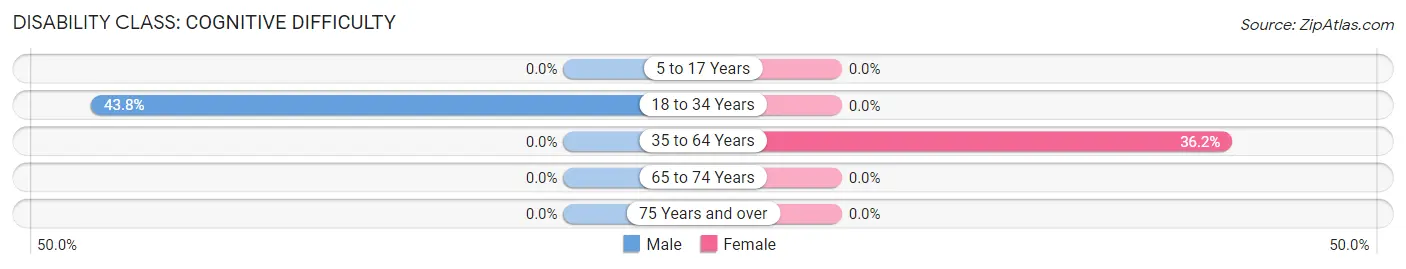
| Age Bracket | Male | Female |
| 5 to 17 Years | 0 (0.0%) | 0 (0.0%) |
| 18 to 34 Years | 39 (43.8%) | 0 (0.0%) |
| 35 to 64 Years | 0 (0.0%) | 25 (36.2%) |
| 65 to 74 Years | 0 (0.0%) | 0 (0.0%) |
| 75 Years and over | 0 (0.0%) | 0 (0.0%) |
Disability Class: Ambulatory Difficulty
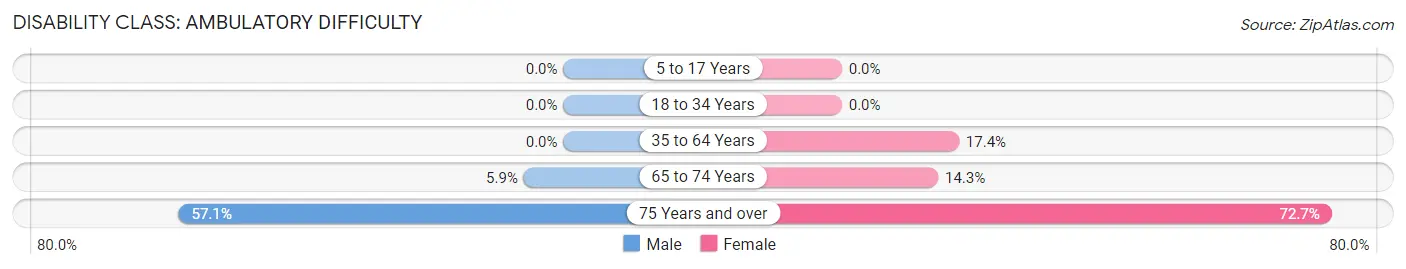
| Age Bracket | Male | Female |
| 5 to 17 Years | 0 (0.0%) | 0 (0.0%) |
| 18 to 34 Years | 0 (0.0%) | 0 (0.0%) |
| 35 to 64 Years | 0 (0.0%) | 12 (17.4%) |
| 65 to 74 Years | 1 (5.9%) | 2 (14.3%) |
| 75 Years and over | 4 (57.1%) | 8 (72.7%) |
Disability Class: Self-Care Difficulty
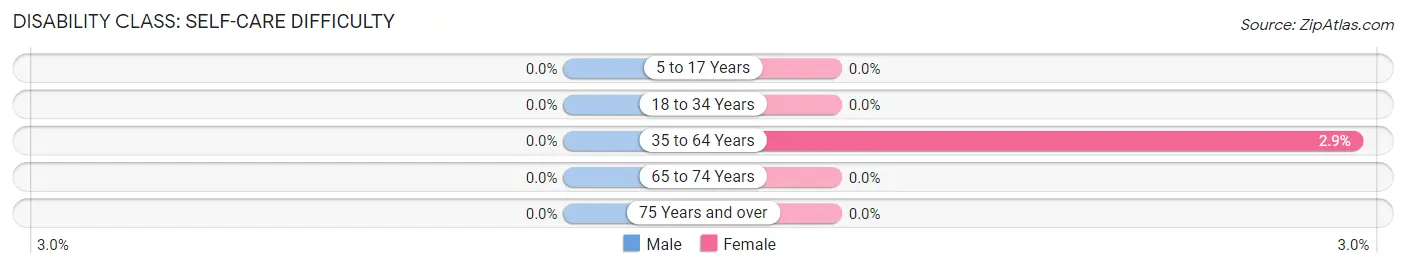
| Age Bracket | Male | Female |
| 5 to 17 Years | 0 (0.0%) | 0 (0.0%) |
| 18 to 34 Years | 0 (0.0%) | 0 (0.0%) |
| 35 to 64 Years | 0 (0.0%) | 2 (2.9%) |
| 65 to 74 Years | 0 (0.0%) | 0 (0.0%) |
| 75 Years and over | 0 (0.0%) | 0 (0.0%) |
Technology Access in Little York
Computing Device Access in Little York
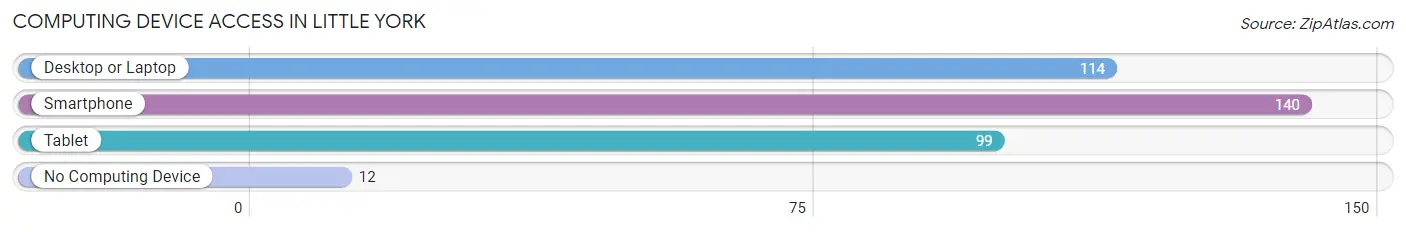
| Device Type | # Households | % Households |
| Desktop or Laptop | 114 | 69.9% |
| Smartphone | 140 | 85.9% |
| Tablet | 99 | 60.7% |
| No Computing Device | 12 | 7.4% |
| Total | 163 | 100.0% |
Internet Access in Little York
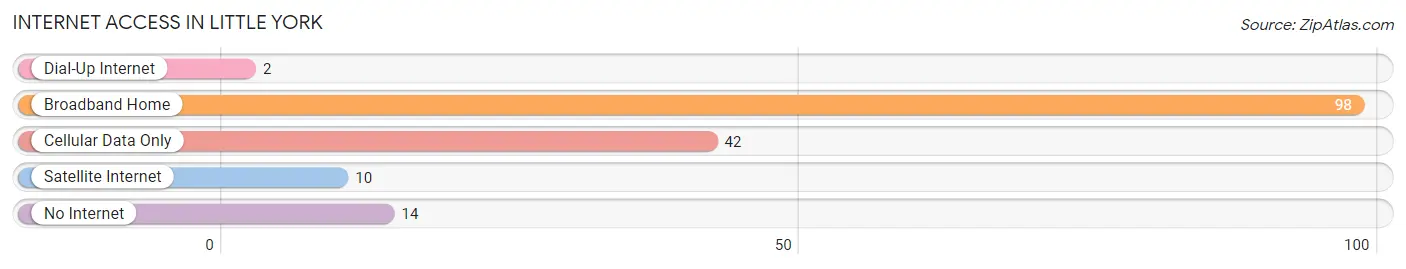
| Internet Type | # Households | % Households |
| Dial-Up Internet | 2 | 1.2% |
| Broadband Home | 98 | 60.1% |
| Cellular Data Only | 42 | 25.8% |
| Satellite Internet | 10 | 6.1% |
| No Internet | 14 | 8.6% |
| Total | 163 | 100.0% |
Little York Summary
York, Illinois is a small village located in Kendall County, Illinois. It is situated about 40 miles southwest of Chicago and is part of the Chicago metropolitan area. The village has a population of just over 1,000 people and is known for its rural charm and small-town atmosphere.
History
York was founded in 1836 by a group of settlers from New York. The village was originally known as Little York, but the name was changed to York in 1837. The village was incorporated in 1867.
The village was originally a farming community, but it soon became a popular destination for tourists. The village was known for its scenic beauty and its proximity to Chicago. In the late 19th century, the village was a popular destination for wealthy Chicagoans who wanted to escape the hustle and bustle of the city.
Geography
York is located in the Fox River Valley, which is part of the Chicago metropolitan area. The village is situated on the banks of the Fox River and is surrounded by rolling hills and farmland. The village is located about 40 miles southwest of Chicago and is accessible by car or train.
Economy
The economy of York is largely based on agriculture and tourism. The village is home to several farms, which produce a variety of crops, including corn, soybeans, and wheat. The village is also home to several wineries, which produce a variety of wines.
Tourism is an important part of the economy of York. The village is home to several historic sites, including the York House, which was built in 1837. The village is also home to several parks, including the York Park, which is a popular destination for picnics and outdoor activities.
Demographics
As of the 2010 census, the population of York was 1,037. The racial makeup of the village was 97.3% White, 0.7% African American, 0.3% Native American, 0.3% Asian, 0.1% Pacific Islander, 0.3% from other races, and 1.0% from two or more races. Hispanic or Latino of any race were 1.7% of the population.
The median income for a household in the village was $50,000, and the median income for a family was $54,000. The per capita income for the village was $21,000. About 4.3% of families and 5.3% of the population were below the poverty line, including 6.3% of those under age 18 and 4.3% of those age 65 or over.
Conclusion
York, Illinois is a small village located in Kendall County, Illinois. It is situated about 40 miles southwest of Chicago and is part of the Chicago metropolitan area. The village has a population of just over 1,000 people and is known for its rural charm and small-town atmosphere. The economy of York is largely based on agriculture and tourism, and the village is home to several historic sites and parks. The population of York is predominantly White, with a small percentage of African American, Native American, Asian, and Pacific Islander residents. The median income for a household in the village is $50,000, and the per capita income is $21,000.
Common Questions
What is Per Capita Income in Little York?
Per Capita income in Little York is $30,071.
What is the Median Family Income in Little York?
Median Family Income in Little York is $61,875.
What is the Median Household income in Little York?
Median Household Income in Little York is $52,375.
What is Income or Wage Gap in Little York?
Income or Wage Gap in Little York is 9.3%.
Women in Little York earn 90.7 cents for every dollar earned by a man.
What is Inequality or Gini Index in Little York?
Inequality or Gini Index in Little York is 0.41.
What is the Total Population of Little York?
Total Population of Little York is 402.
What is the Total Male Population of Little York?
Total Male Population of Little York is 200.
What is the Total Female Population of Little York?
Total Female Population of Little York is 202.
What is the Ratio of Males per 100 Females in Little York?
There are 99.01 Males per 100 Females in Little York.
What is the Ratio of Females per 100 Males in Little York?
There are 101.00 Females per 100 Males in Little York.
What is the Median Population Age in Little York?
Median Population Age in Little York is 27.3 Years.
What is the Average Family Size in Little York
Average Family Size in Little York is 3.2 People.
What is the Average Household Size in Little York
Average Household Size in Little York is 2.5 People.
How Large is the Labor Force in Little York?
There are 198 People in the Labor Forcein in Little York.
What is the Percentage of People in the Labor Force in Little York?
63.9% of People are in the Labor Force in Little York.
What is the Unemployment Rate in Little York?
Unemployment Rate in Little York is 2.0%.