The Galena Territory, IL Map & Demographics
The Galena Territory Map
The Galena Territory Overview
$66,824
PER CAPITA INCOME
$118,849
AVG FAMILY INCOME
$112,250
AVG HOUSEHOLD INCOME
0.38
INEQUALITY / GINI INDEX
1,606
TOTAL POPULATION
813
MALE POPULATION
793
FEMALE POPULATION
102.52
MALES / 100 FEMALES
97.54
FEMALES / 100 MALES
63.1
MEDIAN AGE
2.5
AVG FAMILY SIZE
2.2
AVG HOUSEHOLD SIZE
622
LABOR FORCE [ PEOPLE ]
43.5%
PERCENT IN LABOR FORCE
1.0%
UNEMPLOYMENT RATE
Income in The Galena Territory
Income Overview in The Galena Territory
Per Capita Income in The Galena Territory is $66,824, while median incomes of families and households are $118,849 and $112,250 respectively.
| Characteristic | Number | Measure |
| Per Capita Income | 1,606 | $66,824 |
| Median Family Income | 591 | $118,849 |
| Mean Family Income | 591 | $158,301 |
| Median Household Income | 717 | $112,250 |
| Mean Household Income | 717 | $145,105 |
| Income Deficit | 591 | $0 |
| Wage / Income Gap (%) | 1,606 | 0.00% |
| Wage / Income Gap ($) | 1,606 | 100.00¢ per $1 |
| Gini / Inequality Index | 1,606 | 0.38 |
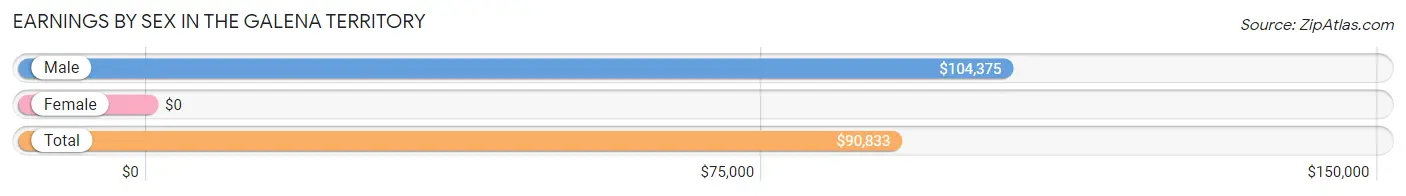
Earnings by Sex in The Galena Territory
| Sex | Number | Average Earnings |
| Male | 366 (54.9%) | $104,375 |
| Female | 300 (45.1%) | $0 |
| Total | 666 (100.0%) | $90,833 |
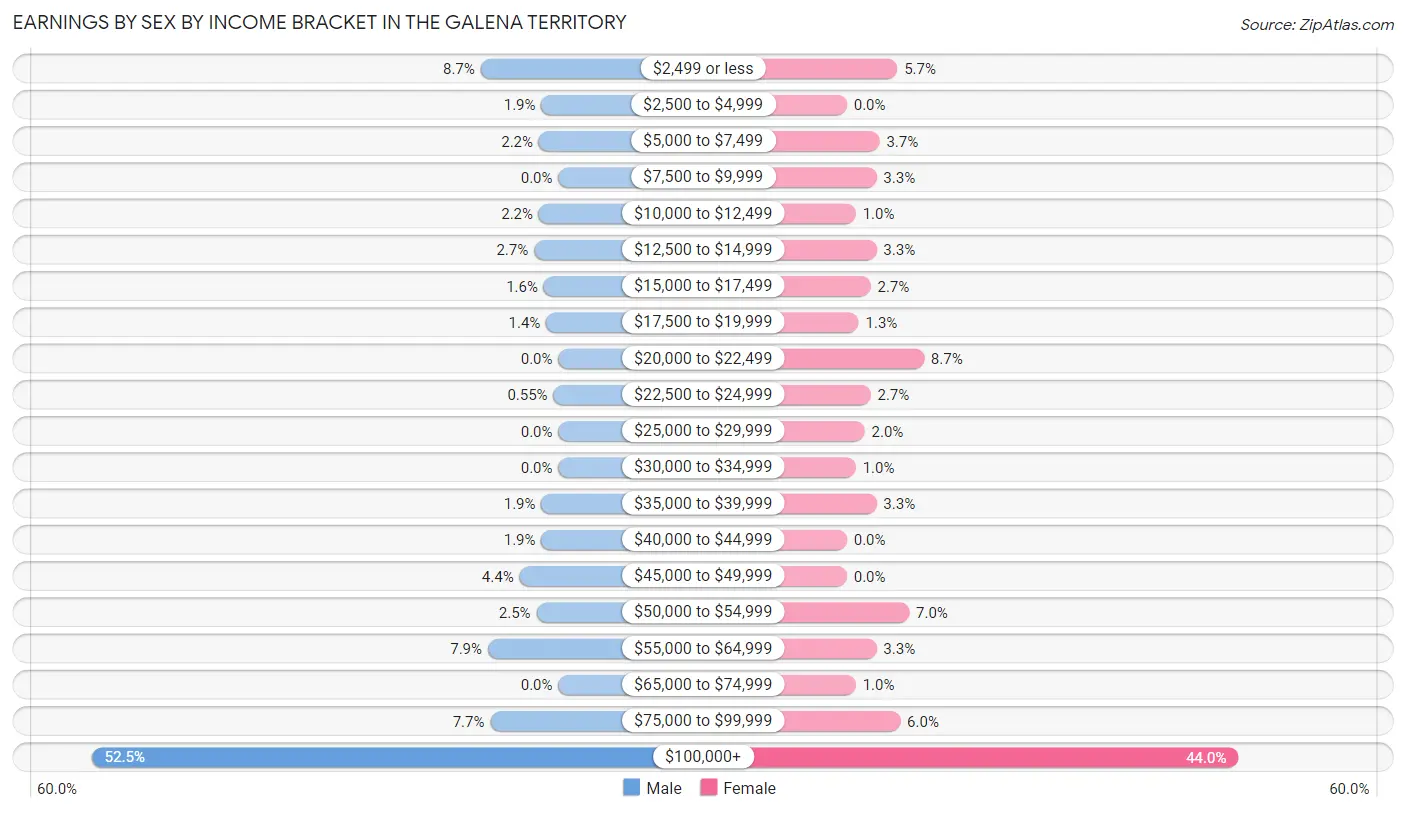
Earnings by Sex by Income Bracket in The Galena Territory
The most common earnings brackets in The Galena Territory are $100,000+ for men (192 | 52.5%) and $100,000+ for women (132 | 44.0%).
| Income | Male | Female |
| $2,499 or less | 32 (8.7%) | 17 (5.7%) |
| $2,500 to $4,999 | 7 (1.9%) | 0 (0.0%) |
| $5,000 to $7,499 | 8 (2.2%) | 11 (3.7%) |
| $7,500 to $9,999 | 0 (0.0%) | 10 (3.3%) |
| $10,000 to $12,499 | 8 (2.2%) | 3 (1.0%) |
| $12,500 to $14,999 | 10 (2.7%) | 10 (3.3%) |
| $15,000 to $17,499 | 6 (1.6%) | 8 (2.7%) |
| $17,500 to $19,999 | 5 (1.4%) | 4 (1.3%) |
| $20,000 to $22,499 | 0 (0.0%) | 26 (8.7%) |
| $22,500 to $24,999 | 2 (0.5%) | 8 (2.7%) |
| $25,000 to $29,999 | 0 (0.0%) | 6 (2.0%) |
| $30,000 to $34,999 | 0 (0.0%) | 3 (1.0%) |
| $35,000 to $39,999 | 7 (1.9%) | 10 (3.3%) |
| $40,000 to $44,999 | 7 (1.9%) | 0 (0.0%) |
| $45,000 to $49,999 | 16 (4.4%) | 0 (0.0%) |
| $50,000 to $54,999 | 9 (2.5%) | 21 (7.0%) |
| $55,000 to $64,999 | 29 (7.9%) | 10 (3.3%) |
| $65,000 to $74,999 | 0 (0.0%) | 3 (1.0%) |
| $75,000 to $99,999 | 28 (7.6%) | 18 (6.0%) |
| $100,000+ | 192 (52.5%) | 132 (44.0%) |
| Total | 366 (100.0%) | 300 (100.0%) |
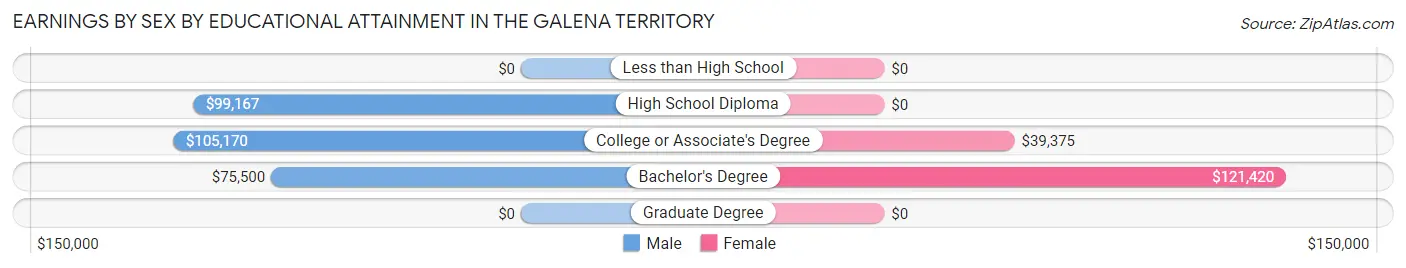
Earnings by Sex by Educational Attainment in The Galena Territory
| Educational Attainment | Male Income | Female Income |
| Less than High School | - | - |
| High School Diploma | $99,167 | $0 |
| College or Associate's Degree | $105,170 | $39,375 |
| Bachelor's Degree | $75,500 | $121,420 |
| Graduate Degree | - | - |
| Total | $104,688 | $0 |
Family Income in The Galena Territory
Family Income Brackets in The Galena Territory
According to the The Galena Territory family income data, there are 167 families falling into the $200,000+ income range, which is the most common income bracket and makes up 28.3% of all families.
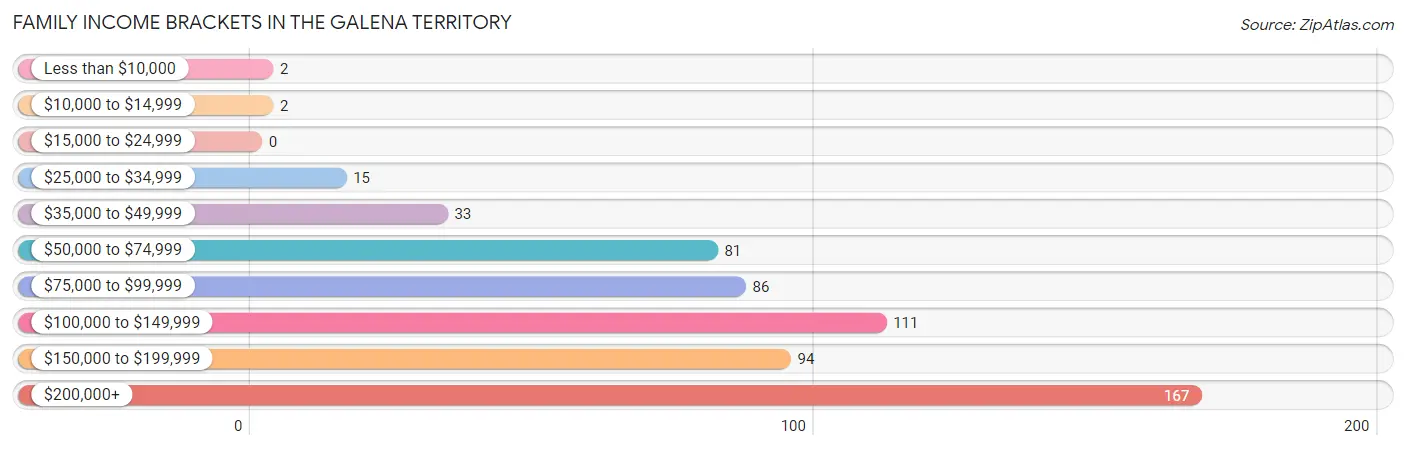
| Income Bracket | # Families | % Families |
| Less than $10,000 | 2 | 0.3% |
| $10,000 to $14,999 | 2 | 0.3% |
| $15,000 to $24,999 | 0 | 0.0% |
| $25,000 to $34,999 | 15 | 2.5% |
| $35,000 to $49,999 | 33 | 5.6% |
| $50,000 to $74,999 | 81 | 13.7% |
| $75,000 to $99,999 | 86 | 14.6% |
| $100,000 to $149,999 | 111 | 18.8% |
| $150,000 to $199,999 | 94 | 15.9% |
| $200,000+ | 167 | 28.3% |
Family Income by Famaliy Size in The Galena Territory
2-person families (467 | 79.0%) account for the highest median family income in The Galena Territory with $104,792 per family, while 2-person families (467 | 79.0%) have the highest median income of $52,396 per family member.
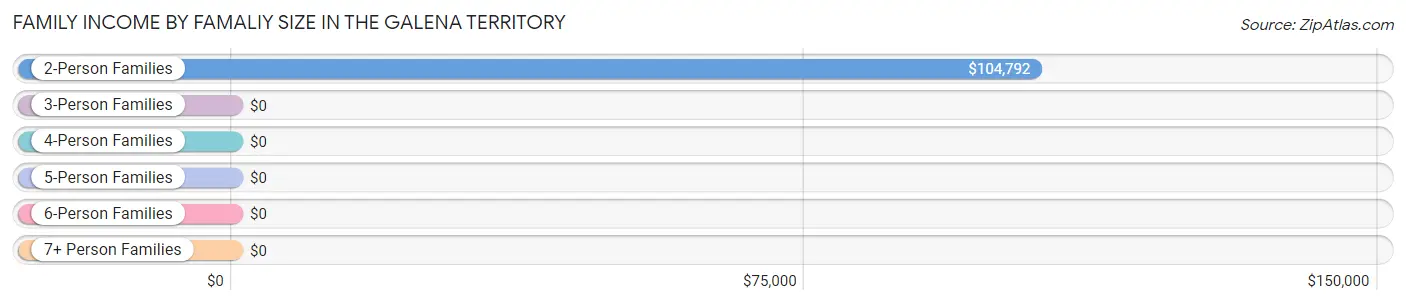
| Income Bracket | # Families | Median Income |
| 2-Person Families | 467 (79.0%) | $104,792 |
| 3-Person Families | 77 (13.0%) | $0 |
| 4-Person Families | 9 (1.5%) | $0 |
| 5-Person Families | 19 (3.2%) | $0 |
| 6-Person Families | 19 (3.2%) | $0 |
| 7+ Person Families | 0 (0.0%) | $0 |
| Total | 591 (100.0%) | $118,849 |
Family Income by Number of Earners in The Galena Territory
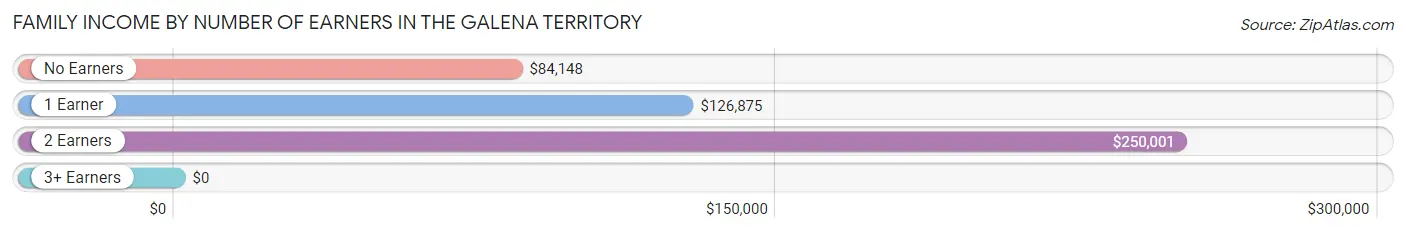
| Number of Earners | # Families | Median Income |
| No Earners | 221 (37.4%) | $84,148 |
| 1 Earner | 131 (22.2%) | $126,875 |
| 2 Earners | 234 (39.6%) | $250,001 |
| 3+ Earners | 5 (0.9%) | $0 |
| Total | 591 (100.0%) | $118,849 |
Household Income in The Galena Territory
Household Income Brackets in The Galena Territory
With 174 households falling in the category, the $200,000+ income range is the most frequent in The Galena Territory, accounting for 24.3% of all households. In contrast, only 2 households (0.3%) fall into the less than $10,000 income bracket, making it the least populous group.
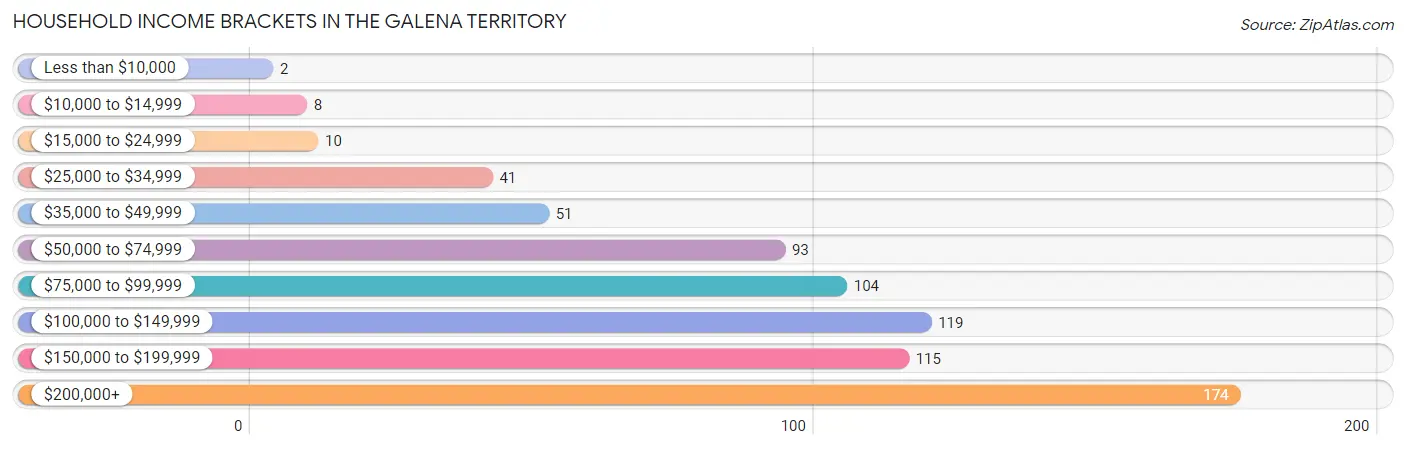
| Income Bracket | # Households | % Households |
| Less than $10,000 | 2 | 0.3% |
| $10,000 to $14,999 | 8 | 1.1% |
| $15,000 to $24,999 | 10 | 1.4% |
| $25,000 to $34,999 | 41 | 5.7% |
| $35,000 to $49,999 | 51 | 7.1% |
| $50,000 to $74,999 | 93 | 13.0% |
| $75,000 to $99,999 | 104 | 14.5% |
| $100,000 to $149,999 | 119 | 16.6% |
| $150,000 to $199,999 | 115 | 16.0% |
| $200,000+ | 174 | 24.3% |
Household Income by Householder Age in The Galena Territory
The median household income in The Galena Territory is $112,250, with the highest median household income of $198,882 found in the 45 to 64 years age bracket for the primary householder. A total of 253 households (35.3%) fall into this category.
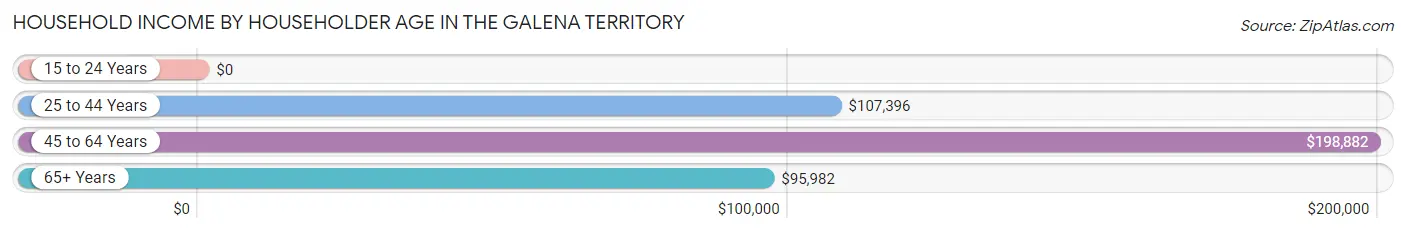
| Income Bracket | # Households | Median Income |
| 15 to 24 Years | 0 (0.0%) | $0 |
| 25 to 44 Years | 47 (6.6%) | $107,396 |
| 45 to 64 Years | 253 (35.3%) | $198,882 |
| 65+ Years | 417 (58.2%) | $95,982 |
| Total | 717 (100.0%) | $112,250 |
Poverty in The Galena Territory
Income Below Poverty by Sex and Age in The Galena Territory
With 0.6% poverty level for males and 1.3% for females among the residents of The Galena Territory, 35 to 44 year old males and 45 to 54 year old females are the most vulnerable to poverty, with 1 males (2.8%) and 5 females (3.6%) in their respective age groups living below the poverty level.
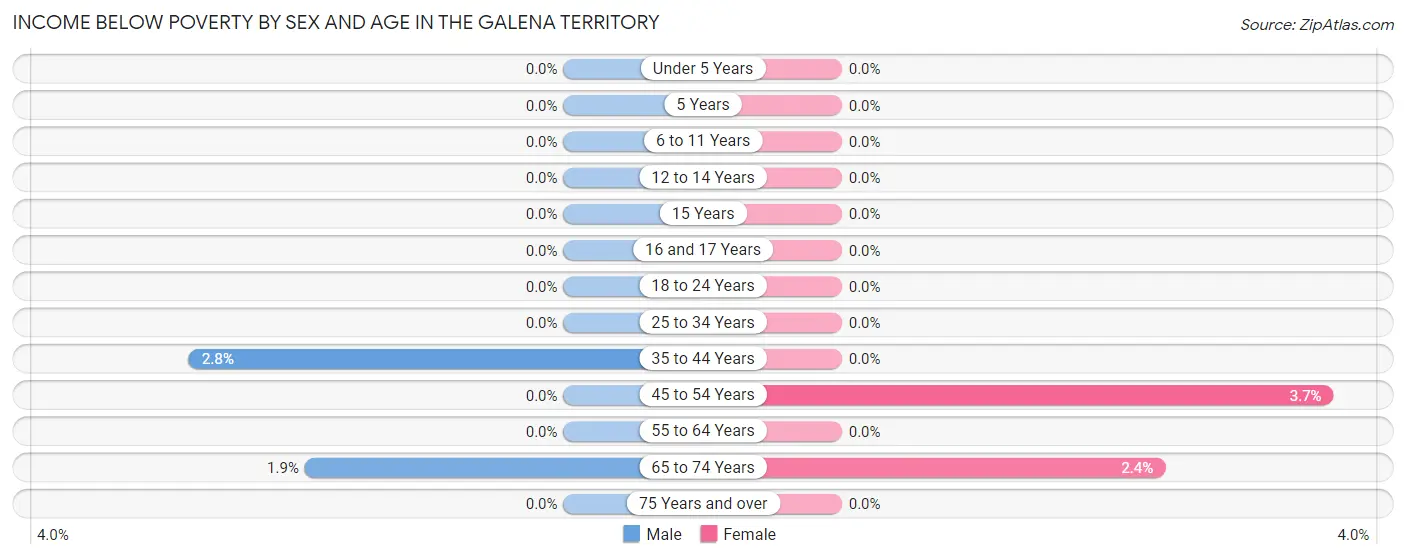
| Age Bracket | Male | Female |
| Under 5 Years | 0 (0.0%) | 0 (0.0%) |
| 5 Years | 0 (0.0%) | 0 (0.0%) |
| 6 to 11 Years | 0 (0.0%) | 0 (0.0%) |
| 12 to 14 Years | 0 (0.0%) | 0 (0.0%) |
| 15 Years | 0 (0.0%) | 0 (0.0%) |
| 16 and 17 Years | 0 (0.0%) | 0 (0.0%) |
| 18 to 24 Years | 0 (0.0%) | 0 (0.0%) |
| 25 to 34 Years | 0 (0.0%) | 0 (0.0%) |
| 35 to 44 Years | 1 (2.8%) | 0 (0.0%) |
| 45 to 54 Years | 0 (0.0%) | 5 (3.6%) |
| 55 to 64 Years | 0 (0.0%) | 0 (0.0%) |
| 65 to 74 Years | 4 (1.9%) | 5 (2.4%) |
| 75 Years and over | 0 (0.0%) | 0 (0.0%) |
| Total | 5 (0.6%) | 10 (1.3%) |
Income Above Poverty by Sex and Age in The Galena Territory
According to the poverty statistics in The Galena Territory, males aged under 5 years and females aged under 5 years are the age groups that are most secure financially, with 100.0% of males and 100.0% of females in these age groups living above the poverty line.
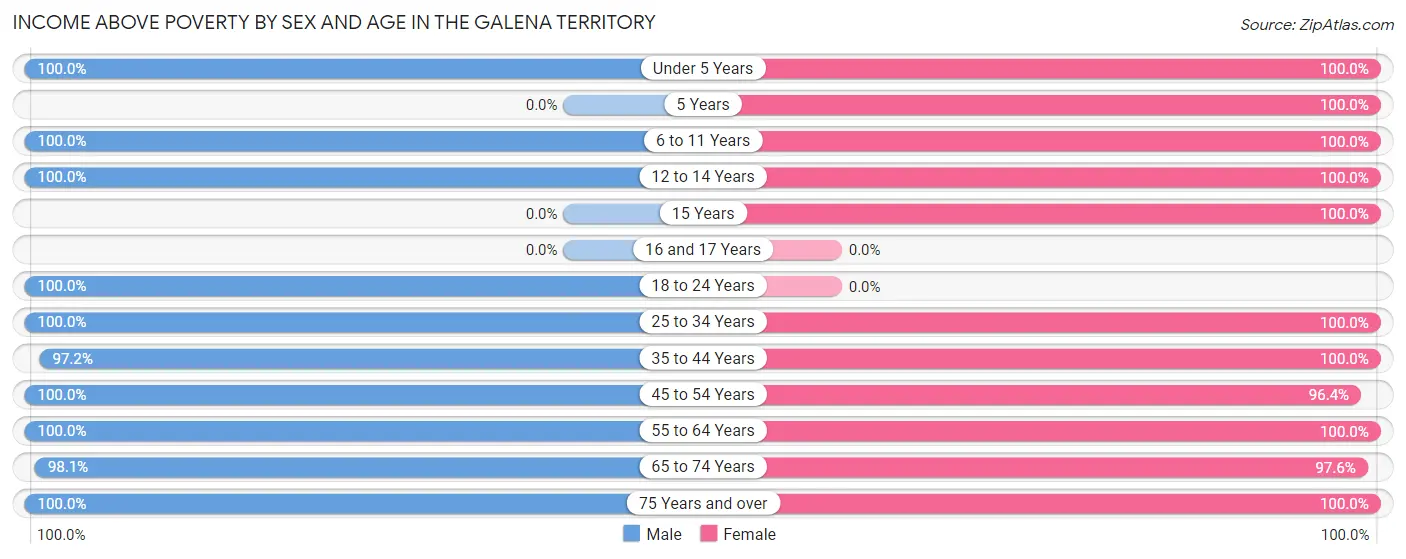
| Age Bracket | Male | Female |
| Under 5 Years | 5 (100.0%) | 10 (100.0%) |
| 5 Years | 0 (0.0%) | 3 (100.0%) |
| 6 to 11 Years | 53 (100.0%) | 34 (100.0%) |
| 12 to 14 Years | 38 (100.0%) | 14 (100.0%) |
| 15 Years | 0 (0.0%) | 20 (100.0%) |
| 16 and 17 Years | 0 (0.0%) | 0 (0.0%) |
| 18 to 24 Years | 14 (100.0%) | 0 (0.0%) |
| 25 to 34 Years | 43 (100.0%) | 14 (100.0%) |
| 35 to 44 Years | 35 (97.2%) | 59 (100.0%) |
| 45 to 54 Years | 133 (100.0%) | 132 (96.4%) |
| 55 to 64 Years | 117 (100.0%) | 149 (100.0%) |
| 65 to 74 Years | 204 (98.1%) | 203 (97.6%) |
| 75 Years and over | 166 (100.0%) | 145 (100.0%) |
| Total | 808 (99.4%) | 783 (98.7%) |
Income Below Poverty Among Married-Couple Families in The Galena Territory
The poverty statistics for married-couple families in The Galena Territory show that 0.7% or 4 of the total 583 families live below the poverty line. Families with no children have the highest poverty rate of 0.8%, comprising of 4 families. On the other hand, families with 1 or 2 children have the lowest poverty rate of 0.0%, which includes 0 families.
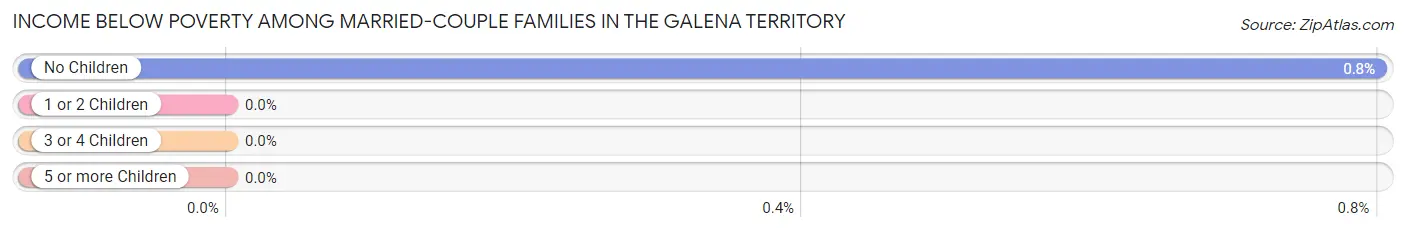
| Children | Above Poverty | Below Poverty |
| No Children | 498 (99.2%) | 4 (0.8%) |
| 1 or 2 Children | 62 (100.0%) | 0 (0.0%) |
| 3 or 4 Children | 19 (100.0%) | 0 (0.0%) |
| 5 or more Children | 0 (0.0%) | 0 (0.0%) |
| Total | 579 (99.3%) | 4 (0.7%) |
Income Below Poverty Among Single-Parent Households in The Galena Territory
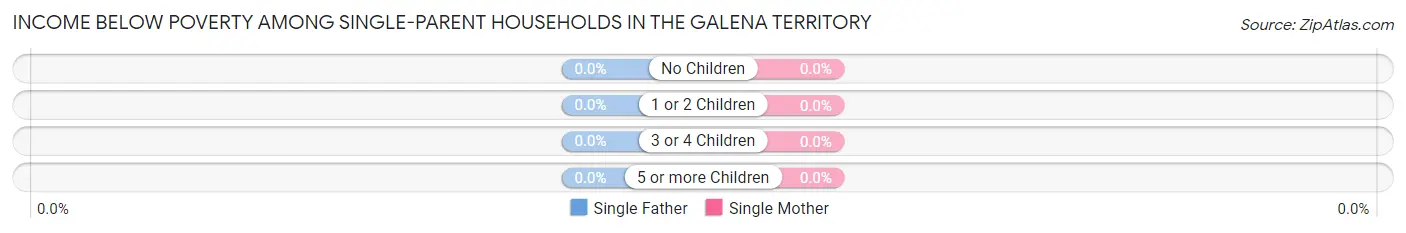
| Children | Single Father | Single Mother |
| No Children | 0 (0.0%) | 0 (0.0%) |
| 1 or 2 Children | 0 (0.0%) | 0 (0.0%) |
| 3 or 4 Children | 0 (0.0%) | 0 (0.0%) |
| 5 or more Children | 0 (0.0%) | 0 (0.0%) |
| Total | 0 (0.0%) | 0 (0.0%) |
Income Below Poverty Among Married-Couple vs Single-Parent Households in The Galena Territory
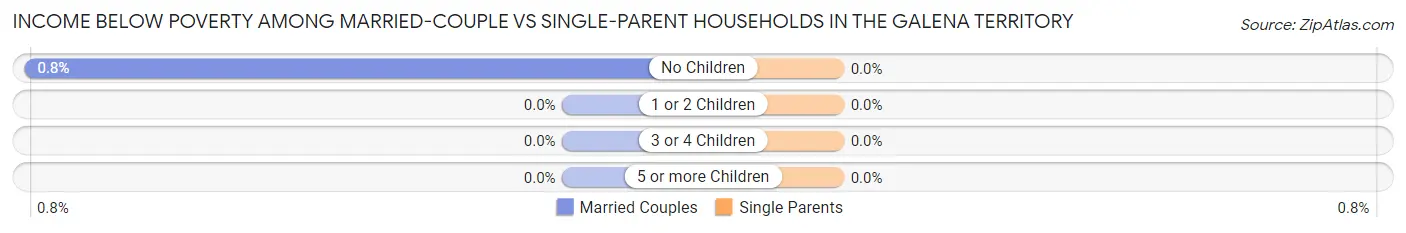
| Children | Married-Couple Families | Single-Parent Households |
| No Children | 4 (0.8%) | 0 (0.0%) |
| 1 or 2 Children | 0 (0.0%) | 0 (0.0%) |
| 3 or 4 Children | 0 (0.0%) | 0 (0.0%) |
| 5 or more Children | 0 (0.0%) | 0 (0.0%) |
| Total | 4 (0.7%) | 0 (0.0%) |
Race in The Galena Territory
The most populous races in The Galena Territory are White / Caucasian (1,460 | 90.9%), Two or more Races (140 | 8.7%), and Hispanic or Latino (120 | 7.5%).
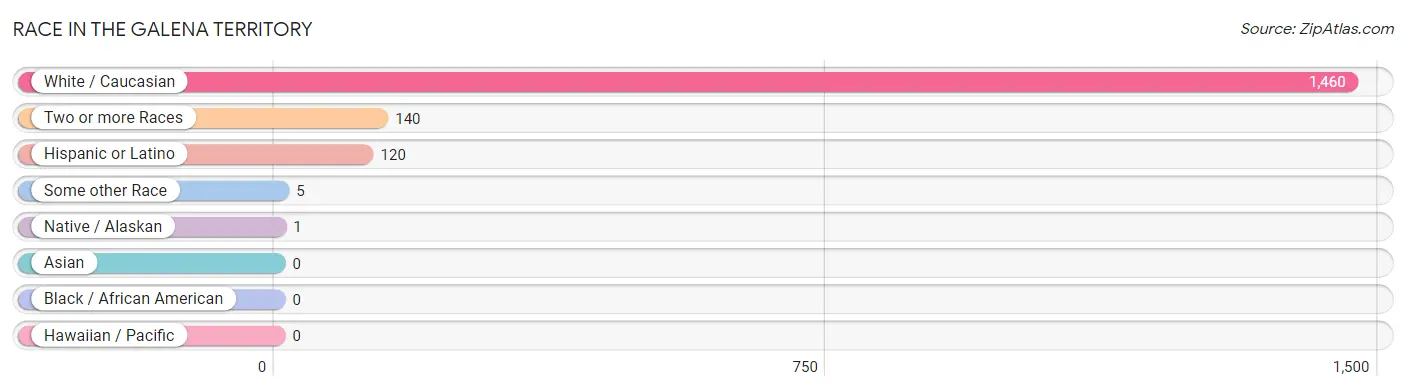
| Race | # Population | % Population |
| Asian | 0 | 0.0% |
| Black / African American | 0 | 0.0% |
| Hawaiian / Pacific | 0 | 0.0% |
| Hispanic or Latino | 120 | 7.5% |
| Native / Alaskan | 1 | 0.1% |
| White / Caucasian | 1,460 | 90.9% |
| Two or more Races | 140 | 8.7% |
| Some other Race | 5 | 0.3% |
| Total | 1,606 | 100.0% |
Ancestry in The Galena Territory
The most populous ancestries reported in The Galena Territory are German (408 | 25.4%), Polish (392 | 24.4%), Irish (224 | 14.0%), Italian (126 | 7.9%), and Czech (122 | 7.6%), together accounting for 79.2% of all The Galena Territory residents.
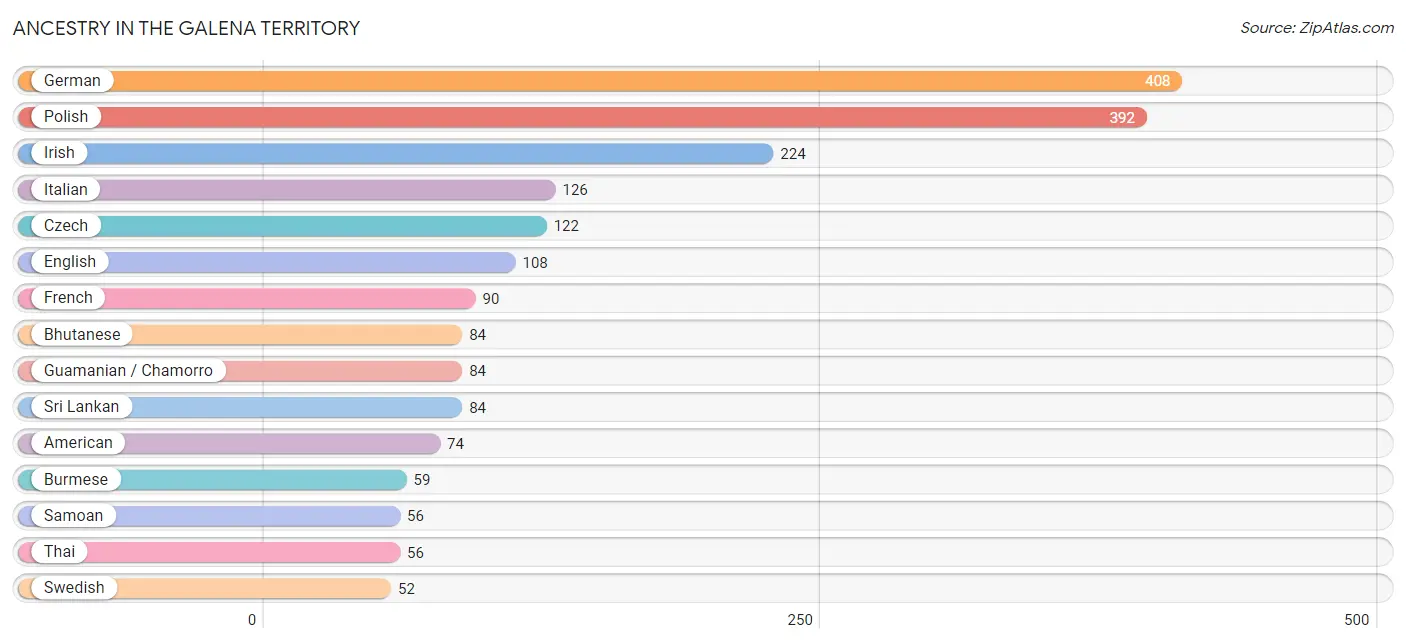
| Ancestry | # Population | % Population |
| American | 74 | 4.6% |
| Armenian | 6 | 0.4% |
| Assyrian / Chaldean / Syriac | 2 | 0.1% |
| Belgian | 13 | 0.8% |
| Bhutanese | 84 | 5.2% |
| British | 12 | 0.7% |
| Burmese | 59 | 3.7% |
| Croatian | 6 | 0.4% |
| Czech | 122 | 7.6% |
| Dutch | 28 | 1.7% |
| Eastern European | 6 | 0.4% |
| English | 108 | 6.7% |
| European | 16 | 1.0% |
| Finnish | 7 | 0.4% |
| French | 90 | 5.6% |
| French Canadian | 3 | 0.2% |
| German | 408 | 25.4% |
| Greek | 19 | 1.2% |
| Guamanian / Chamorro | 84 | 5.2% |
| Hungarian | 6 | 0.4% |
| Indian (Asian) | 31 | 1.9% |
| Irish | 224 | 14.0% |
| Italian | 126 | 7.9% |
| Korean | 28 | 1.7% |
| Lithuanian | 29 | 1.8% |
| Luxembourger | 3 | 0.2% |
| Mexican | 24 | 1.5% |
| Mexican American Indian | 12 | 0.7% |
| Native Hawaiian | 25 | 1.6% |
| Norwegian | 22 | 1.4% |
| Polish | 392 | 24.4% |
| Russian | 3 | 0.2% |
| Samoan | 56 | 3.5% |
| Scandinavian | 8 | 0.5% |
| Scotch-Irish | 44 | 2.7% |
| Scottish | 18 | 1.1% |
| Slovak | 45 | 2.8% |
| Slovene | 2 | 0.1% |
| Spanish | 11 | 0.7% |
| Sri Lankan | 84 | 5.2% |
| Swedish | 52 | 3.2% |
| Swiss | 25 | 1.6% |
| Thai | 56 | 3.5% |
| Ukrainian | 13 | 0.8% |
| Welsh | 4 | 0.3% | View All 45 Rows |
Immigrants in The Galena Territory
The most numerous immigrant groups reported in The Galena Territory came from Europe (22 | 1.4%), Canada (16 | 1.0%), Central America (12 | 0.7%), Latin America (12 | 0.7%), and Mexico (12 | 0.7%), together accounting for 4.6% of all The Galena Territory residents.
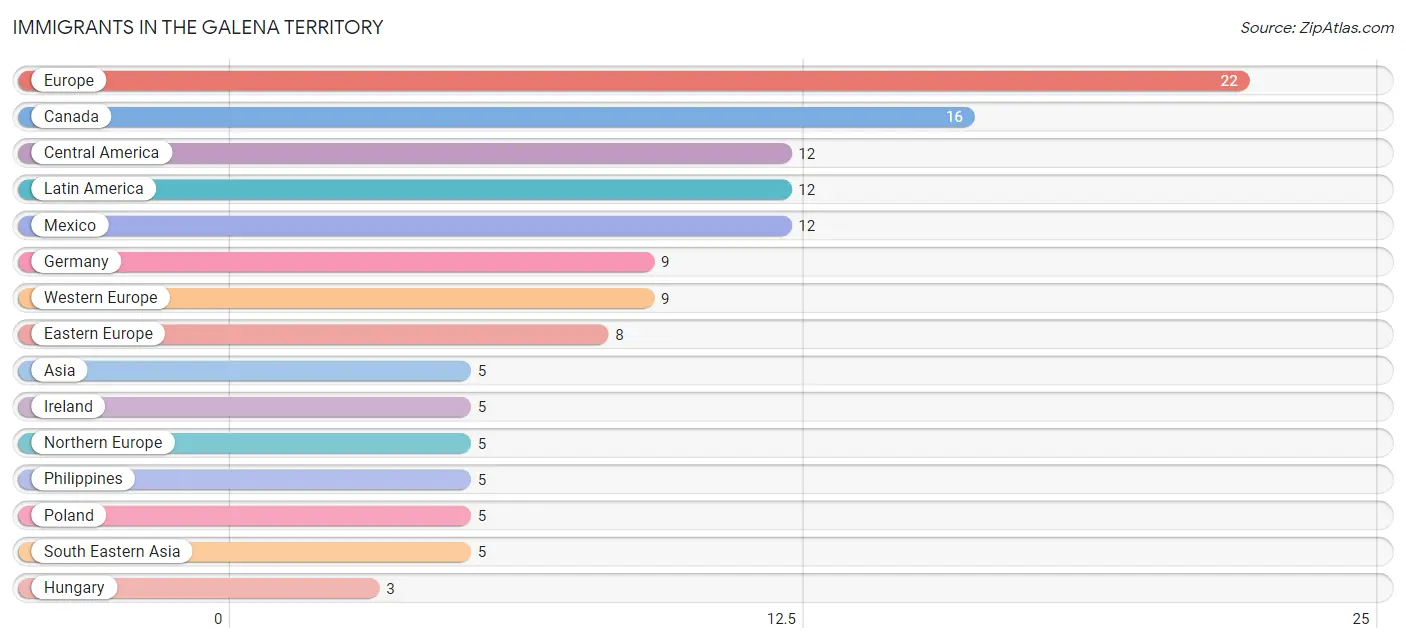
| Immigration Origin | # Population | % Population |
| Asia | 5 | 0.3% |
| Canada | 16 | 1.0% |
| Central America | 12 | 0.7% |
| Eastern Europe | 8 | 0.5% |
| Europe | 22 | 1.4% |
| Germany | 9 | 0.6% |
| Hungary | 3 | 0.2% |
| Ireland | 5 | 0.3% |
| Latin America | 12 | 0.7% |
| Mexico | 12 | 0.7% |
| Northern Europe | 5 | 0.3% |
| Philippines | 5 | 0.3% |
| Poland | 5 | 0.3% |
| South Eastern Asia | 5 | 0.3% |
| Western Europe | 9 | 0.6% | View All 15 Rows |
Sex and Age in The Galena Territory
Sex and Age in The Galena Territory
The most populous age groups in The Galena Territory are 75 to 79 Years (122 | 15.0%) for men and 45 to 49 Years (126 | 15.9%) for women.
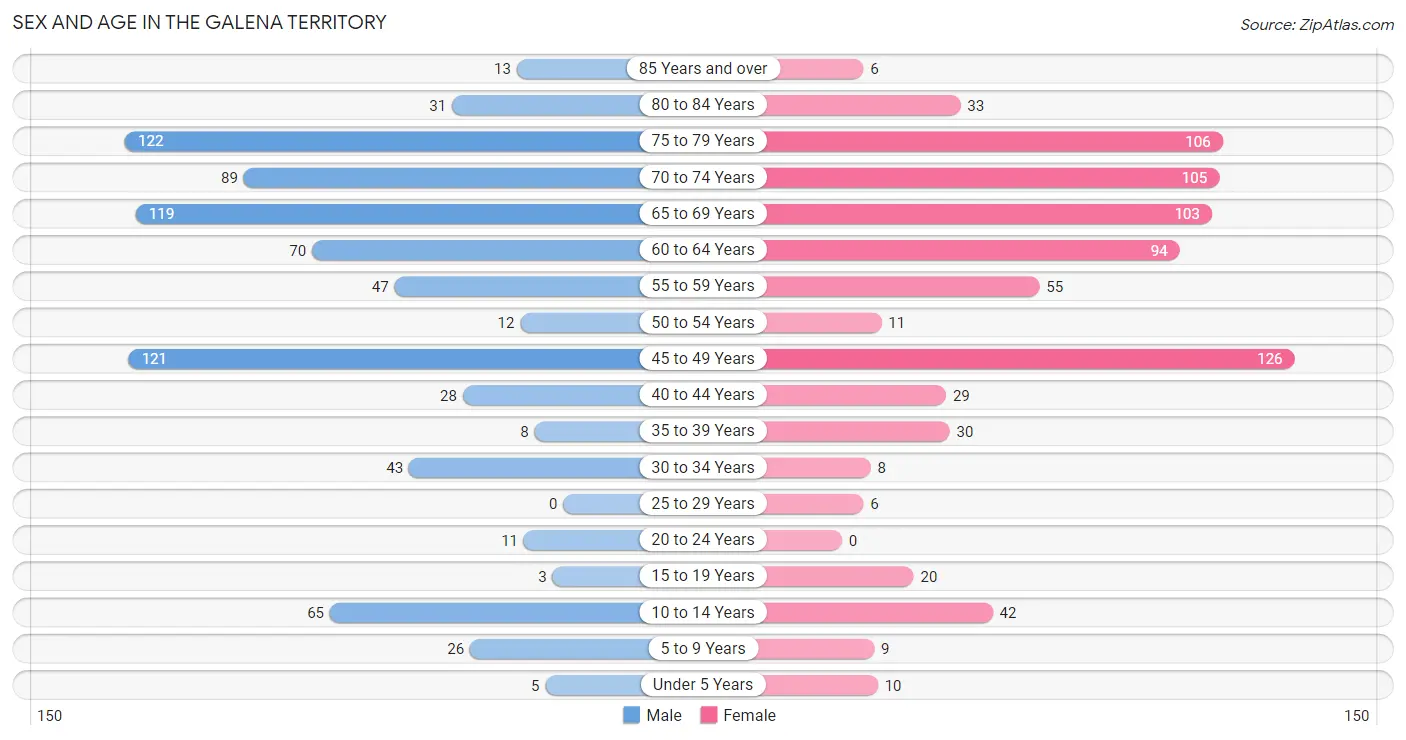
| Age Bracket | Male | Female |
| Under 5 Years | 5 (0.6%) | 10 (1.3%) |
| 5 to 9 Years | 26 (3.2%) | 9 (1.1%) |
| 10 to 14 Years | 65 (8.0%) | 42 (5.3%) |
| 15 to 19 Years | 3 (0.4%) | 20 (2.5%) |
| 20 to 24 Years | 11 (1.3%) | 0 (0.0%) |
| 25 to 29 Years | 0 (0.0%) | 6 (0.8%) |
| 30 to 34 Years | 43 (5.3%) | 8 (1.0%) |
| 35 to 39 Years | 8 (1.0%) | 30 (3.8%) |
| 40 to 44 Years | 28 (3.4%) | 29 (3.7%) |
| 45 to 49 Years | 121 (14.9%) | 126 (15.9%) |
| 50 to 54 Years | 12 (1.5%) | 11 (1.4%) |
| 55 to 59 Years | 47 (5.8%) | 55 (6.9%) |
| 60 to 64 Years | 70 (8.6%) | 94 (11.8%) |
| 65 to 69 Years | 119 (14.6%) | 103 (13.0%) |
| 70 to 74 Years | 89 (11.0%) | 105 (13.2%) |
| 75 to 79 Years | 122 (15.0%) | 106 (13.4%) |
| 80 to 84 Years | 31 (3.8%) | 33 (4.2%) |
| 85 Years and over | 13 (1.6%) | 6 (0.8%) |
| Total | 813 (100.0%) | 793 (100.0%) |
Families and Households in The Galena Territory
Median Family Size in The Galena Territory
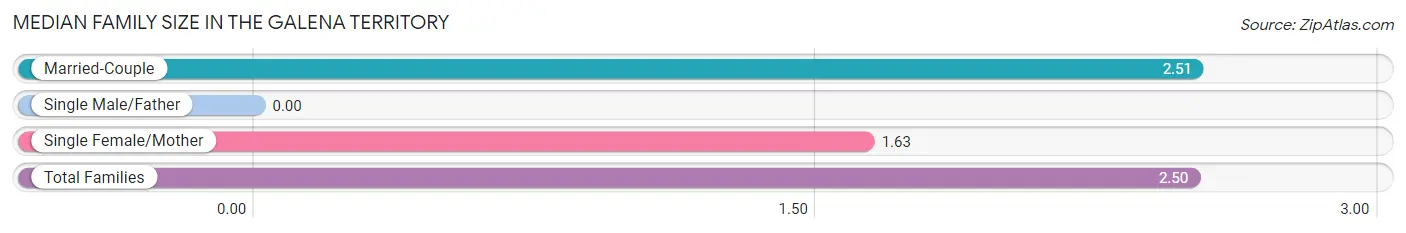
| Family Type | # Families | Family Size |
| Married-Couple | 583 (98.7%) | 2.51 |
| Single Male/Father | 0 (0.0%) | - |
| Single Female/Mother | 8 (1.3%) | 1.63 |
| Total Families | 591 (100.0%) | 2.50 |
Median Household Size in The Galena Territory
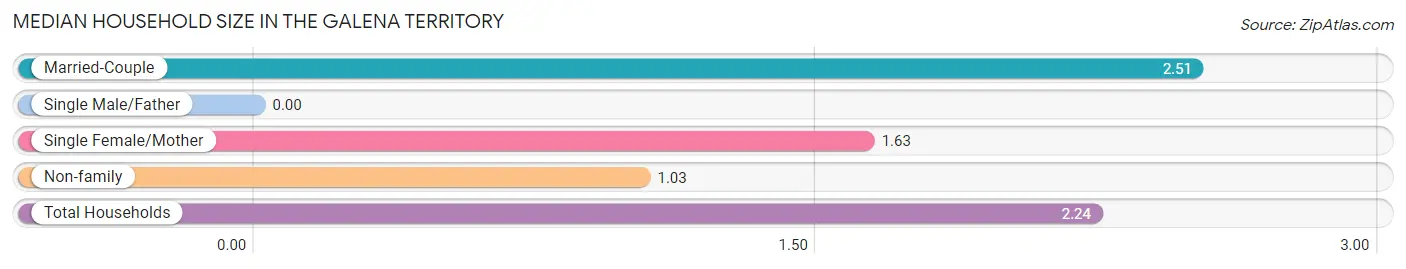
| Household Type | # Households | Household Size |
| Married-Couple | 583 (81.3%) | 2.51 |
| Single Male/Father | 0 (0.0%) | - |
| Single Female/Mother | 8 (1.1%) | 1.63 |
| Non-family | 126 (17.6%) | 1.03 |
| Total Households | 717 (100.0%) | 2.24 |
Household Size by Marriage Status in The Galena Territory
Out of a total of 717 households in The Galena Territory, 591 (82.4%) are family households, while 126 (17.6%) are nonfamily households. The most numerous type of family households are 2-person households, comprising 467, and the most common type of nonfamily households are 1-person households, comprising 120.
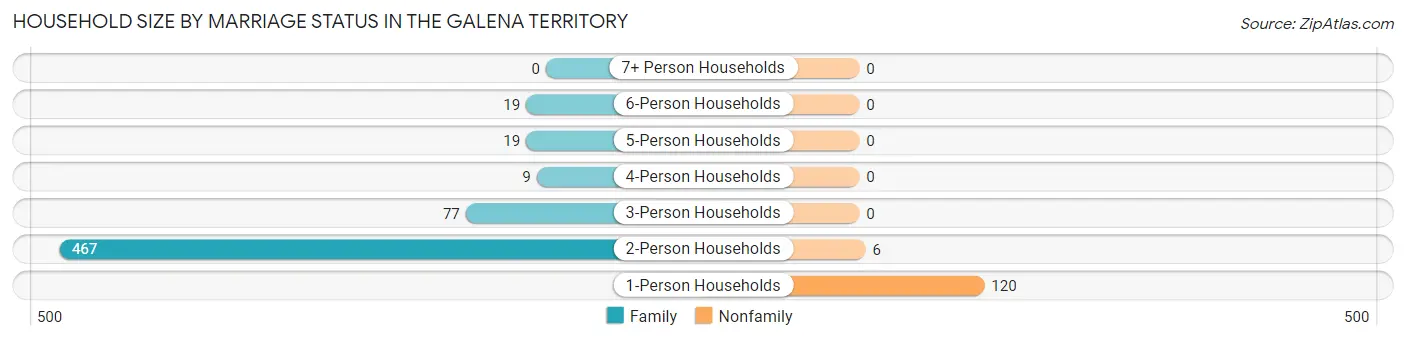
| Household Size | Family Households | Nonfamily Households |
| 1-Person Households | - | 120 (16.7%) |
| 2-Person Households | 467 (65.1%) | 6 (0.8%) |
| 3-Person Households | 77 (10.7%) | 0 (0.0%) |
| 4-Person Households | 9 (1.3%) | 0 (0.0%) |
| 5-Person Households | 19 (2.6%) | 0 (0.0%) |
| 6-Person Households | 19 (2.6%) | 0 (0.0%) |
| 7+ Person Households | 0 (0.0%) | 0 (0.0%) |
| Total | 591 (82.4%) | 126 (17.6%) |
Female Fertility in The Galena Territory
Fertility by Age in The Galena Territory
Average fertility rate in The Galena Territory is 13.0 births per 1,000 women. Women in the age bracket of 35 to 50 years have the highest fertility rate with 16.0 births per 1,000 women. Women in the age bracket of 35 to 50 years acount for 100.0% of all women with births.
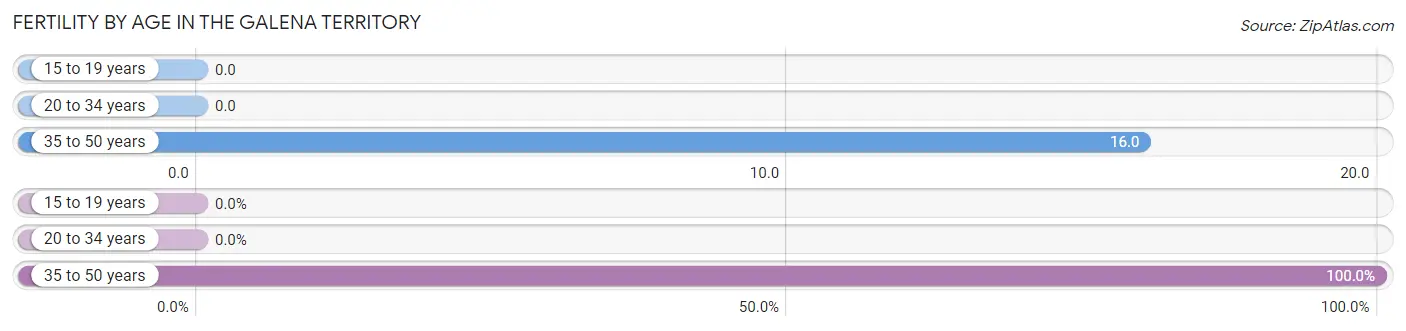
| Age Bracket | Women with Births | Births / 1,000 Women |
| 15 to 19 years | 0 (0.0%) | 0.0 |
| 20 to 34 years | 0 (0.0%) | 0.0 |
| 35 to 50 years | 3 (100.0%) | 16.0 |
| Total | 3 (100.0%) | 13.0 |
Fertility by Age by Marriage Status in The Galena Territory
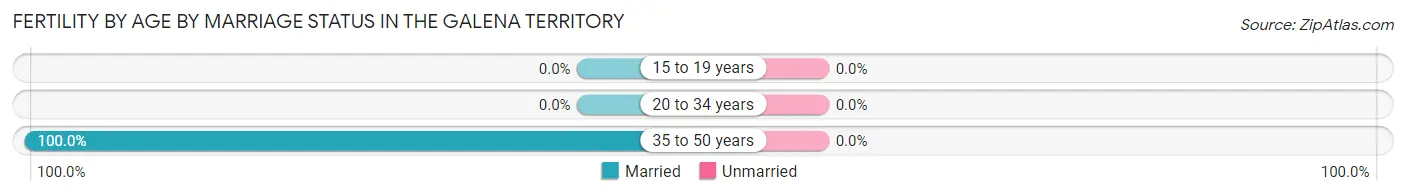
| Age Bracket | Married | Unmarried |
| 15 to 19 years | 0 (0.0%) | 0 (0.0%) |
| 20 to 34 years | 0 (0.0%) | 0 (0.0%) |
| 35 to 50 years | 3 (100.0%) | 0 (0.0%) |
| Total | 3 (100.0%) | 0 (0.0%) |
Fertility by Education in The Galena Territory
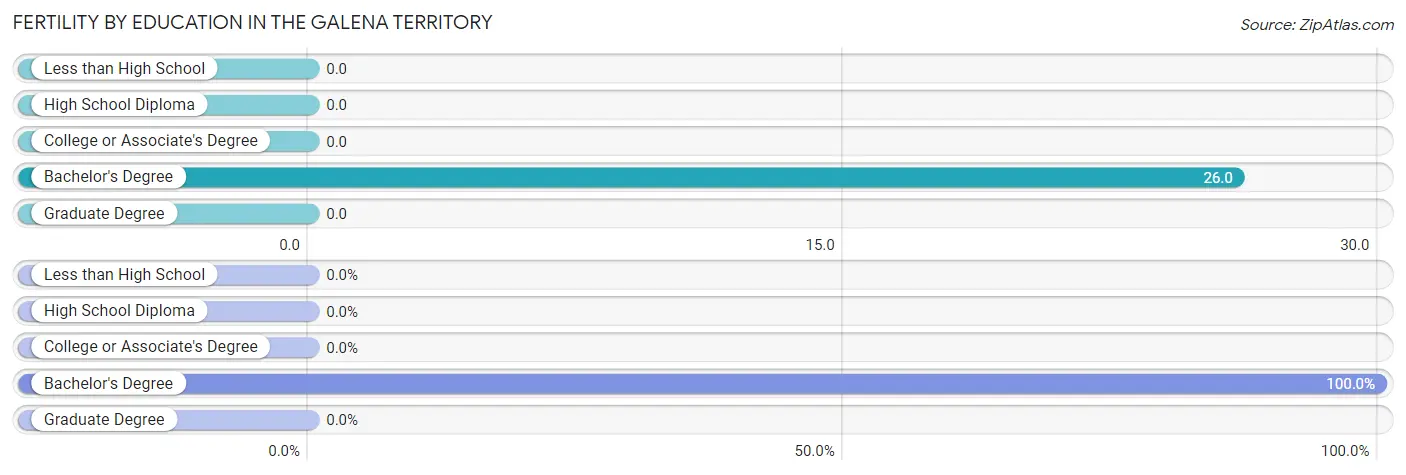
| Educational Attainment | Women with Births | Births / 1,000 Women |
| Less than High School | 0 (0.0%) | 0.0 |
| High School Diploma | 0 (0.0%) | 0.0 |
| College or Associate's Degree | 0 (0.0%) | 0.0 |
| Bachelor's Degree | 3 (100.0%) | 26.0 |
| Graduate Degree | 0 (0.0%) | 0.0 |
| Total | 3 (100.0%) | 13.0 |
Fertility by Education by Marriage Status in The Galena Territory
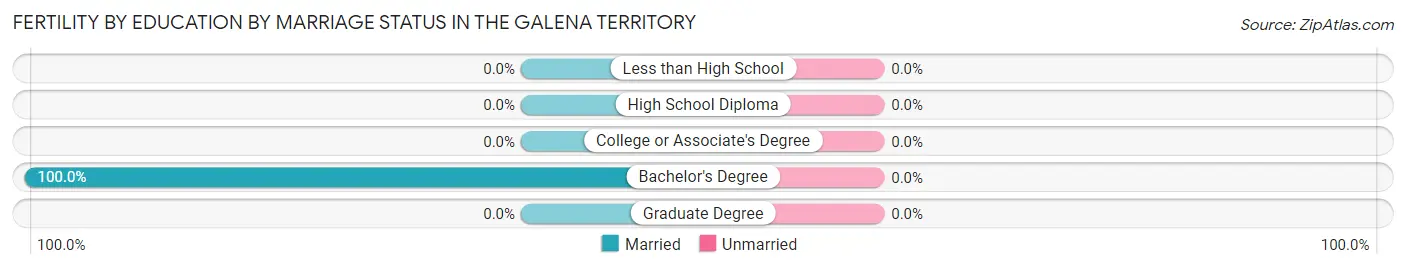
| Educational Attainment | Married | Unmarried |
| Less than High School | 0 (0.0%) | 0 (0.0%) |
| High School Diploma | 0 (0.0%) | 0 (0.0%) |
| College or Associate's Degree | 0 (0.0%) | 0 (0.0%) |
| Bachelor's Degree | 3 (100.0%) | 0 (0.0%) |
| Graduate Degree | 0 (0.0%) | 0 (0.0%) |
| Total | 3 (100.0%) | 0 (0.0%) |
Employment Characteristics in The Galena Territory
Employment by Class of Employer in The Galena Territory
Among the 616 employed individuals in The Galena Territory, private company employees (344 | 55.8%), self-employed (incorporated) (93 | 15.1%), and not-for-profit organizations (68 | 11.0%) make up the most common classes of employment.
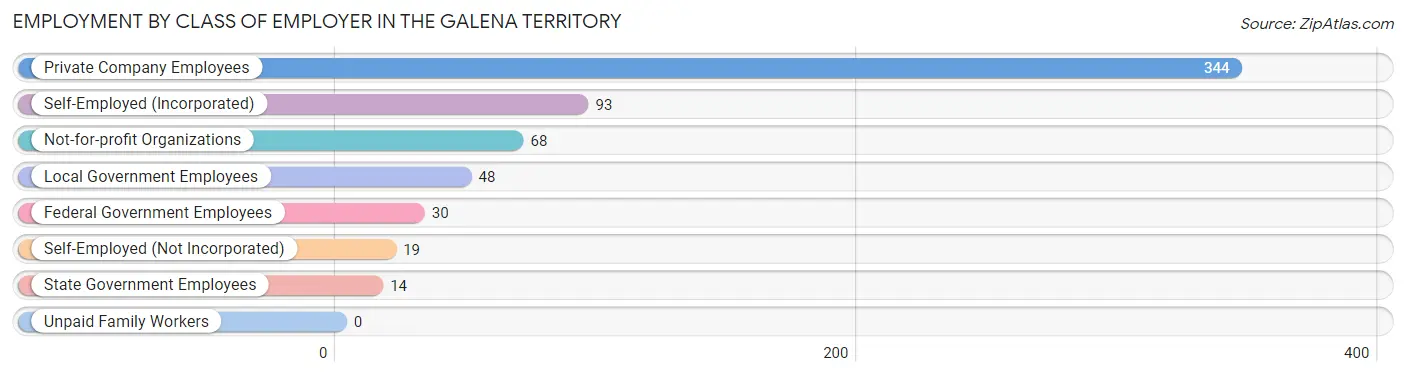
| Employer Class | # Employees | % Employees |
| Private Company Employees | 344 | 55.8% |
| Self-Employed (Incorporated) | 93 | 15.1% |
| Self-Employed (Not Incorporated) | 19 | 3.1% |
| Not-for-profit Organizations | 68 | 11.0% |
| Local Government Employees | 48 | 7.8% |
| State Government Employees | 14 | 2.3% |
| Federal Government Employees | 30 | 4.9% |
| Unpaid Family Workers | 0 | 0.0% |
| Total | 616 | 100.0% |
Employment Status by Age in The Galena Territory
According to the labor force statistics for The Galena Territory, out of the total population over 16 years of age (1,429), 43.5% or 622 individuals are in the labor force, with 1.0% or 6 of them unemployed. The age group with the highest labor force participation rate is 16 to 19 years, with 100.0% or 3 individuals in the labor force. Within the labor force, the 60 to 64 years age range has the highest percentage of unemployed individuals, with 4.6% or 3 of them being unemployed.
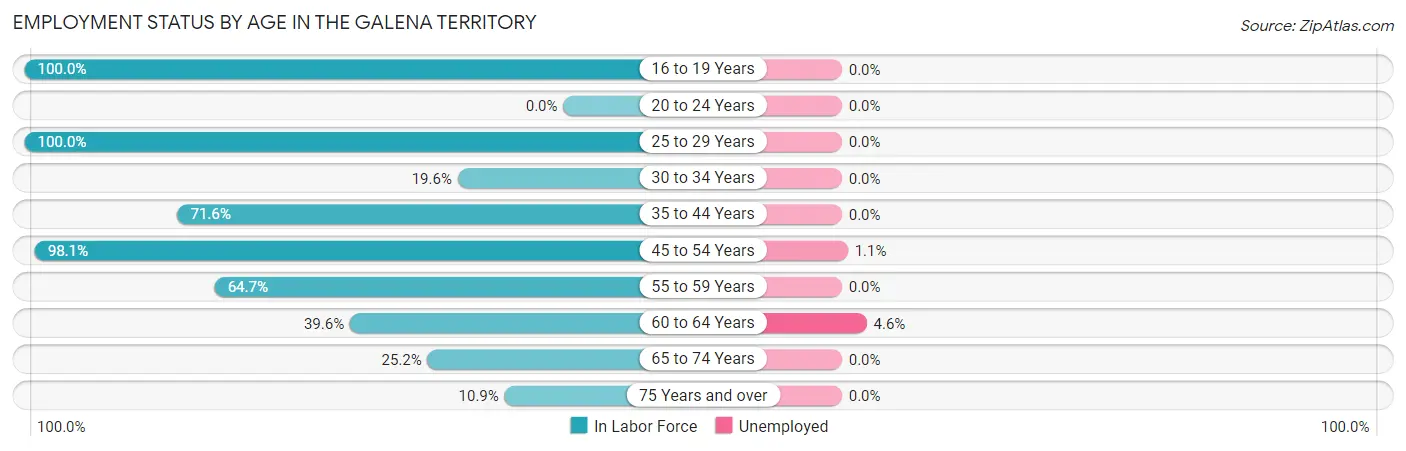
| Age Bracket | In Labor Force | Unemployed |
| 16 to 19 Years | 3 (100.0%) | 0 (0.0%) |
| 20 to 24 Years | 0 (0.0%) | 0 (0.0%) |
| 25 to 29 Years | 6 (100.0%) | 0 (0.0%) |
| 30 to 34 Years | 10 (19.6%) | 0 (0.0%) |
| 35 to 44 Years | 68 (71.6%) | 0 (0.0%) |
| 45 to 54 Years | 265 (98.1%) | 3 (1.1%) |
| 55 to 59 Years | 66 (64.7%) | 0 (0.0%) |
| 60 to 64 Years | 65 (39.6%) | 3 (4.6%) |
| 65 to 74 Years | 105 (25.2%) | 0 (0.0%) |
| 75 Years and over | 34 (10.9%) | 0 (0.0%) |
| Total | 622 (43.5%) | 6 (1.0%) |
Employment Status by Educational Attainment in The Galena Territory
According to labor force statistics for The Galena Territory, 69.8% of individuals (480) out of the total population between 25 and 64 years of age (688) are in the labor force, with 1.3% or 6 of them being unemployed. The group with the highest labor force participation rate are those with the educational attainment of less than high school, with 100.0% or 3 individuals in the labor force. Within the labor force, individuals with college / associate degree education have the highest percentage of unemployment, with 2.4% or 3 of them being unemployed.
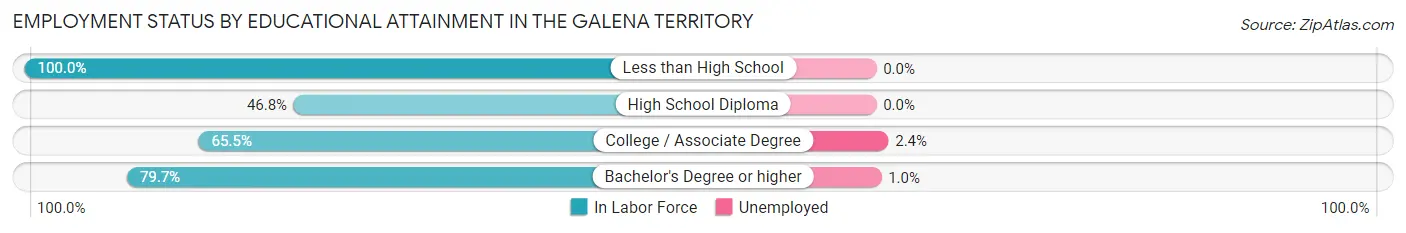
| Educational Attainment | In Labor Force | Unemployed |
| Less than High School | 3 (100.0%) | 0 (0.0%) |
| High School Diploma | 59 (46.8%) | 0 (0.0%) |
| College / Associate Degree | 127 (65.5%) | 5 (2.4%) |
| Bachelor's Degree or higher | 291 (79.7%) | 4 (1.0%) |
| Total | 480 (69.8%) | 9 (1.3%) |
Employment Occupations by Sex in The Galena Territory
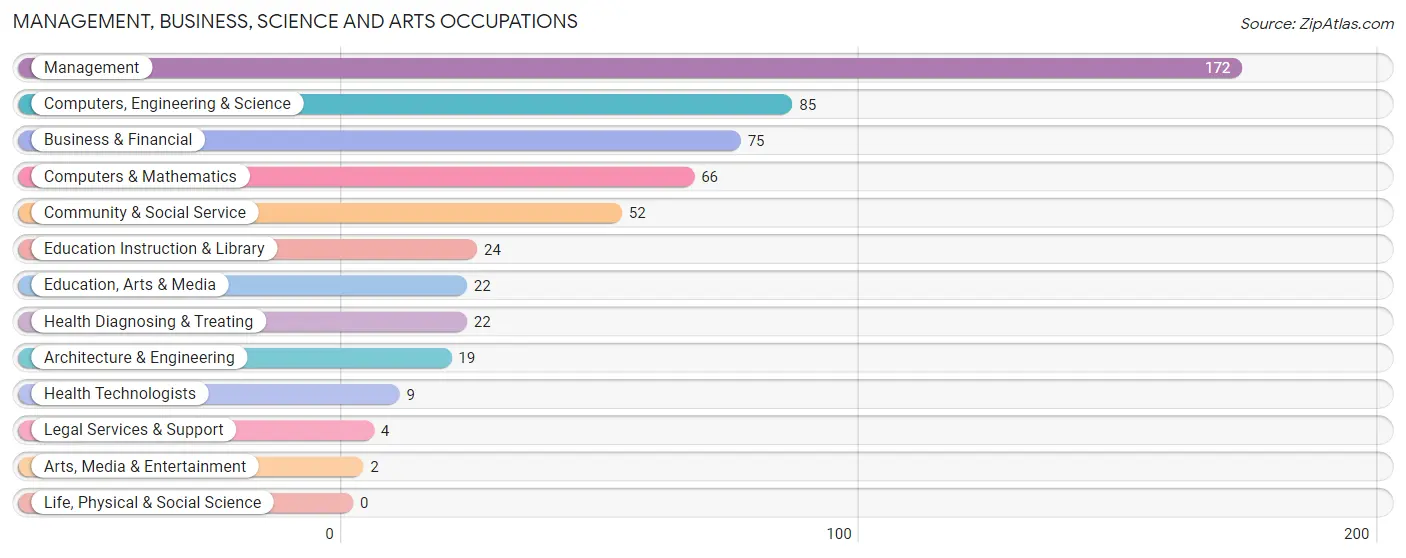
Management, Business, Science and Arts Occupations
The most common Management, Business, Science and Arts occupations in The Galena Territory are Management (172 | 27.9%), Computers, Engineering & Science (85 | 13.8%), Business & Financial (75 | 12.2%), Computers & Mathematics (66 | 10.7%), and Community & Social Service (52 | 8.4%).
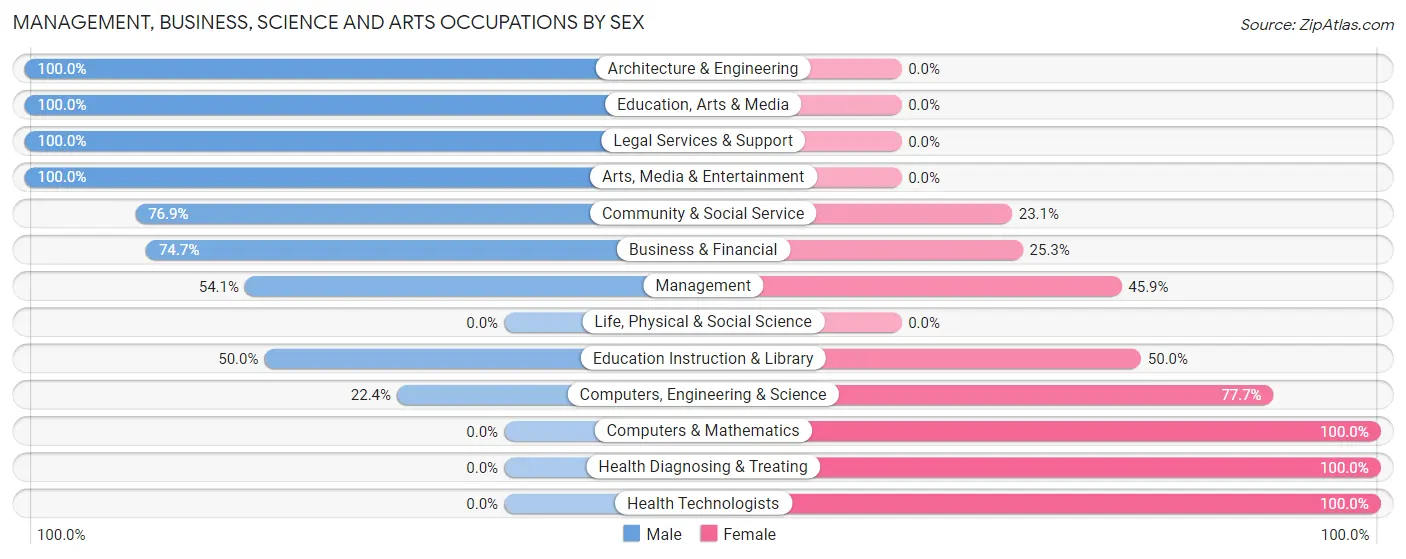
Management, Business, Science and Arts Occupations by Sex
Within the Management, Business, Science and Arts occupations in The Galena Territory, the most male-oriented occupations are Architecture & Engineering (100.0%), Education, Arts & Media (100.0%), and Legal Services & Support (100.0%), while the most female-oriented occupations are Computers & Mathematics (100.0%), Health Diagnosing & Treating (100.0%), and Health Technologists (100.0%).
| Occupation | Male | Female |
| Management | 93 (54.1%) | 79 (45.9%) |
| Business & Financial | 56 (74.7%) | 19 (25.3%) |
| Computers, Engineering & Science | 19 (22.4%) | 66 (77.6%) |
| Computers & Mathematics | 0 (0.0%) | 66 (100.0%) |
| Architecture & Engineering | 19 (100.0%) | 0 (0.0%) |
| Life, Physical & Social Science | 0 (0.0%) | 0 (0.0%) |
| Community & Social Service | 40 (76.9%) | 12 (23.1%) |
| Education, Arts & Media | 22 (100.0%) | 0 (0.0%) |
| Legal Services & Support | 4 (100.0%) | 0 (0.0%) |
| Education Instruction & Library | 12 (50.0%) | 12 (50.0%) |
| Arts, Media & Entertainment | 2 (100.0%) | 0 (0.0%) |
| Health Diagnosing & Treating | 0 (0.0%) | 22 (100.0%) |
| Health Technologists | 0 (0.0%) | 9 (100.0%) |
| Total (Category) | 208 (51.2%) | 198 (48.8%) |
| Total (Overall) | 338 (54.9%) | 278 (45.1%) |
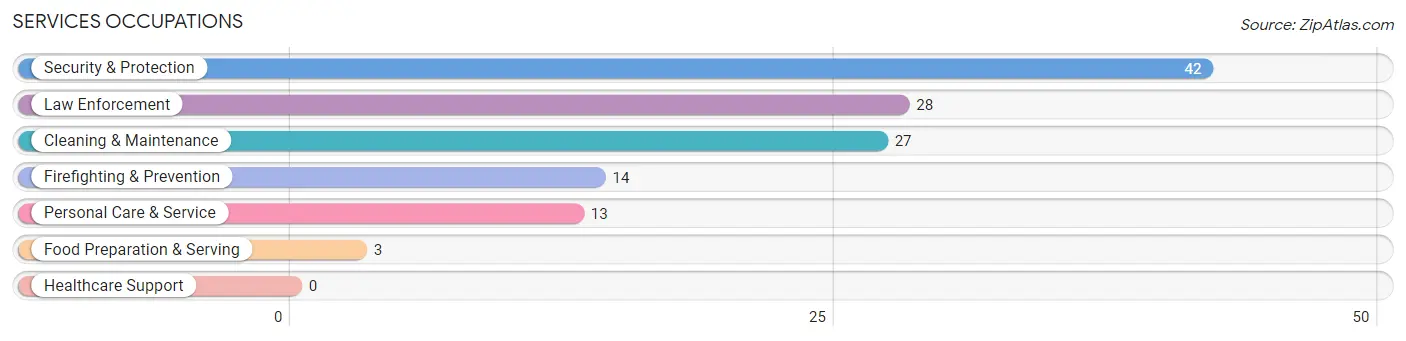
Services Occupations
The most common Services occupations in The Galena Territory are Security & Protection (42 | 6.8%), Law Enforcement (28 | 4.5%), Cleaning & Maintenance (27 | 4.4%), Firefighting & Prevention (14 | 2.3%), and Personal Care & Service (13 | 2.1%).
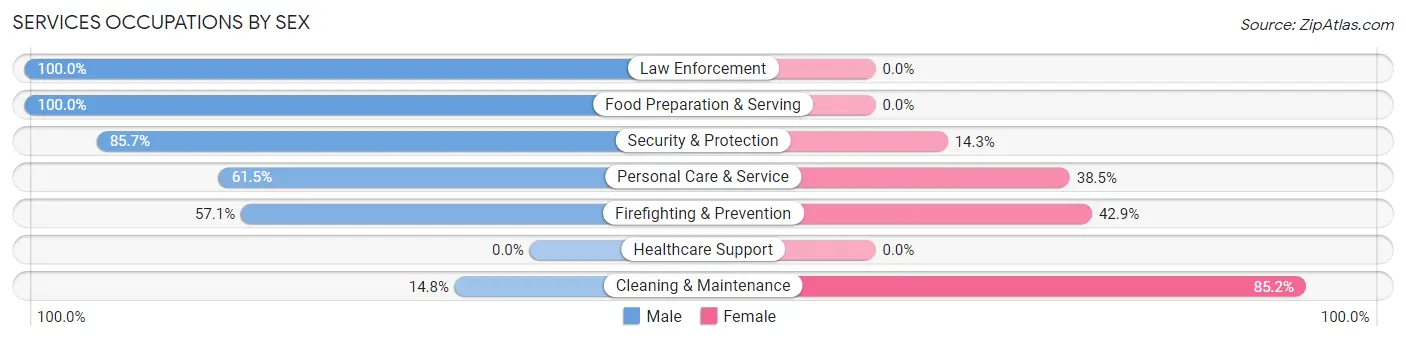
Services Occupations by Sex
Within the Services occupations in The Galena Territory, the most male-oriented occupations are Law Enforcement (100.0%), Food Preparation & Serving (100.0%), and Security & Protection (85.7%), while the most female-oriented occupations are Cleaning & Maintenance (85.2%), Firefighting & Prevention (42.9%), and Personal Care & Service (38.5%).
| Occupation | Male | Female |
| Healthcare Support | 0 (0.0%) | 0 (0.0%) |
| Security & Protection | 36 (85.7%) | 6 (14.3%) |
| Firefighting & Prevention | 8 (57.1%) | 6 (42.9%) |
| Law Enforcement | 28 (100.0%) | 0 (0.0%) |
| Food Preparation & Serving | 3 (100.0%) | 0 (0.0%) |
| Cleaning & Maintenance | 4 (14.8%) | 23 (85.2%) |
| Personal Care & Service | 8 (61.5%) | 5 (38.5%) |
| Total (Category) | 51 (60.0%) | 34 (40.0%) |
| Total (Overall) | 338 (54.9%) | 278 (45.1%) |
Sales and Office Occupations
The most common Sales and Office occupations in The Galena Territory are Sales & Related (58 | 9.4%), and Office & Administration (33 | 5.4%).
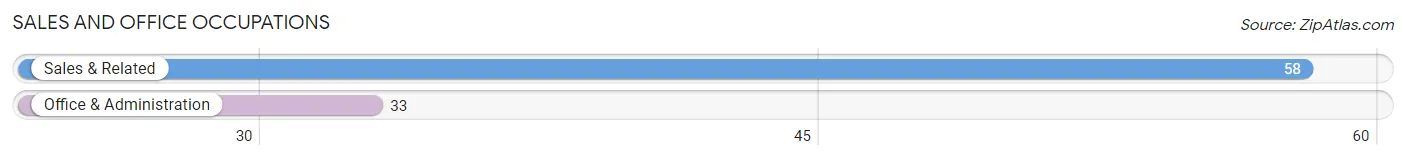
Sales and Office Occupations by Sex

| Occupation | Male | Female |
| Sales & Related | 39 (67.2%) | 19 (32.8%) |
| Office & Administration | 9 (27.3%) | 24 (72.7%) |
| Total (Category) | 48 (52.7%) | 43 (47.2%) |
| Total (Overall) | 338 (54.9%) | 278 (45.1%) |
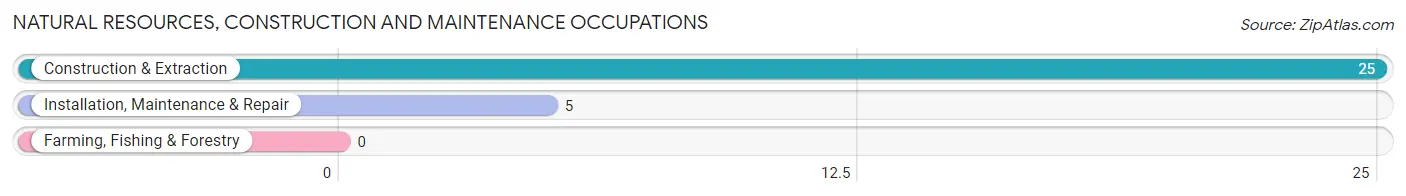
Natural Resources, Construction and Maintenance Occupations
The most common Natural Resources, Construction and Maintenance occupations in The Galena Territory are Construction & Extraction (25 | 4.1%), and Installation, Maintenance & Repair (5 | 0.8%).
Natural Resources, Construction and Maintenance Occupations by Sex
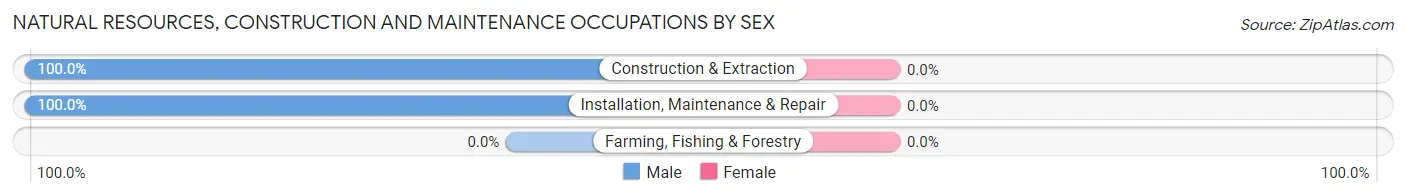
| Occupation | Male | Female |
| Farming, Fishing & Forestry | 0 (0.0%) | 0 (0.0%) |
| Construction & Extraction | 25 (100.0%) | 0 (0.0%) |
| Installation, Maintenance & Repair | 5 (100.0%) | 0 (0.0%) |
| Total (Category) | 30 (100.0%) | 0 (0.0%) |
| Total (Overall) | 338 (54.9%) | 278 (45.1%) |
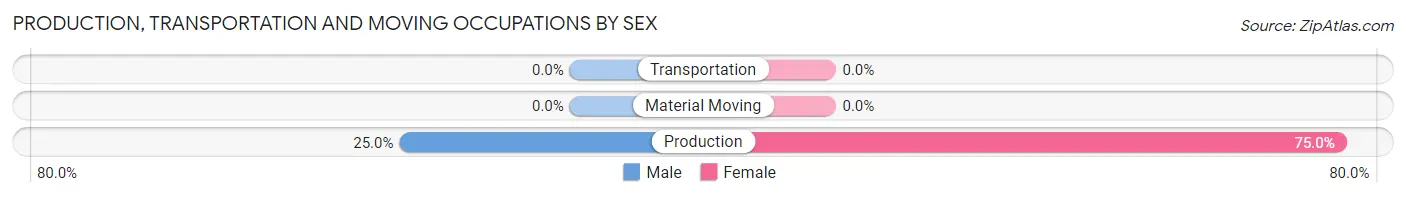
Production, Transportation and Moving Occupations
The most common Production, Transportation and Moving occupations in The Galena Territory are , and Production (4 | 0.6%).
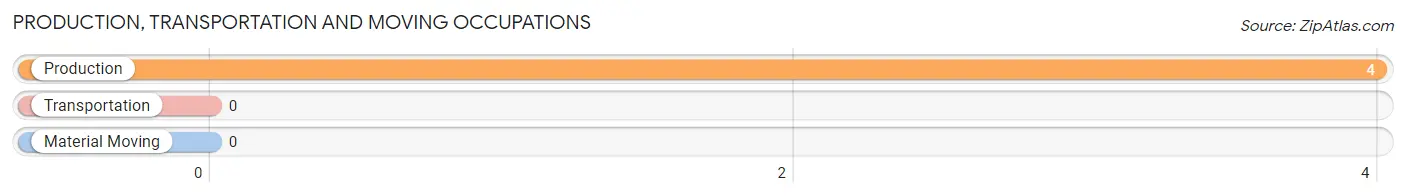
Production, Transportation and Moving Occupations by Sex
| Occupation | Male | Female |
| Production | 1 (25.0%) | 3 (75.0%) |
| Transportation | 0 (0.0%) | 0 (0.0%) |
| Material Moving | 0 (0.0%) | 0 (0.0%) |
| Total (Category) | 1 (25.0%) | 3 (75.0%) |
| Total (Overall) | 338 (54.9%) | 278 (45.1%) |
Employment Industries by Sex in The Galena Territory
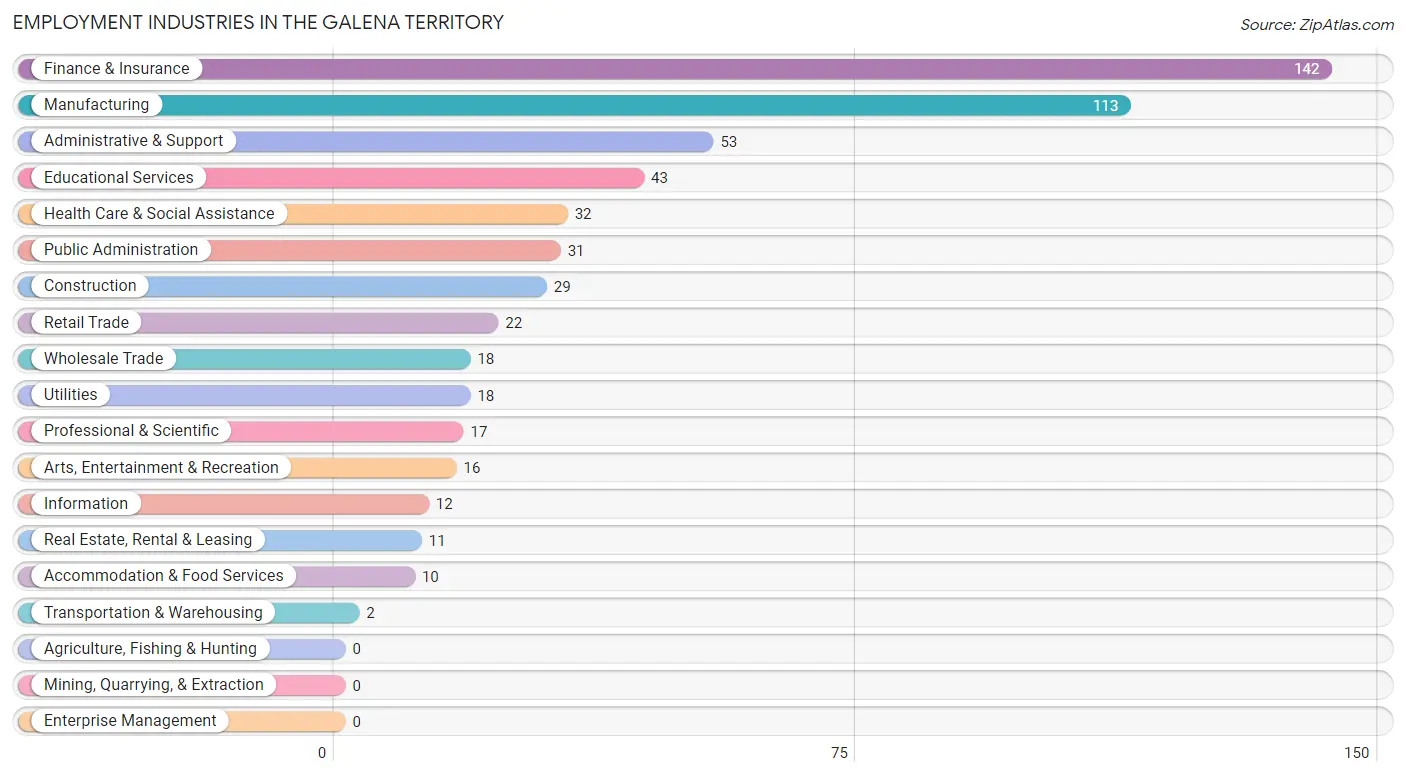
Employment Industries in The Galena Territory
The major employment industries in The Galena Territory include Finance & Insurance (142 | 23.1%), Manufacturing (113 | 18.3%), Administrative & Support (53 | 8.6%), Educational Services (43 | 7.0%), and Health Care & Social Assistance (32 | 5.2%).
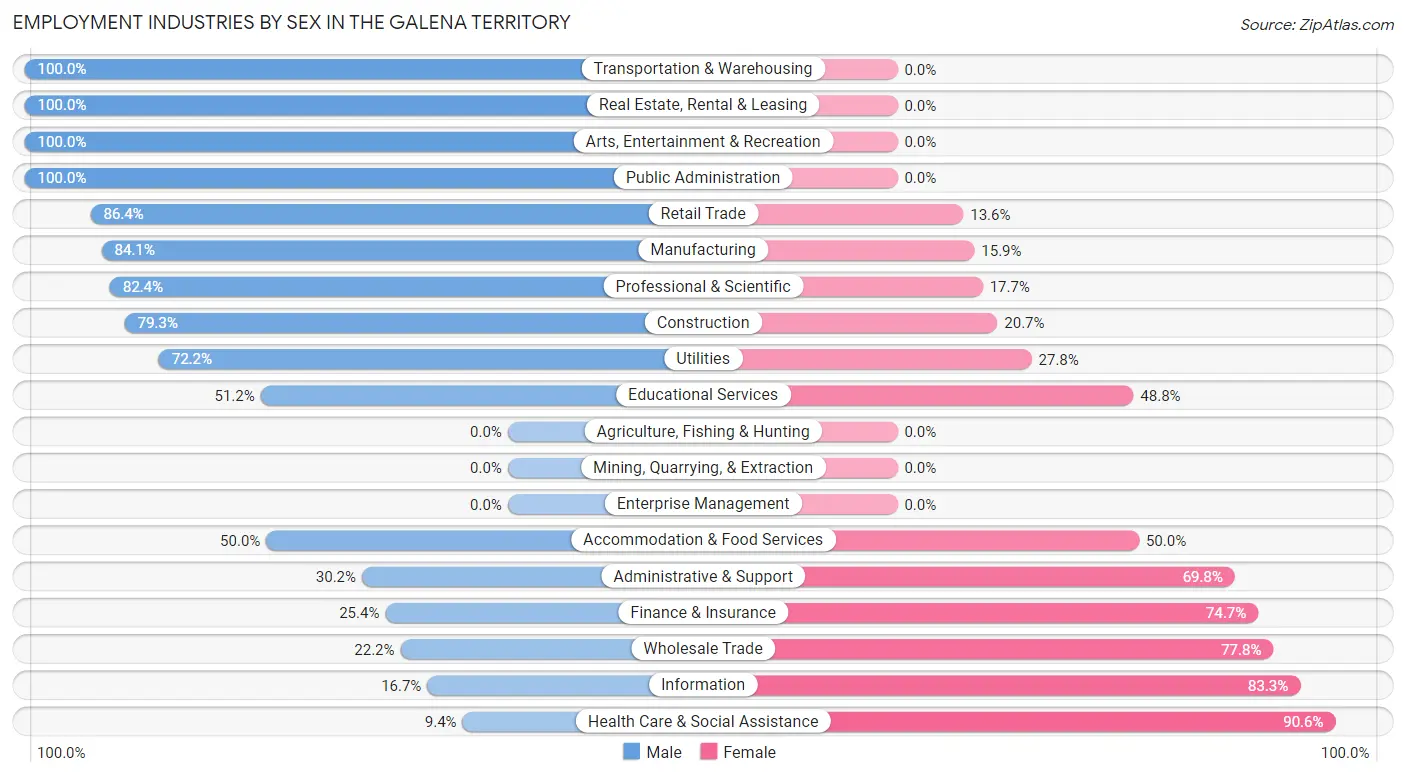
Employment Industries by Sex in The Galena Territory
The The Galena Territory industries that see more men than women are Transportation & Warehousing (100.0%), Real Estate, Rental & Leasing (100.0%), and Arts, Entertainment & Recreation (100.0%), whereas the industries that tend to have a higher number of women are Health Care & Social Assistance (90.6%), Information (83.3%), and Wholesale Trade (77.8%).
| Industry | Male | Female |
| Agriculture, Fishing & Hunting | 0 (0.0%) | 0 (0.0%) |
| Mining, Quarrying, & Extraction | 0 (0.0%) | 0 (0.0%) |
| Construction | 23 (79.3%) | 6 (20.7%) |
| Manufacturing | 95 (84.1%) | 18 (15.9%) |
| Wholesale Trade | 4 (22.2%) | 14 (77.8%) |
| Retail Trade | 19 (86.4%) | 3 (13.6%) |
| Transportation & Warehousing | 2 (100.0%) | 0 (0.0%) |
| Utilities | 13 (72.2%) | 5 (27.8%) |
| Information | 2 (16.7%) | 10 (83.3%) |
| Finance & Insurance | 36 (25.4%) | 106 (74.7%) |
| Real Estate, Rental & Leasing | 11 (100.0%) | 0 (0.0%) |
| Professional & Scientific | 14 (82.4%) | 3 (17.6%) |
| Enterprise Management | 0 (0.0%) | 0 (0.0%) |
| Administrative & Support | 16 (30.2%) | 37 (69.8%) |
| Educational Services | 22 (51.2%) | 21 (48.8%) |
| Health Care & Social Assistance | 3 (9.4%) | 29 (90.6%) |
| Arts, Entertainment & Recreation | 16 (100.0%) | 0 (0.0%) |
| Accommodation & Food Services | 5 (50.0%) | 5 (50.0%) |
| Public Administration | 31 (100.0%) | 0 (0.0%) |
| Total | 338 (54.9%) | 278 (45.1%) |
Education in The Galena Territory
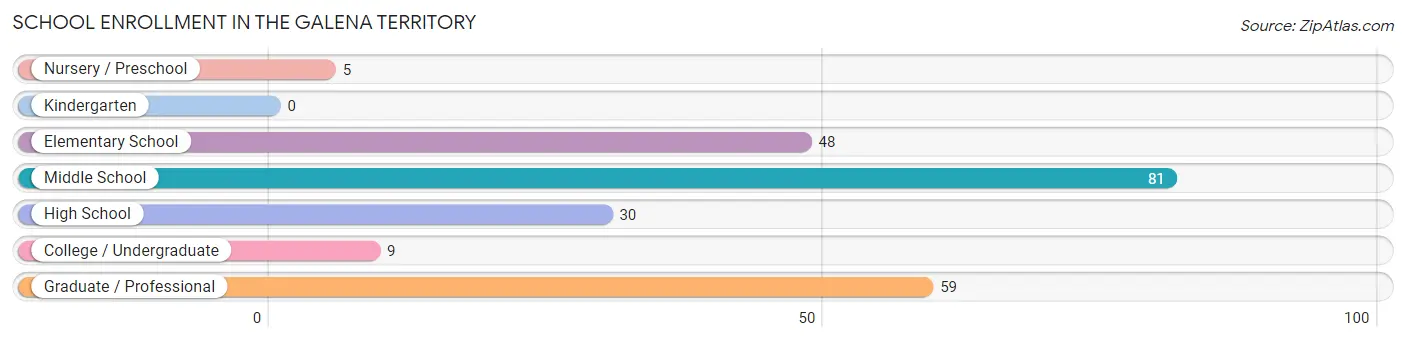
School Enrollment in The Galena Territory
The most common levels of schooling among the 232 students in The Galena Territory are middle school (81 | 34.9%), graduate / professional (59 | 25.4%), and elementary school (48 | 20.7%).
| School Level | # Students | % Students |
| Nursery / Preschool | 5 | 2.2% |
| Kindergarten | 0 | 0.0% |
| Elementary School | 48 | 20.7% |
| Middle School | 81 | 34.9% |
| High School | 30 | 12.9% |
| College / Undergraduate | 9 | 3.9% |
| Graduate / Professional | 59 | 25.4% |
| Total | 232 | 100.0% |
School Enrollment by Age by Funding Source in The Galena Territory
Out of a total of 232 students who are enrolled in schools in The Galena Territory, 36 (15.5%) attend a private institution, while the remaining 196 (84.5%) are enrolled in public schools. The age group of 5 to 9 year old has the highest likelihood of being enrolled in private schools, with 10 (31.2% in the age bracket) enrolled. Conversely, the age group of 3 to 4 year olds has the lowest likelihood of being enrolled in a private school, with 5 (100.0% in the age bracket) attending a public institution.
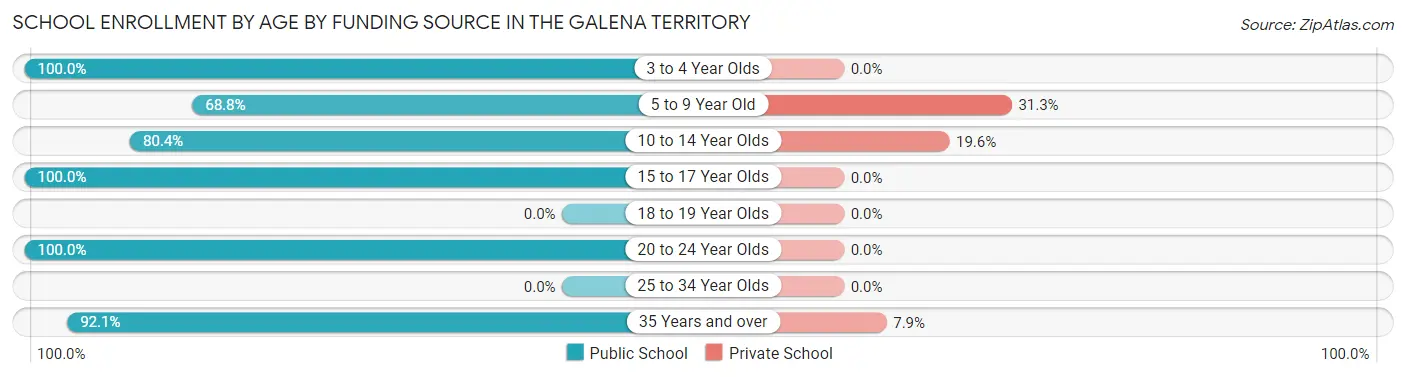
| Age Bracket | Public School | Private School |
| 3 to 4 Year Olds | 5 (100.0%) | 0 (0.0%) |
| 5 to 9 Year Old | 22 (68.8%) | 10 (31.2%) |
| 10 to 14 Year Olds | 86 (80.4%) | 21 (19.6%) |
| 15 to 17 Year Olds | 20 (100.0%) | 0 (0.0%) |
| 18 to 19 Year Olds | 0 (0.0%) | 0 (0.0%) |
| 20 to 24 Year Olds | 5 (100.0%) | 0 (0.0%) |
| 25 to 34 Year Olds | 0 (0.0%) | 0 (0.0%) |
| 35 Years and over | 58 (92.1%) | 5 (7.9%) |
| Total | 196 (84.5%) | 36 (15.5%) |
Educational Attainment by Field of Study in The Galena Territory
Education (135 | 15.8%), business (130 | 15.2%), bio, nature & agricultural (116 | 13.5%), science & technology (86 | 10.0%), and liberal arts & history (82 | 9.6%) are the most common fields of study among 857 individuals in The Galena Territory who have obtained a bachelor's degree or higher.
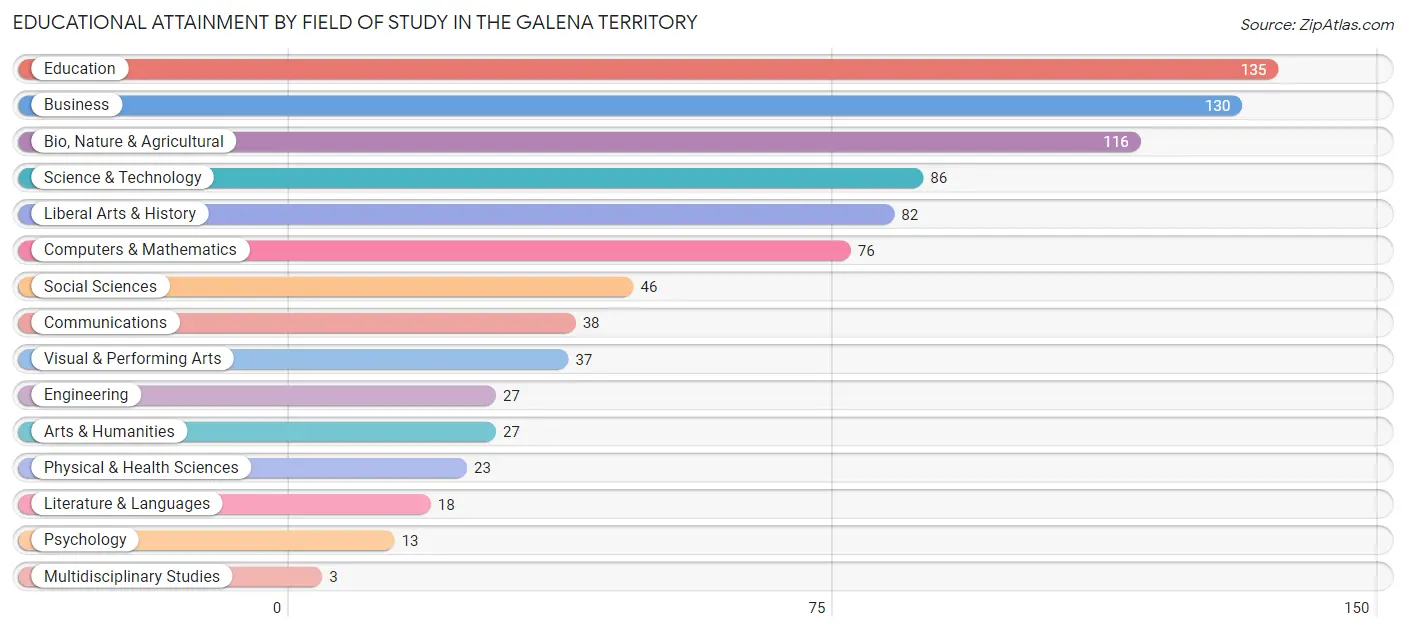
| Field of Study | # Graduates | % Graduates |
| Computers & Mathematics | 76 | 8.9% |
| Bio, Nature & Agricultural | 116 | 13.5% |
| Physical & Health Sciences | 23 | 2.7% |
| Psychology | 13 | 1.5% |
| Social Sciences | 46 | 5.4% |
| Engineering | 27 | 3.2% |
| Multidisciplinary Studies | 3 | 0.4% |
| Science & Technology | 86 | 10.0% |
| Business | 130 | 15.2% |
| Education | 135 | 15.8% |
| Literature & Languages | 18 | 2.1% |
| Liberal Arts & History | 82 | 9.6% |
| Visual & Performing Arts | 37 | 4.3% |
| Communications | 38 | 4.4% |
| Arts & Humanities | 27 | 3.2% |
| Total | 857 | 100.0% |
Transportation & Commute in The Galena Territory
Vehicle Availability by Sex in The Galena Territory
The most prevalent vehicle ownership categories in The Galena Territory are males with 2 vehicles (239, accounting for 70.7%) and females with 2 vehicles (198, making up 86.0%).
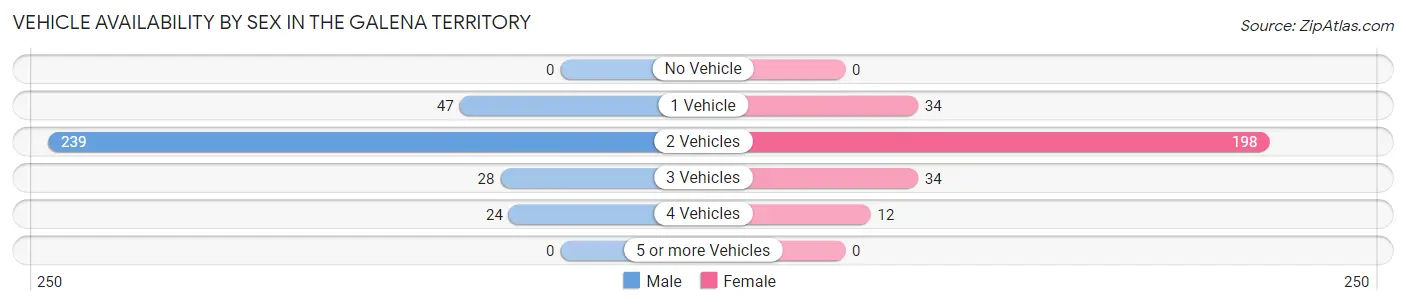
| Vehicles Available | Male | Female |
| No Vehicle | 0 (0.0%) | 0 (0.0%) |
| 1 Vehicle | 47 (13.9%) | 34 (12.2%) |
| 2 Vehicles | 239 (70.7%) | 198 (71.2%) |
| 3 Vehicles | 28 (8.3%) | 34 (12.2%) |
| 4 Vehicles | 24 (7.1%) | 12 (4.3%) |
| 5 or more Vehicles | 0 (0.0%) | 0 (0.0%) |
| Total | 338 (100.0%) | 278 (100.0%) |
Commute Time in The Galena Territory
The most frequently occuring commute durations in The Galena Territory are 20 to 24 minutes (112 commuters, 29.2%), 5 to 9 minutes (53 commuters, 13.8%), and 40 to 44 minutes (45 commuters, 11.7%).
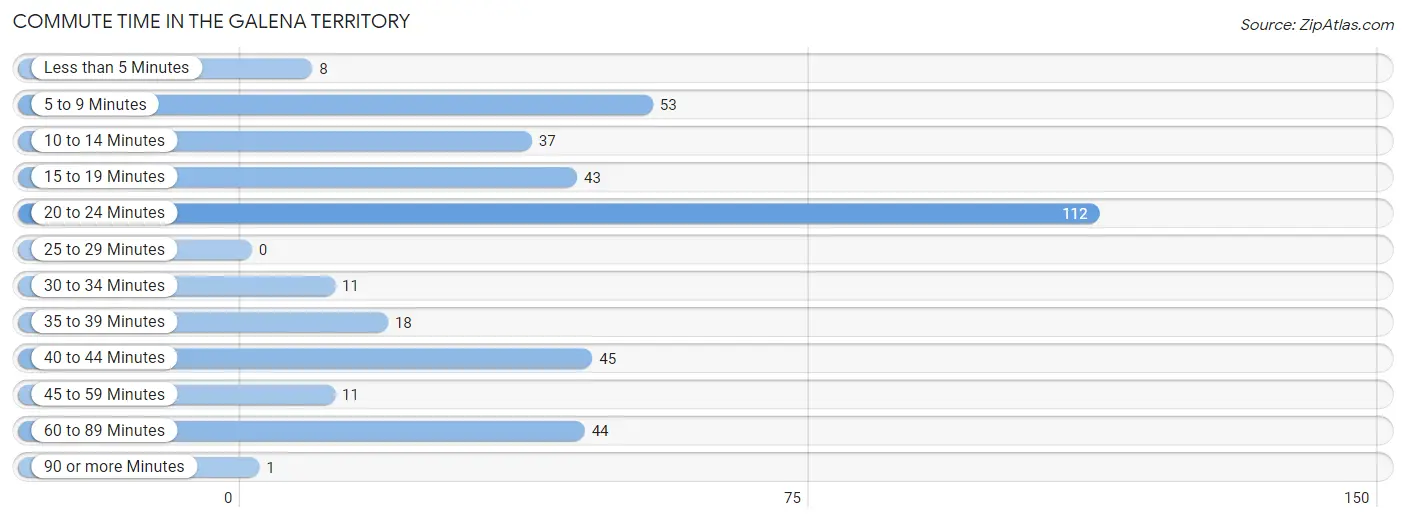
| Commute Time | # Commuters | % Commuters |
| Less than 5 Minutes | 8 | 2.1% |
| 5 to 9 Minutes | 53 | 13.8% |
| 10 to 14 Minutes | 37 | 9.7% |
| 15 to 19 Minutes | 43 | 11.2% |
| 20 to 24 Minutes | 112 | 29.2% |
| 25 to 29 Minutes | 0 | 0.0% |
| 30 to 34 Minutes | 11 | 2.9% |
| 35 to 39 Minutes | 18 | 4.7% |
| 40 to 44 Minutes | 45 | 11.7% |
| 45 to 59 Minutes | 11 | 2.9% |
| 60 to 89 Minutes | 44 | 11.5% |
| 90 or more Minutes | 1 | 0.3% |
Commute Time by Sex in The Galena Territory
The most common commute times in The Galena Territory are 20 to 24 minutes (98 commuters, 43.0%) for males and 40 to 44 minutes (41 commuters, 26.5%) for females.
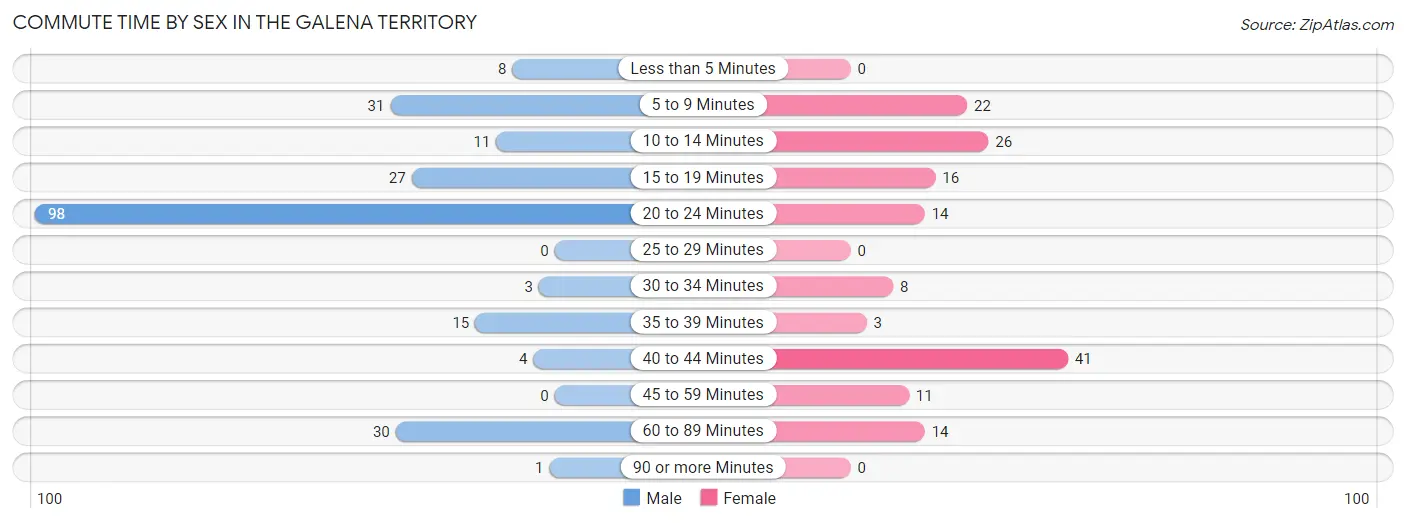
| Commute Time | Male | Female |
| Less than 5 Minutes | 8 (3.5%) | 0 (0.0%) |
| 5 to 9 Minutes | 31 (13.6%) | 22 (14.2%) |
| 10 to 14 Minutes | 11 (4.8%) | 26 (16.8%) |
| 15 to 19 Minutes | 27 (11.8%) | 16 (10.3%) |
| 20 to 24 Minutes | 98 (43.0%) | 14 (9.0%) |
| 25 to 29 Minutes | 0 (0.0%) | 0 (0.0%) |
| 30 to 34 Minutes | 3 (1.3%) | 8 (5.2%) |
| 35 to 39 Minutes | 15 (6.6%) | 3 (1.9%) |
| 40 to 44 Minutes | 4 (1.8%) | 41 (26.5%) |
| 45 to 59 Minutes | 0 (0.0%) | 11 (7.1%) |
| 60 to 89 Minutes | 30 (13.2%) | 14 (9.0%) |
| 90 or more Minutes | 1 (0.4%) | 0 (0.0%) |
Time of Departure to Work by Sex in The Galena Territory
The most frequent times of departure to work in The Galena Territory are 8:00 AM to 8:29 AM (103, 45.2%) for males and 7:00 AM to 7:29 AM (37, 23.9%) for females.
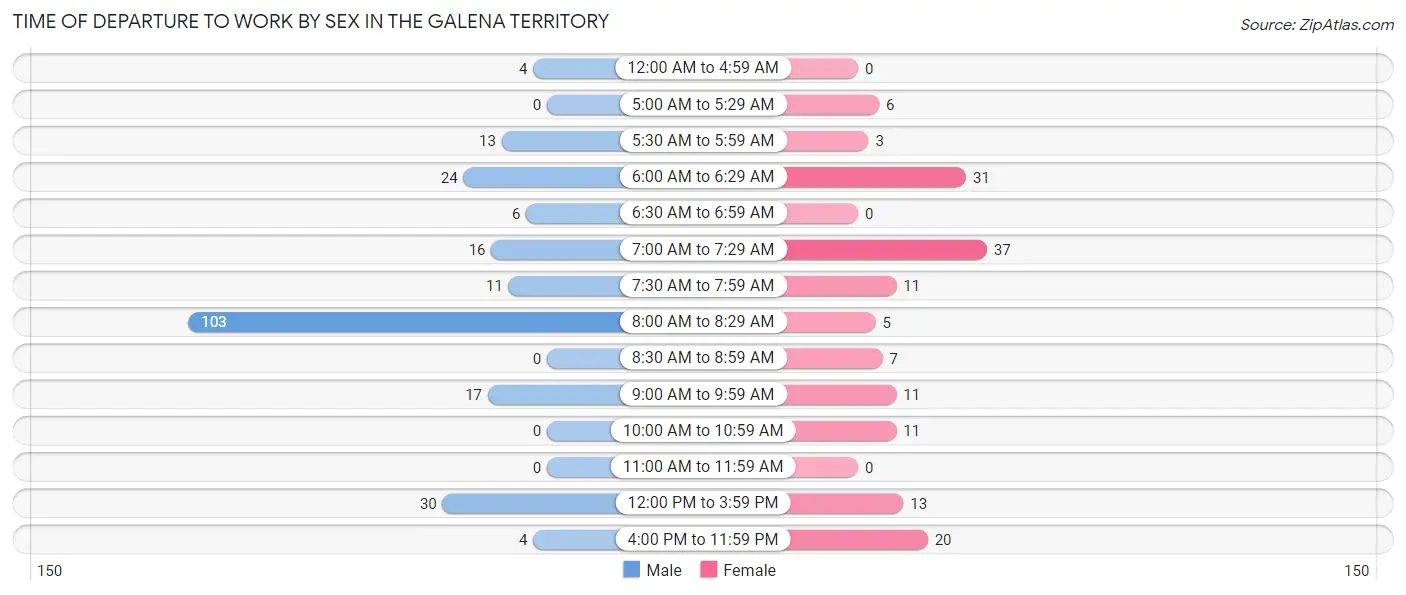
| Time of Departure | Male | Female |
| 12:00 AM to 4:59 AM | 4 (1.8%) | 0 (0.0%) |
| 5:00 AM to 5:29 AM | 0 (0.0%) | 6 (3.9%) |
| 5:30 AM to 5:59 AM | 13 (5.7%) | 3 (1.9%) |
| 6:00 AM to 6:29 AM | 24 (10.5%) | 31 (20.0%) |
| 6:30 AM to 6:59 AM | 6 (2.6%) | 0 (0.0%) |
| 7:00 AM to 7:29 AM | 16 (7.0%) | 37 (23.9%) |
| 7:30 AM to 7:59 AM | 11 (4.8%) | 11 (7.1%) |
| 8:00 AM to 8:29 AM | 103 (45.2%) | 5 (3.2%) |
| 8:30 AM to 8:59 AM | 0 (0.0%) | 7 (4.5%) |
| 9:00 AM to 9:59 AM | 17 (7.5%) | 11 (7.1%) |
| 10:00 AM to 10:59 AM | 0 (0.0%) | 11 (7.1%) |
| 11:00 AM to 11:59 AM | 0 (0.0%) | 0 (0.0%) |
| 12:00 PM to 3:59 PM | 30 (13.2%) | 13 (8.4%) |
| 4:00 PM to 11:59 PM | 4 (1.8%) | 20 (12.9%) |
| Total | 228 (100.0%) | 155 (100.0%) |
Housing Occupancy in The Galena Territory
Occupancy by Ownership in The Galena Territory
Of the total 717 dwellings in The Galena Territory, owner-occupied units account for 695 (96.9%), while renter-occupied units make up 22 (3.1%).
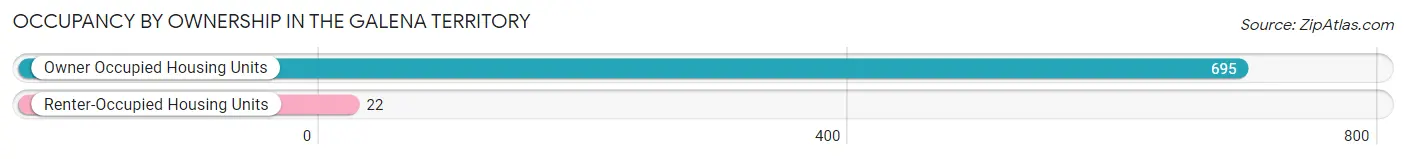
| Occupancy | # Housing Units | % Housing Units |
| Owner Occupied Housing Units | 695 | 96.9% |
| Renter-Occupied Housing Units | 22 | 3.1% |
| Total Occupied Housing Units | 717 | 100.0% |
Occupancy by Household Size in The Galena Territory
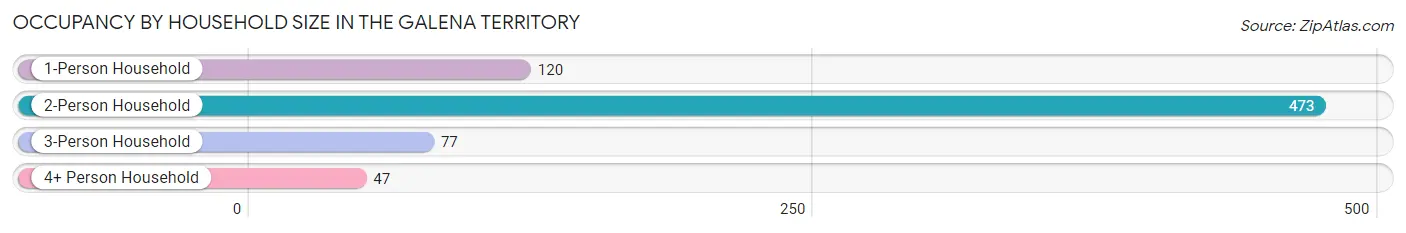
| Household Size | # Housing Units | % Housing Units |
| 1-Person Household | 120 | 16.7% |
| 2-Person Household | 473 | 66.0% |
| 3-Person Household | 77 | 10.7% |
| 4+ Person Household | 47 | 6.6% |
| Total Housing Units | 717 | 100.0% |
Occupancy by Ownership by Household Size in The Galena Territory
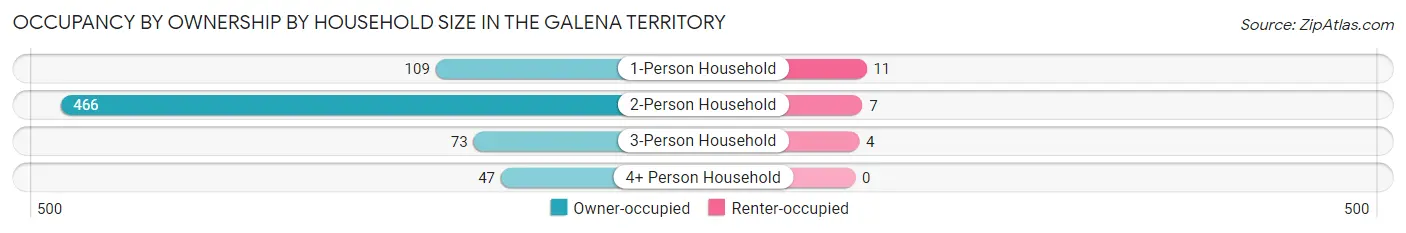
| Household Size | Owner-occupied | Renter-occupied |
| 1-Person Household | 109 (90.8%) | 11 (9.2%) |
| 2-Person Household | 466 (98.5%) | 7 (1.5%) |
| 3-Person Household | 73 (94.8%) | 4 (5.2%) |
| 4+ Person Household | 47 (100.0%) | 0 (0.0%) |
| Total Housing Units | 695 (96.9%) | 22 (3.1%) |
Occupancy by Educational Attainment in The Galena Territory
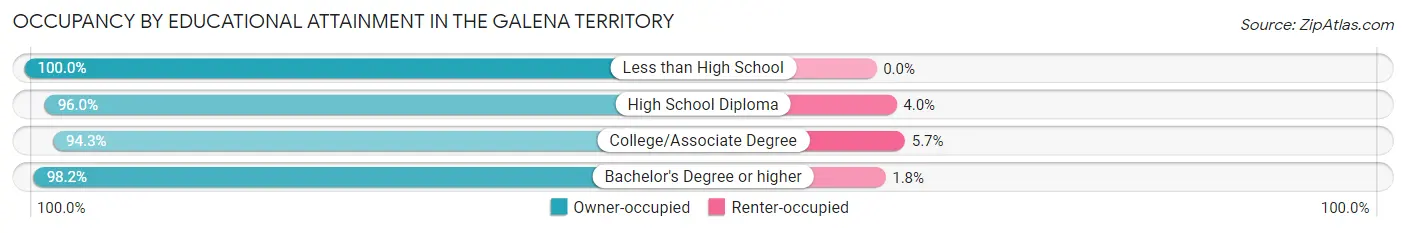
| Household Size | Owner-occupied | Renter-occupied |
| Less than High School | 6 (100.0%) | 0 (0.0%) |
| High School Diploma | 72 (96.0%) | 3 (4.0%) |
| College/Associate Degree | 183 (94.3%) | 11 (5.7%) |
| Bachelor's Degree or higher | 434 (98.2%) | 8 (1.8%) |
Occupancy by Age of Householder in The Galena Territory
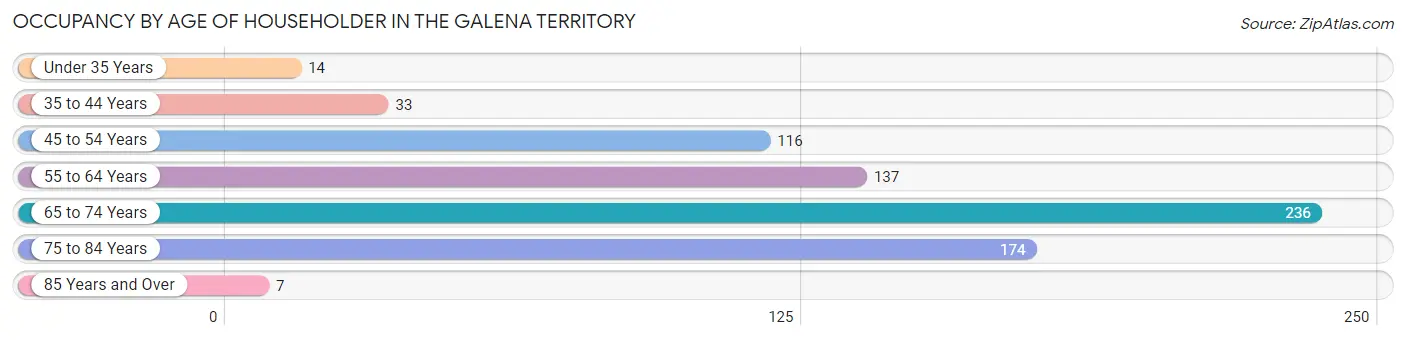
| Age Bracket | # Households | % Households |
| Under 35 Years | 14 | 1.9% |
| 35 to 44 Years | 33 | 4.6% |
| 45 to 54 Years | 116 | 16.2% |
| 55 to 64 Years | 137 | 19.1% |
| 65 to 74 Years | 236 | 32.9% |
| 75 to 84 Years | 174 | 24.3% |
| 85 Years and Over | 7 | 1.0% |
| Total | 717 | 100.0% |
Housing Finances in The Galena Territory
Median Income by Occupancy in The Galena Territory
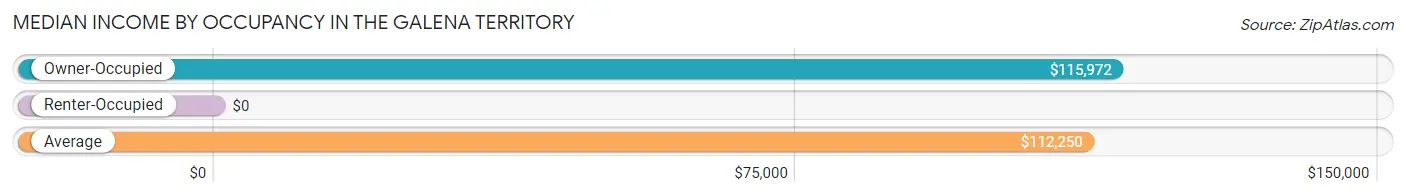
| Occupancy Type | # Households | Median Income |
| Owner-Occupied | 695 (96.9%) | $115,972 |
| Renter-Occupied | 22 (3.1%) | $0 |
| Average | 717 (100.0%) | $112,250 |
Occupancy by Householder Income Bracket in The Galena Territory
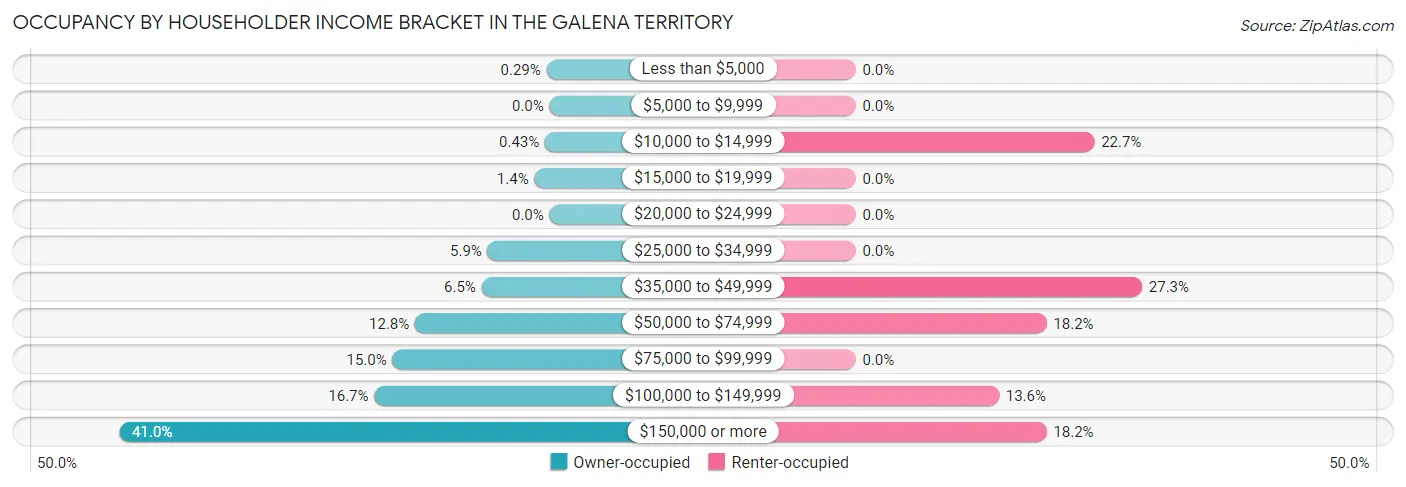
| Income Bracket | Owner-occupied | Renter-occupied |
| Less than $5,000 | 2 (0.3%) | 0 (0.0%) |
| $5,000 to $9,999 | 0 (0.0%) | 0 (0.0%) |
| $10,000 to $14,999 | 3 (0.4%) | 5 (22.7%) |
| $15,000 to $19,999 | 10 (1.4%) | 0 (0.0%) |
| $20,000 to $24,999 | 0 (0.0%) | 0 (0.0%) |
| $25,000 to $34,999 | 41 (5.9%) | 0 (0.0%) |
| $35,000 to $49,999 | 45 (6.5%) | 6 (27.3%) |
| $50,000 to $74,999 | 89 (12.8%) | 4 (18.2%) |
| $75,000 to $99,999 | 104 (15.0%) | 0 (0.0%) |
| $100,000 to $149,999 | 116 (16.7%) | 3 (13.6%) |
| $150,000 or more | 285 (41.0%) | 4 (18.2%) |
| Total | 695 (100.0%) | 22 (100.0%) |
Monthly Housing Cost Tiers in The Galena Territory
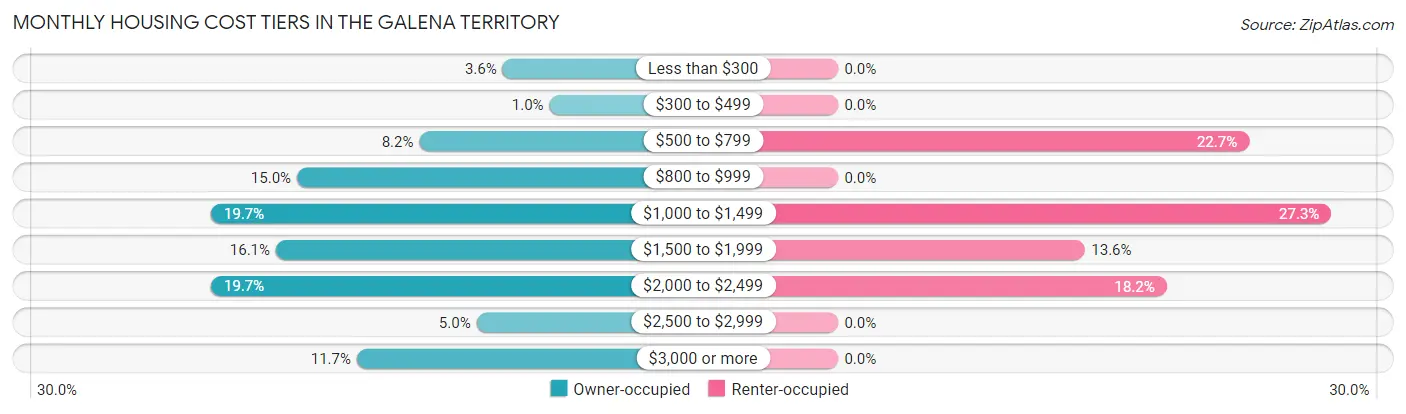
| Monthly Cost | Owner-occupied | Renter-occupied |
| Less than $300 | 25 (3.6%) | 0 (0.0%) |
| $300 to $499 | 7 (1.0%) | 0 (0.0%) |
| $500 to $799 | 57 (8.2%) | 5 (22.7%) |
| $800 to $999 | 104 (15.0%) | 0 (0.0%) |
| $1,000 to $1,499 | 137 (19.7%) | 6 (27.3%) |
| $1,500 to $1,999 | 112 (16.1%) | 3 (13.6%) |
| $2,000 to $2,499 | 137 (19.7%) | 4 (18.2%) |
| $2,500 to $2,999 | 35 (5.0%) | 0 (0.0%) |
| $3,000 or more | 81 (11.7%) | 0 (0.0%) |
| Total | 695 (100.0%) | 22 (100.0%) |
Physical Housing Characteristics in The Galena Territory
Housing Structures in The Galena Territory
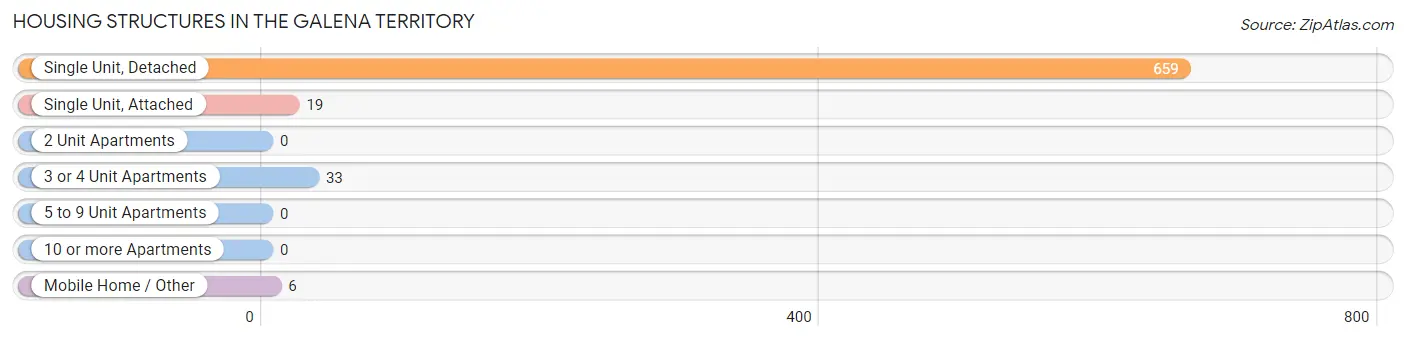
| Structure Type | # Housing Units | % Housing Units |
| Single Unit, Detached | 659 | 91.9% |
| Single Unit, Attached | 19 | 2.6% |
| 2 Unit Apartments | 0 | 0.0% |
| 3 or 4 Unit Apartments | 33 | 4.6% |
| 5 to 9 Unit Apartments | 0 | 0.0% |
| 10 or more Apartments | 0 | 0.0% |
| Mobile Home / Other | 6 | 0.8% |
| Total | 717 | 100.0% |
Housing Structures by Occupancy in The Galena Territory
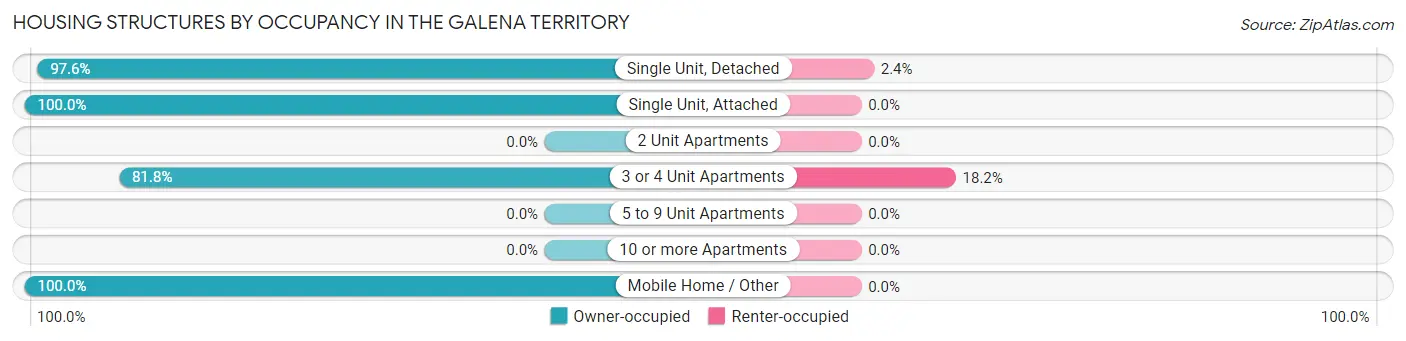
| Structure Type | Owner-occupied | Renter-occupied |
| Single Unit, Detached | 643 (97.6%) | 16 (2.4%) |
| Single Unit, Attached | 19 (100.0%) | 0 (0.0%) |
| 2 Unit Apartments | 0 (0.0%) | 0 (0.0%) |
| 3 or 4 Unit Apartments | 27 (81.8%) | 6 (18.2%) |
| 5 to 9 Unit Apartments | 0 (0.0%) | 0 (0.0%) |
| 10 or more Apartments | 0 (0.0%) | 0 (0.0%) |
| Mobile Home / Other | 6 (100.0%) | 0 (0.0%) |
| Total | 695 (96.9%) | 22 (3.1%) |
Housing Structures by Number of Rooms in The Galena Territory
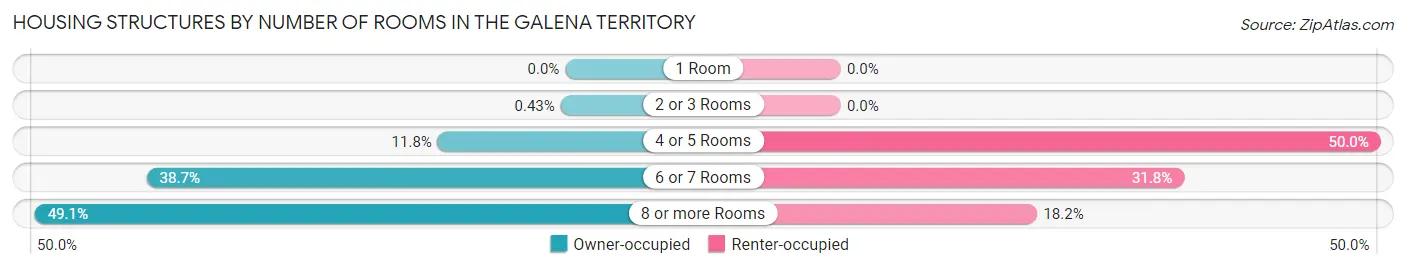
| Number of Rooms | Owner-occupied | Renter-occupied |
| 1 Room | 0 (0.0%) | 0 (0.0%) |
| 2 or 3 Rooms | 3 (0.4%) | 0 (0.0%) |
| 4 or 5 Rooms | 82 (11.8%) | 11 (50.0%) |
| 6 or 7 Rooms | 269 (38.7%) | 7 (31.8%) |
| 8 or more Rooms | 341 (49.1%) | 4 (18.2%) |
| Total | 695 (100.0%) | 22 (100.0%) |
Housing Structure by Heating Type in The Galena Territory
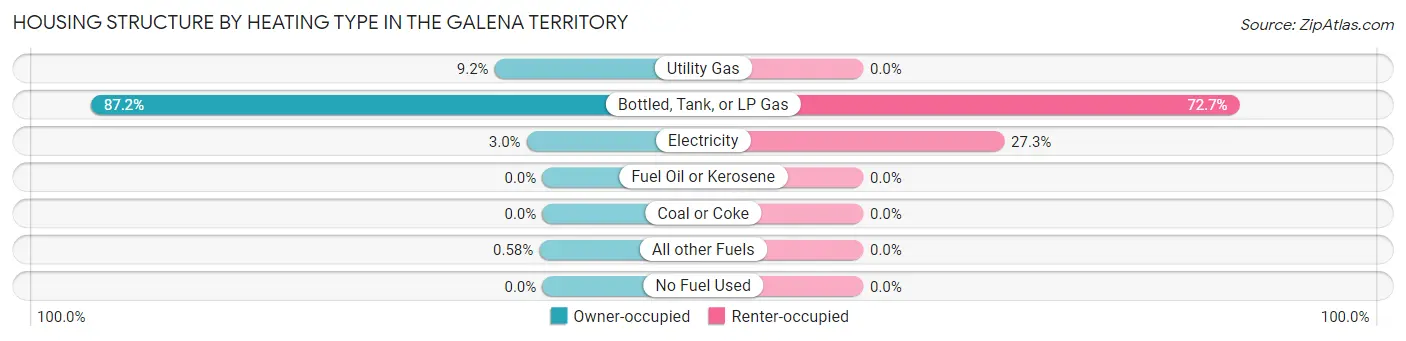
| Heating Type | Owner-occupied | Renter-occupied |
| Utility Gas | 64 (9.2%) | 0 (0.0%) |
| Bottled, Tank, or LP Gas | 606 (87.2%) | 16 (72.7%) |
| Electricity | 21 (3.0%) | 6 (27.3%) |
| Fuel Oil or Kerosene | 0 (0.0%) | 0 (0.0%) |
| Coal or Coke | 0 (0.0%) | 0 (0.0%) |
| All other Fuels | 4 (0.6%) | 0 (0.0%) |
| No Fuel Used | 0 (0.0%) | 0 (0.0%) |
| Total | 695 (100.0%) | 22 (100.0%) |
Household Vehicle Usage in The Galena Territory
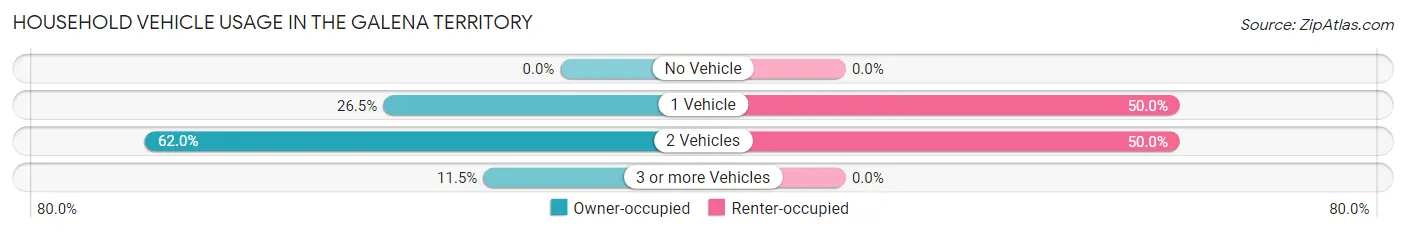
| Vehicles per Household | Owner-occupied | Renter-occupied |
| No Vehicle | 0 (0.0%) | 0 (0.0%) |
| 1 Vehicle | 184 (26.5%) | 11 (50.0%) |
| 2 Vehicles | 431 (62.0%) | 11 (50.0%) |
| 3 or more Vehicles | 80 (11.5%) | 0 (0.0%) |
| Total | 695 (100.0%) | 22 (100.0%) |
Real Estate & Mortgages in The Galena Territory
Real Estate and Mortgage Overview in The Galena Territory
| Characteristic | Without Mortgage | With Mortgage |
| Housing Units | 282 | 413 |
| Median Property Value | $307,900 | $286,700 |
| Median Household Income | $89,615 | $184 |
| Monthly Housing Costs | $922 | $81 |
| Real Estate Taxes | $5,795 | $0 |
Property Value by Mortgage Status in The Galena Territory
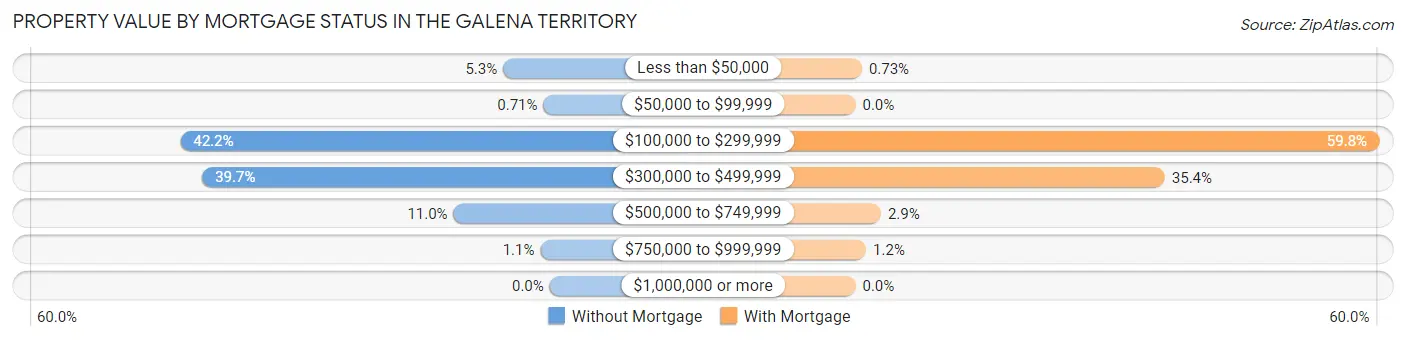
| Property Value | Without Mortgage | With Mortgage |
| Less than $50,000 | 15 (5.3%) | 3 (0.7%) |
| $50,000 to $99,999 | 2 (0.7%) | 0 (0.0%) |
| $100,000 to $299,999 | 119 (42.2%) | 247 (59.8%) |
| $300,000 to $499,999 | 112 (39.7%) | 146 (35.3%) |
| $500,000 to $749,999 | 31 (11.0%) | 12 (2.9%) |
| $750,000 to $999,999 | 3 (1.1%) | 5 (1.2%) |
| $1,000,000 or more | 0 (0.0%) | 0 (0.0%) |
| Total | 282 (100.0%) | 413 (100.0%) |
Household Income by Mortgage Status in The Galena Territory
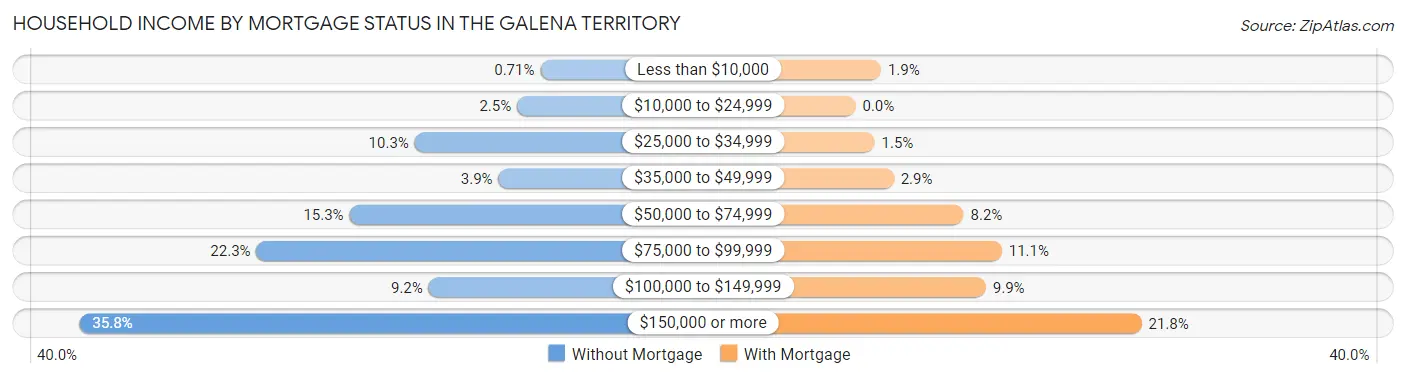
| Household Income | Without Mortgage | With Mortgage |
| Less than $10,000 | 2 (0.7%) | 8 (1.9%) |
| $10,000 to $24,999 | 7 (2.5%) | 0 (0.0%) |
| $25,000 to $34,999 | 29 (10.3%) | 6 (1.5%) |
| $35,000 to $49,999 | 11 (3.9%) | 12 (2.9%) |
| $50,000 to $74,999 | 43 (15.2%) | 34 (8.2%) |
| $75,000 to $99,999 | 63 (22.3%) | 46 (11.1%) |
| $100,000 to $149,999 | 26 (9.2%) | 41 (9.9%) |
| $150,000 or more | 101 (35.8%) | 90 (21.8%) |
| Total | 282 (100.0%) | 413 (100.0%) |
Property Value to Household Income Ratio in The Galena Territory
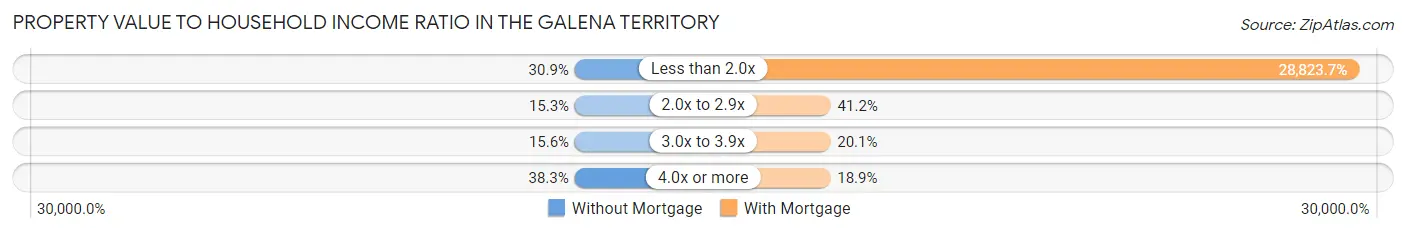
| Value-to-Income Ratio | Without Mortgage | With Mortgage |
| Less than 2.0x | 87 (30.8%) | 119,042 (28,823.7%) |
| 2.0x to 2.9x | 43 (15.2%) | 170 (41.2%) |
| 3.0x to 3.9x | 44 (15.6%) | 83 (20.1%) |
| 4.0x or more | 108 (38.3%) | 78 (18.9%) |
| Total | 282 (100.0%) | 413 (100.0%) |
Real Estate Taxes by Mortgage Status in The Galena Territory
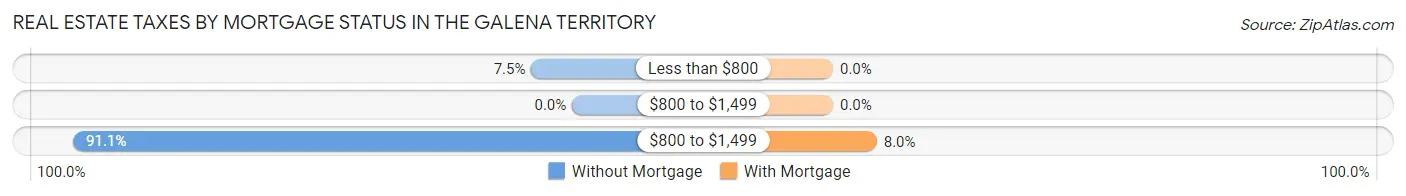
| Property Taxes | Without Mortgage | With Mortgage |
| Less than $800 | 21 (7.4%) | 0 (0.0%) |
| $800 to $1,499 | 0 (0.0%) | 0 (0.0%) |
| $800 to $1,499 | 257 (91.1%) | 33 (8.0%) |
| Total | 282 (100.0%) | 413 (100.0%) |
Health & Disability in The Galena Territory
Health Insurance Coverage by Age in The Galena Territory
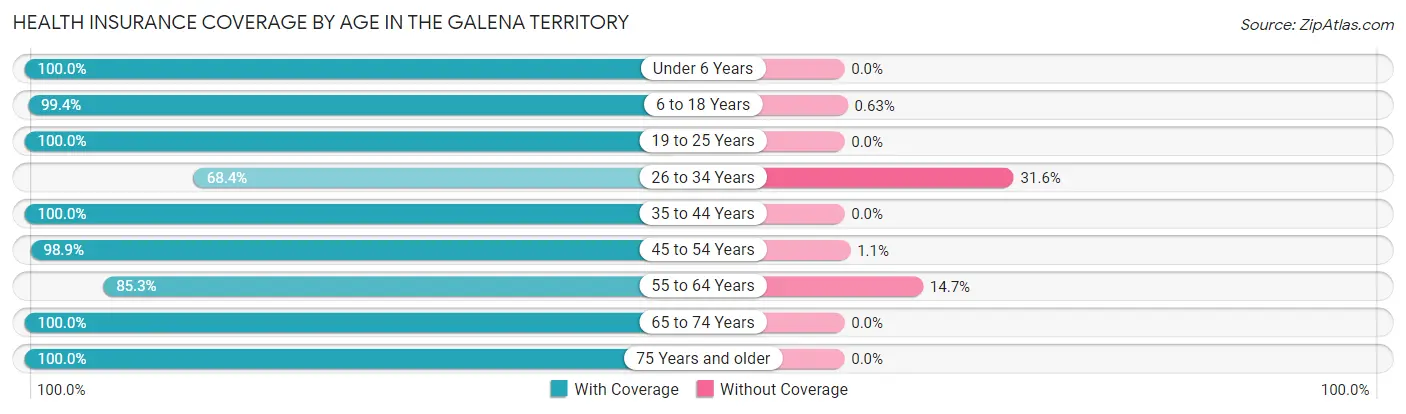
| Age Bracket | With Coverage | Without Coverage |
| Under 6 Years | 18 (100.0%) | 0 (0.0%) |
| 6 to 18 Years | 158 (99.4%) | 1 (0.6%) |
| 19 to 25 Years | 14 (100.0%) | 0 (0.0%) |
| 26 to 34 Years | 39 (68.4%) | 18 (31.6%) |
| 35 to 44 Years | 95 (100.0%) | 0 (0.0%) |
| 45 to 54 Years | 267 (98.9%) | 3 (1.1%) |
| 55 to 64 Years | 227 (85.3%) | 39 (14.7%) |
| 65 to 74 Years | 416 (100.0%) | 0 (0.0%) |
| 75 Years and older | 311 (100.0%) | 0 (0.0%) |
| Total | 1,545 (96.2%) | 61 (3.8%) |
Health Insurance Coverage by Citizenship Status in The Galena Territory

| Citizenship Status | With Coverage | Without Coverage |
| Native Born | 18 (100.0%) | 0 (0.0%) |
| Foreign Born, Citizen | 158 (99.4%) | 1 (0.6%) |
| Foreign Born, not a Citizen | 14 (100.0%) | 0 (0.0%) |
Health Insurance Coverage by Household Income in The Galena Territory
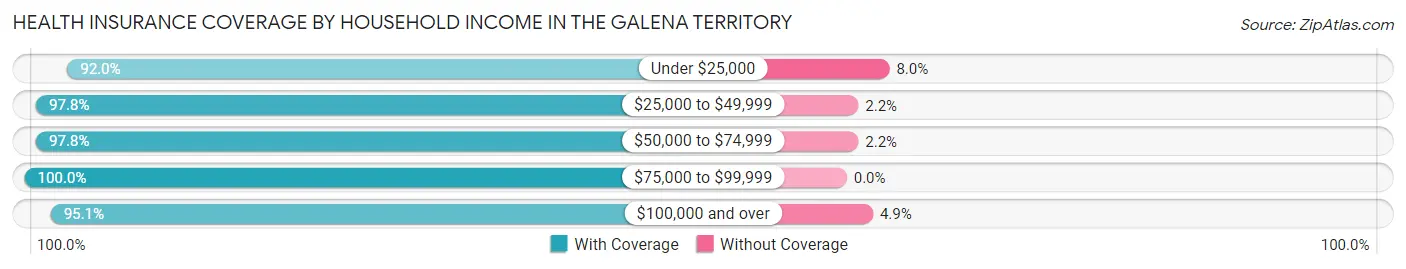
| Household Income | With Coverage | Without Coverage |
| Under $25,000 | 23 (92.0%) | 2 (8.0%) |
| $25,000 to $49,999 | 136 (97.8%) | 3 (2.2%) |
| $50,000 to $74,999 | 181 (97.8%) | 4 (2.2%) |
| $75,000 to $99,999 | 196 (100.0%) | 0 (0.0%) |
| $100,000 and over | 1,009 (95.1%) | 52 (4.9%) |
Public vs Private Health Insurance Coverage by Age in The Galena Territory
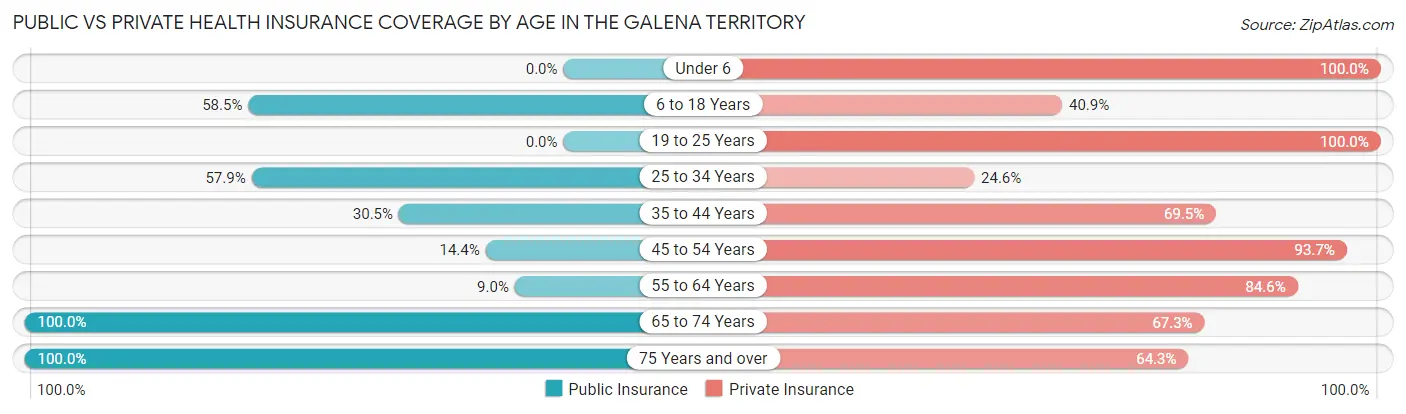
| Age Bracket | Public Insurance | Private Insurance |
| Under 6 | 0 (0.0%) | 18 (100.0%) |
| 6 to 18 Years | 93 (58.5%) | 65 (40.9%) |
| 19 to 25 Years | 0 (0.0%) | 14 (100.0%) |
| 25 to 34 Years | 33 (57.9%) | 14 (24.6%) |
| 35 to 44 Years | 29 (30.5%) | 66 (69.5%) |
| 45 to 54 Years | 39 (14.4%) | 253 (93.7%) |
| 55 to 64 Years | 24 (9.0%) | 225 (84.6%) |
| 65 to 74 Years | 416 (100.0%) | 280 (67.3%) |
| 75 Years and over | 311 (100.0%) | 200 (64.3%) |
| Total | 945 (58.8%) | 1,135 (70.7%) |
Disability Status by Sex by Age in The Galena Territory
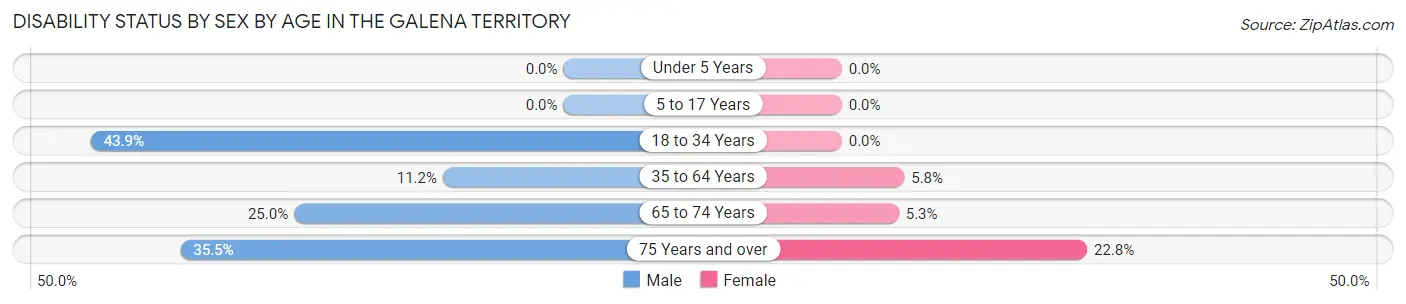
| Age Bracket | Male | Female |
| Under 5 Years | 0 (0.0%) | 0 (0.0%) |
| 5 to 17 Years | 0 (0.0%) | 0 (0.0%) |
| 18 to 34 Years | 25 (43.9%) | 0 (0.0%) |
| 35 to 64 Years | 32 (11.2%) | 20 (5.8%) |
| 65 to 74 Years | 52 (25.0%) | 11 (5.3%) |
| 75 Years and over | 59 (35.5%) | 33 (22.8%) |
Disability Class by Sex by Age in The Galena Territory
Disability Class: Hearing Difficulty
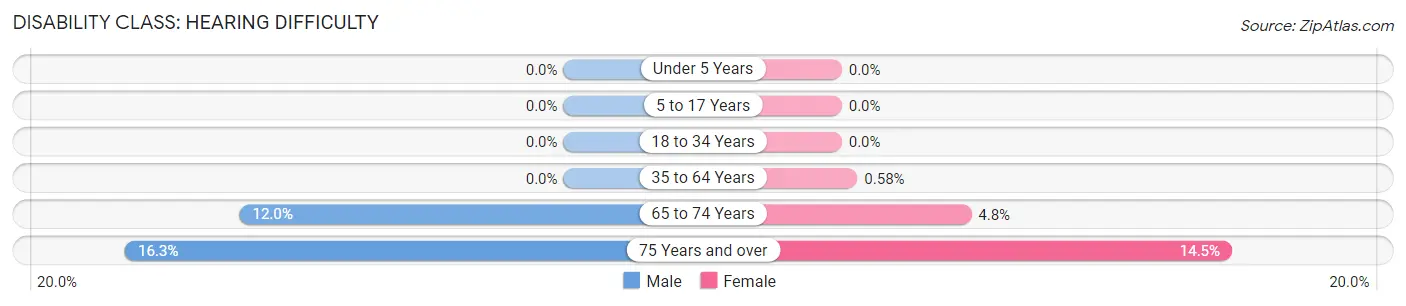
| Age Bracket | Male | Female |
| Under 5 Years | 0 (0.0%) | 0 (0.0%) |
| 5 to 17 Years | 0 (0.0%) | 0 (0.0%) |
| 18 to 34 Years | 0 (0.0%) | 0 (0.0%) |
| 35 to 64 Years | 0 (0.0%) | 2 (0.6%) |
| 65 to 74 Years | 25 (12.0%) | 10 (4.8%) |
| 75 Years and over | 27 (16.3%) | 21 (14.5%) |
Disability Class: Vision Difficulty
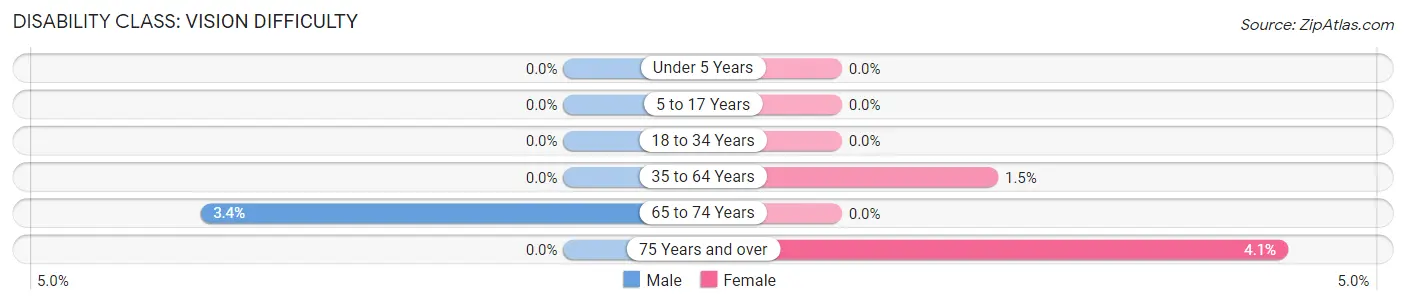
| Age Bracket | Male | Female |
| Under 5 Years | 0 (0.0%) | 0 (0.0%) |
| 5 to 17 Years | 0 (0.0%) | 0 (0.0%) |
| 18 to 34 Years | 0 (0.0%) | 0 (0.0%) |
| 35 to 64 Years | 0 (0.0%) | 5 (1.5%) |
| 65 to 74 Years | 7 (3.4%) | 0 (0.0%) |
| 75 Years and over | 0 (0.0%) | 6 (4.1%) |
Disability Class: Cognitive Difficulty
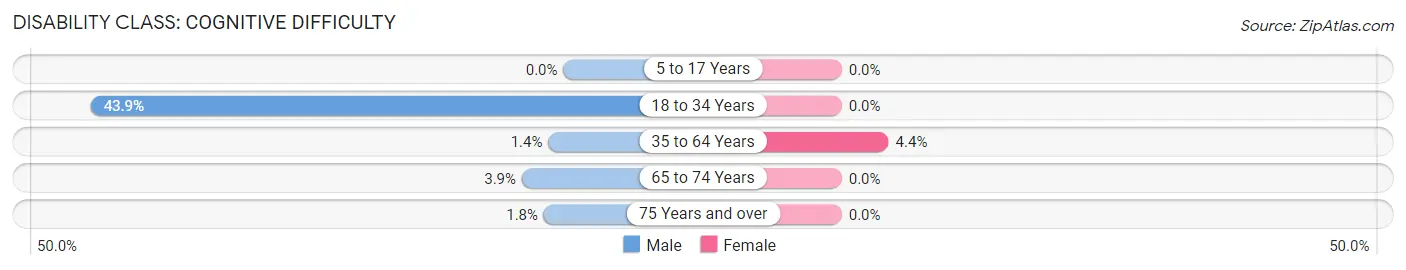
| Age Bracket | Male | Female |
| 5 to 17 Years | 0 (0.0%) | 0 (0.0%) |
| 18 to 34 Years | 25 (43.9%) | 0 (0.0%) |
| 35 to 64 Years | 4 (1.4%) | 15 (4.3%) |
| 65 to 74 Years | 8 (3.8%) | 0 (0.0%) |
| 75 Years and over | 3 (1.8%) | 0 (0.0%) |
Disability Class: Ambulatory Difficulty
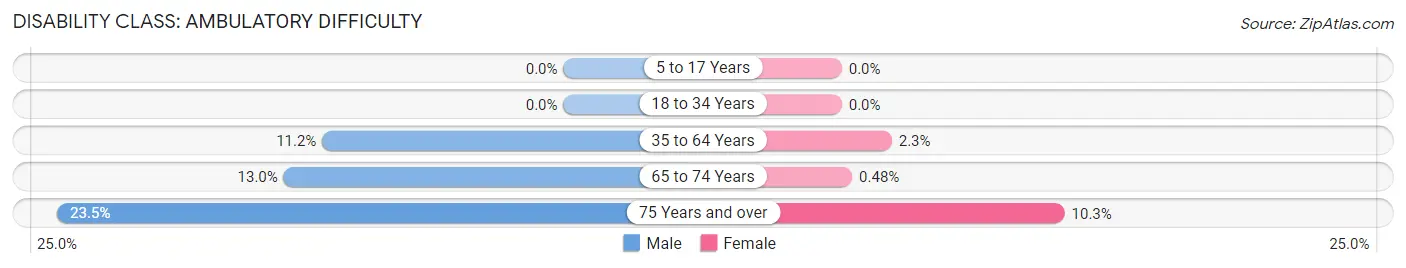
| Age Bracket | Male | Female |
| 5 to 17 Years | 0 (0.0%) | 0 (0.0%) |
| 18 to 34 Years | 0 (0.0%) | 0 (0.0%) |
| 35 to 64 Years | 32 (11.2%) | 8 (2.3%) |
| 65 to 74 Years | 27 (13.0%) | 1 (0.5%) |
| 75 Years and over | 39 (23.5%) | 15 (10.3%) |
Disability Class: Self-Care Difficulty
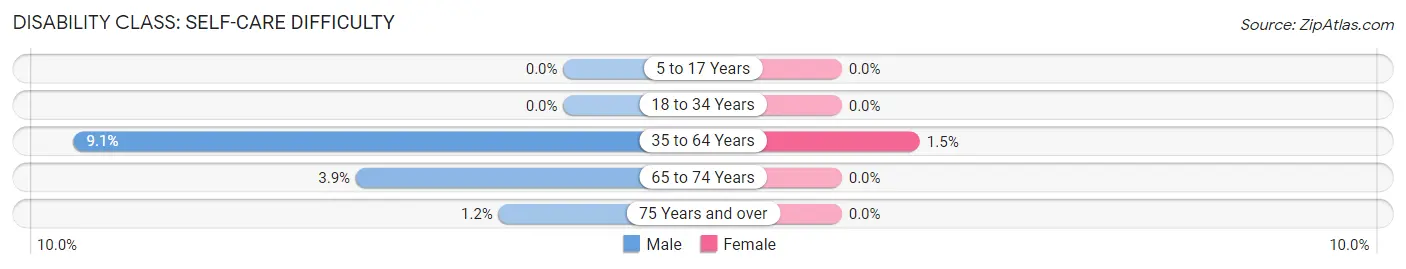
| Age Bracket | Male | Female |
| 5 to 17 Years | 0 (0.0%) | 0 (0.0%) |
| 18 to 34 Years | 0 (0.0%) | 0 (0.0%) |
| 35 to 64 Years | 26 (9.1%) | 5 (1.5%) |
| 65 to 74 Years | 8 (3.8%) | 0 (0.0%) |
| 75 Years and over | 2 (1.2%) | 0 (0.0%) |
Technology Access in The Galena Territory
Computing Device Access in The Galena Territory
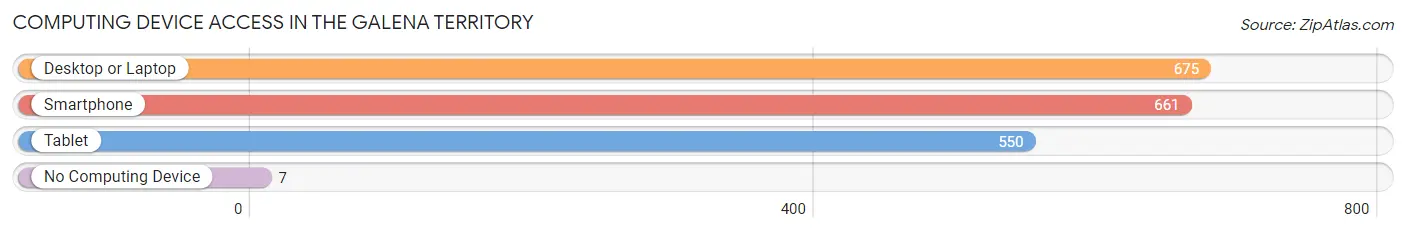
| Device Type | # Households | % Households |
| Desktop or Laptop | 675 | 94.1% |
| Smartphone | 661 | 92.2% |
| Tablet | 550 | 76.7% |
| No Computing Device | 7 | 1.0% |
| Total | 717 | 100.0% |
Internet Access in The Galena Territory
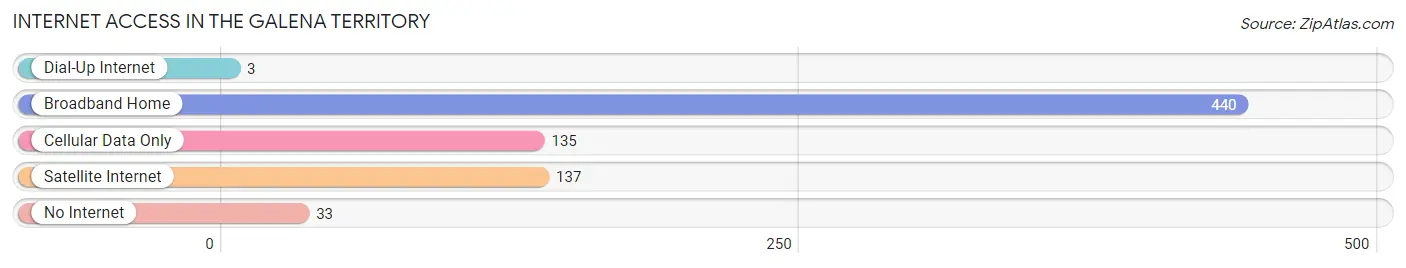
| Internet Type | # Households | % Households |
| Dial-Up Internet | 3 | 0.4% |
| Broadband Home | 440 | 61.4% |
| Cellular Data Only | 135 | 18.8% |
| Satellite Internet | 137 | 19.1% |
| No Internet | 33 | 4.6% |
| Total | 717 | 100.0% |
The Galena Territory Summary
The Galena Territory is a 6,800-acre private residential community located in Jo Daviess County, Illinois. It is situated in the northwest corner of the state, approximately 20 miles east of Dubuque, Iowa, and about 30 miles west of Galena, Illinois. The Galena Territory is a unique community that offers a variety of amenities and activities for its residents.
History
The Galena Territory was established in the late 1960s by the Galena-Jo Daviess County Development Corporation. The corporation was formed by a group of local businessmen who wanted to create a residential community that would attract people from all over the country. The original plan was to develop a resort-style community with a golf course, a lake, and other recreational amenities. The first phase of the development was completed in 1971, and the community has grown steadily since then.
Geography
The Galena Territory is located in the northwest corner of Illinois, in Jo Daviess County. It is situated on the banks of the Galena River, which flows through the center of the community. The Galena Territory is surrounded by rolling hills and wooded areas, and is home to several lakes and ponds. The area is known for its scenic beauty and is a popular destination for outdoor recreation.
Economy
The Galena Territory is a residential community, and the majority of its residents are retirees or people who work in nearby cities. The community does not have any major industries, but there are several small businesses located in the area. These businesses include restaurants, retail stores, and professional services. The Galena Territory also has a golf course, which is a popular destination for tourists and locals alike.
Demographics
As of the 2010 census, the Galena Territory had a population of 2,845 people. The median age of the population was 57.7 years, and the median household income was $63,917. The majority of the population (90.3%) was white, and the remaining population was made up of African Americans (2.2%), Asians (2.1%), and other races (5.4%).
Conclusion
The Galena Territory is a unique residential community located in Jo Daviess County, Illinois. It was established in the late 1960s and has grown steadily since then. The area is known for its scenic beauty and is a popular destination for outdoor recreation. The majority of the population is made up of retirees or people who work in nearby cities. The Galena Territory is a great place to live, work, and play, and offers a variety of amenities and activities for its residents.
Common Questions
What is Per Capita Income in The Galena Territory?
Per Capita income in The Galena Territory is $66,824.
What is the Median Family Income in The Galena Territory?
Median Family Income in The Galena Territory is $118,849.
What is the Median Household income in The Galena Territory?
Median Household Income in The Galena Territory is $112,250.
What is Inequality or Gini Index in The Galena Territory?
Inequality or Gini Index in The Galena Territory is 0.38.
What is the Total Population of The Galena Territory?
Total Population of The Galena Territory is 1,606.
What is the Total Male Population of The Galena Territory?
Total Male Population of The Galena Territory is 813.
What is the Total Female Population of The Galena Territory?
Total Female Population of The Galena Territory is 793.
What is the Ratio of Males per 100 Females in The Galena Territory?
There are 102.52 Males per 100 Females in The Galena Territory.
What is the Ratio of Females per 100 Males in The Galena Territory?
There are 97.54 Females per 100 Males in The Galena Territory.
What is the Median Population Age in The Galena Territory?
Median Population Age in The Galena Territory is 63.1 Years.
What is the Average Family Size in The Galena Territory
Average Family Size in The Galena Territory is 2.5 People.
What is the Average Household Size in The Galena Territory
Average Household Size in The Galena Territory is 2.2 People.
How Large is the Labor Force in The Galena Territory?
There are 622 People in the Labor Forcein in The Galena Territory.
What is the Percentage of People in the Labor Force in The Galena Territory?
43.5% of People are in the Labor Force in The Galena Territory.
What is the Unemployment Rate in The Galena Territory?
Unemployment Rate in The Galena Territory is 1.0%.