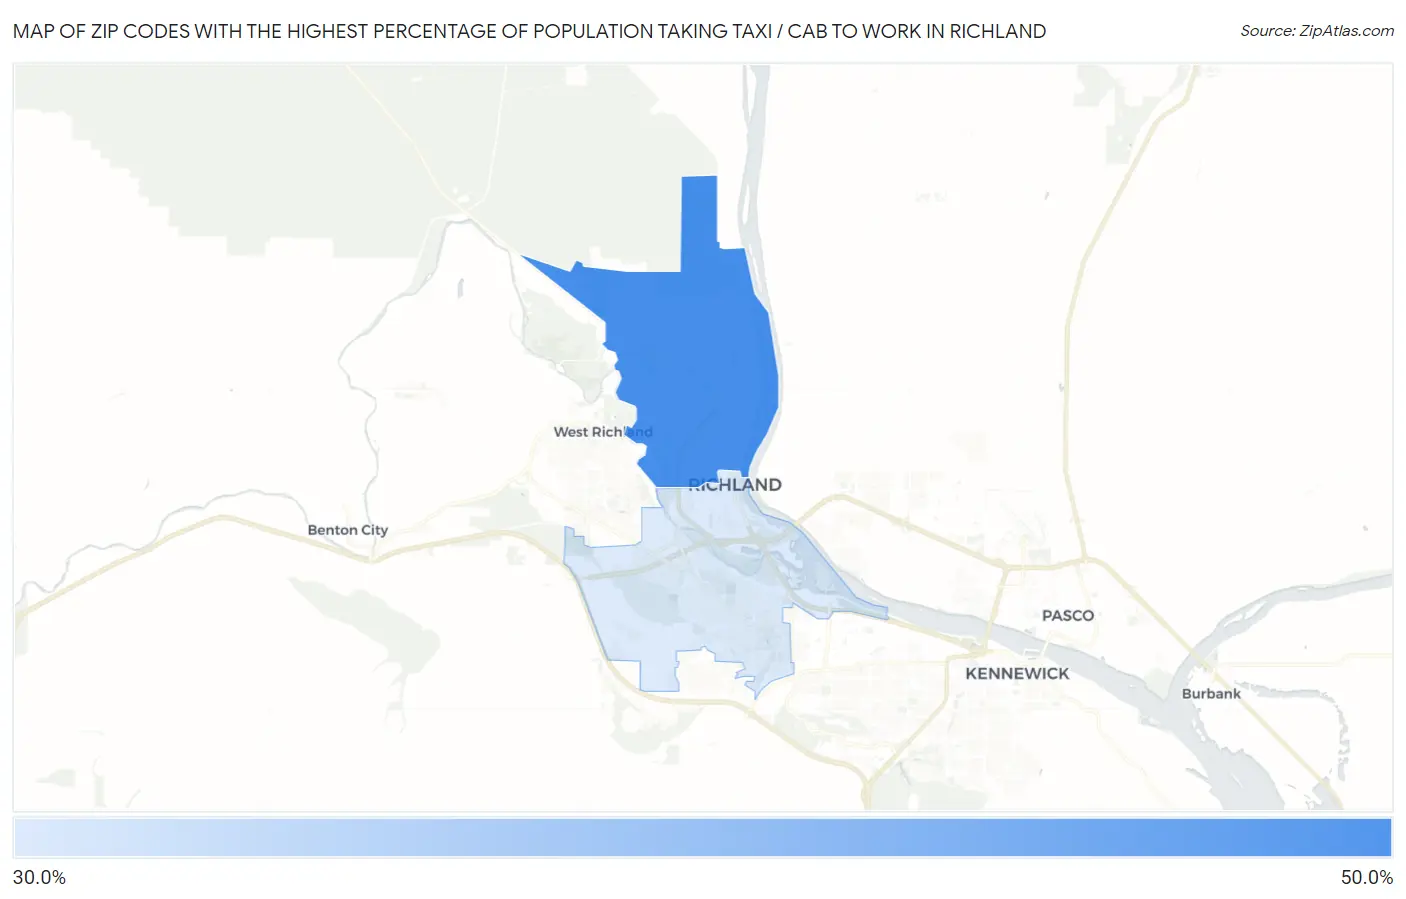
Zip Codes with the Highest Percentage of Population Taking Taxi / Cab to Work in Richland, WA
RELATED REPORTS & OPTIONS
Taxi / Cab
Richland
Compare Zip Codes
Map of Zip Codes with the Highest Percentage of Population Taking Taxi / Cab to Work in Richland
34.9%
47.9%
Zip Codes with the Highest Percentage of Population Taking Taxi / Cab to Work in Richland, WA
| Zip Code | % Take Taxi / Cab | vs State | vs National | |
| 1. | 99354 | 47.9% | 38.8%(+9.10)#89 | 38.2%(+9.70)#3,648 |
| 2. | 99352 | 34.9% | 38.8%(-3.90)#218 | 38.2%(-3.30)#8,922 |
1
Common Questions
What are the Top Zip Codes with the Highest Percentage of Population Taking Taxi / Cab to Work in Richland, WA?
Top Zip Codes with the Highest Percentage of Population Taking Taxi / Cab to Work in Richland, WA are:
What zip code has the Highest Percentage of Population Taking Taxi / Cab to Work in Richland, WA?
99354 has the Highest Percentage of Population Taking Taxi / Cab to Work in Richland, WA with 47.9%.
What is the Percentage of Population Taking Taxi / Cab to Work in Richland, WA?
Percentage of Population Taking Taxi / Cab to Work in Richland is 43.4%.
What is the Percentage of Population Taking Taxi / Cab to Work in Washington?
Percentage of Population Taking Taxi / Cab to Work in Washington is 38.8%.
What is the Percentage of Population Taking Taxi / Cab to Work in the United States?
Percentage of Population Taking Taxi / Cab to Work in the United States is 38.2%.