Swiss vs Pueblo Unemployment Among Women with Children Ages 6 to 17 years

COMPARE

Swiss
Race
Ancestry
AfghanAfricanAlaska NativeAlaskan AthabascanAlbanianAleutAlsatianAmericanApacheArabArapahoArgentineanArmenianAssyrian/Chaldean/SyriacAustralianAustrianBahamianBangladeshiBarbadianBasqueBelgianBelizeanBermudanBhutaneseBlackfeetBolivianBrazilianBritishBritish West IndianBulgarianBurmeseCajunCambodianCanadianCape VerdeanCarpatho RusynCelticCentral AmericanCentral American IndianCherokeeCheyenneChickasawChileanChineseChippewaChoctawColombianColvilleComancheCosta RicanCreeCreekCroatianCrowCubanCypriotCzechCzechoslovakianDanishDelawareDominicanDutchDutch West IndianEastern EuropeanEcuadorianEgyptianEnglishEstonianEthiopianEuropeanFijianFilipinoFinnishFrenchFrench American IndianFrench CanadianGermanGerman RussianGhanaianGreekGuamanian/ChamorroGuatemalanGuyaneseHaitianHmongHonduranHopiHoumaHungarianIcelanderIndian (Asian)IndonesianInupiatIranianIraqiIrishIroquoisIsraeliItalianJamaicanJapaneseJordanianKenyanKiowaKoreanLaotianLatvianLebaneseLiberianLithuanianLumbeeLuxembourgerMacedonianMalaysianMalteseMarshalleseMenomineeMexicanMexican American IndianMongolianMoroccanNative HawaiianNavajoNepaleseNew ZealanderNicaraguanNigerianNorthern EuropeanNorwegianOkinawanOsageOttawaPaiutePakistaniPalestinianPanamanianParaguayanPennsylvania GermanPeruvianPimaPolishPortuguesePotawatomiPuerto RicanPuget Sound SalishRomanianRussianSalvadoranSamoanScandinavianScotch-IrishScottishSeminoleSenegaleseSerbianShoshoneSierra LeoneanSiouxSlavicSlovakSloveneSomaliSouth AfricanSouth AmericanSouth American IndianSoviet UnionSpaniardSpanishSpanish AmericanSpanish American IndianSri LankanSubsaharan AfricanSudaneseSwedishSwissSyrianTaiwaneseThaiTlingit-HaidaTohono O'OdhamTonganTrinidadian and TobagonianTsimshianTurkishU.S. Virgin IslanderUgandanUkrainianUruguayanUteVenezuelanVietnameseWelshWest IndianYakamaYaquiYugoslavianYumanYup'ikZimbabwean
Immigration
NonimmigrantsImmigrantsAfghanistanAfricaAlbaniaArgentinaArmeniaAsiaAustraliaAustriaBahamasBangladeshBarbadosBelarusBelgiumBelizeBoliviaBosnia and HerzegovinaBrazilBulgariaBurma/MyanmarCabo VerdeCambodiaCameroonCanadaCaribbeanCentral AmericaChileChinaColombiaCongoCosta RicaCroatiaCubaCzechoslovakiaDenmarkDominicaDominican RepublicEastern AfricaEastern AsiaEastern EuropeEcuadorEgyptEl SalvadorEnglandEritreaEthiopiaEuropeFijiFranceGermanyGhanaGreeceGrenadaGuatemalaGuyanaHaitiHondurasHong KongHungaryIndiaIndonesiaIranIraqIrelandIsraelItalyJamaicaJapanJordanKazakhstanKenyaKoreaKuwaitLaosLatin AmericaLatviaLebanonLiberiaLithuaniaMalaysiaMexicoMicronesiaMiddle AfricaMoldovaMoroccoNepalNetherlandsNicaraguaNigeriaNorth AmericaNorth MacedoniaNorthern AfricaNorthern EuropeNorwayOceaniaPakistanPanamaPeruPhilippinesPolandPortugalRomaniaRussiaSaudi ArabiaScotlandSenegalSerbiaSierra LeoneSingaporeSomaliaSouth AfricaSouth AmericaSouth Central AsiaSouth Eastern AsiaSouthern EuropeSpainSri LankaSt. Vincent and the GrenadinesSudanSwedenSwitzerlandSyriaTaiwanThailandTrinidad and TobagoTurkeyUgandaUkraineUruguayUzbekistanVenezuelaVietnamWest IndiesWestern AfricaWestern AsiaWestern EuropeYemenZaireZimbabweAzores
Pueblo
Race
Ancestry
AfghanAfricanAlaska NativeAlaskan AthabascanAlbanianAleutAlsatianAmericanApacheArabArapahoArgentineanArmenianAssyrian/Chaldean/SyriacAustralianAustrianBahamianBangladeshiBarbadianBasqueBelgianBelizeanBermudanBhutaneseBlackfeetBolivianBrazilianBritishBritish West IndianBulgarianBurmeseCajunCambodianCanadianCape VerdeanCarpatho RusynCelticCentral AmericanCentral American IndianCherokeeCheyenneChickasawChileanChineseChippewaChoctawColombianColvilleComancheCosta RicanCreeCreekCroatianCrowCubanCypriotCzechCzechoslovakianDanishDelawareDominicanDutchDutch West IndianEastern EuropeanEcuadorianEgyptianEnglishEstonianEthiopianEuropeanFijianFilipinoFinnishFrenchFrench American IndianFrench CanadianGermanGerman RussianGhanaianGreekGuamanian/ChamorroGuatemalanGuyaneseHaitianHmongHonduranHopiHoumaHungarianIcelanderIndian (Asian)IndonesianInupiatIranianIraqiIrishIroquoisIsraeliItalianJamaicanJapaneseJordanianKenyanKiowaKoreanLaotianLatvianLebaneseLiberianLithuanianLumbeeLuxembourgerMacedonianMalaysianMalteseMarshalleseMenomineeMexicanMexican American IndianMongolianMoroccanNative HawaiianNavajoNepaleseNew ZealanderNicaraguanNigerianNorthern EuropeanNorwegianOkinawanOsageOttawaPaiutePakistaniPalestinianPanamanianParaguayanPennsylvania GermanPeruvianPimaPolishPortuguesePotawatomiPuebloPuerto RicanPuget Sound SalishRomanianRussianSalvadoranSamoanScandinavianScotch-IrishScottishSeminoleSenegaleseSerbianShoshoneSierra LeoneanSiouxSlavicSlovakSloveneSomaliSouth AfricanSouth AmericanSouth American IndianSoviet UnionSpaniardSpanishSpanish AmericanSpanish American IndianSri LankanSubsaharan AfricanSudaneseSwedishSyrianTaiwaneseThaiTlingit-HaidaTohono O'OdhamTonganTrinidadian and TobagonianTsimshianTurkishU.S. Virgin IslanderUgandanUkrainianUruguayanUteVenezuelanVietnameseWelshWest IndianYakamaYaquiYugoslavianYumanYup'ikZimbabwean
Immigration
NonimmigrantsImmigrantsAfghanistanAfricaAlbaniaArgentinaArmeniaAsiaAustraliaAustriaBahamasBangladeshBarbadosBelarusBelgiumBelizeBoliviaBosnia and HerzegovinaBrazilBulgariaBurma/MyanmarCabo VerdeCambodiaCameroonCanadaCaribbeanCentral AmericaChileChinaColombiaCongoCosta RicaCroatiaCubaCzechoslovakiaDenmarkDominicaDominican RepublicEastern AfricaEastern AsiaEastern EuropeEcuadorEgyptEl SalvadorEnglandEritreaEthiopiaEuropeFijiFranceGermanyGhanaGreeceGrenadaGuatemalaGuyanaHaitiHondurasHong KongHungaryIndiaIndonesiaIranIraqIrelandIsraelItalyJamaicaJapanJordanKazakhstanKenyaKoreaKuwaitLaosLatin AmericaLatviaLebanonLiberiaLithuaniaMalaysiaMexicoMicronesiaMiddle AfricaMoldovaMoroccoNepalNetherlandsNicaraguaNigeriaNorth AmericaNorth MacedoniaNorthern AfricaNorthern EuropeNorwayOceaniaPakistanPanamaPeruPhilippinesPolandPortugalRomaniaRussiaSaudi ArabiaScotlandSenegalSerbiaSierra LeoneSingaporeSomaliaSouth AfricaSouth AmericaSouth Central AsiaSouth Eastern AsiaSouthern EuropeSpainSri LankaSt. Vincent and the GrenadinesSudanSwedenSwitzerlandSyriaTaiwanThailandTrinidad and TobagoTurkeyUgandaUkraineUruguayUzbekistanVenezuelaVietnamWest IndiesWestern AfricaWestern AsiaWestern EuropeYemenZaireZimbabweAzores
Unemployment Among Women with Children Ages 6 to 17 years
Income
Poverty
Unemployment
Labor Participation
Family Structure
Vehicle Availability
Education Level
Disability

Unemployment Among Women with Children Ages 6 to 17 years Comparison

Swiss

Pueblo

Fair
Exceptional
9.0%
UNEMPLOYMENT AMONG WOMEN WITH CHILDREN AGES 6 TO 17 YEARS
33.5/ 100
METRIC RATING
183rd/ 347
METRIC RANK
8.6%
UNEMPLOYMENT AMONG WOMEN WITH CHILDREN AGES 6 TO 17 YEARS
96.2/ 100
METRIC RATING
118th/ 347
METRIC RANK

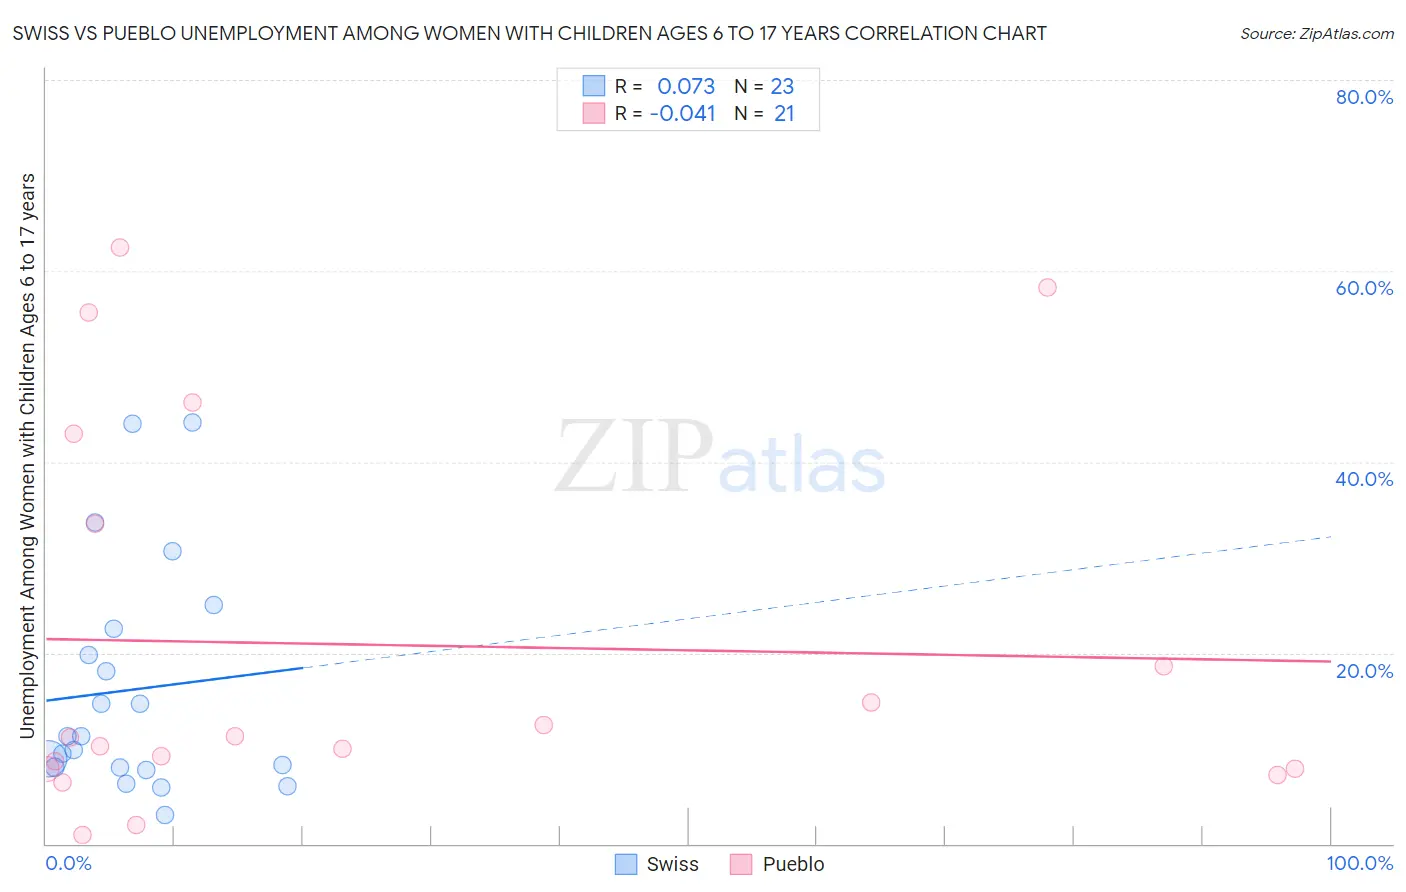
Swiss vs Pueblo Unemployment Among Women with Children Ages 6 to 17 years Correlation Chart

The statistical analysis conducted on geographies consisting of 308,367,894 people shows a slight positive correlation between the proportion of Swiss and unemployment rate among women with children between the ages 6 and 17 in the United States with a correlation coefficient (R) of 0.073 and weighted average of 9.0%. Similarly, the statistical analysis conducted on geographies consisting of 103,975,962 people shows no correlation between the proportion of Pueblo and unemployment rate among women with children between the ages 6 and 17 in the United States with a correlation coefficient (R) of -0.041 and weighted average of 8.6%, a difference of 4.5%.
Swiss vs Pueblo Unemployment Among Women with Children Ages 6 to 17 years

Unemployment Among Women with Children Ages 6 to 17 years Correlation Summary

MeasurementSwissPueblo
Minimum3.0%0.90%
Maximum44.2%62.5%
Range41.2%61.6%
Mean16.1%20.8%
Median11.3%11.1%
Interquartile 25% (IQ1)8.0%7.8%
Interquartile 75% (IQ3)22.5%38.2%
Interquartile Range (IQR)14.5%30.4%
Standard Deviation (Sample)12.0%19.9%
Standard Deviation (Population)11.7%19.4%

Similar Demographics by Unemployment Among Women with Children Ages 6 to 17 years

Demographics Similar to Swiss by Unemployment Among Women with Children Ages 6 to 17 years

In terms of unemployment among women with children ages 6 to 17 years, the demographic groups most similar to Swiss are Palestinian (9.0%, a difference of 0.0%), Immigrants from Czechoslovakia (9.0%, a difference of 0.050%), South American Indian (9.0%, a difference of 0.050%), Immigrants from Congo (9.0%, a difference of 0.050%), and Immigrants from Spain (9.0%, a difference of 0.050%).
DemographicsRating | RankUnemployment Among Women with Children Ages 6 to 17 years
Immigrants | Italy
43.7
/100
|
#176
Average
9.0%
Immigrants | Jordan
41.6
/100
|
#177
Average
9.0%
Menominee
39.3
/100
|
#178
Fair
9.0%
Immigrants | Zaire
38.3
/100
|
#179
Fair
9.0%
Ethiopians
37.6
/100
|
#180
Fair
9.0%
Immigrants | Czechoslovakia
34.5
/100
|
#181
Fair
9.0%
South American Indians
34.4
/100
|
#182
Fair
9.0%
Swiss
33.5
/100
|
#183
Fair
9.0%
Palestinians
33.4
/100
|
#184
Fair
9.0%
Immigrants | Congo
32.5
/100
|
#185
Fair
9.0%
Immigrants | Spain
32.4
/100
|
#186
Fair
9.0%
Comanche
30.0
/100
|
#187
Fair
9.0%
Immigrants | Syria
29.7
/100
|
#188
Fair
9.1%
Immigrants | Immigrants
29.2
/100
|
#189
Fair
9.1%
Slovenes
28.5
/100
|
#190
Fair
9.1%

Demographics Similar to Pueblo by Unemployment Among Women with Children Ages 6 to 17 years

In terms of unemployment among women with children ages 6 to 17 years, the demographic groups most similar to Pueblo are Immigrants from Grenada (8.6%, a difference of 0.010%), Albanian (8.6%, a difference of 0.030%), Zimbabwean (8.6%, a difference of 0.040%), Israeli (8.7%, a difference of 0.090%), and Argentinean (8.6%, a difference of 0.11%).
DemographicsRating | RankUnemployment Among Women with Children Ages 6 to 17 years
Immigrants | Ukraine
97.4
/100
|
#111
Exceptional
8.6%
Romanians
97.1
/100
|
#112
Exceptional
8.6%
Eastern Europeans
96.8
/100
|
#113
Exceptional
8.6%
Immigrants | Russia
96.7
/100
|
#114
Exceptional
8.6%
Argentineans
96.5
/100
|
#115
Exceptional
8.6%
Zimbabweans
96.3
/100
|
#116
Exceptional
8.6%
Albanians
96.3
/100
|
#117
Exceptional
8.6%
Pueblo
96.2
/100
|
#118
Exceptional
8.6%
Immigrants | Grenada
96.2
/100
|
#119
Exceptional
8.6%
Israelis
95.9
/100
|
#120
Exceptional
8.7%
Immigrants | Denmark
95.5
/100
|
#121
Exceptional
8.7%
Immigrants | Egypt
95.0
/100
|
#122
Exceptional
8.7%
Immigrants | Morocco
94.9
/100
|
#123
Exceptional
8.7%
Immigrants | Lebanon
94.9
/100
|
#124
Exceptional
8.7%
South Africans
94.6
/100
|
#125
Exceptional
8.7%