Cherokee vs Welsh Unemployment Among Women with Children Ages 6 to 17 years

COMPARE

Cherokee
Race
Ancestry
AfghanAfricanAlaska NativeAlaskan AthabascanAlbanianAleutAlsatianAmericanApacheArabArapahoArgentineanArmenianAssyrian/Chaldean/SyriacAustralianAustrianBahamianBangladeshiBarbadianBasqueBelgianBelizeanBermudanBhutaneseBlackfeetBolivianBrazilianBritishBritish West IndianBulgarianBurmeseCajunCambodianCanadianCape VerdeanCarpatho RusynCelticCentral AmericanCentral American IndianCherokeeCheyenneChickasawChileanChineseChippewaChoctawColombianColvilleComancheCosta RicanCreeCreekCroatianCrowCubanCypriotCzechCzechoslovakianDanishDelawareDominicanDutchDutch West IndianEastern EuropeanEcuadorianEgyptianEnglishEstonianEthiopianEuropeanFijianFilipinoFinnishFrenchFrench American IndianFrench CanadianGermanGerman RussianGhanaianGreekGuamanian/ChamorroGuatemalanGuyaneseHaitianHmongHonduranHopiHoumaHungarianIcelanderIndian (Asian)IndonesianInupiatIranianIraqiIrishIroquoisIsraeliItalianJamaicanJapaneseJordanianKenyanKiowaKoreanLaotianLatvianLebaneseLiberianLithuanianLumbeeLuxembourgerMacedonianMalaysianMalteseMarshalleseMenomineeMexicanMexican American IndianMongolianMoroccanNative HawaiianNavajoNepaleseNew ZealanderNicaraguanNigerianNorthern EuropeanNorwegianOkinawanOsageOttawaPaiutePakistaniPalestinianPanamanianParaguayanPennsylvania GermanPeruvianPimaPolishPortuguesePotawatomiPuebloPuerto RicanPuget Sound SalishRomanianRussianSalvadoranSamoanScandinavianScotch-IrishScottishSeminoleSenegaleseSerbianShoshoneSierra LeoneanSiouxSlavicSlovakSloveneSomaliSouth AfricanSouth AmericanSouth American IndianSoviet UnionSpaniardSpanishSpanish AmericanSpanish American IndianSri LankanSubsaharan AfricanSudaneseSwedishSwissSyrianTaiwaneseThaiTlingit-HaidaTohono O'OdhamTonganTrinidadian and TobagonianTsimshianTurkishU.S. Virgin IslanderUgandanUkrainianUruguayanUteVenezuelanVietnameseWest IndianYakamaYaquiYugoslavianYumanYup'ikZimbabwean
Immigration
NonimmigrantsImmigrantsAfghanistanAfricaAlbaniaArgentinaArmeniaAsiaAustraliaAustriaBahamasBangladeshBarbadosBelarusBelgiumBelizeBoliviaBosnia and HerzegovinaBrazilBulgariaBurma/MyanmarCabo VerdeCambodiaCameroonCanadaCaribbeanCentral AmericaChileChinaColombiaCongoCosta RicaCroatiaCubaCzechoslovakiaDenmarkDominicaDominican RepublicEastern AfricaEastern AsiaEastern EuropeEcuadorEgyptEl SalvadorEnglandEritreaEthiopiaEuropeFijiFranceGermanyGhanaGreeceGrenadaGuatemalaGuyanaHaitiHondurasHong KongHungaryIndiaIndonesiaIranIraqIrelandIsraelItalyJamaicaJapanJordanKazakhstanKenyaKoreaKuwaitLaosLatin AmericaLatviaLebanonLiberiaLithuaniaMalaysiaMexicoMicronesiaMiddle AfricaMoldovaMoroccoNepalNetherlandsNicaraguaNigeriaNorth AmericaNorth MacedoniaNorthern AfricaNorthern EuropeNorwayOceaniaPakistanPanamaPeruPhilippinesPolandPortugalRomaniaRussiaSaudi ArabiaScotlandSenegalSerbiaSierra LeoneSingaporeSomaliaSouth AfricaSouth AmericaSouth Central AsiaSouth Eastern AsiaSouthern EuropeSpainSri LankaSt. Vincent and the GrenadinesSudanSwedenSwitzerlandSyriaTaiwanThailandTrinidad and TobagoTurkeyUgandaUkraineUruguayUzbekistanVenezuelaVietnamWest IndiesWestern AfricaWestern AsiaWestern EuropeYemenZaireZimbabweAzores
Welsh
Race
Ancestry
AfghanAfricanAlaska NativeAlaskan AthabascanAlbanianAleutAlsatianAmericanApacheArabArapahoArgentineanArmenianAssyrian/Chaldean/SyriacAustralianAustrianBahamianBangladeshiBarbadianBasqueBelgianBelizeanBermudanBhutaneseBlackfeetBolivianBrazilianBritishBritish West IndianBulgarianBurmeseCajunCambodianCanadianCape VerdeanCarpatho RusynCelticCentral AmericanCentral American IndianCheyenneChickasawChileanChineseChippewaChoctawColombianColvilleComancheCosta RicanCreeCreekCroatianCrowCubanCypriotCzechCzechoslovakianDanishDelawareDominicanDutchDutch West IndianEastern EuropeanEcuadorianEgyptianEnglishEstonianEthiopianEuropeanFijianFilipinoFinnishFrenchFrench American IndianFrench CanadianGermanGerman RussianGhanaianGreekGuamanian/ChamorroGuatemalanGuyaneseHaitianHmongHonduranHopiHoumaHungarianIcelanderIndian (Asian)IndonesianInupiatIranianIraqiIrishIroquoisIsraeliItalianJamaicanJapaneseJordanianKenyanKiowaKoreanLaotianLatvianLebaneseLiberianLithuanianLumbeeLuxembourgerMacedonianMalaysianMalteseMarshalleseMenomineeMexicanMexican American IndianMongolianMoroccanNative HawaiianNavajoNepaleseNew ZealanderNicaraguanNigerianNorthern EuropeanNorwegianOkinawanOsageOttawaPaiutePakistaniPalestinianPanamanianParaguayanPennsylvania GermanPeruvianPimaPolishPortuguesePotawatomiPuebloPuerto RicanPuget Sound SalishRomanianRussianSalvadoranSamoanScandinavianScotch-IrishScottishSeminoleSenegaleseSerbianShoshoneSierra LeoneanSiouxSlavicSlovakSloveneSomaliSouth AfricanSouth AmericanSouth American IndianSoviet UnionSpaniardSpanishSpanish AmericanSpanish American IndianSri LankanSubsaharan AfricanSudaneseSwedishSwissSyrianTaiwaneseThaiTlingit-HaidaTohono O'OdhamTonganTrinidadian and TobagonianTsimshianTurkishU.S. Virgin IslanderUgandanUkrainianUruguayanUteVenezuelanVietnameseWelshWest IndianYakamaYaquiYugoslavianYumanYup'ikZimbabwean
Immigration
NonimmigrantsImmigrantsAfghanistanAfricaAlbaniaArgentinaArmeniaAsiaAustraliaAustriaBahamasBangladeshBarbadosBelarusBelgiumBelizeBoliviaBosnia and HerzegovinaBrazilBulgariaBurma/MyanmarCabo VerdeCambodiaCameroonCanadaCaribbeanCentral AmericaChileChinaColombiaCongoCosta RicaCroatiaCubaCzechoslovakiaDenmarkDominicaDominican RepublicEastern AfricaEastern AsiaEastern EuropeEcuadorEgyptEl SalvadorEnglandEritreaEthiopiaEuropeFijiFranceGermanyGhanaGreeceGrenadaGuatemalaGuyanaHaitiHondurasHong KongHungaryIndiaIndonesiaIranIraqIrelandIsraelItalyJamaicaJapanJordanKazakhstanKenyaKoreaKuwaitLaosLatin AmericaLatviaLebanonLiberiaLithuaniaMalaysiaMexicoMicronesiaMiddle AfricaMoldovaMoroccoNepalNetherlandsNicaraguaNigeriaNorth AmericaNorth MacedoniaNorthern AfricaNorthern EuropeNorwayOceaniaPakistanPanamaPeruPhilippinesPolandPortugalRomaniaRussiaSaudi ArabiaScotlandSenegalSerbiaSierra LeoneSingaporeSomaliaSouth AfricaSouth AmericaSouth Central AsiaSouth Eastern AsiaSouthern EuropeSpainSri LankaSt. Vincent and the GrenadinesSudanSwedenSwitzerlandSyriaTaiwanThailandTrinidad and TobagoTurkeyUgandaUkraineUruguayUzbekistanVenezuelaVietnamWest IndiesWestern AfricaWestern AsiaWestern EuropeYemenZaireZimbabweAzores
Unemployment Among Women with Children Ages 6 to 17 years
Income
Poverty
Unemployment
Labor Participation
Family Structure
Vehicle Availability
Education Level
Disability

Unemployment Among Women with Children Ages 6 to 17 years Comparison

Cherokee

Welsh

Tragic
Tragic
10.0%
UNEMPLOYMENT AMONG WOMEN WITH CHILDREN AGES 6 TO 17 YEARS
0.0/ 100
METRIC RATING
295th/ 347
METRIC RANK
9.3%
UNEMPLOYMENT AMONG WOMEN WITH CHILDREN AGES 6 TO 17 YEARS
4.0/ 100
METRIC RATING
230th/ 347
METRIC RANK

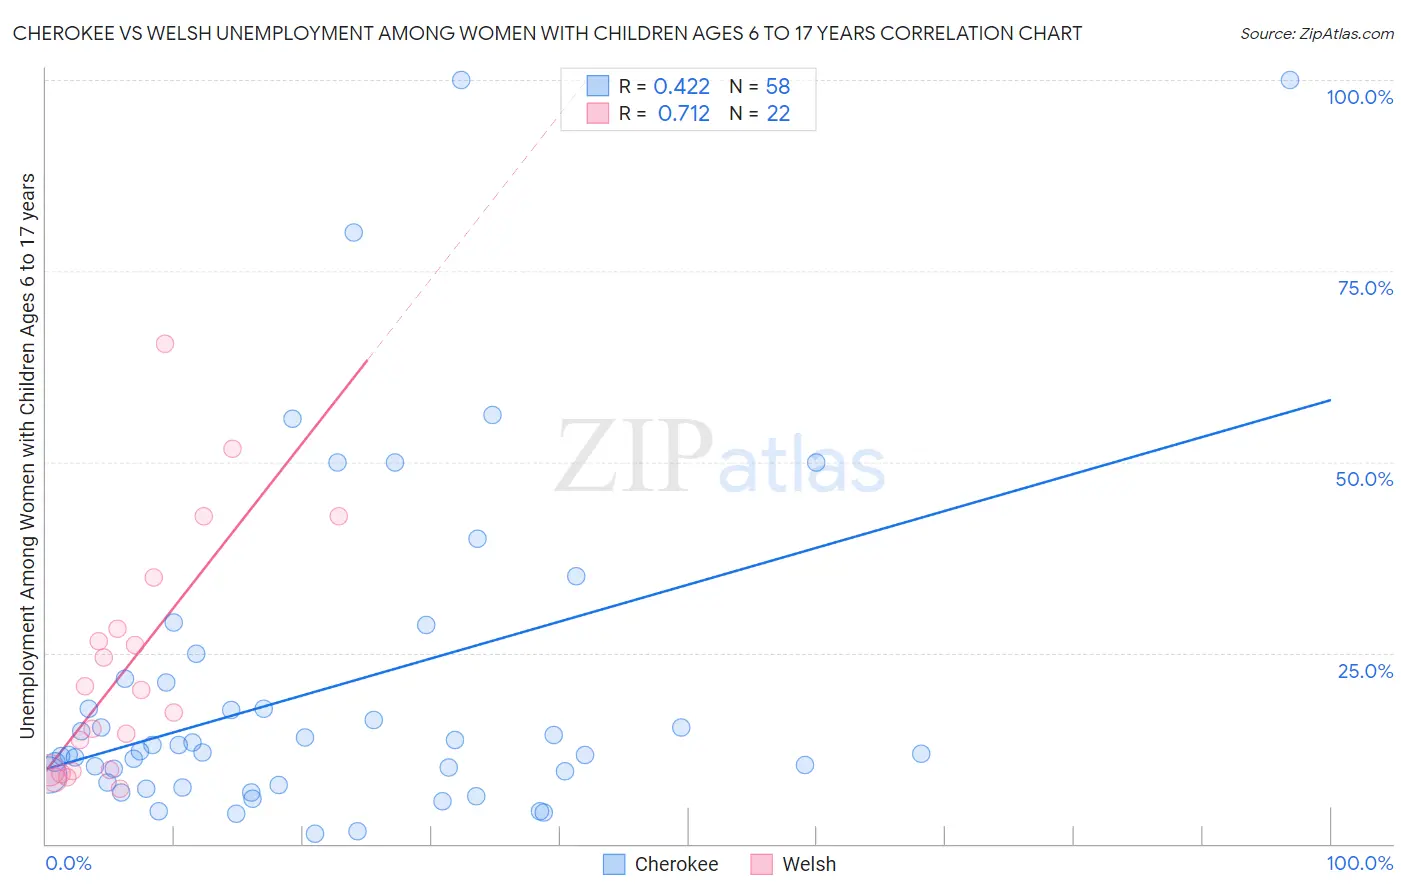
Cherokee vs Welsh Unemployment Among Women with Children Ages 6 to 17 years Correlation Chart

The statistical analysis conducted on geographies consisting of 331,434,739 people shows a moderate positive correlation between the proportion of Cherokee and unemployment rate among women with children between the ages 6 and 17 in the United States with a correlation coefficient (R) of 0.422 and weighted average of 10.0%. Similarly, the statistical analysis conducted on geographies consisting of 338,386,980 people shows a strong positive correlation between the proportion of Welsh and unemployment rate among women with children between the ages 6 and 17 in the United States with a correlation coefficient (R) of 0.712 and weighted average of 9.3%, a difference of 8.0%.
Cherokee vs Welsh Unemployment Among Women with Children Ages 6 to 17 years

Unemployment Among Women with Children Ages 6 to 17 years Correlation Summary

MeasurementCherokeeWelsh
Minimum1.3%7.2%
Maximum100.0%65.4%
Range98.7%58.2%
Mean20.4%23.0%
Median12.0%18.6%
Interquartile 25% (IQ1)8.0%9.7%
Interquartile 75% (IQ3)21.1%28.2%
Interquartile Range (IQR)13.2%18.5%
Standard Deviation (Sample)21.9%15.9%
Standard Deviation (Population)21.7%15.5%

Similar Demographics by Unemployment Among Women with Children Ages 6 to 17 years

Demographics Similar to Cherokee by Unemployment Among Women with Children Ages 6 to 17 years

In terms of unemployment among women with children ages 6 to 17 years, the demographic groups most similar to Cherokee are Ecuadorian (10.0%, a difference of 0.030%), Haitian (10.0%, a difference of 0.13%), Carpatho Rusyn (10.0%, a difference of 0.22%), Nonimmigrants (10.0%, a difference of 0.23%), and Subsaharan African (10.0%, a difference of 0.25%).
DemographicsRating | RankUnemployment Among Women with Children Ages 6 to 17 years
Shoshone
0.0
/100
|
#288
Tragic
10.0%
Hondurans
0.0
/100
|
#289
Tragic
10.0%
Sub-Saharan Africans
0.0
/100
|
#290
Tragic
10.0%
Immigrants | Nonimmigrants
0.0
/100
|
#291
Tragic
10.0%
Carpatho Rusyns
0.0
/100
|
#292
Tragic
10.0%
Haitians
0.0
/100
|
#293
Tragic
10.0%
Ecuadorians
0.0
/100
|
#294
Tragic
10.0%
Cherokee
0.0
/100
|
#295
Tragic
10.0%
Immigrants | Western Africa
0.0
/100
|
#296
Tragic
10.1%
Immigrants | Caribbean
0.0
/100
|
#297
Tragic
10.1%
Immigrants | Haiti
0.0
/100
|
#298
Tragic
10.1%
Immigrants | Honduras
0.0
/100
|
#299
Tragic
10.1%
Nigerians
0.0
/100
|
#300
Tragic
10.1%
Immigrants | Bahamas
0.0
/100
|
#301
Tragic
10.1%
Venezuelans
0.0
/100
|
#302
Tragic
10.2%

Demographics Similar to Welsh by Unemployment Among Women with Children Ages 6 to 17 years

In terms of unemployment among women with children ages 6 to 17 years, the demographic groups most similar to Welsh are Macedonian (9.3%, a difference of 0.010%), French American Indian (9.3%, a difference of 0.070%), Lumbee (9.3%, a difference of 0.090%), Estonian (9.3%, a difference of 0.13%), and Panamanian (9.3%, a difference of 0.15%).
DemographicsRating | RankUnemployment Among Women with Children Ages 6 to 17 years
Immigrants | Eritrea
5.8
/100
|
#223
Tragic
9.2%
Immigrants | El Salvador
5.3
/100
|
#224
Tragic
9.3%
Chinese
5.2
/100
|
#225
Tragic
9.3%
Immigrants | Azores
4.6
/100
|
#226
Tragic
9.3%
Panamanians
4.5
/100
|
#227
Tragic
9.3%
Estonians
4.4
/100
|
#228
Tragic
9.3%
Lumbee
4.3
/100
|
#229
Tragic
9.3%
Welsh
4.0
/100
|
#230
Tragic
9.3%
Macedonians
3.9
/100
|
#231
Tragic
9.3%
French American Indians
3.7
/100
|
#232
Tragic
9.3%
Immigrants | St. Vincent and the Grenadines
3.3
/100
|
#233
Tragic
9.3%
Mexicans
3.2
/100
|
#234
Tragic
9.3%
Uruguayans
3.0
/100
|
#235
Tragic
9.3%
Hungarians
3.0
/100
|
#236
Tragic
9.3%
Immigrants | Belize
2.8
/100
|
#237
Tragic
9.3%