Zip Codes with the Highest Percentage of Population Employed in Health Care & Social Assistance in Baytown, TX
RELATED REPORTS & OPTIONS
Health Care & Social Assistance
Baytown
Compare Zip Codes
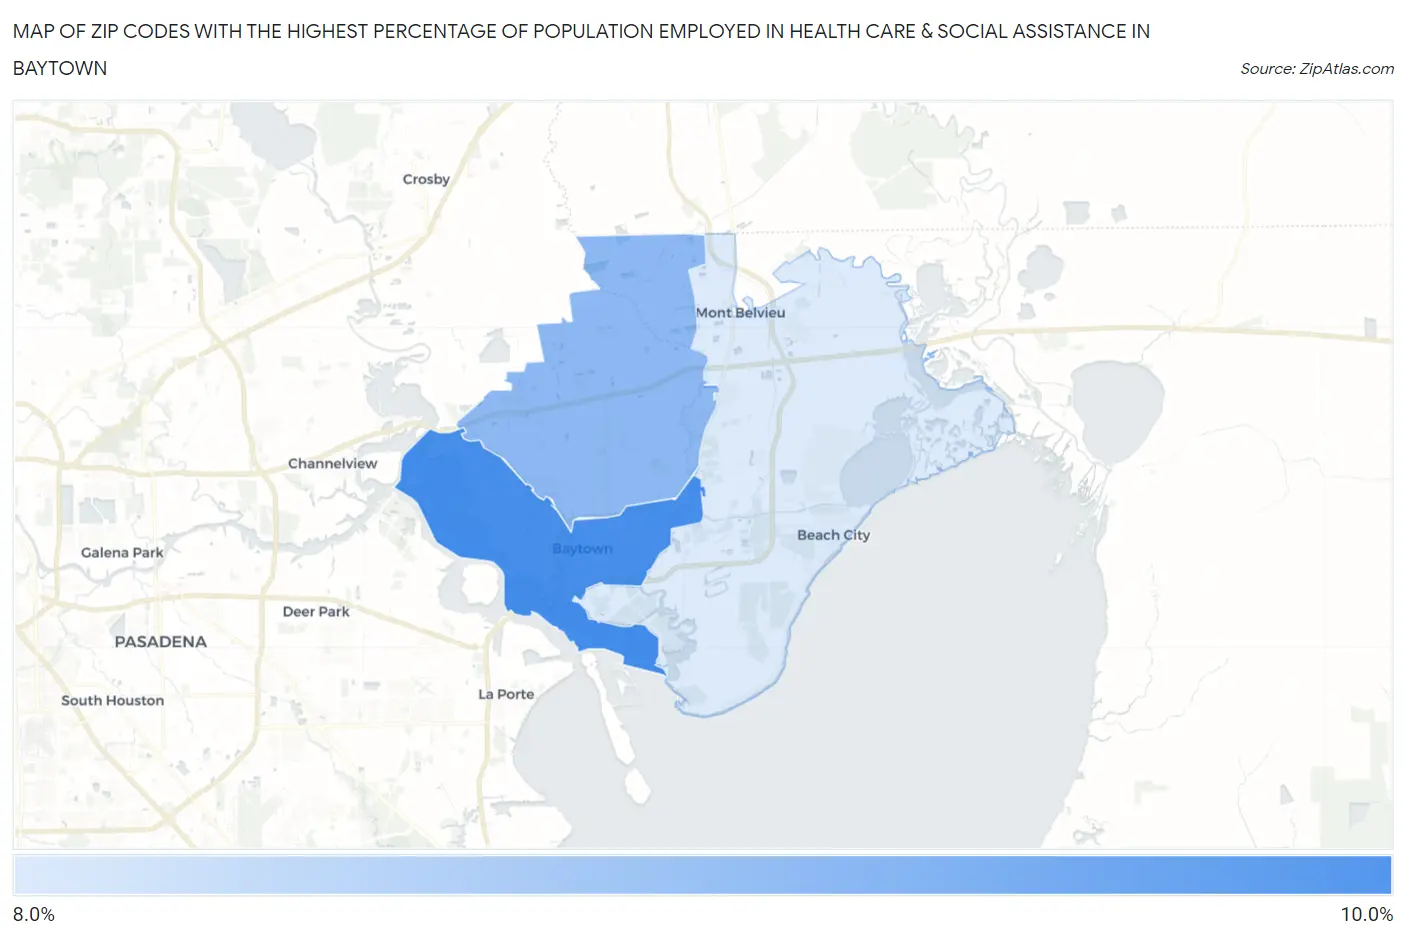
Map of Zip Codes with the Highest Percentage of Population Employed in Health Care & Social Assistance in Baytown
8.5%
9.7%
Zip Codes with the Highest Percentage of Population Employed in Health Care & Social Assistance in Baytown, TX
| Zip Code | % Employed | vs State | vs National | |
| 1. | 77520 | 9.7% | 11.9%(-2.20)#1,177 | 13.9%(-4.21)#23,974 |
| 2. | 77521 | 9.1% | 11.9%(-2.80)#1,255 | 13.9%(-4.81)#24,978 |
| 3. | 77523 | 8.5% | 11.9%(-3.47)#1,360 | 13.9%(-5.48)#25,953 |
1
Common Questions
What are the Top Zip Codes with the Highest Percentage of Population Employed in Health Care & Social Assistance in Baytown, TX?
Top Zip Codes with the Highest Percentage of Population Employed in Health Care & Social Assistance in Baytown, TX are:
What zip code has the Highest Percentage of Population Employed in Health Care & Social Assistance in Baytown, TX?
77520 has the Highest Percentage of Population Employed in Health Care & Social Assistance in Baytown, TX with 9.7%.
What is the Percentage of Population Employed in Health Care & Social Assistance in Baytown, TX?
Percentage of Population Employed in Health Care & Social Assistance in Baytown is 10.3%.
What is the Percentage of Population Employed in Health Care & Social Assistance in Texas?
Percentage of Population Employed in Health Care & Social Assistance in Texas is 11.9%.
What is the Percentage of Population Employed in Health Care & Social Assistance in the United States?
Percentage of Population Employed in Health Care & Social Assistance in the United States is 13.9%.