Zip Codes with the Highest Percentage of Population Employed in Computer & Mathematics in Summerville, SC
RELATED REPORTS & OPTIONS
Computer & Mathematics
Summerville
Compare Zip Codes
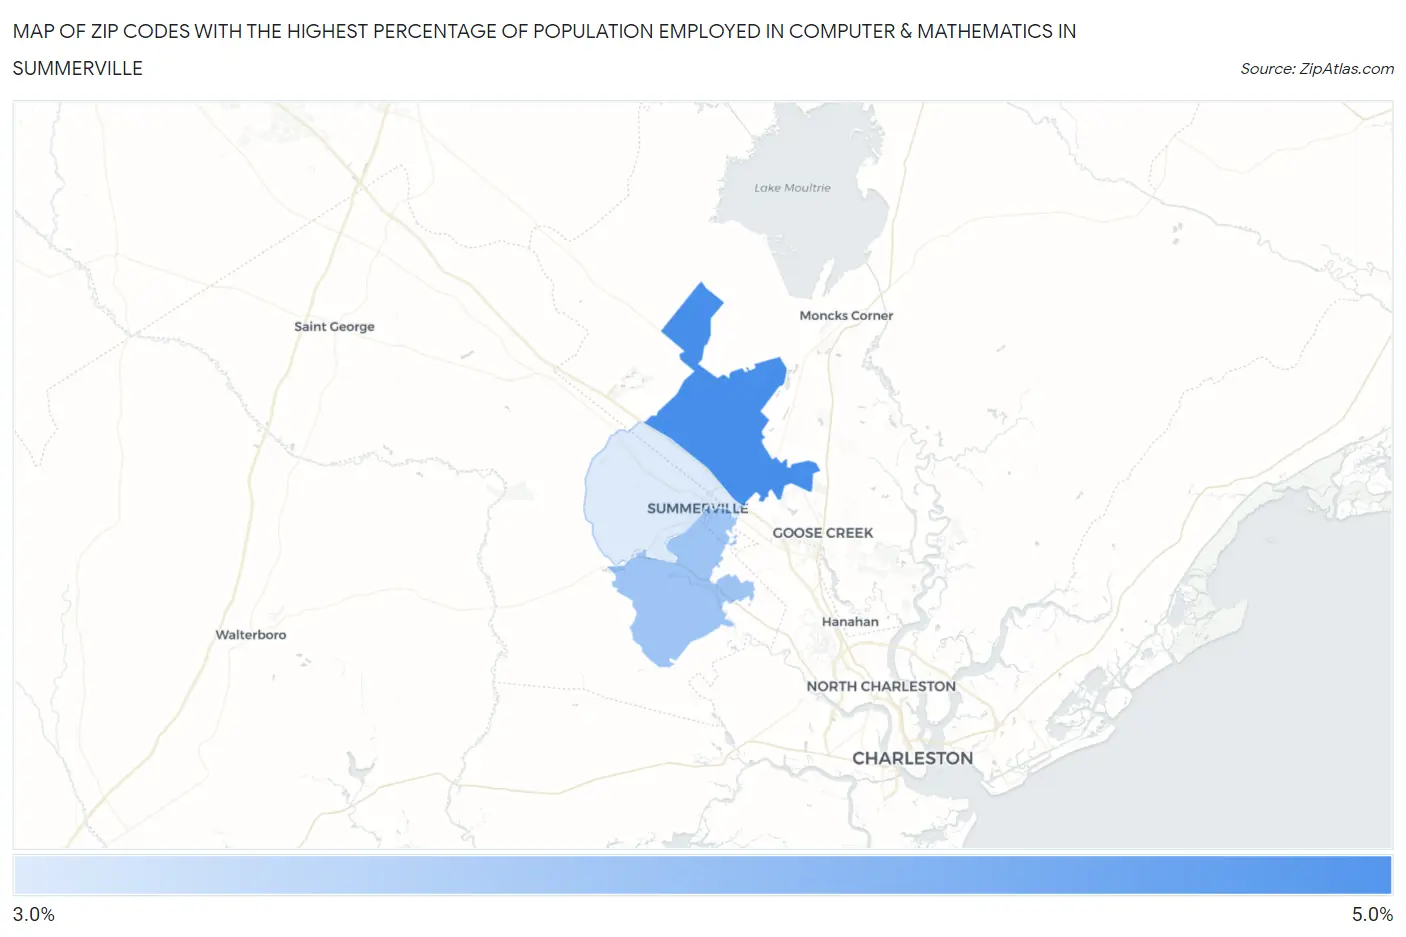
Map of Zip Codes with the Highest Percentage of Population Employed in Computer & Mathematics in Summerville
3.3%
4.3%
Zip Codes with the Highest Percentage of Population Employed in Computer & Mathematics in Summerville, SC
| Zip Code | % Employed | vs State | vs National | |
| 1. | 29486 | 4.3% | 2.4%(+1.87)#29 | 3.5%(+0.767)#4,450 |
| 2. | 29485 | 3.7% | 2.4%(+1.27)#45 | 3.5%(+0.162)#5,763 |
| 3. | 29483 | 3.3% | 2.4%(+0.840)#59 | 3.5%(-0.265)#6,913 |
1
Common Questions
What are the Top Zip Codes with the Highest Percentage of Population Employed in Computer & Mathematics in Summerville, SC?
Top Zip Codes with the Highest Percentage of Population Employed in Computer & Mathematics in Summerville, SC are:
What zip code has the Highest Percentage of Population Employed in Computer & Mathematics in Summerville, SC?
29486 has the Highest Percentage of Population Employed in Computer & Mathematics in Summerville, SC with 4.3%.
What is the Percentage of Population Employed in Computer & Mathematics in Summerville, SC?
Percentage of Population Employed in Computer & Mathematics in Summerville is 3.4%.
What is the Percentage of Population Employed in Computer & Mathematics in South Carolina?
Percentage of Population Employed in Computer & Mathematics in South Carolina is 2.4%.
What is the Percentage of Population Employed in Computer & Mathematics in the United States?
Percentage of Population Employed in Computer & Mathematics in the United States is 3.5%.