Zip Codes with the Highest Percentage of Population Employed in Legal Services & Support in Summerville, SC
RELATED REPORTS & OPTIONS
Legal Services & Support
Summerville
Compare Zip Codes
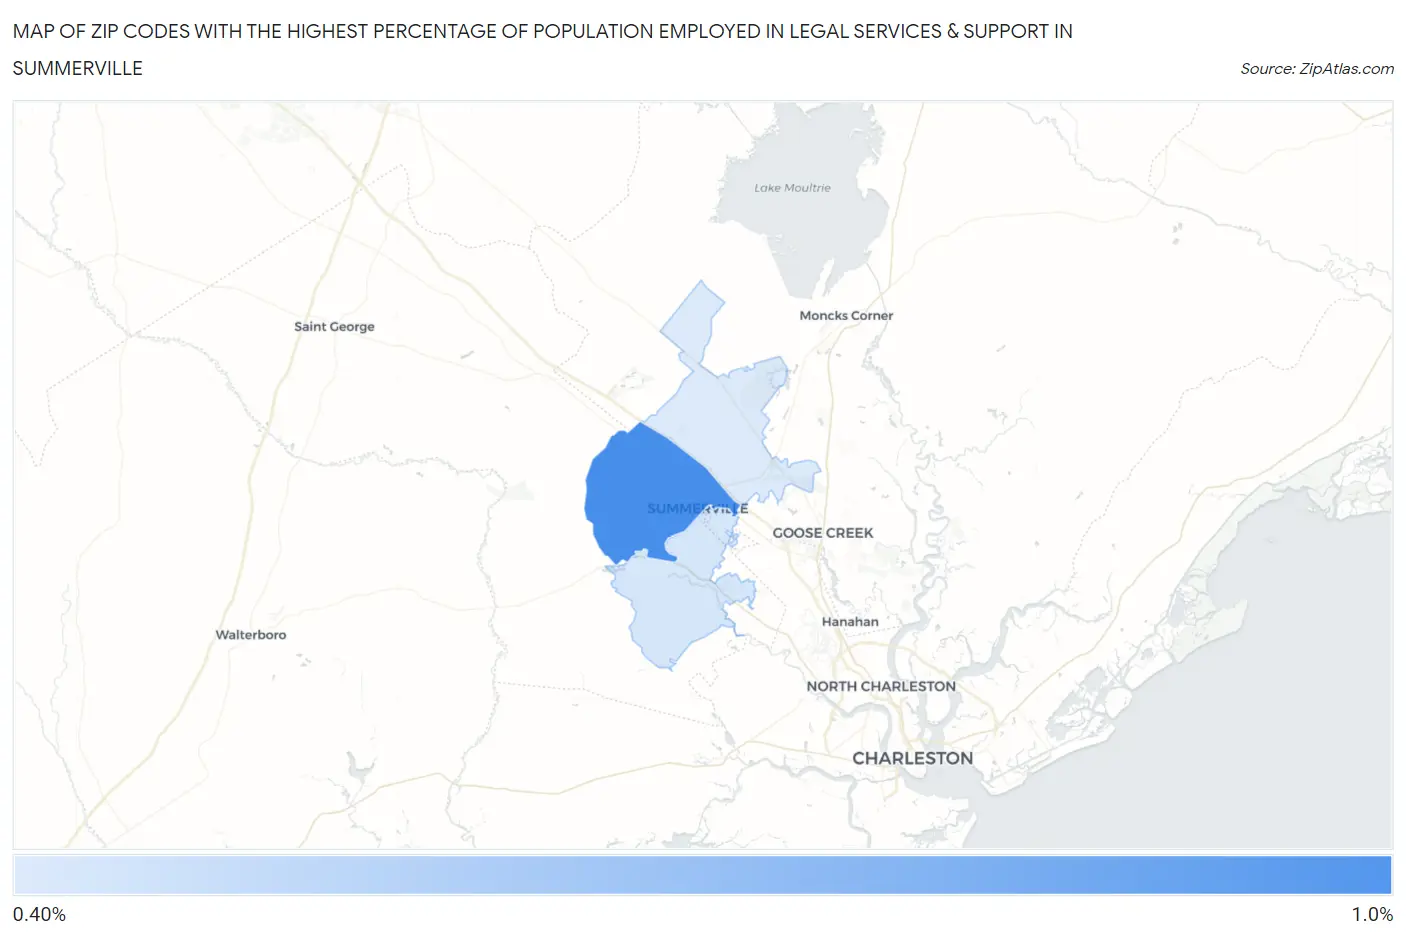
Map of Zip Codes with the Highest Percentage of Population Employed in Legal Services & Support in Summerville
0.45%
0.81%
Zip Codes with the Highest Percentage of Population Employed in Legal Services & Support in Summerville, SC
| Zip Code | % Employed | vs State | vs National | |
| 1. | 29483 | 0.81% | 0.97%(-0.167)#112 | 1.2%(-0.376)#9,381 |
| 2. | 29485 | 0.46% | 0.97%(-0.512)#162 | 1.2%(-0.721)#13,104 |
| 3. | 29486 | 0.45% | 0.97%(-0.529)#168 | 1.2%(-0.738)#13,298 |
1
Common Questions
What are the Top Zip Codes with the Highest Percentage of Population Employed in Legal Services & Support in Summerville, SC?
Top Zip Codes with the Highest Percentage of Population Employed in Legal Services & Support in Summerville, SC are:
What zip code has the Highest Percentage of Population Employed in Legal Services & Support in Summerville, SC?
29483 has the Highest Percentage of Population Employed in Legal Services & Support in Summerville, SC with 0.81%.
What is the Percentage of Population Employed in Legal Services & Support in Summerville, SC?
Percentage of Population Employed in Legal Services & Support in Summerville is 0.97%.
What is the Percentage of Population Employed in Legal Services & Support in South Carolina?
Percentage of Population Employed in Legal Services & Support in South Carolina is 0.97%.
What is the Percentage of Population Employed in Legal Services & Support in the United States?
Percentage of Population Employed in Legal Services & Support in the United States is 1.2%.