Zip Codes with the Highest Percentage of Population with a Degree in Science and Engineering in Summerville, SC
RELATED REPORTS & OPTIONS
Science and Engineering
Summerville
Compare Zip Codes
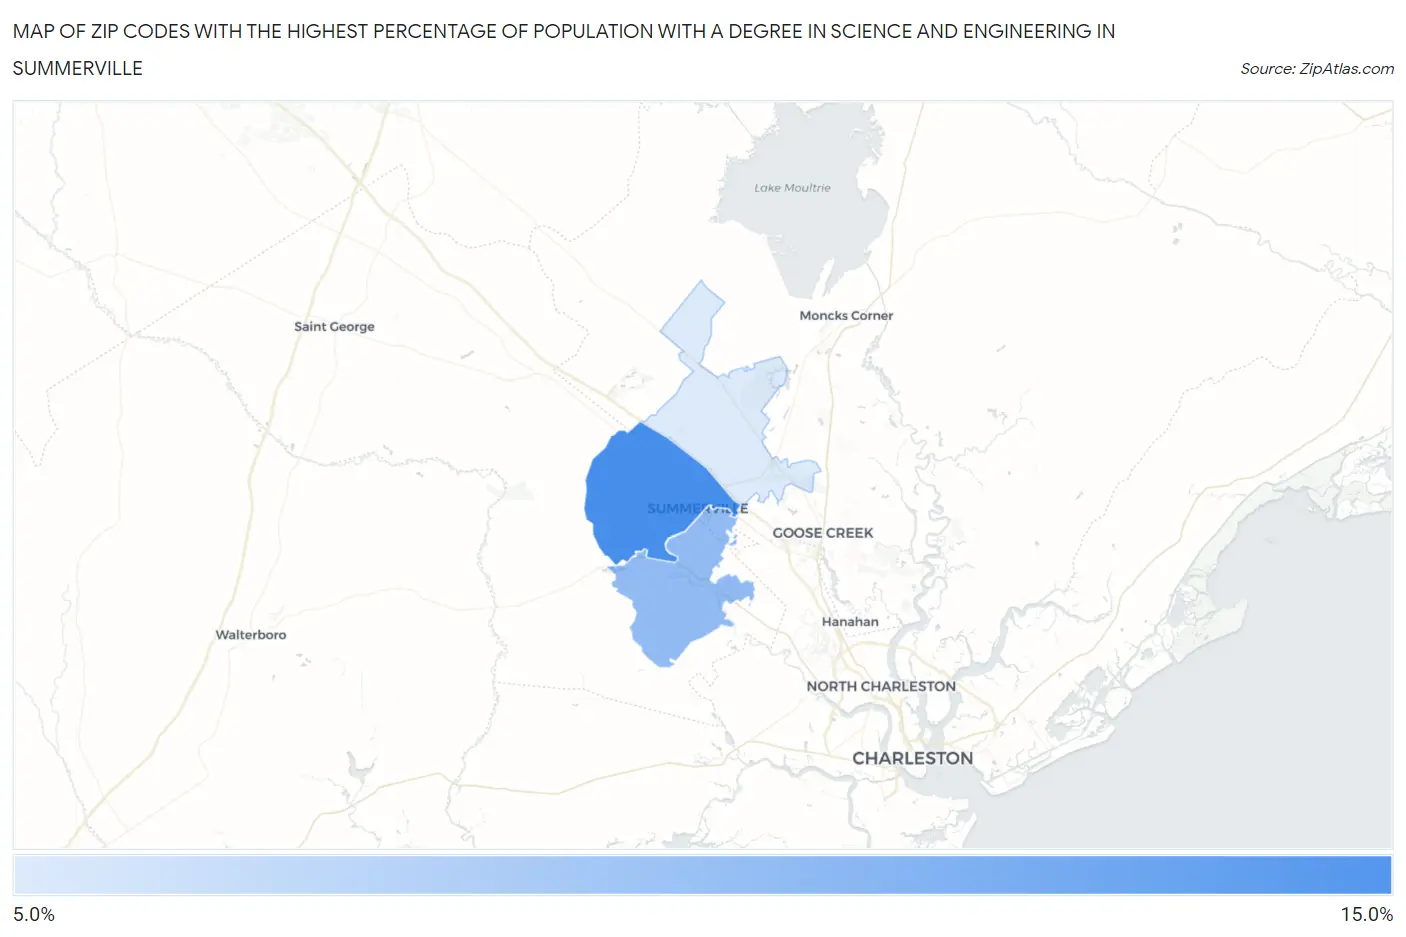
Map of Zip Codes with the Highest Percentage of Population with a Degree in Science and Engineering in Summerville
9.7%
10.9%
Zip Codes with the Highest Percentage of Population with a Degree in Science and Engineering in Summerville, SC
| Zip Code | % Graduates | vs State | vs National | |
| 1. | 29483 | 10.9% | 10.2%(+0.666)#158 | 9.8%(+1.10)#13,126 |
| 2. | 29485 | 10.3% | 10.2%(+0.055)#175 | 9.8%(+0.489)#14,448 |
| 3. | 29486 | 9.7% | 10.2%(-0.560)#193 | 9.8%(-0.126)#15,802 |
1
Common Questions
What are the Top Zip Codes with the Highest Percentage of Population with a Degree in Science and Engineering in Summerville, SC?
Top Zip Codes with the Highest Percentage of Population with a Degree in Science and Engineering in Summerville, SC are:
What zip code has the Highest Percentage of Population with a Degree in Science and Engineering in Summerville, SC?
29483 has the Highest Percentage of Population with a Degree in Science and Engineering in Summerville, SC with 10.9%.
What is the Percentage of Population with a Degree in Science and Engineering in Summerville, SC?
Percentage of Population with a Degree in Science and Engineering in Summerville is 10.7%.
What is the Percentage of Population with a Degree in Science and Engineering in South Carolina?
Percentage of Population with a Degree in Science and Engineering in South Carolina is 10.2%.
What is the Percentage of Population with a Degree in Science and Engineering in the United States?
Percentage of Population with a Degree in Science and Engineering in the United States is 9.8%.