Zip Codes with the Highest Percentage of Population with a Degree in Science and Engineering in Greenwood, SC
RELATED REPORTS & OPTIONS
Science and Engineering
Greenwood
Compare Zip Codes
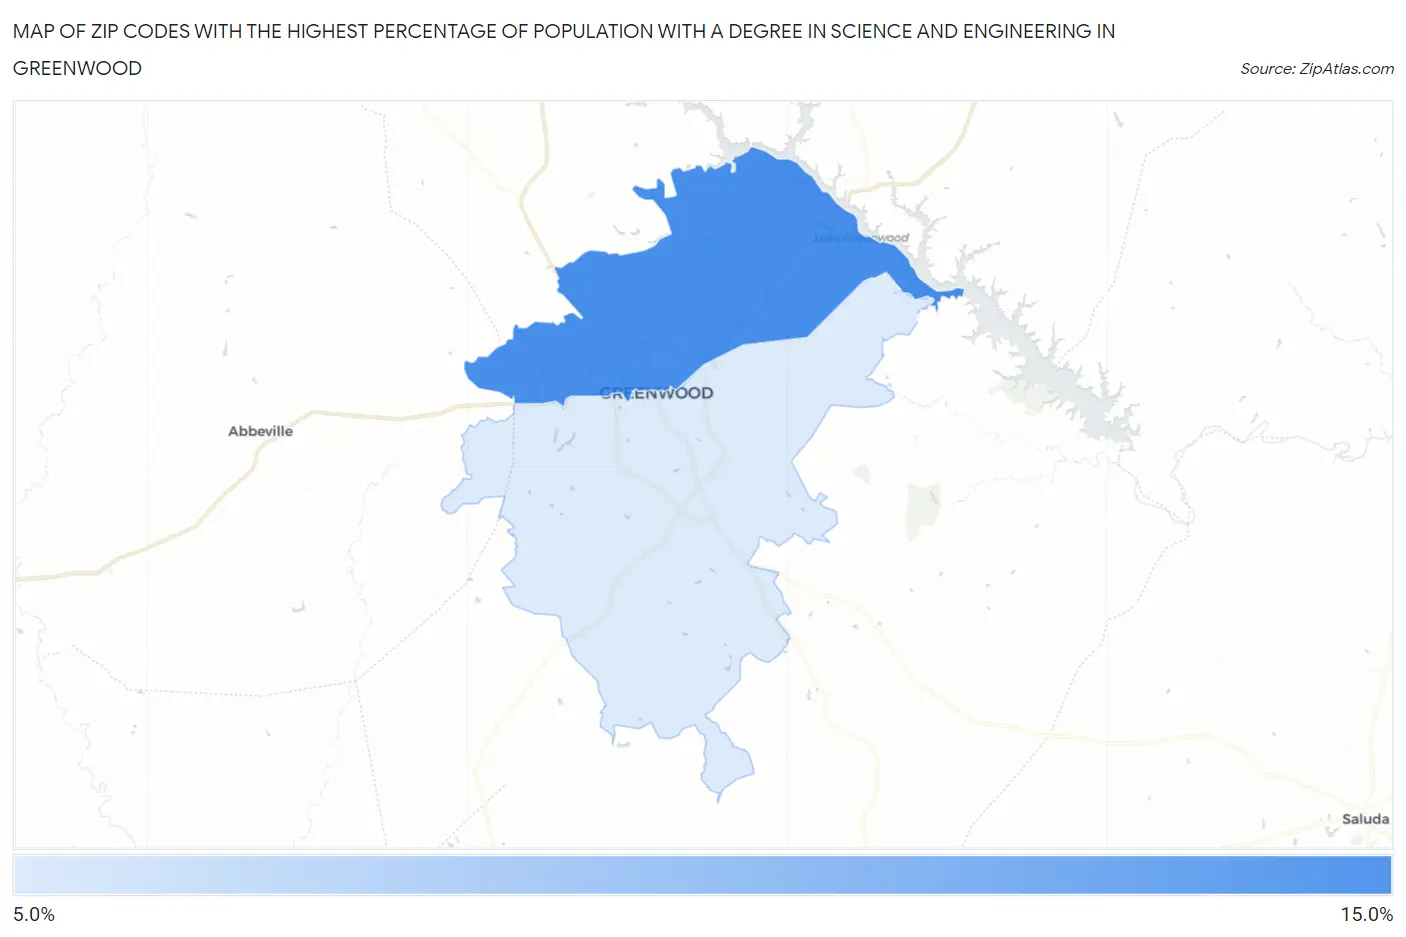
Map of Zip Codes with the Highest Percentage of Population with a Degree in Science and Engineering in Greenwood
7.8%
13.0%
Zip Codes with the Highest Percentage of Population with a Degree in Science and Engineering in Greenwood, SC
| Zip Code | % Graduates | vs State | vs National | |
| 1. | 29649 | 13.0% | 10.2%(+2.74)#113 | 9.8%(+3.17)#9,306 |
| 2. | 29646 | 7.8% | 10.2%(-2.45)#270 | 9.8%(-2.02)#20,159 |
1
Common Questions
What are the Top Zip Codes with the Highest Percentage of Population with a Degree in Science and Engineering in Greenwood, SC?
Top Zip Codes with the Highest Percentage of Population with a Degree in Science and Engineering in Greenwood, SC are:
What zip code has the Highest Percentage of Population with a Degree in Science and Engineering in Greenwood, SC?
29649 has the Highest Percentage of Population with a Degree in Science and Engineering in Greenwood, SC with 13.0%.
What is the Percentage of Population with a Degree in Science and Engineering in Greenwood, SC?
Percentage of Population with a Degree in Science and Engineering in Greenwood is 10.3%.
What is the Percentage of Population with a Degree in Science and Engineering in South Carolina?
Percentage of Population with a Degree in Science and Engineering in South Carolina is 10.2%.
What is the Percentage of Population with a Degree in Science and Engineering in the United States?
Percentage of Population with a Degree in Science and Engineering in the United States is 9.8%.