Assyrian/Chaldean/Syriac vs Immigrants from El Salvador Single Father Poverty
COMPARE
Assyrian/Chaldean/Syriac
Immigrants from El Salvador
Single Father Poverty
Single Father Poverty Comparison
Assyrians/Chaldeans/Syriacs
Immigrants from El Salvador
11.7%
SINGLE FATHER POVERTY
100.0/ 100
METRIC RATING
1st/ 347
METRIC RANK
15.0%
SINGLE FATHER POVERTY
99.9/ 100
METRIC RATING
52nd/ 347
METRIC RANK
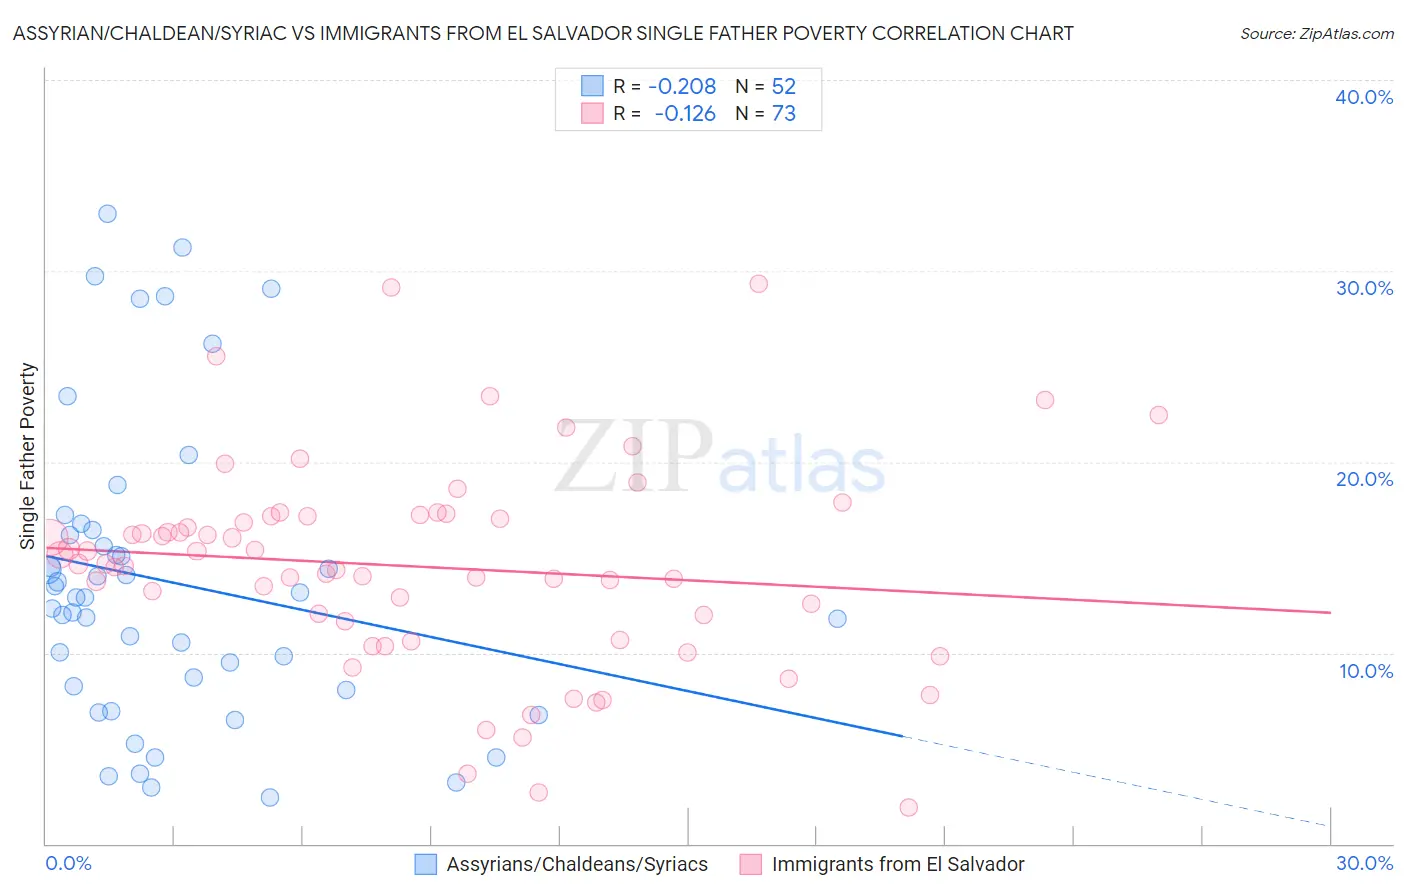
Assyrian/Chaldean/Syriac vs Immigrants from El Salvador Single Father Poverty Correlation Chart
The statistical analysis conducted on geographies consisting of 96,953,976 people shows a weak negative correlation between the proportion of Assyrians/Chaldeans/Syriacs and poverty level among single fathers in the United States with a correlation coefficient (R) of -0.208 and weighted average of 11.7%. Similarly, the statistical analysis conducted on geographies consisting of 292,495,730 people shows a poor negative correlation between the proportion of Immigrants from El Salvador and poverty level among single fathers in the United States with a correlation coefficient (R) of -0.126 and weighted average of 15.0%, a difference of 27.7%.
Single Father Poverty Correlation Summary
| Measurement | Assyrian/Chaldean/Syriac | Immigrants from El Salvador |
| Minimum | 2.4% | 1.9% |
| Maximum | 33.0% | 29.3% |
| Range | 30.5% | 27.4% |
| Mean | 13.7% | 14.5% |
| Median | 12.9% | 14.7% |
| Interquartile 25% (IQ1) | 8.2% | 11.1% |
| Interquartile 75% (IQ3) | 16.3% | 17.2% |
| Interquartile Range (IQR) | 8.1% | 6.0% |
| Standard Deviation (Sample) | 7.8% | 5.4% |
| Standard Deviation (Population) | 7.8% | 5.3% |
Similar Demographics by Single Father Poverty
Demographics Similar to Assyrians/Chaldeans/Syriacs by Single Father Poverty
In terms of single father poverty, the demographic groups most similar to Assyrians/Chaldeans/Syriacs are Tongan (12.2%, a difference of 4.2%), Tsimshian (12.7%, a difference of 8.3%), Immigrants from Fiji (13.2%, a difference of 12.8%), Immigrants from Ethiopia (13.4%, a difference of 14.6%), and Ethiopian (13.5%, a difference of 15.5%).
| Demographics | Rating | Rank | Single Father Poverty |
| Assyrians/Chaldeans/Syriacs | 100.0 /100 | #1 | Exceptional 11.7% |
| Tongans | 100.0 /100 | #2 | Exceptional 12.2% |
| Tsimshian | 100.0 /100 | #3 | Exceptional 12.7% |
| Immigrants | Fiji | 100.0 /100 | #4 | Exceptional 13.2% |
| Immigrants | Ethiopia | 100.0 /100 | #5 | Exceptional 13.4% |
| Ethiopians | 100.0 /100 | #6 | Exceptional 13.5% |
| Immigrants | Taiwan | 100.0 /100 | #7 | Exceptional 13.7% |
| Samoans | 100.0 /100 | #8 | Exceptional 13.8% |
| Afghans | 100.0 /100 | #9 | Exceptional 14.0% |
| Koreans | 100.0 /100 | #10 | Exceptional 14.0% |
| Filipinos | 100.0 /100 | #11 | Exceptional 14.0% |
| Immigrants | India | 100.0 /100 | #12 | Exceptional 14.0% |
| Immigrants | Philippines | 100.0 /100 | #13 | Exceptional 14.0% |
| Immigrants | Vietnam | 100.0 /100 | #14 | Exceptional 14.1% |
| Sri Lankans | 100.0 /100 | #15 | Exceptional 14.2% |
Demographics Similar to Immigrants from El Salvador by Single Father Poverty
In terms of single father poverty, the demographic groups most similar to Immigrants from El Salvador are Immigrants from Pakistan (15.0%, a difference of 0.040%), Immigrants from Kenya (15.0%, a difference of 0.040%), Bhutanese (15.0%, a difference of 0.060%), Immigrants from Eastern Asia (15.0%, a difference of 0.11%), and Immigrants from Uzbekistan (15.0%, a difference of 0.22%).
| Demographics | Rating | Rank | Single Father Poverty |
| Immigrants | Somalia | 100.0 /100 | #45 | Exceptional 14.9% |
| Immigrants | Cambodia | 99.9 /100 | #46 | Exceptional 14.9% |
| Immigrants | China | 99.9 /100 | #47 | Exceptional 14.9% |
| Malaysians | 99.9 /100 | #48 | Exceptional 14.9% |
| Immigrants | Eastern Asia | 99.9 /100 | #49 | Exceptional 15.0% |
| Bhutanese | 99.9 /100 | #50 | Exceptional 15.0% |
| Immigrants | Pakistan | 99.9 /100 | #51 | Exceptional 15.0% |
| Immigrants | El Salvador | 99.9 /100 | #52 | Exceptional 15.0% |
| Immigrants | Kenya | 99.9 /100 | #53 | Exceptional 15.0% |
| Immigrants | Uzbekistan | 99.9 /100 | #54 | Exceptional 15.0% |
| Immigrants | Bulgaria | 99.9 /100 | #55 | Exceptional 15.0% |
| Immigrants | Laos | 99.9 /100 | #56 | Exceptional 15.1% |
| Laotians | 99.9 /100 | #57 | Exceptional 15.1% |
| Hawaiians | 99.9 /100 | #58 | Exceptional 15.1% |
| Guamanians/Chamorros | 99.9 /100 | #59 | Exceptional 15.1% |