Assyrian/Chaldean/Syriac vs Immigrants from Cameroon Single Father Poverty
COMPARE
Assyrian/Chaldean/Syriac
Immigrants from Cameroon
Single Father Poverty
Single Father Poverty Comparison
Assyrians/Chaldeans/Syriacs
Immigrants from Cameroon
11.7%
SINGLE FATHER POVERTY
100.0/ 100
METRIC RATING
1st/ 347
METRIC RANK
15.2%
SINGLE FATHER POVERTY
99.7/ 100
METRIC RATING
68th/ 347
METRIC RANK
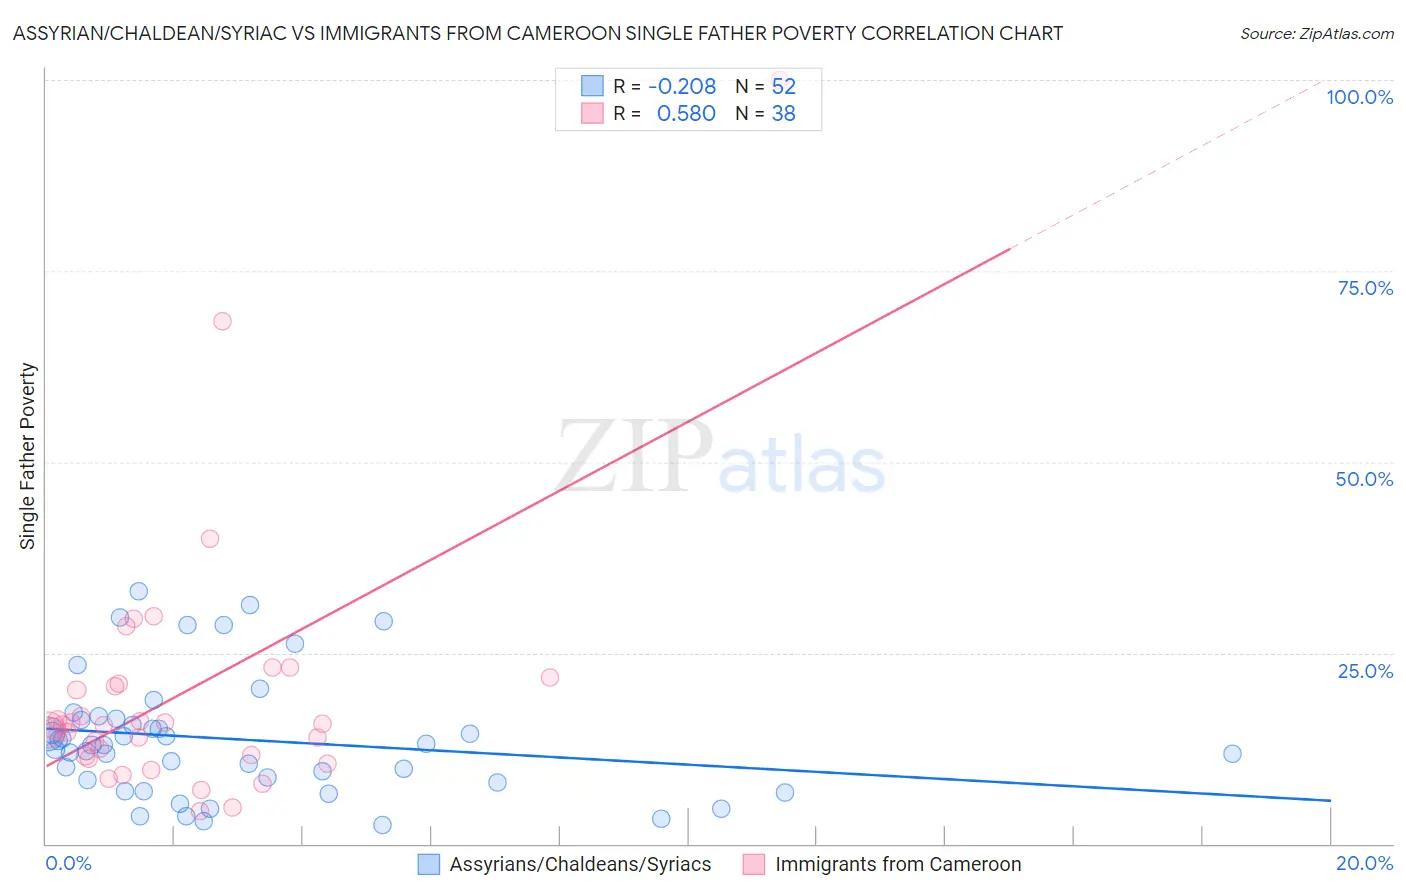
Assyrian/Chaldean/Syriac vs Immigrants from Cameroon Single Father Poverty Correlation Chart
The statistical analysis conducted on geographies consisting of 96,953,976 people shows a weak negative correlation between the proportion of Assyrians/Chaldeans/Syriacs and poverty level among single fathers in the United States with a correlation coefficient (R) of -0.208 and weighted average of 11.7%. Similarly, the statistical analysis conducted on geographies consisting of 118,461,150 people shows a substantial positive correlation between the proportion of Immigrants from Cameroon and poverty level among single fathers in the United States with a correlation coefficient (R) of 0.580 and weighted average of 15.2%, a difference of 29.9%.
Single Father Poverty Correlation Summary
| Measurement | Assyrian/Chaldean/Syriac | Immigrants from Cameroon |
| Minimum | 2.4% | 4.2% |
| Maximum | 33.0% | 100.0% |
| Range | 30.5% | 95.8% |
| Mean | 13.7% | 19.7% |
| Median | 12.9% | 15.6% |
| Interquartile 25% (IQ1) | 8.2% | 11.5% |
| Interquartile 75% (IQ3) | 16.3% | 20.9% |
| Interquartile Range (IQR) | 8.1% | 9.4% |
| Standard Deviation (Sample) | 7.8% | 17.5% |
| Standard Deviation (Population) | 7.8% | 17.2% |
Similar Demographics by Single Father Poverty
Demographics Similar to Assyrians/Chaldeans/Syriacs by Single Father Poverty
In terms of single father poverty, the demographic groups most similar to Assyrians/Chaldeans/Syriacs are Tongan (12.2%, a difference of 4.2%), Tsimshian (12.7%, a difference of 8.3%), Immigrants from Fiji (13.2%, a difference of 12.8%), Immigrants from Ethiopia (13.4%, a difference of 14.6%), and Ethiopian (13.5%, a difference of 15.5%).
| Demographics | Rating | Rank | Single Father Poverty |
| Assyrians/Chaldeans/Syriacs | 100.0 /100 | #1 | Exceptional 11.7% |
| Tongans | 100.0 /100 | #2 | Exceptional 12.2% |
| Tsimshian | 100.0 /100 | #3 | Exceptional 12.7% |
| Immigrants | Fiji | 100.0 /100 | #4 | Exceptional 13.2% |
| Immigrants | Ethiopia | 100.0 /100 | #5 | Exceptional 13.4% |
| Ethiopians | 100.0 /100 | #6 | Exceptional 13.5% |
| Immigrants | Taiwan | 100.0 /100 | #7 | Exceptional 13.7% |
| Samoans | 100.0 /100 | #8 | Exceptional 13.8% |
| Afghans | 100.0 /100 | #9 | Exceptional 14.0% |
| Koreans | 100.0 /100 | #10 | Exceptional 14.0% |
| Filipinos | 100.0 /100 | #11 | Exceptional 14.0% |
| Immigrants | India | 100.0 /100 | #12 | Exceptional 14.0% |
| Immigrants | Philippines | 100.0 /100 | #13 | Exceptional 14.0% |
| Immigrants | Vietnam | 100.0 /100 | #14 | Exceptional 14.1% |
| Sri Lankans | 100.0 /100 | #15 | Exceptional 14.2% |
Demographics Similar to Immigrants from Cameroon by Single Father Poverty
In terms of single father poverty, the demographic groups most similar to Immigrants from Cameroon are Japanese (15.2%, a difference of 0.030%), Paraguayan (15.2%, a difference of 0.090%), Mongolian (15.3%, a difference of 0.13%), Immigrants from Moldova (15.2%, a difference of 0.18%), and Immigrants from Malaysia (15.2%, a difference of 0.20%).
| Demographics | Rating | Rank | Single Father Poverty |
| Immigrants | Bosnia and Herzegovina | 99.8 /100 | #61 | Exceptional 15.2% |
| Immigrants | Armenia | 99.8 /100 | #62 | Exceptional 15.2% |
| Immigrants | Sweden | 99.8 /100 | #63 | Exceptional 15.2% |
| Bangladeshis | 99.8 /100 | #64 | Exceptional 15.2% |
| Immigrants | Malaysia | 99.8 /100 | #65 | Exceptional 15.2% |
| Immigrants | Moldova | 99.8 /100 | #66 | Exceptional 15.2% |
| Paraguayans | 99.7 /100 | #67 | Exceptional 15.2% |
| Immigrants | Cameroon | 99.7 /100 | #68 | Exceptional 15.2% |
| Japanese | 99.7 /100 | #69 | Exceptional 15.2% |
| Mongolians | 99.7 /100 | #70 | Exceptional 15.3% |
| Immigrants | Brazil | 99.6 /100 | #71 | Exceptional 15.3% |
| Immigrants | Lithuania | 99.6 /100 | #72 | Exceptional 15.3% |
| Kenyans | 99.6 /100 | #73 | Exceptional 15.3% |
| Maltese | 99.6 /100 | #74 | Exceptional 15.3% |
| Immigrants | Turkey | 99.5 /100 | #75 | Exceptional 15.3% |