White/Caucasian Single Father Poverty
COMPARE
White/Caucasian
Select to Compare
Single Father Poverty
White/Caucasian Single Father Poverty
18.4%
POVERTY | SINGLE FATHERS
0.0/ 100
METRIC RATING
299th/ 347
METRIC RANK
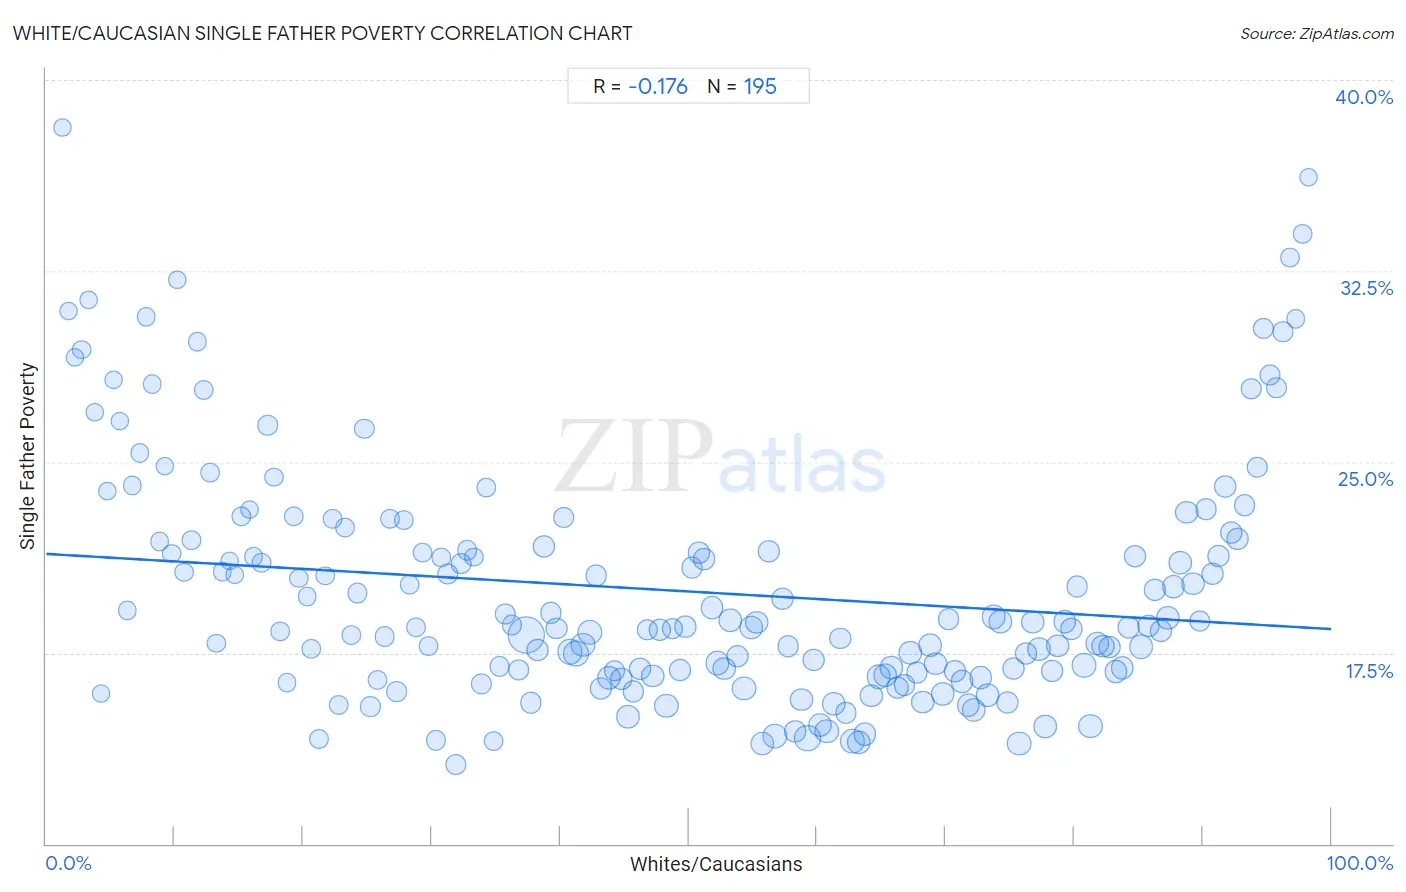
White/Caucasian Single Father Poverty Correlation Chart
The statistical analysis conducted on geographies consisting of 414,032,364 people shows a poor negative correlation between the proportion of Whites/Caucasians and poverty level among single fathers in the United States with a correlation coefficient (R) of -0.176 and weighted average of 18.4%. On average, for every 1% (one percent) increase in Whites/Caucasians within a typical geography, there is a decrease of 0.030% in poverty level among single fathers.
It is essential to understand that the correlation between the percentage of Whites/Caucasians and poverty level among single fathers does not imply a direct cause-and-effect relationship. It remains uncertain whether the presence of Whites/Caucasians influences an upward or downward trend in the level of poverty level among single fathers within an area, or if Whites/Caucasians simply ended up residing in those areas with higher or lower levels of poverty level among single fathers due to other factors.
Demographics Similar to Whites/Caucasians by Single Father Poverty
In terms of single father poverty, the demographic groups most similar to Whites/Caucasians are African (18.3%, a difference of 0.21%), Immigrants from Dominican Republic (18.4%, a difference of 0.32%), Hungarian (18.5%, a difference of 0.53%), Comanche (18.5%, a difference of 0.64%), and Celtic (18.5%, a difference of 0.68%).
| Demographics | Rating | Rank | Single Father Poverty |
| Immigrants from Bahamas | 0.0 /100 | #292 | Tragic 18.1% |
| Alaska Natives | 0.0 /100 | #293 | Tragic 18.1% |
| U.S. Virgin Islanders | 0.0 /100 | #294 | Tragic 18.1% |
| Yakama | 0.0 /100 | #295 | Tragic 18.1% |
| Seminole | 0.0 /100 | #296 | Tragic 18.1% |
| French | 0.0 /100 | #297 | Tragic 18.2% |
| Africans | 0.0 /100 | #298 | Tragic 18.3% |
| Whites/Caucasians | 0.0 /100 | #299 | Tragic 18.4% |
| Immigrants from Dominican Republic | 0.0 /100 | #300 | Tragic 18.4% |
| Hungarians | 0.0 /100 | #301 | Tragic 18.5% |
| Comanche | 0.0 /100 | #302 | Tragic 18.5% |
| Celtics | 0.0 /100 | #303 | Tragic 18.5% |
| Ute | 0.0 /100 | #304 | Tragic 18.5% |
| Blackfeet | 0.0 /100 | #305 | Tragic 18.5% |
| Scotch-Irish | 0.0 /100 | #306 | Tragic 18.6% |
White/Caucasian Single Father Poverty Correlation Summary
| Measurement | White/Caucasian Data | Single Father Poverty Data |
| Minimum | 1.3% | 13.1% |
| Maximum | 98.3% | 38.1% |
| Range | 97.0% | 25.0% |
| Mean | 49.8% | 19.9% |
| Median | 49.7% | 18.5% |
| Interquartile 25% (IQ1) | 25.2% | 16.7% |
| Interquartile 75% (IQ3) | 74.2% | 21.7% |
| Interquartile Range (IQR) | 49.0% | 5.0% |
| Standard Deviation (Sample) | 28.2% | 4.7% |
| Standard Deviation (Population) | 28.1% | 4.7% |
Correlation Details
| White/Caucasian Percentile | Sample Size | Single Father Poverty |
[ 1.0% - 1.5% ] 1.27% | 142,531 | 38.1% |
[ 1.5% - 2.0% ] 1.77% | 411,178 | 30.9% |
[ 2.0% - 2.5% ] 2.20% | 289,082 | 29.1% |
[ 2.5% - 3.0% ] 2.77% | 499,328 | 29.4% |
[ 3.0% - 3.5% ] 3.27% | 300,020 | 31.3% |
[ 3.5% - 4.0% ] 3.80% | 428,695 | 27.0% |
[ 4.0% - 4.5% ] 4.25% | 372,880 | 15.9% |
[ 4.5% - 5.0% ] 4.77% | 348,900 | 23.8% |
[ 5.0% - 5.5% ] 5.22% | 364,700 | 28.2% |
[ 5.5% - 6.0% ] 5.75% | 330,056 | 26.6% |
[ 6.0% - 6.5% ] 6.28% | 402,085 | 19.2% |
[ 6.5% - 7.0% ] 6.67% | 367,439 | 24.1% |
[ 7.0% - 7.5% ] 7.30% | 347,294 | 25.4% |
[ 7.5% - 8.0% ] 7.81% | 228,490 | 30.7% |
[ 8.0% - 8.5% ] 8.25% | 485,160 | 28.1% |
[ 8.5% - 9.0% ] 8.81% | 605,836 | 21.9% |
[ 9.0% - 9.5% ] 9.25% | 353,378 | 24.8% |
[ 9.5% - 10.0% ] 9.76% | 428,946 | 21.4% |
[ 10.0% - 10.5% ] 10.22% | 393,951 | 32.2% |
[ 10.5% - 11.0% ] 10.72% | 466,392 | 20.7% |
[ 11.0% - 11.5% ] 11.28% | 695,035 | 21.9% |
[ 11.5% - 12.0% ] 11.78% | 357,985 | 29.7% |
[ 12.0% - 12.5% ] 12.23% | 999,914 | 27.8% |
[ 12.5% - 13.0% ] 12.75% | 840,465 | 24.6% |
[ 13.0% - 13.5% ] 13.27% | 744,875 | 17.9% |
[ 13.5% - 14.0% ] 13.70% | 403,113 | 20.7% |
[ 14.0% - 14.5% ] 14.26% | 600,647 | 21.1% |
[ 14.5% - 15.0% ] 14.71% | 405,915 | 20.6% |
[ 15.0% - 15.5% ] 15.16% | 809,585 | 22.9% |
[ 15.5% - 16.0% ] 15.81% | 687,631 | 23.1% |
[ 16.0% - 16.5% ] 16.15% | 462,143 | 21.3% |
[ 16.5% - 17.0% ] 16.75% | 581,943 | 21.0% |
[ 17.0% - 17.5% ] 17.24% | 1,481,309 | 26.4% |
[ 17.5% - 18.0% ] 17.74% | 588,229 | 24.4% |
[ 18.0% - 18.5% ] 18.21% | 794,386 | 18.3% |
[ 18.5% - 19.0% ] 18.74% | 769,154 | 16.3% |
[ 19.0% - 19.5% ] 19.27% | 911,987 | 22.9% |
[ 19.5% - 20.0% ] 19.67% | 776,965 | 20.4% |
[ 20.0% - 20.5% ] 20.31% | 592,172 | 19.7% |
[ 20.5% - 21.0% ] 20.66% | 892,046 | 17.7% |
[ 21.0% - 21.5% ] 21.23% | 654,156 | 14.1% |
[ 21.5% - 22.0% ] 21.70% | 634,265 | 20.5% |
[ 22.0% - 22.5% ] 22.32% | 877,831 | 22.8% |
[ 22.5% - 23.0% ] 22.72% | 1,012,031 | 15.5% |
[ 23.0% - 23.5% ] 23.21% | 938,507 | 22.4% |
[ 23.5% - 24.0% ] 23.73% | 829,932 | 18.2% |
[ 24.0% - 24.5% ] 24.24% | 1,056,008 | 19.8% |
[ 24.5% - 25.0% ] 24.75% | 1,008,451 | 26.3% |
[ 25.0% - 25.5% ] 25.22% | 1,245,186 | 15.4% |
[ 25.5% - 26.0% ] 25.74% | 1,039,628 | 16.4% |
[ 26.0% - 26.5% ] 26.33% | 1,405,188 | 18.1% |
[ 26.5% - 27.0% ] 26.76% | 892,769 | 22.8% |
[ 27.0% - 27.5% ] 27.28% | 1,266,977 | 16.0% |
[ 27.5% - 28.0% ] 27.83% | 844,768 | 22.7% |
[ 28.0% - 28.5% ] 28.29% | 1,391,640 | 20.2% |
[ 28.5% - 29.0% ] 28.78% | 1,211,701 | 18.5% |
[ 29.0% - 29.5% ] 29.28% | 803,374 | 21.4% |
[ 29.5% - 30.0% ] 29.75% | 1,208,995 | 17.8% |
[ 30.0% - 30.5% ] 30.34% | 1,315,946 | 14.1% |
[ 30.5% - 31.0% ] 30.75% | 942,679 | 21.3% |
[ 31.0% - 31.5% ] 31.25% | 1,505,240 | 20.6% |
[ 31.5% - 32.0% ] 31.88% | 2,278,670 | 13.1% |
[ 32.0% - 32.5% ] 32.30% | 1,963,824 | 21.0% |
[ 32.5% - 33.0% ] 32.77% | 1,414,177 | 21.5% |
[ 33.0% - 33.5% ] 33.26% | 751,246 | 21.3% |
[ 33.5% - 34.0% ] 33.83% | 1,582,337 | 16.3% |
[ 34.0% - 34.5% ] 34.27% | 882,230 | 24.0% |
[ 34.5% - 35.0% ] 34.79% | 1,206,324 | 14.0% |
[ 35.0% - 35.5% ] 35.28% | 1,557,202 | 17.0% |
[ 35.5% - 36.0% ] 35.73% | 1,431,899 | 19.0% |
[ 36.0% - 36.5% ] 36.24% | 1,695,058 | 18.6% |
[ 36.5% - 37.0% ] 36.75% | 1,872,020 | 16.8% |
[ 37.0% - 37.5% ] 37.38% | 12,309,546 | 18.2% |
[ 37.5% - 38.0% ] 37.71% | 2,248,104 | 15.5% |
[ 38.0% - 38.5% ] 38.24% | 2,525,513 | 17.6% |
[ 38.5% - 39.0% ] 38.71% | 2,356,194 | 21.7% |
[ 39.0% - 39.5% ] 39.29% | 2,146,750 | 19.1% |
[ 39.5% - 40.0% ] 39.71% | 2,168,999 | 18.5% |
[ 40.0% - 40.5% ] 40.23% | 1,749,389 | 22.8% |
[ 40.5% - 41.0% ] 40.77% | 4,375,952 | 17.5% |
[ 41.0% - 41.5% ] 41.21% | 5,292,438 | 17.5% |
[ 41.5% - 42.0% ] 41.78% | 3,580,501 | 17.8% |
[ 42.0% - 42.5% ] 42.33% | 4,468,522 | 18.3% |
[ 42.5% - 43.0% ] 42.76% | 1,889,550 | 20.5% |
[ 43.0% - 43.5% ] 43.18% | 2,989,835 | 16.1% |
[ 43.5% - 44.0% ] 43.80% | 3,016,993 | 16.5% |
[ 44.0% - 44.5% ] 44.24% | 2,359,033 | 16.8% |
[ 44.5% - 45.0% ] 44.74% | 2,442,548 | 16.5% |
[ 45.0% - 45.5% ] 45.27% | 2,765,580 | 15.0% |
[ 45.5% - 46.0% ] 45.70% | 2,310,864 | 16.0% |
[ 46.0% - 46.5% ] 46.21% | 2,526,016 | 16.9% |
[ 46.5% - 47.0% ] 46.75% | 2,014,554 | 18.4% |
[ 47.0% - 47.5% ] 47.20% | 3,039,679 | 16.6% |
[ 47.5% - 48.0% ] 47.75% | 2,860,289 | 18.4% |
[ 48.0% - 48.5% ] 48.23% | 3,980,805 | 15.4% |
[ 48.5% - 49.0% ] 48.72% | 1,881,266 | 18.4% |
[ 49.0% - 49.5% ] 49.29% | 2,567,253 | 16.8% |
[ 49.5% - 50.0% ] 49.73% | 2,081,859 | 18.5% |
[ 50.0% - 50.5% ] 50.26% | 2,401,511 | 20.9% |
[ 50.5% - 51.0% ] 50.77% | 2,359,753 | 21.4% |
[ 51.0% - 51.5% ] 51.21% | 2,153,815 | 21.2% |
[ 51.5% - 52.0% ] 51.80% | 3,222,207 | 19.3% |
[ 52.0% - 52.5% ] 52.20% | 3,478,349 | 17.1% |
[ 52.5% - 53.0% ] 52.76% | 2,794,089 | 16.9% |
[ 53.0% - 53.5% ] 53.23% | 3,038,465 | 18.8% |
[ 53.5% - 54.0% ] 53.78% | 2,614,208 | 17.4% |
[ 54.0% - 54.5% ] 54.33% | 3,774,991 | 16.1% |
[ 54.5% - 55.0% ] 54.83% | 3,408,839 | 18.5% |
[ 55.0% - 55.5% ] 55.29% | 2,731,806 | 18.7% |
[ 55.5% - 56.0% ] 55.75% | 3,634,210 | 13.9% |
[ 56.0% - 56.5% ] 56.23% | 2,476,983 | 21.5% |
[ 56.5% - 57.0% ] 56.70% | 4,343,075 | 14.2% |
[ 57.0% - 57.5% ] 57.25% | 2,611,417 | 19.6% |
[ 57.5% - 58.0% ] 57.74% | 2,548,080 | 17.8% |
[ 58.0% - 58.5% ] 58.26% | 2,360,846 | 14.4% |
[ 58.5% - 59.0% ] 58.75% | 3,085,247 | 15.7% |
[ 59.0% - 59.5% ] 59.26% | 5,781,515 | 14.1% |
[ 59.5% - 60.0% ] 59.74% | 2,699,751 | 17.2% |
[ 60.0% - 60.5% ] 60.23% | 3,353,986 | 14.7% |
[ 60.5% - 61.0% ] 60.74% | 3,471,398 | 14.4% |
[ 61.0% - 61.5% ] 61.33% | 3,325,242 | 15.5% |
[ 61.5% - 62.0% ] 61.77% | 2,239,558 | 18.1% |
[ 62.0% - 62.5% ] 62.22% | 2,119,889 | 15.1% |
[ 62.5% - 63.0% ] 62.76% | 4,303,439 | 14.0% |
[ 63.0% - 63.5% ] 63.23% | 3,393,989 | 14.0% |
[ 63.5% - 64.0% ] 63.71% | 2,838,704 | 14.3% |
[ 64.0% - 64.5% ] 64.23% | 3,250,889 | 15.8% |
[ 64.5% - 65.0% ] 64.76% | 3,518,426 | 16.6% |
[ 65.0% - 65.5% ] 65.30% | 3,140,471 | 16.6% |
[ 65.5% - 66.0% ] 65.74% | 3,285,052 | 16.9% |
[ 66.0% - 66.5% ] 66.26% | 2,473,286 | 16.1% |
[ 66.5% - 67.0% ] 66.79% | 2,428,905 | 16.2% |
[ 67.0% - 67.5% ] 67.26% | 2,987,906 | 17.5% |
[ 67.5% - 68.0% ] 67.75% | 2,460,832 | 16.7% |
[ 68.0% - 68.5% ] 68.21% | 3,106,280 | 15.6% |
[ 68.5% - 69.0% ] 68.77% | 3,182,120 | 17.8% |
[ 69.0% - 69.5% ] 69.21% | 2,631,678 | 17.1% |
[ 69.5% - 70.0% ] 69.76% | 3,144,378 | 15.9% |
[ 70.0% - 70.5% ] 70.25% | 2,036,379 | 18.8% |
[ 70.5% - 71.0% ] 70.74% | 2,603,039 | 16.8% |
[ 71.0% - 71.5% ] 71.28% | 3,145,590 | 16.4% |
[ 71.5% - 72.0% ] 71.75% | 3,167,533 | 15.4% |
[ 72.0% - 72.5% ] 72.19% | 3,425,538 | 15.2% |
[ 72.5% - 73.0% ] 72.72% | 3,276,958 | 16.5% |
[ 73.0% - 73.5% ] 73.26% | 3,126,124 | 15.8% |
[ 73.5% - 74.0% ] 73.73% | 3,427,700 | 18.9% |
[ 74.0% - 74.5% ] 74.24% | 2,911,022 | 18.7% |
[ 74.5% - 75.0% ] 74.77% | 2,641,270 | 15.5% |
[ 75.0% - 75.5% ] 75.27% | 2,896,112 | 16.9% |
[ 75.5% - 76.0% ] 75.73% | 3,634,729 | 13.9% |
[ 76.0% - 76.5% ] 76.25% | 2,885,616 | 17.5% |
[ 76.5% - 77.0% ] 76.75% | 3,027,662 | 18.7% |
[ 77.0% - 77.5% ] 77.25% | 2,951,269 | 17.7% |
[ 77.5% - 78.0% ] 77.75% | 3,079,864 | 14.6% |
[ 78.0% - 78.5% ] 78.26% | 3,033,854 | 16.8% |
[ 78.5% - 79.0% ] 78.74% | 3,153,699 | 17.8% |
[ 79.0% - 79.5% ] 79.25% | 2,893,766 | 18.7% |
[ 79.5% - 80.0% ] 79.76% | 2,407,195 | 18.4% |
[ 80.0% - 80.5% ] 80.24% | 2,231,716 | 20.1% |
[ 80.5% - 81.0% ] 80.76% | 3,850,238 | 17.0% |
[ 81.0% - 81.5% ] 81.26% | 3,562,971 | 14.6% |
[ 81.5% - 82.0% ] 81.78% | 3,686,969 | 17.9% |
[ 82.0% - 82.5% ] 82.24% | 2,785,390 | 17.8% |
[ 82.5% - 83.0% ] 82.76% | 3,109,376 | 17.7% |
[ 83.0% - 83.5% ] 83.25% | 3,032,024 | 16.8% |
[ 83.5% - 84.0% ] 83.75% | 2,875,007 | 16.9% |
[ 84.0% - 84.5% ] 84.25% | 2,701,665 | 18.5% |
[ 84.5% - 85.0% ] 84.77% | 2,581,362 | 21.3% |
[ 85.0% - 85.5% ] 85.24% | 3,588,810 | 17.7% |
[ 85.5% - 86.0% ] 85.77% | 3,014,560 | 18.6% |
[ 86.0% - 86.5% ] 86.25% | 2,786,696 | 20.0% |
[ 86.5% - 87.0% ] 86.74% | 3,004,183 | 18.4% |
[ 87.0% - 87.5% ] 87.26% | 2,939,231 | 18.9% |
[ 87.5% - 88.0% ] 87.75% | 2,880,073 | 20.1% |
[ 88.0% - 88.5% ] 88.26% | 3,082,839 | 21.0% |
[ 88.5% - 89.0% ] 88.75% | 2,803,426 | 23.0% |
[ 89.0% - 89.5% ] 89.24% | 2,651,222 | 20.2% |
[ 89.5% - 90.0% ] 89.75% | 2,021,943 | 18.7% |
[ 90.0% - 90.5% ] 90.26% | 2,016,628 | 23.1% |
[ 90.5% - 91.0% ] 90.77% | 2,557,186 | 20.6% |
[ 91.0% - 91.5% ] 91.25% | 2,894,838 | 21.3% |
[ 91.5% - 92.0% ] 91.74% | 2,250,895 | 24.0% |
[ 92.0% - 92.5% ] 92.26% | 2,531,186 | 22.2% |
[ 92.5% - 93.0% ] 92.75% | 2,438,690 | 22.0% |
[ 93.0% - 93.5% ] 93.25% | 2,268,098 | 23.3% |
[ 93.5% - 94.0% ] 93.74% | 1,782,571 | 27.9% |
[ 94.0% - 94.5% ] 94.26% | 2,070,882 | 24.8% |
[ 94.5% - 95.0% ] 94.74% | 2,173,106 | 30.2% |
[ 95.0% - 95.5% ] 95.26% | 1,755,517 | 28.4% |
[ 95.5% - 96.0% ] 95.77% | 1,448,104 | 27.9% |
[ 96.0% - 96.5% ] 96.25% | 1,150,590 | 30.1% |
[ 96.5% - 97.0% ] 96.75% | 905,548 | 33.0% |
[ 97.0% - 97.5% ] 97.23% | 837,616 | 30.6% |
[ 97.5% - 98.0% ] 97.73% | 805,224 | 34.0% |
[ 98.0% - 98.5% ] 98.25% | 425,349 | 36.2% |