Assyrian/Chaldean/Syriac vs Immigrants from North Macedonia Single Father Poverty
COMPARE
Assyrian/Chaldean/Syriac
Immigrants from North Macedonia
Single Father Poverty
Single Father Poverty Comparison
Assyrians/Chaldeans/Syriacs
Immigrants from North Macedonia
11.7%
SINGLE FATHER POVERTY
100.0/ 100
METRIC RATING
1st/ 347
METRIC RANK
17.9%
SINGLE FATHER POVERTY
0.0/ 100
METRIC RATING
286th/ 347
METRIC RANK
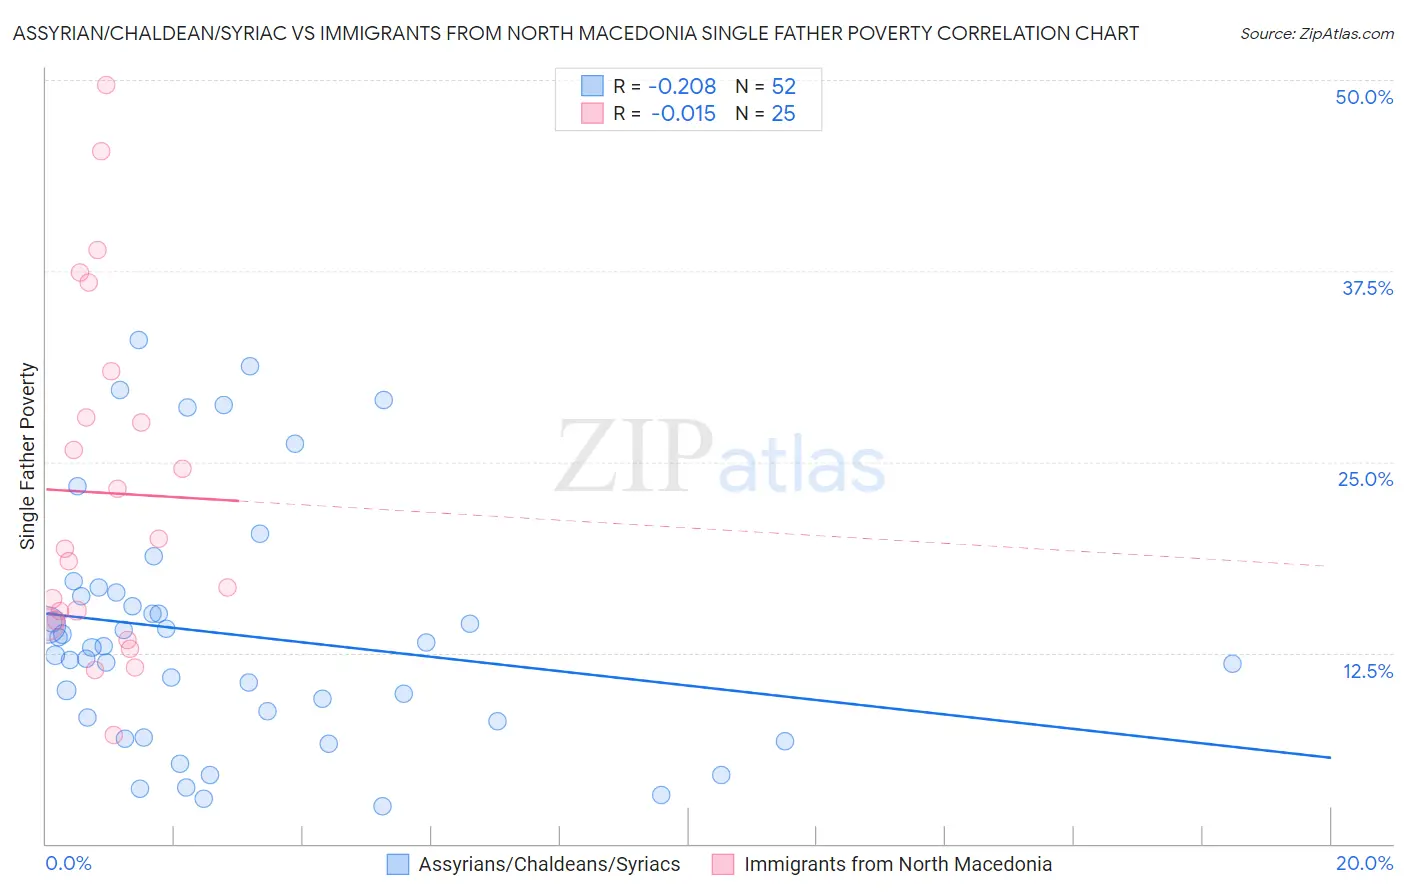
Assyrian/Chaldean/Syriac vs Immigrants from North Macedonia Single Father Poverty Correlation Chart
The statistical analysis conducted on geographies consisting of 96,953,976 people shows a weak negative correlation between the proportion of Assyrians/Chaldeans/Syriacs and poverty level among single fathers in the United States with a correlation coefficient (R) of -0.208 and weighted average of 11.7%. Similarly, the statistical analysis conducted on geographies consisting of 65,204,585 people shows no correlation between the proportion of Immigrants from North Macedonia and poverty level among single fathers in the United States with a correlation coefficient (R) of -0.015 and weighted average of 17.9%, a difference of 52.8%.
Single Father Poverty Correlation Summary
| Measurement | Assyrian/Chaldean/Syriac | Immigrants from North Macedonia |
| Minimum | 2.4% | 7.1% |
| Maximum | 33.0% | 49.6% |
| Range | 30.5% | 42.5% |
| Mean | 13.7% | 23.0% |
| Median | 12.9% | 19.3% |
| Interquartile 25% (IQ1) | 8.2% | 14.5% |
| Interquartile 75% (IQ3) | 16.3% | 29.4% |
| Interquartile Range (IQR) | 8.1% | 14.9% |
| Standard Deviation (Sample) | 7.8% | 11.3% |
| Standard Deviation (Population) | 7.8% | 11.1% |
Similar Demographics by Single Father Poverty
Demographics Similar to Assyrians/Chaldeans/Syriacs by Single Father Poverty
In terms of single father poverty, the demographic groups most similar to Assyrians/Chaldeans/Syriacs are Tongan (12.2%, a difference of 4.2%), Tsimshian (12.7%, a difference of 8.3%), Immigrants from Fiji (13.2%, a difference of 12.8%), Immigrants from Ethiopia (13.4%, a difference of 14.6%), and Ethiopian (13.5%, a difference of 15.5%).
| Demographics | Rating | Rank | Single Father Poverty |
| Assyrians/Chaldeans/Syriacs | 100.0 /100 | #1 | Exceptional 11.7% |
| Tongans | 100.0 /100 | #2 | Exceptional 12.2% |
| Tsimshian | 100.0 /100 | #3 | Exceptional 12.7% |
| Immigrants | Fiji | 100.0 /100 | #4 | Exceptional 13.2% |
| Immigrants | Ethiopia | 100.0 /100 | #5 | Exceptional 13.4% |
| Ethiopians | 100.0 /100 | #6 | Exceptional 13.5% |
| Immigrants | Taiwan | 100.0 /100 | #7 | Exceptional 13.7% |
| Samoans | 100.0 /100 | #8 | Exceptional 13.8% |
| Afghans | 100.0 /100 | #9 | Exceptional 14.0% |
| Koreans | 100.0 /100 | #10 | Exceptional 14.0% |
| Filipinos | 100.0 /100 | #11 | Exceptional 14.0% |
| Immigrants | India | 100.0 /100 | #12 | Exceptional 14.0% |
| Immigrants | Philippines | 100.0 /100 | #13 | Exceptional 14.0% |
| Immigrants | Vietnam | 100.0 /100 | #14 | Exceptional 14.1% |
| Sri Lankans | 100.0 /100 | #15 | Exceptional 14.2% |
Demographics Similar to Immigrants from North Macedonia by Single Father Poverty
In terms of single father poverty, the demographic groups most similar to Immigrants from North Macedonia are Immigrants from Lebanon (17.9%, a difference of 0.18%), Carpatho Rusyn (18.0%, a difference of 0.22%), Bahamian (18.0%, a difference of 0.25%), Welsh (17.8%, a difference of 0.55%), and Alsatian (17.8%, a difference of 0.56%).
| Demographics | Rating | Rank | Single Father Poverty |
| Iroquois | 0.0 /100 | #279 | Tragic 17.7% |
| Scottish | 0.0 /100 | #280 | Tragic 17.7% |
| English | 0.0 /100 | #281 | Tragic 17.8% |
| Dutch | 0.0 /100 | #282 | Tragic 17.8% |
| Alsatians | 0.0 /100 | #283 | Tragic 17.8% |
| Welsh | 0.0 /100 | #284 | Tragic 17.8% |
| Immigrants | Lebanon | 0.0 /100 | #285 | Tragic 17.9% |
| Immigrants | North Macedonia | 0.0 /100 | #286 | Tragic 17.9% |
| Carpatho Rusyns | 0.0 /100 | #287 | Tragic 18.0% |
| Bahamians | 0.0 /100 | #288 | Tragic 18.0% |
| Irish | 0.0 /100 | #289 | Tragic 18.0% |
| West Indians | 0.0 /100 | #290 | Tragic 18.0% |
| Alaskan Athabascans | 0.0 /100 | #291 | Tragic 18.1% |
| Immigrants | Bahamas | 0.0 /100 | #292 | Tragic 18.1% |
| Alaska Natives | 0.0 /100 | #293 | Tragic 18.1% |