Immigrants from Korea vs Chippewa Single Female Poverty
COMPARE
Immigrants from Korea
Chippewa
Single Female Poverty
Single Female Poverty Comparison
Immigrants from Korea
Chippewa
18.1%
SINGLE FEMALE POVERTY
100.0/ 100
METRIC RATING
17th/ 347
METRIC RANK
26.8%
SINGLE FEMALE POVERTY
0.0/ 100
METRIC RATING
323rd/ 347
METRIC RANK
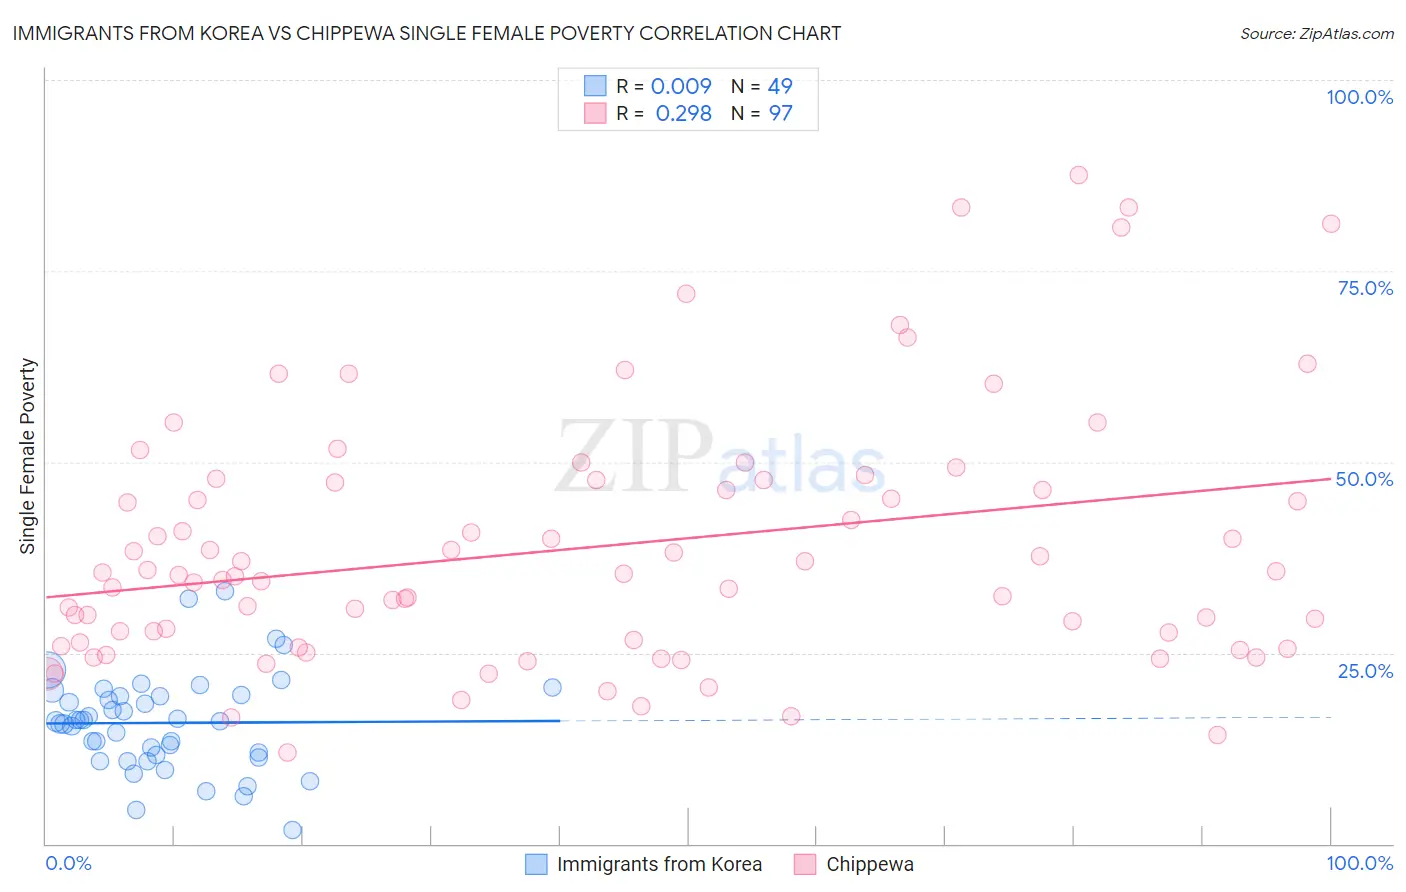
Immigrants from Korea vs Chippewa Single Female Poverty Correlation Chart
The statistical analysis conducted on geographies consisting of 408,307,529 people shows no correlation between the proportion of Immigrants from Korea and poverty level among single females in the United States with a correlation coefficient (R) of 0.009 and weighted average of 18.1%. Similarly, the statistical analysis conducted on geographies consisting of 213,087,028 people shows a weak positive correlation between the proportion of Chippewa and poverty level among single females in the United States with a correlation coefficient (R) of 0.298 and weighted average of 26.8%, a difference of 48.3%.
Single Female Poverty Correlation Summary
| Measurement | Immigrants from Korea | Chippewa |
| Minimum | 1.8% | 11.9% |
| Maximum | 33.0% | 87.6% |
| Range | 31.2% | 75.7% |
| Mean | 15.8% | 38.7% |
| Median | 16.1% | 35.2% |
| Interquartile 25% (IQ1) | 11.4% | 26.1% |
| Interquartile 75% (IQ3) | 19.4% | 47.5% |
| Interquartile Range (IQR) | 8.0% | 21.4% |
| Standard Deviation (Sample) | 6.3% | 16.5% |
| Standard Deviation (Population) | 6.3% | 16.4% |
Similar Demographics by Single Female Poverty
Demographics Similar to Immigrants from Korea by Single Female Poverty
In terms of single female poverty, the demographic groups most similar to Immigrants from Korea are Immigrants from Eastern Asia (18.1%, a difference of 0.28%), Immigrants from China (18.1%, a difference of 0.32%), Iranian (18.0%, a difference of 0.60%), Indian (Asian) (17.9%, a difference of 0.76%), and Bolivian (17.9%, a difference of 0.90%).
| Demographics | Rating | Rank | Single Female Poverty |
| Immigrants | Ireland | 100.0 /100 | #10 | Exceptional 17.8% |
| Immigrants | Lithuania | 100.0 /100 | #11 | Exceptional 17.8% |
| Immigrants | South Central Asia | 100.0 /100 | #12 | Exceptional 17.8% |
| Immigrants | Bolivia | 100.0 /100 | #13 | Exceptional 17.8% |
| Bolivians | 100.0 /100 | #14 | Exceptional 17.9% |
| Indians (Asian) | 100.0 /100 | #15 | Exceptional 17.9% |
| Iranians | 100.0 /100 | #16 | Exceptional 18.0% |
| Immigrants | Korea | 100.0 /100 | #17 | Exceptional 18.1% |
| Immigrants | Eastern Asia | 100.0 /100 | #18 | Exceptional 18.1% |
| Immigrants | China | 100.0 /100 | #19 | Exceptional 18.1% |
| Immigrants | Greece | 100.0 /100 | #20 | Exceptional 18.3% |
| Maltese | 100.0 /100 | #21 | Exceptional 18.3% |
| Burmese | 100.0 /100 | #22 | Exceptional 18.3% |
| Asians | 100.0 /100 | #23 | Exceptional 18.3% |
| Armenians | 100.0 /100 | #24 | Exceptional 18.3% |
Demographics Similar to Chippewa by Single Female Poverty
In terms of single female poverty, the demographic groups most similar to Chippewa are Seminole (26.8%, a difference of 0.10%), Kiowa (26.9%, a difference of 0.41%), Yup'ik (26.6%, a difference of 0.84%), Choctaw (27.2%, a difference of 1.4%), and Arapaho (26.4%, a difference of 1.5%).
| Demographics | Rating | Rank | Single Female Poverty |
| Immigrants | Somalia | 0.0 /100 | #316 | Tragic 25.8% |
| Ottawa | 0.0 /100 | #317 | Tragic 26.0% |
| Chickasaw | 0.0 /100 | #318 | Tragic 26.3% |
| Blacks/African Americans | 0.0 /100 | #319 | Tragic 26.4% |
| Arapaho | 0.0 /100 | #320 | Tragic 26.4% |
| Yup'ik | 0.0 /100 | #321 | Tragic 26.6% |
| Seminole | 0.0 /100 | #322 | Tragic 26.8% |
| Chippewa | 0.0 /100 | #323 | Tragic 26.8% |
| Kiowa | 0.0 /100 | #324 | Tragic 26.9% |
| Choctaw | 0.0 /100 | #325 | Tragic 27.2% |
| Creek | 0.0 /100 | #326 | Tragic 27.4% |
| Dutch West Indians | 0.0 /100 | #327 | Tragic 27.5% |
| Apache | 0.0 /100 | #328 | Tragic 27.7% |
| Menominee | 0.0 /100 | #329 | Tragic 27.8% |
| Hopi | 0.0 /100 | #330 | Tragic 28.0% |