Venezuelan vs Chinese Married-Couple Family Poverty
COMPARE
Venezuelan
Chinese
Married-Couple Family Poverty
Married-Couple Family Poverty Comparison
Venezuelans
Chinese
5.8%
MARRIED-COUPLE FAMILY POVERTY
2.7/ 100
METRIC RATING
239th/ 347
METRIC RANK
3.6%
MARRIED-COUPLE FAMILY POVERTY
100.0/ 100
METRIC RATING
2nd/ 347
METRIC RANK
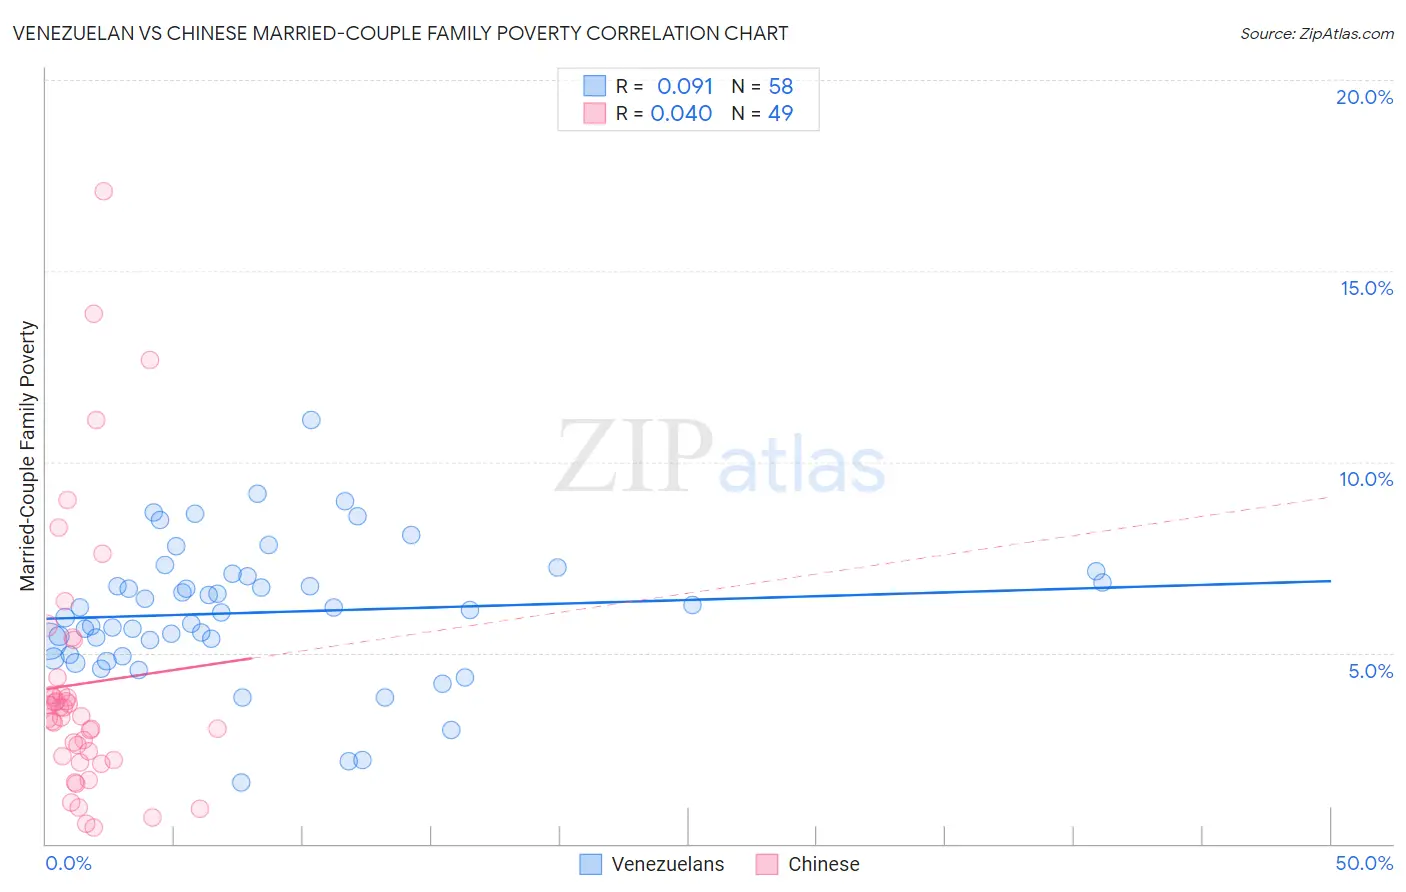
Venezuelan vs Chinese Married-Couple Family Poverty Correlation Chart
The statistical analysis conducted on geographies consisting of 304,730,206 people shows a slight positive correlation between the proportion of Venezuelans and poverty level among married-couple families in the United States with a correlation coefficient (R) of 0.091 and weighted average of 5.8%. Similarly, the statistical analysis conducted on geographies consisting of 64,670,469 people shows no correlation between the proportion of Chinese and poverty level among married-couple families in the United States with a correlation coefficient (R) of 0.040 and weighted average of 3.6%, a difference of 58.1%.
Married-Couple Family Poverty Correlation Summary
| Measurement | Venezuelan | Chinese |
| Minimum | 1.6% | 0.44% |
| Maximum | 11.1% | 17.1% |
| Range | 9.5% | 16.7% |
| Mean | 6.1% | 4.2% |
| Median | 6.1% | 3.3% |
| Interquartile 25% (IQ1) | 4.9% | 2.2% |
| Interquartile 75% (IQ3) | 7.0% | 4.1% |
| Interquartile Range (IQR) | 2.1% | 1.9% |
| Standard Deviation (Sample) | 1.8% | 3.4% |
| Standard Deviation (Population) | 1.8% | 3.4% |
Similar Demographics by Married-Couple Family Poverty
Demographics Similar to Venezuelans by Married-Couple Family Poverty
In terms of married-couple family poverty, the demographic groups most similar to Venezuelans are Cherokee (5.8%, a difference of 0.020%), Fijian (5.8%, a difference of 0.17%), Immigrants from Panama (5.8%, a difference of 0.19%), Immigrants from Western Africa (5.8%, a difference of 0.28%), and Immigrants from South America (5.7%, a difference of 0.40%).
| Demographics | Rating | Rank | Married-Couple Family Poverty |
| Immigrants | Laos | 4.4 /100 | #232 | Tragic 5.7% |
| Immigrants | Colombia | 3.7 /100 | #233 | Tragic 5.7% |
| Immigrants | Uruguay | 3.7 /100 | #234 | Tragic 5.7% |
| Immigrants | Sudan | 3.5 /100 | #235 | Tragic 5.7% |
| Ghanaians | 3.3 /100 | #236 | Tragic 5.7% |
| Immigrants | South America | 3.1 /100 | #237 | Tragic 5.7% |
| Cherokee | 2.7 /100 | #238 | Tragic 5.8% |
| Venezuelans | 2.7 /100 | #239 | Tragic 5.8% |
| Fijians | 2.5 /100 | #240 | Tragic 5.8% |
| Immigrants | Panama | 2.5 /100 | #241 | Tragic 5.8% |
| Immigrants | Western Africa | 2.4 /100 | #242 | Tragic 5.8% |
| Somalis | 2.3 /100 | #243 | Tragic 5.8% |
| Chickasaw | 2.3 /100 | #244 | Tragic 5.8% |
| Immigrants | Afghanistan | 2.1 /100 | #245 | Tragic 5.8% |
| Immigrants | Venezuela | 1.8 /100 | #246 | Tragic 5.8% |
Demographics Similar to Chinese by Married-Couple Family Poverty
In terms of married-couple family poverty, the demographic groups most similar to Chinese are Immigrants from India (3.6%, a difference of 0.18%), Norwegian (3.7%, a difference of 1.9%), Slovene (3.8%, a difference of 5.6%), Swedish (3.9%, a difference of 5.7%), and Luxembourger (3.9%, a difference of 6.4%).
| Demographics | Rating | Rank | Married-Couple Family Poverty |
| Immigrants | India | 100.0 /100 | #1 | Exceptional 3.6% |
| Chinese | 100.0 /100 | #2 | Exceptional 3.6% |
| Norwegians | 100.0 /100 | #3 | Exceptional 3.7% |
| Slovenes | 100.0 /100 | #4 | Exceptional 3.8% |
| Swedes | 100.0 /100 | #5 | Exceptional 3.9% |
| Luxembourgers | 100.0 /100 | #6 | Exceptional 3.9% |
| Latvians | 100.0 /100 | #7 | Exceptional 3.9% |
| Thais | 100.0 /100 | #8 | Exceptional 3.9% |
| Croatians | 100.0 /100 | #9 | Exceptional 3.9% |
| Carpatho Rusyns | 100.0 /100 | #10 | Exceptional 3.9% |
| Lithuanians | 100.0 /100 | #11 | Exceptional 4.0% |
| Bulgarians | 100.0 /100 | #12 | Exceptional 4.0% |
| Czechs | 100.0 /100 | #13 | Exceptional 4.0% |
| Slovaks | 100.0 /100 | #14 | Exceptional 4.0% |
| Poles | 100.0 /100 | #15 | Exceptional 4.0% |