Immigrants from Jordan vs Chinese Median Female Earnings
COMPARE
Immigrants from Jordan
Chinese
Median Female Earnings
Median Female Earnings Comparison
Immigrants from Jordan
Chinese
$40,977
MEDIAN FEMALE EARNINGS
93.5/ 100
METRIC RATING
122nd/ 347
METRIC RANK
$41,461
MEDIAN FEMALE EARNINGS
97.5/ 100
METRIC RATING
109th/ 347
METRIC RANK
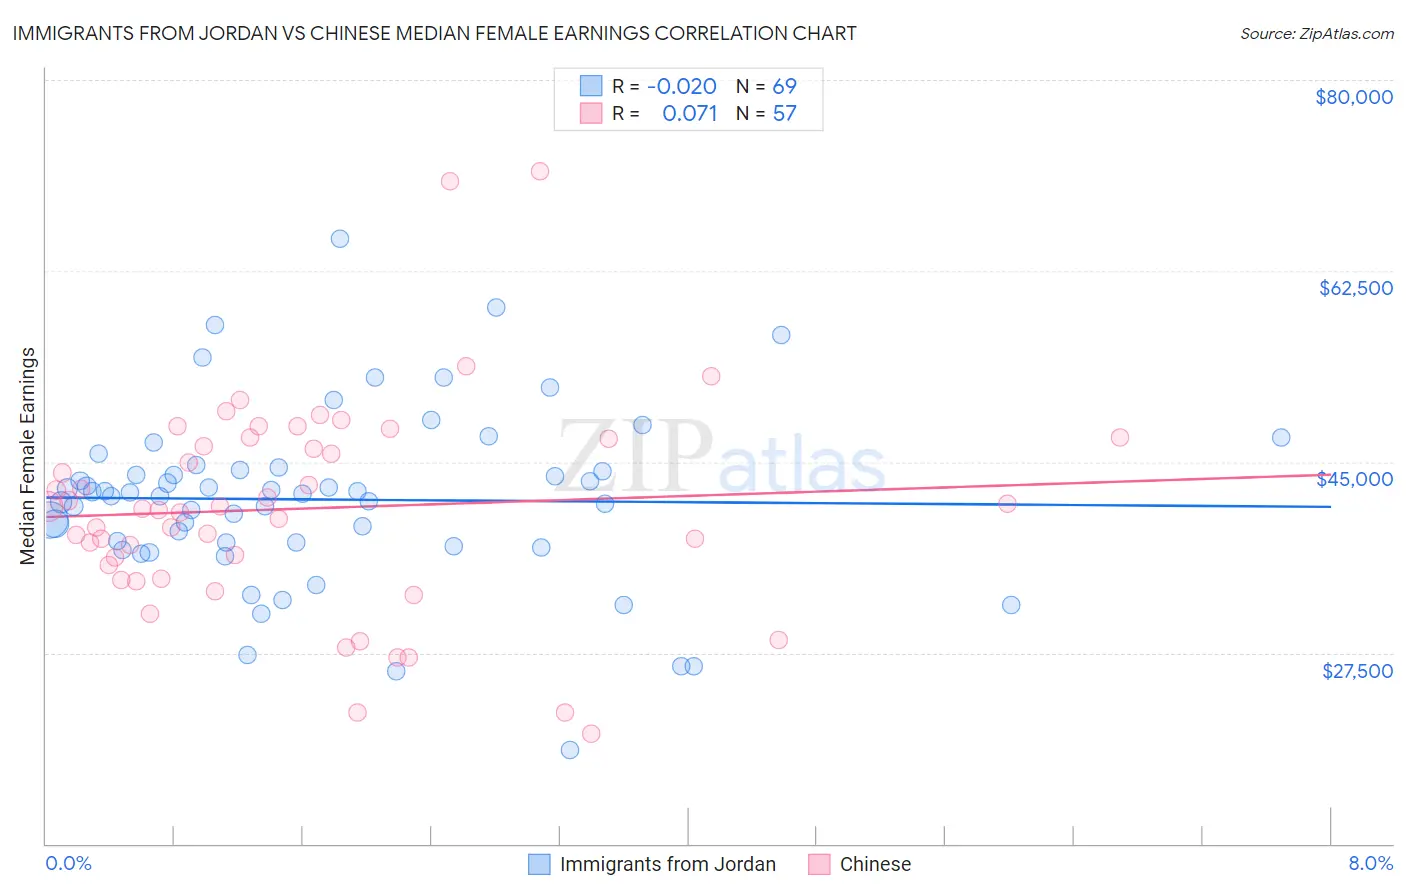
Immigrants from Jordan vs Chinese Median Female Earnings Correlation Chart
The statistical analysis conducted on geographies consisting of 181,274,544 people shows no correlation between the proportion of Immigrants from Jordan and median female earnings in the United States with a correlation coefficient (R) of -0.020 and weighted average of $40,977. Similarly, the statistical analysis conducted on geographies consisting of 64,808,152 people shows a slight positive correlation between the proportion of Chinese and median female earnings in the United States with a correlation coefficient (R) of 0.071 and weighted average of $41,461, a difference of 1.2%.
Median Female Earnings Correlation Summary
| Measurement | Immigrants from Jordan | Chinese |
| Minimum | $18,558 | $20,043 |
| Maximum | $65,466 | $71,591 |
| Range | $46,908 | $51,548 |
| Mean | $41,547 | $40,727 |
| Median | $42,113 | $40,673 |
| Interquartile 25% (IQ1) | $37,412 | $34,915 |
| Interquartile 75% (IQ3) | $44,413 | $47,174 |
| Interquartile Range (IQR) | $7,001 | $12,258 |
| Standard Deviation (Sample) | $8,068 | $9,803 |
| Standard Deviation (Population) | $8,010 | $9,716 |
Demographics Similar to Immigrants from Jordan and Chinese by Median Female Earnings
In terms of median female earnings, the demographic groups most similar to Immigrants from Jordan are Guyanese ($40,973, a difference of 0.010%), Croatian ($40,993, a difference of 0.040%), Trinidadian and Tobagonian ($40,958, a difference of 0.050%), Austrian ($40,923, a difference of 0.13%), and Immigrants from Kuwait ($41,055, a difference of 0.19%). Similarly, the demographic groups most similar to Chinese are Jordanian ($41,464, a difference of 0.010%), Palestinian ($41,484, a difference of 0.050%), Immigrants from Eritrea ($41,485, a difference of 0.060%), Italian ($41,505, a difference of 0.10%), and Immigrants from Western Asia ($41,375, a difference of 0.21%).
| Demographics | Rating | Rank | Median Female Earnings |
| Italians | 97.7 /100 | #105 | Exceptional $41,505 |
| Immigrants | Eritrea | 97.6 /100 | #106 | Exceptional $41,485 |
| Palestinians | 97.6 /100 | #107 | Exceptional $41,484 |
| Jordanians | 97.5 /100 | #108 | Exceptional $41,464 |
| Chinese | 97.5 /100 | #109 | Exceptional $41,461 |
| Immigrants | Western Asia | 97.0 /100 | #110 | Exceptional $41,375 |
| Immigrants | Canada | 97.0 /100 | #111 | Exceptional $41,373 |
| Immigrants | North America | 96.7 /100 | #112 | Exceptional $41,319 |
| Macedonians | 96.4 /100 | #113 | Exceptional $41,286 |
| Immigrants | England | 96.4 /100 | #114 | Exceptional $41,277 |
| Koreans | 96.4 /100 | #115 | Exceptional $41,276 |
| Immigrants | Brazil | 96.4 /100 | #116 | Exceptional $41,273 |
| Barbadians | 96.3 /100 | #117 | Exceptional $41,261 |
| Immigrants | Lebanon | 95.6 /100 | #118 | Exceptional $41,183 |
| Immigrants | Philippines | 95.0 /100 | #119 | Exceptional $41,114 |
| Immigrants | Kuwait | 94.4 /100 | #120 | Exceptional $41,055 |
| Croatians | 93.7 /100 | #121 | Exceptional $40,993 |
| Immigrants | Jordan | 93.5 /100 | #122 | Exceptional $40,977 |
| Guyanese | 93.4 /100 | #123 | Exceptional $40,973 |
| Trinidadians and Tobagonians | 93.2 /100 | #124 | Exceptional $40,958 |
| Austrians | 92.7 /100 | #125 | Exceptional $40,923 |