Osage vs Immigrants from Nicaragua Single Female Poverty
COMPARE
Osage
Immigrants from Nicaragua
Single Female Poverty
Single Female Poverty Comparison
Osage
Immigrants from Nicaragua
24.4%
SINGLE FEMALE POVERTY
0.0/ 100
METRIC RATING
291st/ 347
METRIC RANK
21.6%
SINGLE FEMALE POVERTY
13.3/ 100
METRIC RATING
214th/ 347
METRIC RANK
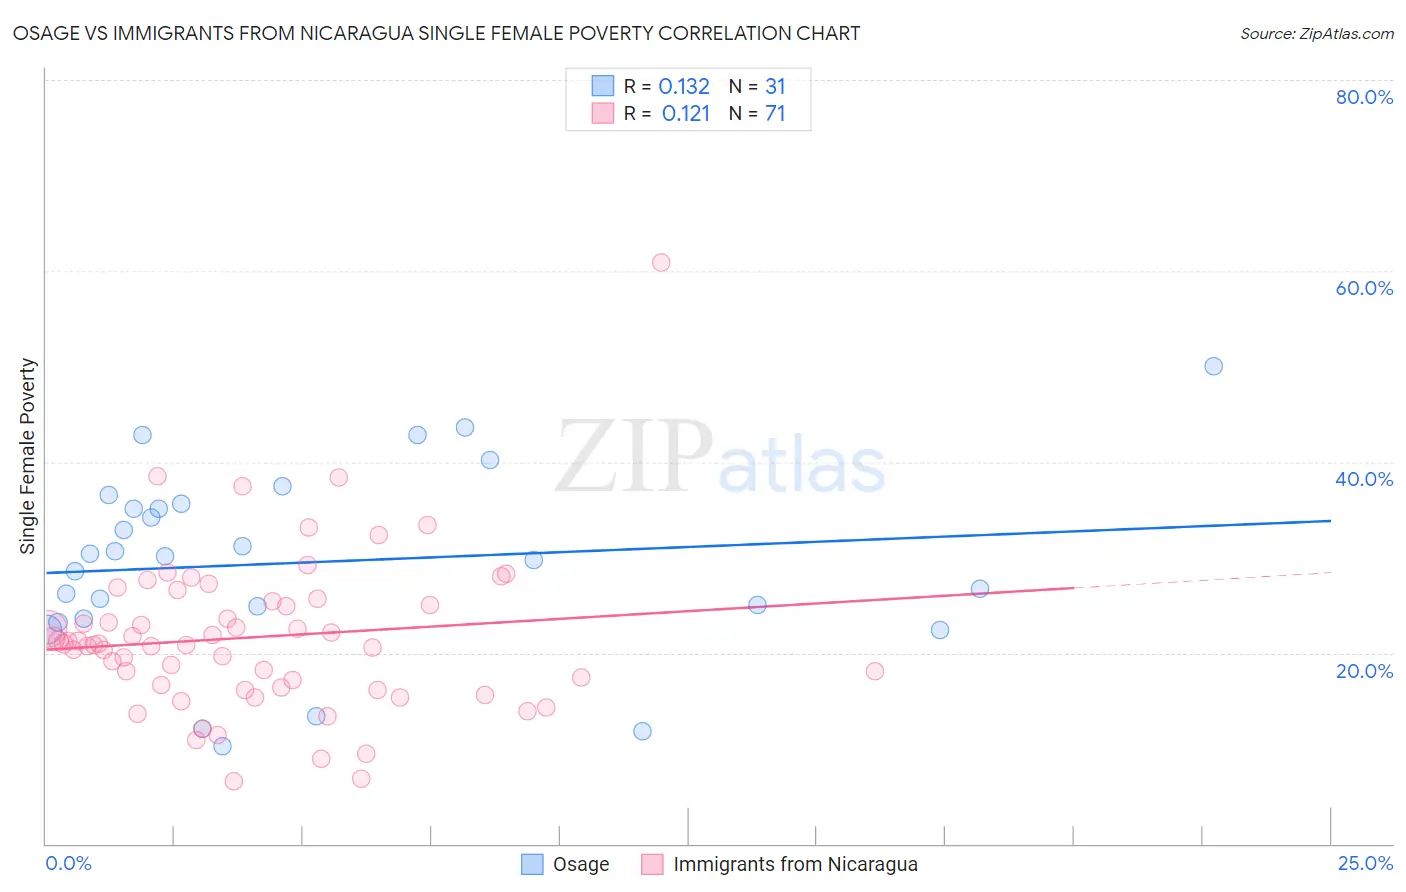
Osage vs Immigrants from Nicaragua Single Female Poverty Correlation Chart
The statistical analysis conducted on geographies consisting of 91,495,293 people shows a poor positive correlation between the proportion of Osage and poverty level among single females in the United States with a correlation coefficient (R) of 0.132 and weighted average of 24.4%. Similarly, the statistical analysis conducted on geographies consisting of 235,216,654 people shows a poor positive correlation between the proportion of Immigrants from Nicaragua and poverty level among single females in the United States with a correlation coefficient (R) of 0.121 and weighted average of 21.6%, a difference of 12.9%.
Single Female Poverty Correlation Summary
| Measurement | Osage | Immigrants from Nicaragua |
| Minimum | 10.2% | 6.5% |
| Maximum | 50.0% | 60.9% |
| Range | 39.8% | 54.4% |
| Mean | 29.5% | 21.6% |
| Median | 30.1% | 21.0% |
| Interquartile 25% (IQ1) | 23.6% | 16.3% |
| Interquartile 75% (IQ3) | 35.7% | 25.4% |
| Interquartile Range (IQR) | 12.1% | 9.1% |
| Standard Deviation (Sample) | 9.7% | 8.3% |
| Standard Deviation (Population) | 9.6% | 8.3% |
Similar Demographics by Single Female Poverty
Demographics Similar to Osage by Single Female Poverty
In terms of single female poverty, the demographic groups most similar to Osage are Alsatian (24.5%, a difference of 0.37%), American (24.5%, a difference of 0.44%), French American Indian (24.6%, a difference of 0.59%), Indonesian (24.3%, a difference of 0.60%), and U.S. Virgin Islander (24.2%, a difference of 0.94%).
| Demographics | Rating | Rank | Single Female Poverty |
| Immigrants | Dominica | 0.0 /100 | #284 | Tragic 23.9% |
| Immigrants | Guatemala | 0.0 /100 | #285 | Tragic 24.1% |
| Cree | 0.0 /100 | #286 | Tragic 24.1% |
| Bangladeshis | 0.0 /100 | #287 | Tragic 24.2% |
| Spanish Americans | 0.0 /100 | #288 | Tragic 24.2% |
| U.S. Virgin Islanders | 0.0 /100 | #289 | Tragic 24.2% |
| Indonesians | 0.0 /100 | #290 | Tragic 24.3% |
| Osage | 0.0 /100 | #291 | Tragic 24.4% |
| Alsatians | 0.0 /100 | #292 | Tragic 24.5% |
| Americans | 0.0 /100 | #293 | Tragic 24.5% |
| French American Indians | 0.0 /100 | #294 | Tragic 24.6% |
| Hispanics or Latinos | 0.0 /100 | #295 | Tragic 24.6% |
| Africans | 0.0 /100 | #296 | Tragic 24.8% |
| Immigrants | Central America | 0.0 /100 | #297 | Tragic 24.8% |
| Yaqui | 0.0 /100 | #298 | Tragic 24.9% |
Demographics Similar to Immigrants from Nicaragua by Single Female Poverty
In terms of single female poverty, the demographic groups most similar to Immigrants from Nicaragua are Guamanian/Chamorro (21.6%, a difference of 0.060%), Jamaican (21.6%, a difference of 0.090%), Icelander (21.6%, a difference of 0.10%), Ecuadorian (21.6%, a difference of 0.13%), and Immigrants from Panama (21.6%, a difference of 0.14%).
| Demographics | Rating | Rank | Single Female Poverty |
| Ghanaians | 15.7 /100 | #207 | Poor 21.6% |
| Haitians | 15.4 /100 | #208 | Poor 21.6% |
| Immigrants | Eastern Africa | 15.1 /100 | #209 | Poor 21.6% |
| Immigrants | Panama | 14.4 /100 | #210 | Poor 21.6% |
| Icelanders | 14.0 /100 | #211 | Poor 21.6% |
| Jamaicans | 14.0 /100 | #212 | Poor 21.6% |
| Guamanians/Chamorros | 13.7 /100 | #213 | Poor 21.6% |
| Immigrants | Nicaragua | 13.3 /100 | #214 | Poor 21.6% |
| Ecuadorians | 12.3 /100 | #215 | Poor 21.6% |
| Immigrants | Barbados | 12.2 /100 | #216 | Poor 21.7% |
| Immigrants | St. Vincent and the Grenadines | 11.7 /100 | #217 | Poor 21.7% |
| Nepalese | 9.7 /100 | #218 | Tragic 21.7% |
| Panamanians | 9.4 /100 | #219 | Tragic 21.7% |
| Germans | 8.3 /100 | #220 | Tragic 21.8% |
| Immigrants | Grenada | 8.0 /100 | #221 | Tragic 21.8% |