Ute vs Immigrants from Nicaragua Single Female Poverty
COMPARE
Ute
Immigrants from Nicaragua
Single Female Poverty
Single Female Poverty Comparison
Ute
Immigrants from Nicaragua
28.4%
SINGLE FEMALE POVERTY
0.0/ 100
METRIC RATING
333rd/ 347
METRIC RANK
21.6%
SINGLE FEMALE POVERTY
13.3/ 100
METRIC RATING
214th/ 347
METRIC RANK
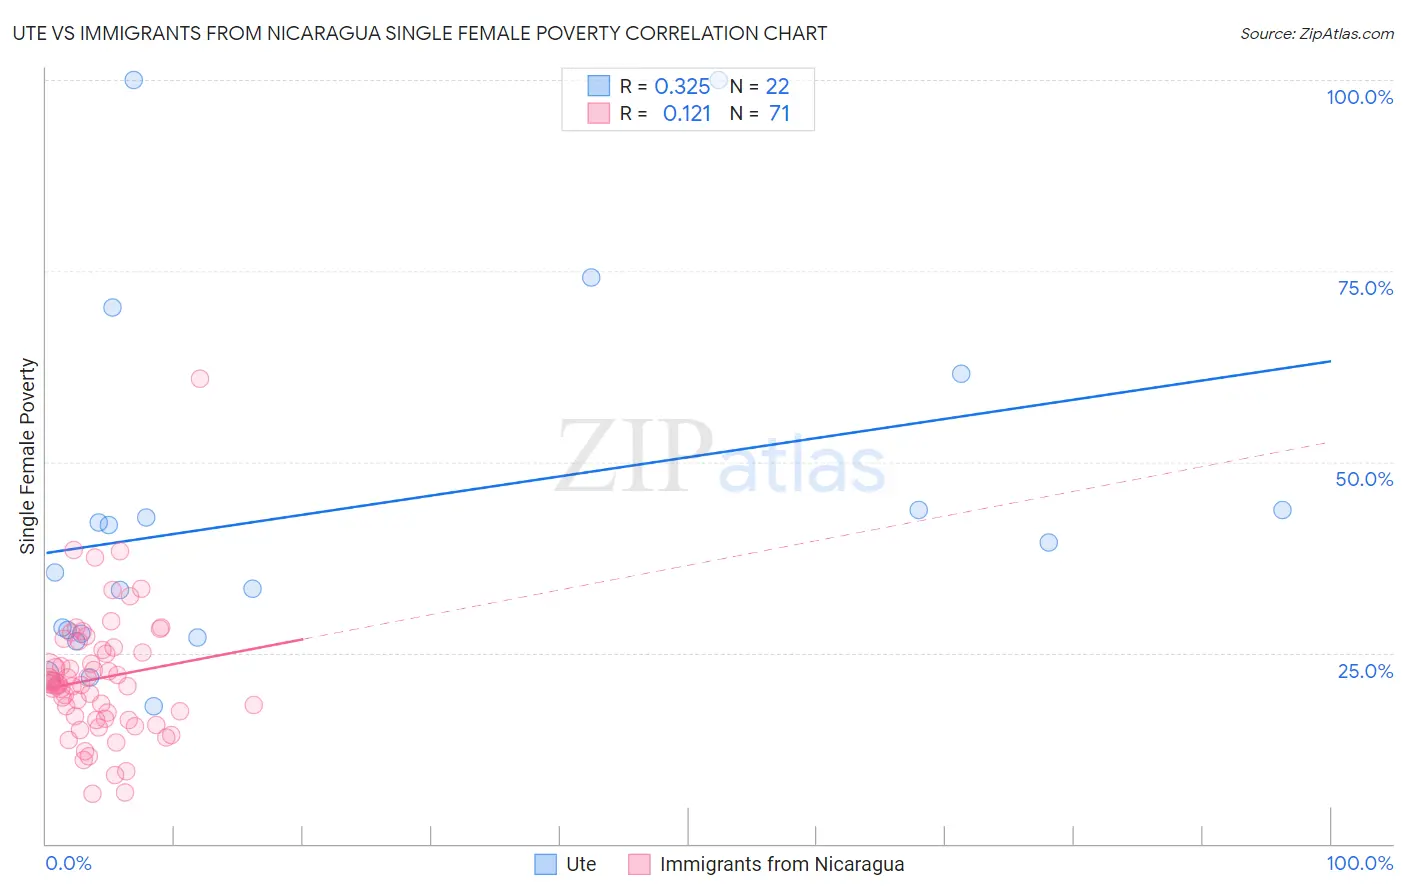
Ute vs Immigrants from Nicaragua Single Female Poverty Correlation Chart
The statistical analysis conducted on geographies consisting of 55,519,789 people shows a mild positive correlation between the proportion of Ute and poverty level among single females in the United States with a correlation coefficient (R) of 0.325 and weighted average of 28.4%. Similarly, the statistical analysis conducted on geographies consisting of 235,216,654 people shows a poor positive correlation between the proportion of Immigrants from Nicaragua and poverty level among single females in the United States with a correlation coefficient (R) of 0.121 and weighted average of 21.6%, a difference of 31.4%.
Single Female Poverty Correlation Summary
| Measurement | Ute | Immigrants from Nicaragua |
| Minimum | 18.0% | 6.5% |
| Maximum | 100.0% | 60.9% |
| Range | 82.0% | 54.4% |
| Mean | 43.7% | 21.6% |
| Median | 37.5% | 21.0% |
| Interquartile 25% (IQ1) | 27.4% | 16.3% |
| Interquartile 75% (IQ3) | 43.8% | 25.4% |
| Interquartile Range (IQR) | 16.3% | 9.1% |
| Standard Deviation (Sample) | 23.4% | 8.3% |
| Standard Deviation (Population) | 22.9% | 8.3% |
Similar Demographics by Single Female Poverty
Demographics Similar to Ute by Single Female Poverty
In terms of single female poverty, the demographic groups most similar to Ute are Yakama (28.3%, a difference of 0.42%), Native/Alaskan (28.2%, a difference of 0.68%), Pueblo (28.6%, a difference of 0.73%), Hopi (28.0%, a difference of 1.3%), and Immigrants from Yemen (28.9%, a difference of 1.9%).
| Demographics | Rating | Rank | Single Female Poverty |
| Creek | 0.0 /100 | #326 | Tragic 27.4% |
| Dutch West Indians | 0.0 /100 | #327 | Tragic 27.5% |
| Apache | 0.0 /100 | #328 | Tragic 27.7% |
| Menominee | 0.0 /100 | #329 | Tragic 27.8% |
| Hopi | 0.0 /100 | #330 | Tragic 28.0% |
| Natives/Alaskans | 0.0 /100 | #331 | Tragic 28.2% |
| Yakama | 0.0 /100 | #332 | Tragic 28.3% |
| Ute | 0.0 /100 | #333 | Tragic 28.4% |
| Pueblo | 0.0 /100 | #334 | Tragic 28.6% |
| Immigrants | Yemen | 0.0 /100 | #335 | Tragic 28.9% |
| Colville | 0.0 /100 | #336 | Tragic 29.1% |
| Yuman | 0.0 /100 | #337 | Tragic 29.4% |
| Pima | 0.0 /100 | #338 | Tragic 30.3% |
| Cheyenne | 0.0 /100 | #339 | Tragic 30.4% |
| Cajuns | 0.0 /100 | #340 | Tragic 30.6% |
Demographics Similar to Immigrants from Nicaragua by Single Female Poverty
In terms of single female poverty, the demographic groups most similar to Immigrants from Nicaragua are Guamanian/Chamorro (21.6%, a difference of 0.060%), Jamaican (21.6%, a difference of 0.090%), Icelander (21.6%, a difference of 0.10%), Ecuadorian (21.6%, a difference of 0.13%), and Immigrants from Panama (21.6%, a difference of 0.14%).
| Demographics | Rating | Rank | Single Female Poverty |
| Ghanaians | 15.7 /100 | #207 | Poor 21.6% |
| Haitians | 15.4 /100 | #208 | Poor 21.6% |
| Immigrants | Eastern Africa | 15.1 /100 | #209 | Poor 21.6% |
| Immigrants | Panama | 14.4 /100 | #210 | Poor 21.6% |
| Icelanders | 14.0 /100 | #211 | Poor 21.6% |
| Jamaicans | 14.0 /100 | #212 | Poor 21.6% |
| Guamanians/Chamorros | 13.7 /100 | #213 | Poor 21.6% |
| Immigrants | Nicaragua | 13.3 /100 | #214 | Poor 21.6% |
| Ecuadorians | 12.3 /100 | #215 | Poor 21.6% |
| Immigrants | Barbados | 12.2 /100 | #216 | Poor 21.7% |
| Immigrants | St. Vincent and the Grenadines | 11.7 /100 | #217 | Poor 21.7% |
| Nepalese | 9.7 /100 | #218 | Tragic 21.7% |
| Panamanians | 9.4 /100 | #219 | Tragic 21.7% |
| Germans | 8.3 /100 | #220 | Tragic 21.8% |
| Immigrants | Grenada | 8.0 /100 | #221 | Tragic 21.8% |