Chickasaw vs Immigrants from Nicaragua Married-couple Households
COMPARE
Chickasaw
Immigrants from Nicaragua
Married-couple Households
Married-couple Households Comparison
Chickasaw
Immigrants from Nicaragua
45.9%
MARRIED-COUPLE HOUSEHOLDS
22.7/ 100
METRIC RATING
195th/ 347
METRIC RANK
44.5%
MARRIED-COUPLE HOUSEHOLDS
1.2/ 100
METRIC RATING
235th/ 347
METRIC RANK
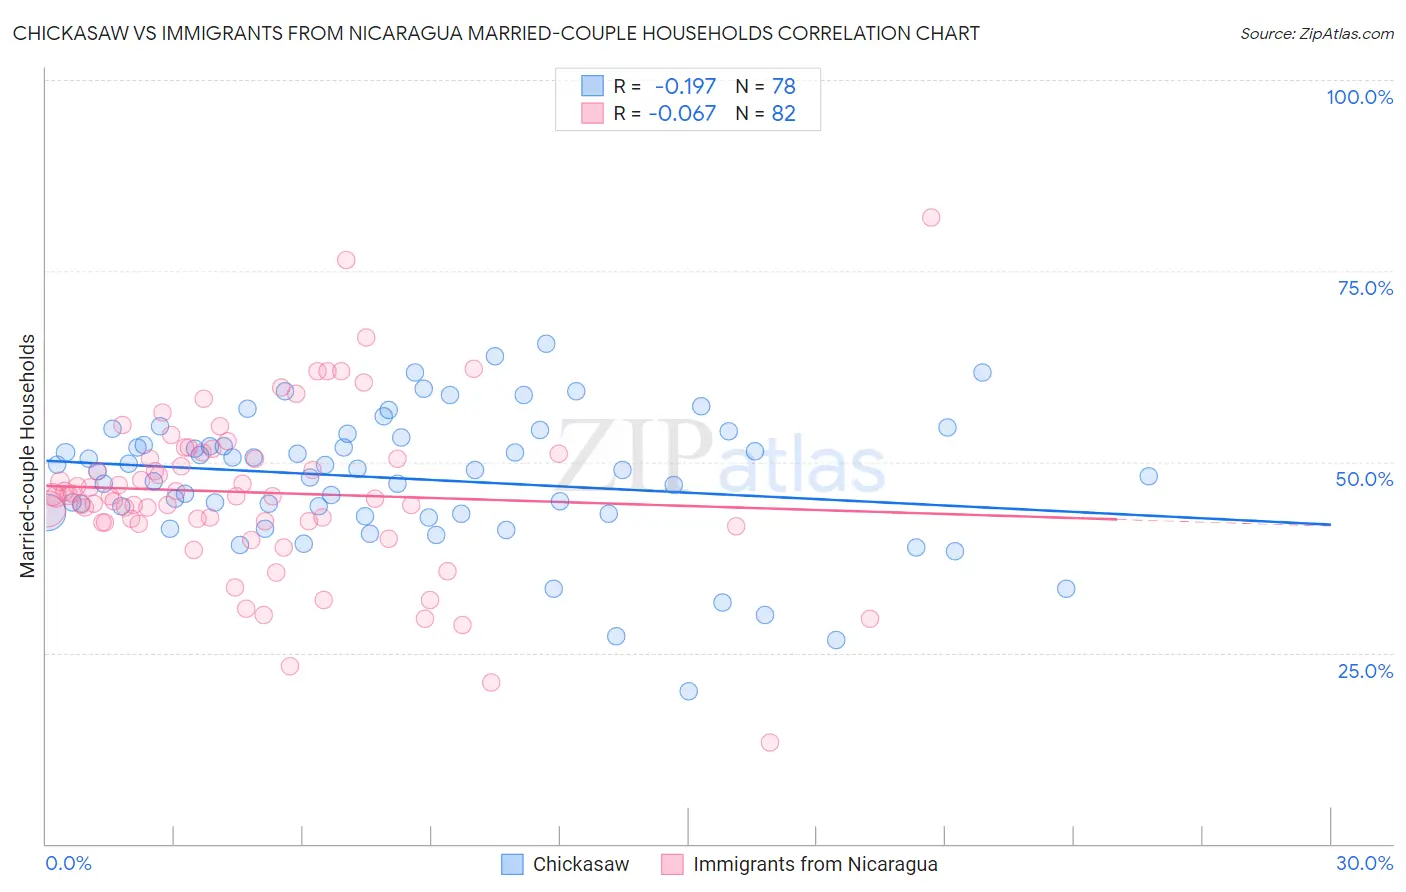
Chickasaw vs Immigrants from Nicaragua Married-couple Households Correlation Chart
The statistical analysis conducted on geographies consisting of 147,672,630 people shows a poor negative correlation between the proportion of Chickasaw and percentage of married-couple family households in the United States with a correlation coefficient (R) of -0.197 and weighted average of 45.9%. Similarly, the statistical analysis conducted on geographies consisting of 236,322,720 people shows a slight negative correlation between the proportion of Immigrants from Nicaragua and percentage of married-couple family households in the United States with a correlation coefficient (R) of -0.067 and weighted average of 44.5%, a difference of 3.1%.
Married-couple Households Correlation Summary
| Measurement | Chickasaw | Immigrants from Nicaragua |
| Minimum | 20.0% | 13.2% |
| Maximum | 65.4% | 82.0% |
| Range | 45.4% | 68.8% |
| Mean | 47.8% | 46.0% |
| Median | 48.9% | 45.5% |
| Interquartile 25% (IQ1) | 43.2% | 42.1% |
| Interquartile 75% (IQ3) | 53.2% | 51.0% |
| Interquartile Range (IQR) | 10.0% | 9.0% |
| Standard Deviation (Sample) | 8.7% | 10.9% |
| Standard Deviation (Population) | 8.6% | 10.9% |
Similar Demographics by Married-couple Households
Demographics Similar to Chickasaw by Married-couple Households
In terms of married-couple households, the demographic groups most similar to Chickasaw are Mexican American Indian (45.9%, a difference of 0.030%), Immigrants from South America (45.9%, a difference of 0.030%), Taiwanese (45.9%, a difference of 0.040%), Cambodian (45.9%, a difference of 0.080%), and Immigrants from Northern Africa (46.0%, a difference of 0.10%).
| Demographics | Rating | Rank | Married-couple Households |
| South American Indians | 28.4 /100 | #188 | Fair 46.0% |
| Immigrants | Latvia | 26.9 /100 | #189 | Fair 46.0% |
| Immigrants | Kuwait | 25.6 /100 | #190 | Fair 46.0% |
| Choctaw | 24.9 /100 | #191 | Fair 46.0% |
| Immigrants | Northern Africa | 24.6 /100 | #192 | Fair 46.0% |
| Taiwanese | 23.4 /100 | #193 | Fair 45.9% |
| Mexican American Indians | 23.3 /100 | #194 | Fair 45.9% |
| Chickasaw | 22.7 /100 | #195 | Fair 45.9% |
| Immigrants | South America | 22.2 /100 | #196 | Fair 45.9% |
| Cambodians | 21.3 /100 | #197 | Fair 45.9% |
| Ottawa | 19.4 /100 | #198 | Poor 45.8% |
| Carpatho Rusyns | 15.7 /100 | #199 | Poor 45.7% |
| Potawatomi | 15.6 /100 | #200 | Poor 45.7% |
| Immigrants | Serbia | 15.2 /100 | #201 | Poor 45.7% |
| Immigrants | Central America | 14.2 /100 | #202 | Poor 45.7% |
Demographics Similar to Immigrants from Nicaragua by Married-couple Households
In terms of married-couple households, the demographic groups most similar to Immigrants from Nicaragua are Yaqui (44.5%, a difference of 0.0%), Comanche (44.5%, a difference of 0.040%), Immigrants from Panama (44.6%, a difference of 0.070%), Immigrants from Uruguay (44.5%, a difference of 0.090%), and Spanish American (44.5%, a difference of 0.10%).
| Demographics | Rating | Rank | Married-couple Households |
| Kenyans | 1.7 /100 | #228 | Tragic 44.7% |
| Immigrants | Latin America | 1.6 /100 | #229 | Tragic 44.7% |
| Soviet Union | 1.6 /100 | #230 | Tragic 44.6% |
| Houma | 1.5 /100 | #231 | Tragic 44.6% |
| Marshallese | 1.5 /100 | #232 | Tragic 44.6% |
| Immigrants | Uganda | 1.5 /100 | #233 | Tragic 44.6% |
| Immigrants | Panama | 1.3 /100 | #234 | Tragic 44.6% |
| Immigrants | Nicaragua | 1.2 /100 | #235 | Tragic 44.5% |
| Yaqui | 1.2 /100 | #236 | Tragic 44.5% |
| Comanche | 1.2 /100 | #237 | Tragic 44.5% |
| Immigrants | Uruguay | 1.1 /100 | #238 | Tragic 44.5% |
| Spanish Americans | 1.1 /100 | #239 | Tragic 44.5% |
| Ute | 1.0 /100 | #240 | Tragic 44.4% |
| Immigrants | Bosnia and Herzegovina | 1.0 /100 | #241 | Tragic 44.4% |
| Immigrants | Albania | 1.0 /100 | #242 | Tragic 44.4% |