Irish vs Immigrants from Belgium Single Female Poverty
COMPARE
Irish
Immigrants from Belgium
Single Female Poverty
Single Female Poverty Comparison
Irish
Immigrants from Belgium
21.4%
SINGLE FEMALE POVERTY
21.4/ 100
METRIC RATING
200th/ 347
METRIC RANK
19.8%
SINGLE FEMALE POVERTY
97.3/ 100
METRIC RATING
101st/ 347
METRIC RANK
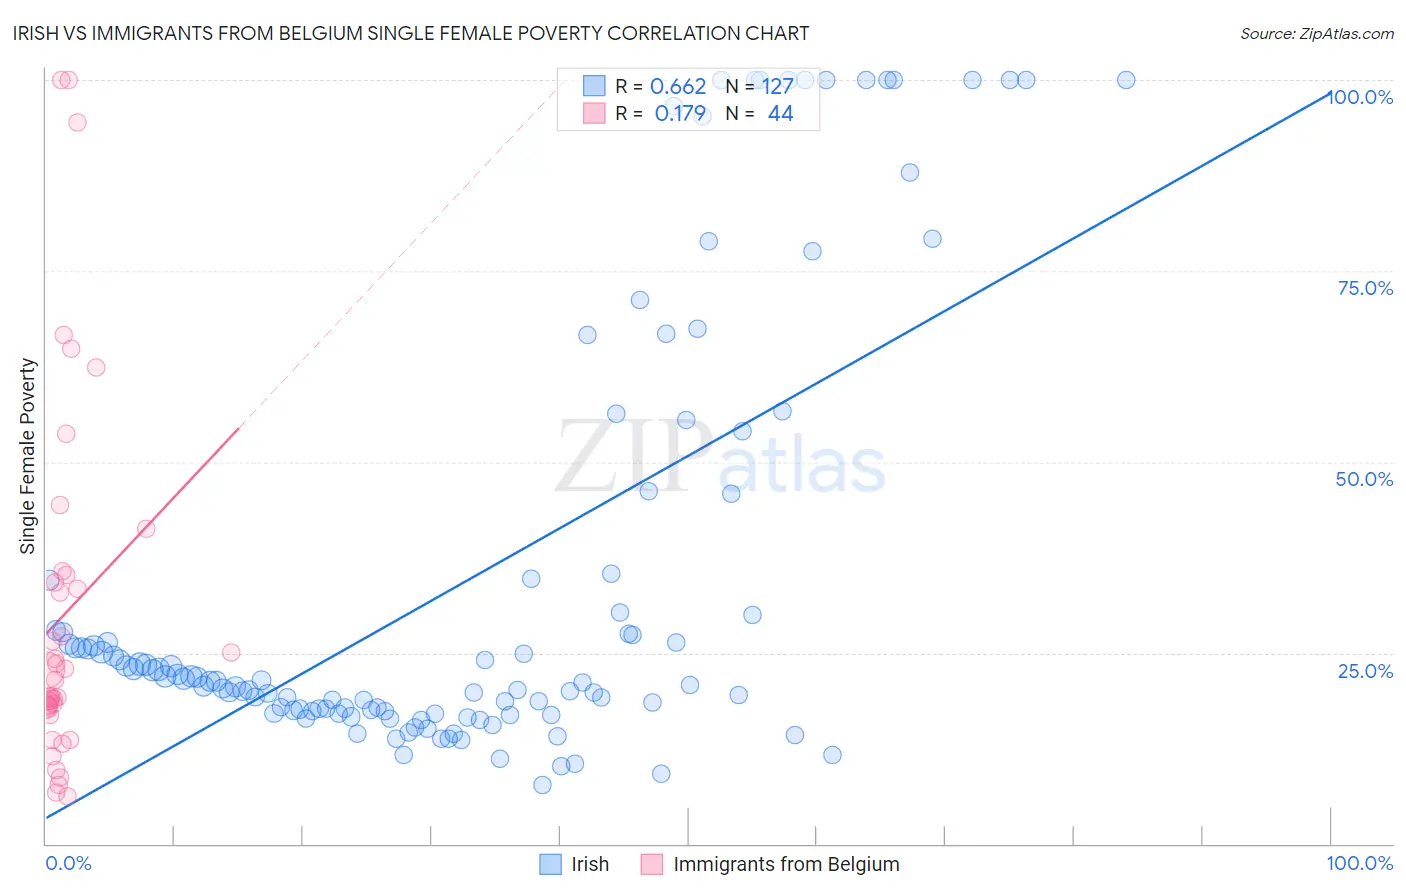
Irish vs Immigrants from Belgium Single Female Poverty Correlation Chart
The statistical analysis conducted on geographies consisting of 557,675,928 people shows a significant positive correlation between the proportion of Irish and poverty level among single females in the United States with a correlation coefficient (R) of 0.662 and weighted average of 21.4%. Similarly, the statistical analysis conducted on geographies consisting of 145,269,497 people shows a poor positive correlation between the proportion of Immigrants from Belgium and poverty level among single females in the United States with a correlation coefficient (R) of 0.179 and weighted average of 19.8%, a difference of 8.1%.
Single Female Poverty Correlation Summary
| Measurement | Irish | Immigrants from Belgium |
| Minimum | 7.7% | 6.3% |
| Maximum | 100.0% | 100.0% |
| Range | 92.3% | 93.7% |
| Mean | 34.3% | 30.1% |
| Median | 21.2% | 20.4% |
| Interquartile 25% (IQ1) | 17.4% | 17.9% |
| Interquartile 75% (IQ3) | 34.5% | 34.7% |
| Interquartile Range (IQR) | 17.1% | 16.9% |
| Standard Deviation (Sample) | 28.5% | 23.7% |
| Standard Deviation (Population) | 28.4% | 23.5% |
Similar Demographics by Single Female Poverty
Demographics Similar to Irish by Single Female Poverty
In terms of single female poverty, the demographic groups most similar to Irish are Nigerian (21.4%, a difference of 0.040%), Immigrants (21.4%, a difference of 0.050%), Immigrants from Kenya (21.4%, a difference of 0.070%), Swiss (21.4%, a difference of 0.25%), and Immigrants from Haiti (21.5%, a difference of 0.25%).
| Demographics | Rating | Rank | Single Female Poverty |
| Basques | 28.1 /100 | #193 | Fair 21.3% |
| Czechoslovakians | 27.7 /100 | #194 | Fair 21.3% |
| Nicaraguans | 27.6 /100 | #195 | Fair 21.3% |
| Immigrants | Saudi Arabia | 27.1 /100 | #196 | Fair 21.3% |
| Japanese | 26.4 /100 | #197 | Fair 21.3% |
| Swiss | 24.2 /100 | #198 | Fair 21.4% |
| Immigrants | Immigrants | 22.0 /100 | #199 | Fair 21.4% |
| Irish | 21.4 /100 | #200 | Fair 21.4% |
| Nigerians | 20.9 /100 | #201 | Fair 21.4% |
| Immigrants | Kenya | 20.7 /100 | #202 | Fair 21.4% |
| Immigrants | Haiti | 18.8 /100 | #203 | Poor 21.5% |
| Immigrants | Africa | 16.7 /100 | #204 | Poor 21.5% |
| Finns | 16.2 /100 | #205 | Poor 21.5% |
| Belgians | 16.1 /100 | #206 | Poor 21.5% |
| Ghanaians | 15.7 /100 | #207 | Poor 21.6% |
Demographics Similar to Immigrants from Belgium by Single Female Poverty
In terms of single female poverty, the demographic groups most similar to Immigrants from Belgium are Immigrants from Cameroon (19.8%, a difference of 0.010%), Immigrants from Southern Europe (19.9%, a difference of 0.13%), Ukrainian (19.8%, a difference of 0.18%), Chilean (19.9%, a difference of 0.25%), and Israeli (19.9%, a difference of 0.26%).
| Demographics | Rating | Rank | Single Female Poverty |
| Romanians | 98.6 /100 | #94 | Exceptional 19.6% |
| Estonians | 98.2 /100 | #95 | Exceptional 19.7% |
| Immigrants | Brazil | 98.2 /100 | #96 | Exceptional 19.7% |
| Croatians | 98.1 /100 | #97 | Exceptional 19.7% |
| Immigrants | France | 97.9 /100 | #98 | Exceptional 19.7% |
| Sierra Leoneans | 97.9 /100 | #99 | Exceptional 19.7% |
| Ukrainians | 97.6 /100 | #100 | Exceptional 19.8% |
| Immigrants | Belgium | 97.3 /100 | #101 | Exceptional 19.8% |
| Immigrants | Cameroon | 97.3 /100 | #102 | Exceptional 19.8% |
| Immigrants | Southern Europe | 97.1 /100 | #103 | Exceptional 19.9% |
| Chileans | 96.9 /100 | #104 | Exceptional 19.9% |
| Israelis | 96.9 /100 | #105 | Exceptional 19.9% |
| Ethiopians | 96.7 /100 | #106 | Exceptional 19.9% |
| Immigrants | Syria | 96.7 /100 | #107 | Exceptional 19.9% |
| Native Hawaiians | 96.6 /100 | #108 | Exceptional 19.9% |