Chickasaw vs Immigrants from Belgium Male Unemployment
COMPARE
Chickasaw
Immigrants from Belgium
Male Unemployment
Male Unemployment Comparison
Chickasaw
Immigrants from Belgium
5.2%
MALE UNEMPLOYMENT
82.9/ 100
METRIC RATING
132nd/ 347
METRIC RANK
4.9%
MALE UNEMPLOYMENT
99.2/ 100
METRIC RATING
42nd/ 347
METRIC RANK
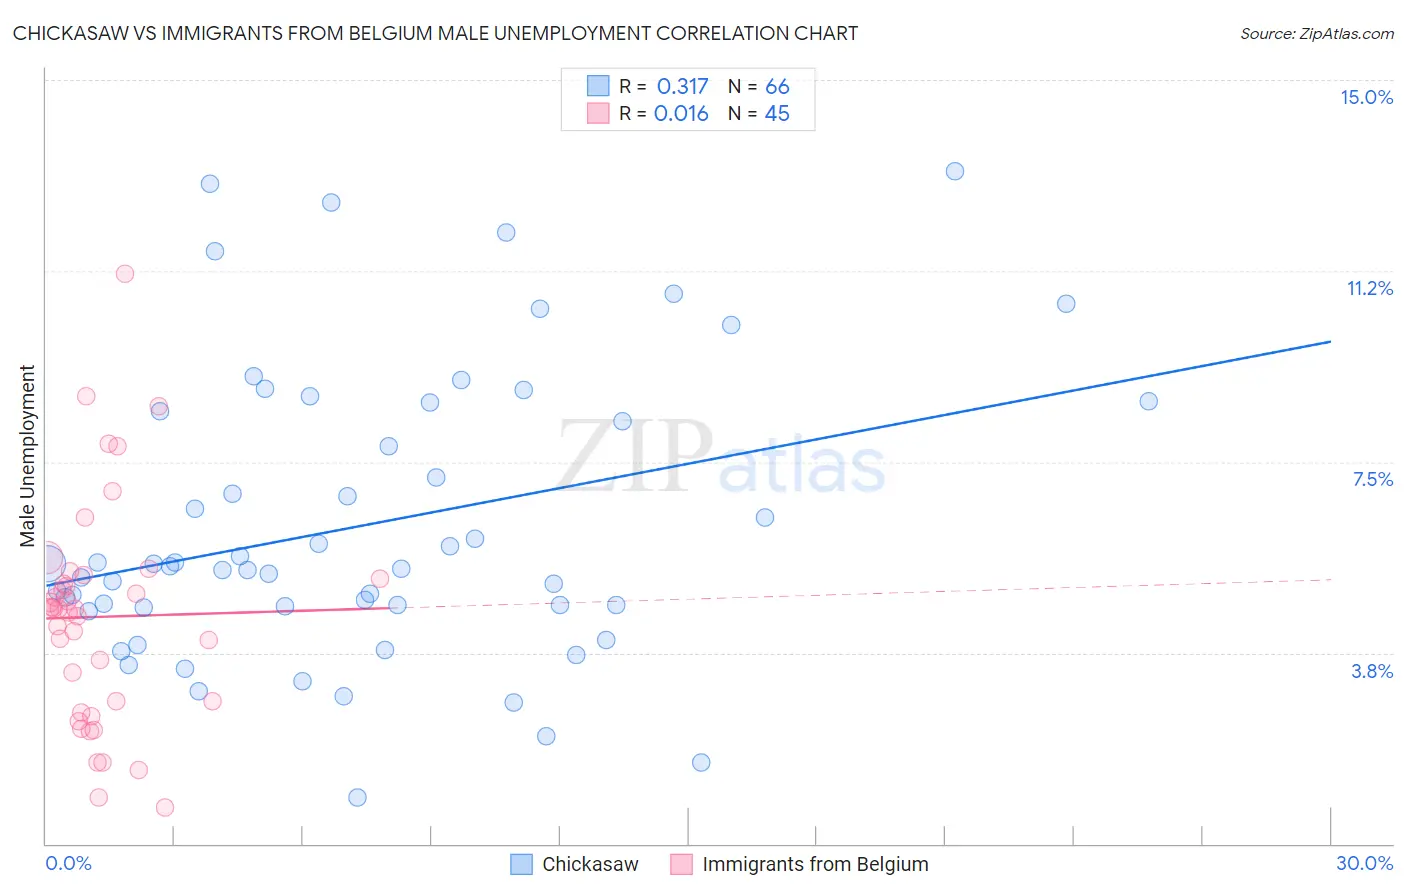
Chickasaw vs Immigrants from Belgium Male Unemployment Correlation Chart
The statistical analysis conducted on geographies consisting of 147,341,260 people shows a mild positive correlation between the proportion of Chickasaw and unemployment rate among males in the United States with a correlation coefficient (R) of 0.317 and weighted average of 5.2%. Similarly, the statistical analysis conducted on geographies consisting of 146,559,932 people shows no correlation between the proportion of Immigrants from Belgium and unemployment rate among males in the United States with a correlation coefficient (R) of 0.016 and weighted average of 4.9%, a difference of 5.2%.
Male Unemployment Correlation Summary
| Measurement | Chickasaw | Immigrants from Belgium |
| Minimum | 0.90% | 0.70% |
| Maximum | 13.2% | 11.2% |
| Range | 12.3% | 10.5% |
| Mean | 6.3% | 4.5% |
| Median | 5.4% | 4.6% |
| Interquartile 25% (IQ1) | 4.7% | 2.7% |
| Interquartile 75% (IQ3) | 8.5% | 5.2% |
| Interquartile Range (IQR) | 3.8% | 2.5% |
| Standard Deviation (Sample) | 2.8% | 2.2% |
| Standard Deviation (Population) | 2.8% | 2.1% |
Similar Demographics by Male Unemployment
Demographics Similar to Chickasaw by Male Unemployment
In terms of male unemployment, the demographic groups most similar to Chickasaw are Immigrants from Germany (5.2%, a difference of 0.020%), Immigrants from Malaysia (5.2%, a difference of 0.070%), Colombian (5.2%, a difference of 0.18%), Immigrants from Western Europe (5.2%, a difference of 0.21%), and Pakistani (5.2%, a difference of 0.24%).
| Demographics | Rating | Rank | Male Unemployment |
| Immigrants | Lithuania | 87.2 /100 | #125 | Excellent 5.1% |
| Immigrants | Colombia | 86.8 /100 | #126 | Excellent 5.1% |
| Immigrants | Brazil | 86.3 /100 | #127 | Excellent 5.2% |
| Hungarians | 85.1 /100 | #128 | Excellent 5.2% |
| Immigrants | Western Europe | 84.8 /100 | #129 | Excellent 5.2% |
| Immigrants | Malaysia | 83.5 /100 | #130 | Excellent 5.2% |
| Immigrants | Germany | 83.0 /100 | #131 | Excellent 5.2% |
| Chickasaw | 82.9 /100 | #132 | Excellent 5.2% |
| Colombians | 81.1 /100 | #133 | Excellent 5.2% |
| Pakistanis | 80.5 /100 | #134 | Excellent 5.2% |
| Immigrants | Saudi Arabia | 80.1 /100 | #135 | Excellent 5.2% |
| Lebanese | 79.9 /100 | #136 | Good 5.2% |
| Immigrants | Eastern Africa | 79.8 /100 | #137 | Good 5.2% |
| Immigrants | Croatia | 79.7 /100 | #138 | Good 5.2% |
| Kenyans | 79.4 /100 | #139 | Good 5.2% |
Demographics Similar to Immigrants from Belgium by Male Unemployment
In terms of male unemployment, the demographic groups most similar to Immigrants from Belgium are Chinese (4.9%, a difference of 0.020%), Northern European (4.9%, a difference of 0.10%), Immigrants from Japan (4.9%, a difference of 0.10%), Burmese (4.9%, a difference of 0.19%), and Immigrants from Bosnia and Herzegovina (4.9%, a difference of 0.26%).
| Demographics | Rating | Rank | Male Unemployment |
| Paraguayans | 99.5 /100 | #35 | Exceptional 4.9% |
| Immigrants | Singapore | 99.4 /100 | #36 | Exceptional 4.9% |
| Scotch-Irish | 99.4 /100 | #37 | Exceptional 4.9% |
| Immigrants | Bosnia and Herzegovina | 99.4 /100 | #38 | Exceptional 4.9% |
| Burmese | 99.3 /100 | #39 | Exceptional 4.9% |
| Northern Europeans | 99.3 /100 | #40 | Exceptional 4.9% |
| Chinese | 99.3 /100 | #41 | Exceptional 4.9% |
| Immigrants | Belgium | 99.2 /100 | #42 | Exceptional 4.9% |
| Immigrants | Japan | 99.2 /100 | #43 | Exceptional 4.9% |
| Immigrants | Korea | 99.1 /100 | #44 | Exceptional 4.9% |
| Immigrants | Zimbabwe | 99.0 /100 | #45 | Exceptional 4.9% |
| Bhutanese | 98.9 /100 | #46 | Exceptional 4.9% |
| Austrians | 98.9 /100 | #47 | Exceptional 4.9% |
| Immigrants | Scotland | 98.9 /100 | #48 | Exceptional 4.9% |
| Poles | 98.9 /100 | #49 | Exceptional 4.9% |