Scotch-Irish vs Immigrants from Belgium Single Female Poverty
COMPARE
Scotch-Irish
Immigrants from Belgium
Single Female Poverty
Single Female Poverty Comparison
Scotch-Irish
Immigrants from Belgium
22.9%
SINGLE FEMALE POVERTY
0.3/ 100
METRIC RATING
263rd/ 347
METRIC RANK
19.8%
SINGLE FEMALE POVERTY
97.3/ 100
METRIC RATING
101st/ 347
METRIC RANK
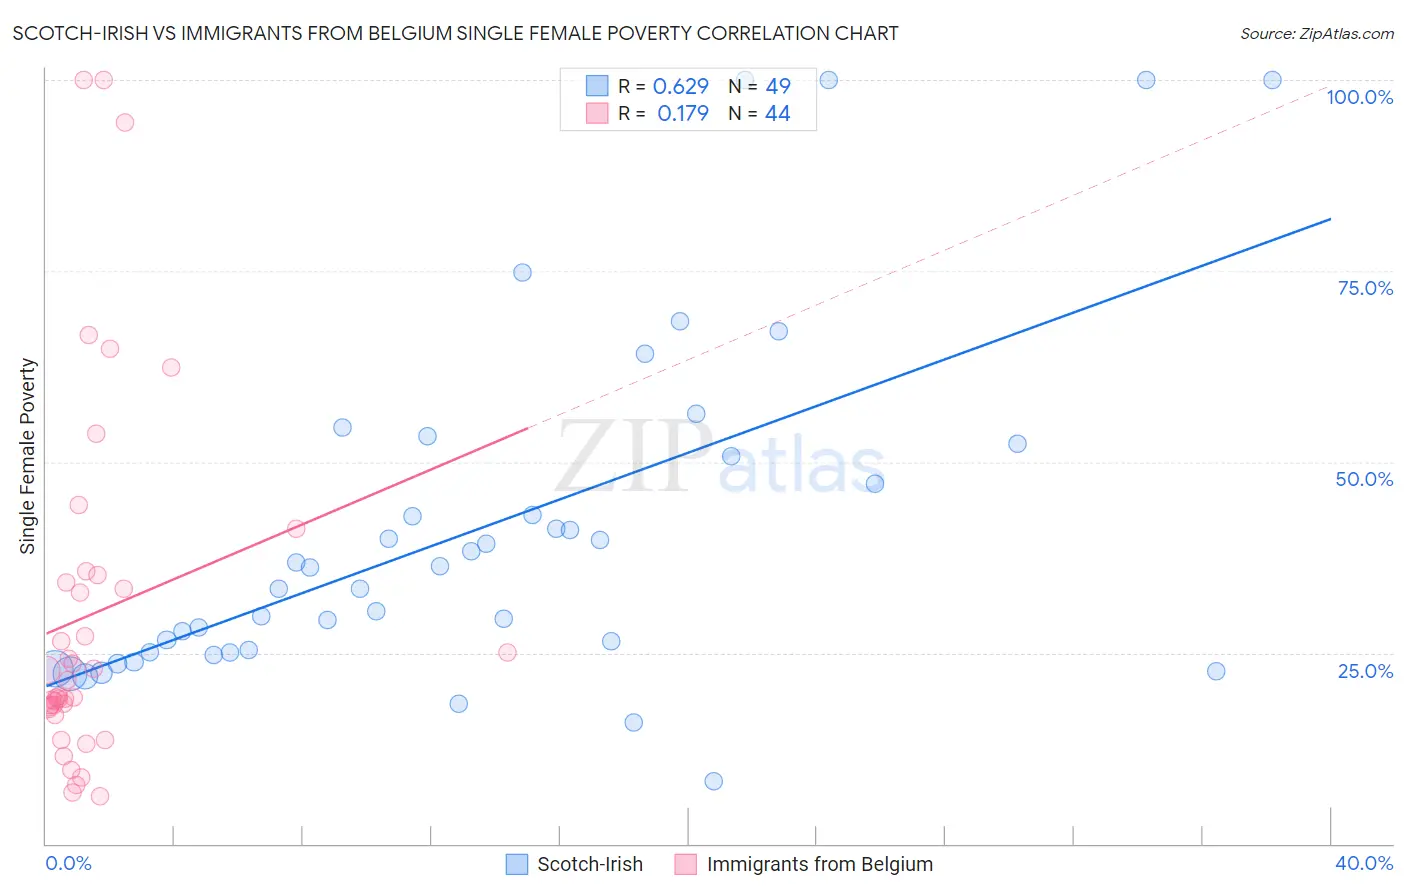
Scotch-Irish vs Immigrants from Belgium Single Female Poverty Correlation Chart
The statistical analysis conducted on geographies consisting of 531,342,644 people shows a significant positive correlation between the proportion of Scotch-Irish and poverty level among single females in the United States with a correlation coefficient (R) of 0.629 and weighted average of 22.9%. Similarly, the statistical analysis conducted on geographies consisting of 145,269,497 people shows a poor positive correlation between the proportion of Immigrants from Belgium and poverty level among single females in the United States with a correlation coefficient (R) of 0.179 and weighted average of 19.8%, a difference of 15.6%.
Single Female Poverty Correlation Summary
| Measurement | Scotch-Irish | Immigrants from Belgium |
| Minimum | 8.1% | 6.3% |
| Maximum | 100.0% | 100.0% |
| Range | 91.9% | 93.7% |
| Mean | 41.2% | 30.1% |
| Median | 36.1% | 20.4% |
| Interquartile 25% (IQ1) | 25.0% | 17.9% |
| Interquartile 75% (IQ3) | 51.6% | 34.7% |
| Interquartile Range (IQR) | 26.6% | 16.9% |
| Standard Deviation (Sample) | 22.8% | 23.7% |
| Standard Deviation (Population) | 22.5% | 23.5% |
Similar Demographics by Single Female Poverty
Demographics Similar to Scotch-Irish by Single Female Poverty
In terms of single female poverty, the demographic groups most similar to Scotch-Irish are Immigrants from Laos (22.9%, a difference of 0.070%), Central American (23.0%, a difference of 0.24%), British West Indian (22.8%, a difference of 0.41%), Immigrants from Micronesia (23.0%, a difference of 0.45%), and Senegalese (23.0%, a difference of 0.51%).
| Demographics | Rating | Rank | Single Female Poverty |
| Immigrants | Belize | 0.8 /100 | #256 | Tragic 22.6% |
| Sudanese | 0.7 /100 | #257 | Tragic 22.6% |
| Bahamians | 0.6 /100 | #258 | Tragic 22.7% |
| Whites/Caucasians | 0.6 /100 | #259 | Tragic 22.7% |
| Celtics | 0.5 /100 | #260 | Tragic 22.7% |
| Immigrants | Cabo Verde | 0.4 /100 | #261 | Tragic 22.8% |
| British West Indians | 0.4 /100 | #262 | Tragic 22.8% |
| Scotch-Irish | 0.3 /100 | #263 | Tragic 22.9% |
| Immigrants | Laos | 0.3 /100 | #264 | Tragic 22.9% |
| Central Americans | 0.2 /100 | #265 | Tragic 23.0% |
| Immigrants | Micronesia | 0.2 /100 | #266 | Tragic 23.0% |
| Senegalese | 0.2 /100 | #267 | Tragic 23.0% |
| Fijians | 0.2 /100 | #268 | Tragic 23.1% |
| Hmong | 0.2 /100 | #269 | Tragic 23.1% |
| Inupiat | 0.2 /100 | #270 | Tragic 23.1% |
Demographics Similar to Immigrants from Belgium by Single Female Poverty
In terms of single female poverty, the demographic groups most similar to Immigrants from Belgium are Immigrants from Cameroon (19.8%, a difference of 0.010%), Immigrants from Southern Europe (19.9%, a difference of 0.13%), Ukrainian (19.8%, a difference of 0.18%), Chilean (19.9%, a difference of 0.25%), and Israeli (19.9%, a difference of 0.26%).
| Demographics | Rating | Rank | Single Female Poverty |
| Romanians | 98.6 /100 | #94 | Exceptional 19.6% |
| Estonians | 98.2 /100 | #95 | Exceptional 19.7% |
| Immigrants | Brazil | 98.2 /100 | #96 | Exceptional 19.7% |
| Croatians | 98.1 /100 | #97 | Exceptional 19.7% |
| Immigrants | France | 97.9 /100 | #98 | Exceptional 19.7% |
| Sierra Leoneans | 97.9 /100 | #99 | Exceptional 19.7% |
| Ukrainians | 97.6 /100 | #100 | Exceptional 19.8% |
| Immigrants | Belgium | 97.3 /100 | #101 | Exceptional 19.8% |
| Immigrants | Cameroon | 97.3 /100 | #102 | Exceptional 19.8% |
| Immigrants | Southern Europe | 97.1 /100 | #103 | Exceptional 19.9% |
| Chileans | 96.9 /100 | #104 | Exceptional 19.9% |
| Israelis | 96.9 /100 | #105 | Exceptional 19.9% |
| Ethiopians | 96.7 /100 | #106 | Exceptional 19.9% |
| Immigrants | Syria | 96.7 /100 | #107 | Exceptional 19.9% |
| Native Hawaiians | 96.6 /100 | #108 | Exceptional 19.9% |