Chickasaw vs Hopi Poverty
COMPARE
Chickasaw
Hopi
Poverty
Poverty Comparison
Chickasaw
Hopi
14.7%
POVERTY
0.0/ 100
METRIC RATING
272nd/ 347
METRIC RANK
20.8%
POVERTY
0.0/ 100
METRIC RATING
341st/ 347
METRIC RANK
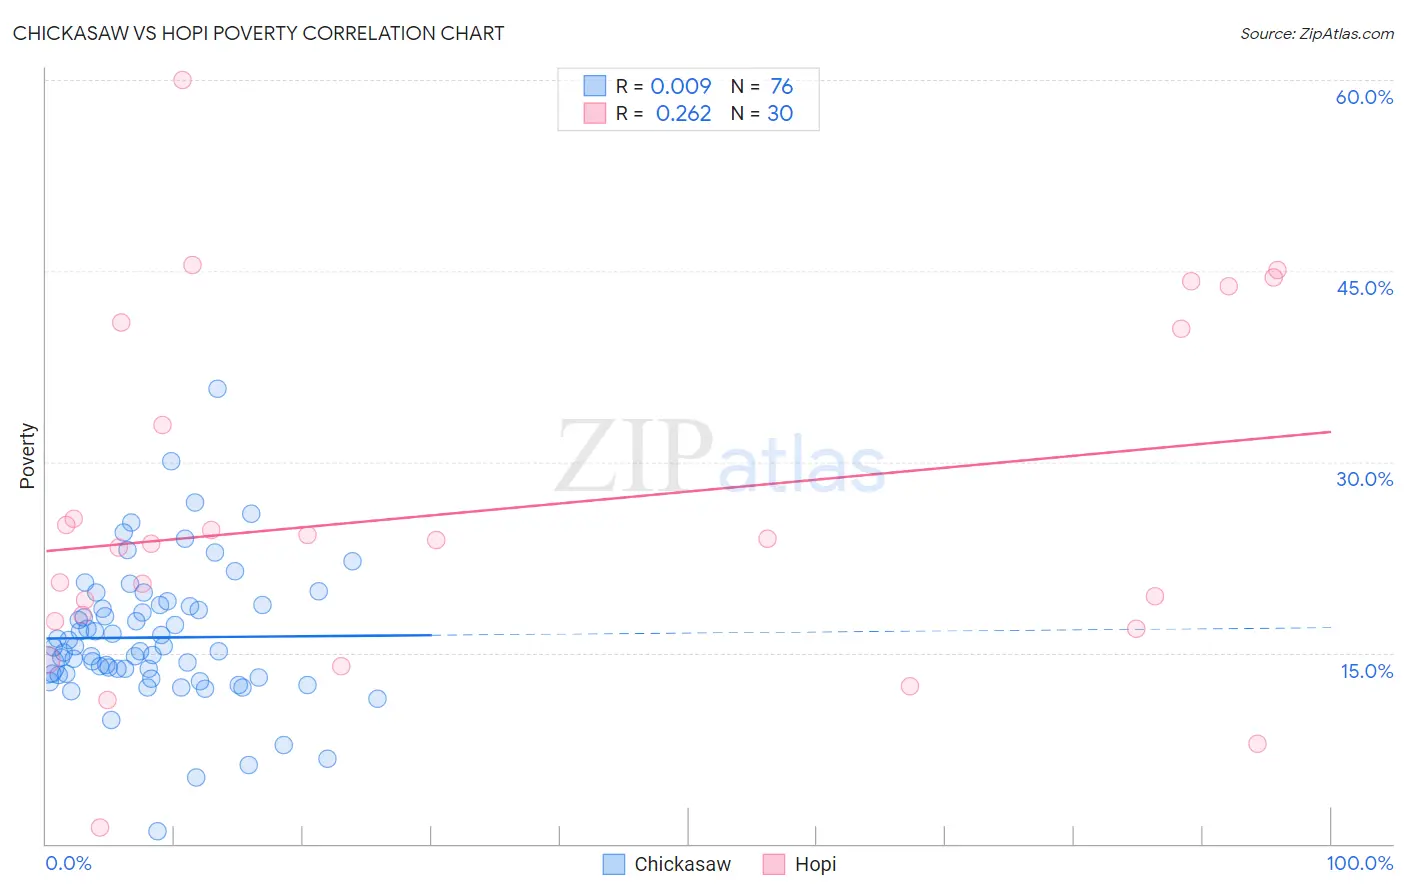
Chickasaw vs Hopi Poverty Correlation Chart
The statistical analysis conducted on geographies consisting of 147,672,043 people shows no correlation between the proportion of Chickasaw and poverty level in the United States with a correlation coefficient (R) of 0.009 and weighted average of 14.7%. Similarly, the statistical analysis conducted on geographies consisting of 74,733,532 people shows a weak positive correlation between the proportion of Hopi and poverty level in the United States with a correlation coefficient (R) of 0.262 and weighted average of 20.8%, a difference of 42.1%.
Poverty Correlation Summary
| Measurement | Chickasaw | Hopi |
| Minimum | 0.99% | 1.3% |
| Maximum | 35.7% | 60.0% |
| Range | 34.7% | 58.7% |
| Mean | 16.2% | 26.2% |
| Median | 15.3% | 23.8% |
| Interquartile 25% (IQ1) | 13.3% | 17.4% |
| Interquartile 75% (IQ3) | 18.7% | 40.4% |
| Interquartile Range (IQR) | 5.4% | 23.0% |
| Standard Deviation (Sample) | 5.4% | 13.6% |
| Standard Deviation (Population) | 5.4% | 13.4% |
Similar Demographics by Poverty
Demographics Similar to Chickasaw by Poverty
In terms of poverty, the demographic groups most similar to Chickasaw are Shoshone (14.7%, a difference of 0.040%), Spanish American (14.7%, a difference of 0.53%), Central American (14.6%, a difference of 0.63%), Immigrants from Cuba (14.6%, a difference of 0.77%), and Subsaharan African (14.5%, a difference of 0.92%).
| Demographics | Rating | Rank | Poverty |
| Immigrants | Guyana | 0.1 /100 | #265 | Tragic 14.5% |
| Guyanese | 0.1 /100 | #266 | Tragic 14.5% |
| Iroquois | 0.1 /100 | #267 | Tragic 14.5% |
| Sub-Saharan Africans | 0.1 /100 | #268 | Tragic 14.5% |
| Immigrants | Cuba | 0.1 /100 | #269 | Tragic 14.6% |
| Central Americans | 0.1 /100 | #270 | Tragic 14.6% |
| Shoshone | 0.0 /100 | #271 | Tragic 14.7% |
| Chickasaw | 0.0 /100 | #272 | Tragic 14.7% |
| Spanish Americans | 0.0 /100 | #273 | Tragic 14.7% |
| Barbadians | 0.0 /100 | #274 | Tragic 14.8% |
| Immigrants | West Indies | 0.0 /100 | #275 | Tragic 14.8% |
| Immigrants | Bahamas | 0.0 /100 | #276 | Tragic 14.8% |
| Bangladeshis | 0.0 /100 | #277 | Tragic 14.8% |
| Belizeans | 0.0 /100 | #278 | Tragic 14.8% |
| Immigrants | St. Vincent and the Grenadines | 0.0 /100 | #279 | Tragic 14.9% |
Demographics Similar to Hopi by Poverty
In terms of poverty, the demographic groups most similar to Hopi are Yup'ik (20.8%, a difference of 0.18%), Crow (20.7%, a difference of 0.93%), Immigrants from Yemen (21.5%, a difference of 3.2%), Yuman (20.2%, a difference of 3.2%), and Pima (21.9%, a difference of 4.8%).
| Demographics | Rating | Rank | Poverty |
| Houma | 0.0 /100 | #333 | Tragic 18.4% |
| Apache | 0.0 /100 | #334 | Tragic 18.4% |
| Cheyenne | 0.0 /100 | #335 | Tragic 18.9% |
| Pueblo | 0.0 /100 | #336 | Tragic 19.4% |
| Sioux | 0.0 /100 | #337 | Tragic 19.8% |
| Yuman | 0.0 /100 | #338 | Tragic 20.2% |
| Crow | 0.0 /100 | #339 | Tragic 20.7% |
| Yup'ik | 0.0 /100 | #340 | Tragic 20.8% |
| Hopi | 0.0 /100 | #341 | Tragic 20.8% |
| Immigrants | Yemen | 0.0 /100 | #342 | Tragic 21.5% |
| Pima | 0.0 /100 | #343 | Tragic 21.9% |
| Lumbee | 0.0 /100 | #344 | Tragic 21.9% |
| Navajo | 0.0 /100 | #345 | Tragic 23.1% |
| Puerto Ricans | 0.0 /100 | #346 | Tragic 23.7% |
| Tohono O'odham | 0.0 /100 | #347 | Tragic 24.4% |