Chickasaw vs Immigrants from Cabo Verde Poverty
COMPARE
Chickasaw
Immigrants from Cabo Verde
Poverty
Poverty Comparison
Chickasaw
Immigrants from Cabo Verde
14.7%
POVERTY
0.0/ 100
METRIC RATING
272nd/ 347
METRIC RANK
15.1%
POVERTY
0.0/ 100
METRIC RATING
291st/ 347
METRIC RANK
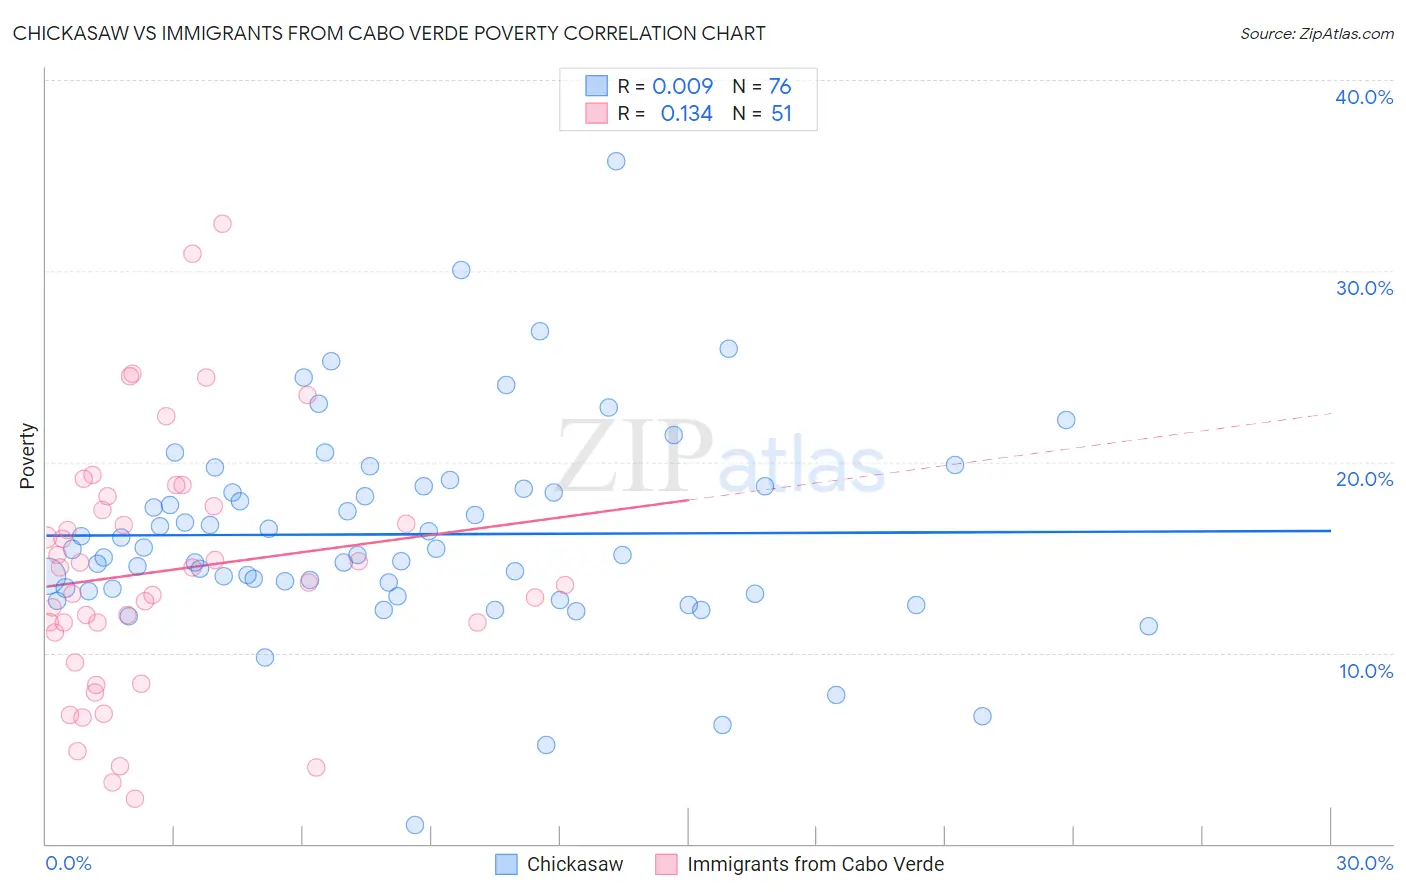
Chickasaw vs Immigrants from Cabo Verde Poverty Correlation Chart
The statistical analysis conducted on geographies consisting of 147,672,043 people shows no correlation between the proportion of Chickasaw and poverty level in the United States with a correlation coefficient (R) of 0.009 and weighted average of 14.7%. Similarly, the statistical analysis conducted on geographies consisting of 38,149,486 people shows a poor positive correlation between the proportion of Immigrants from Cabo Verde and poverty level in the United States with a correlation coefficient (R) of 0.134 and weighted average of 15.1%, a difference of 3.1%.
Poverty Correlation Summary
| Measurement | Chickasaw | Immigrants from Cabo Verde |
| Minimum | 0.99% | 2.3% |
| Maximum | 35.7% | 32.5% |
| Range | 34.7% | 30.1% |
| Mean | 16.2% | 14.3% |
| Median | 15.3% | 13.7% |
| Interquartile 25% (IQ1) | 13.3% | 11.0% |
| Interquartile 75% (IQ3) | 18.7% | 17.6% |
| Interquartile Range (IQR) | 5.4% | 6.6% |
| Standard Deviation (Sample) | 5.4% | 6.6% |
| Standard Deviation (Population) | 5.4% | 6.5% |
Demographics Similar to Chickasaw and Immigrants from Cabo Verde by Poverty
In terms of poverty, the demographic groups most similar to Chickasaw are Shoshone (14.7%, a difference of 0.040%), Spanish American (14.7%, a difference of 0.53%), Barbadian (14.8%, a difference of 0.93%), Immigrants from West Indies (14.8%, a difference of 0.96%), and Immigrants from Bahamas (14.8%, a difference of 0.97%). Similarly, the demographic groups most similar to Immigrants from Cabo Verde are Mexican (15.1%, a difference of 0.13%), Immigrants from Belize (15.1%, a difference of 0.23%), Yaqui (15.1%, a difference of 0.35%), Inupiat (15.1%, a difference of 0.36%), and Immigrants from Latin America (15.0%, a difference of 0.57%).
| Demographics | Rating | Rank | Poverty |
| Shoshone | 0.0 /100 | #271 | Tragic 14.7% |
| Chickasaw | 0.0 /100 | #272 | Tragic 14.7% |
| Spanish Americans | 0.0 /100 | #273 | Tragic 14.7% |
| Barbadians | 0.0 /100 | #274 | Tragic 14.8% |
| Immigrants | West Indies | 0.0 /100 | #275 | Tragic 14.8% |
| Immigrants | Bahamas | 0.0 /100 | #276 | Tragic 14.8% |
| Bangladeshis | 0.0 /100 | #277 | Tragic 14.8% |
| Belizeans | 0.0 /100 | #278 | Tragic 14.8% |
| Immigrants | St. Vincent and the Grenadines | 0.0 /100 | #279 | Tragic 14.9% |
| Haitians | 0.0 /100 | #280 | Tragic 14.9% |
| Immigrants | Barbados | 0.0 /100 | #281 | Tragic 14.9% |
| Comanche | 0.0 /100 | #282 | Tragic 15.0% |
| Immigrants | Haiti | 0.0 /100 | #283 | Tragic 15.0% |
| West Indians | 0.0 /100 | #284 | Tragic 15.0% |
| Vietnamese | 0.0 /100 | #285 | Tragic 15.0% |
| Immigrants | Latin America | 0.0 /100 | #286 | Tragic 15.0% |
| Inupiat | 0.0 /100 | #287 | Tragic 15.1% |
| Yaqui | 0.0 /100 | #288 | Tragic 15.1% |
| Immigrants | Belize | 0.0 /100 | #289 | Tragic 15.1% |
| Mexicans | 0.0 /100 | #290 | Tragic 15.1% |
| Immigrants | Cabo Verde | 0.0 /100 | #291 | Tragic 15.1% |