Immigrants from Saudi Arabia vs Hopi Poverty
COMPARE
Immigrants from Saudi Arabia
Hopi
Poverty
Poverty Comparison
Immigrants from Saudi Arabia
Hopi
13.8%
POVERTY
0.8/ 100
METRIC RATING
233rd/ 347
METRIC RANK
20.8%
POVERTY
0.0/ 100
METRIC RATING
341st/ 347
METRIC RANK
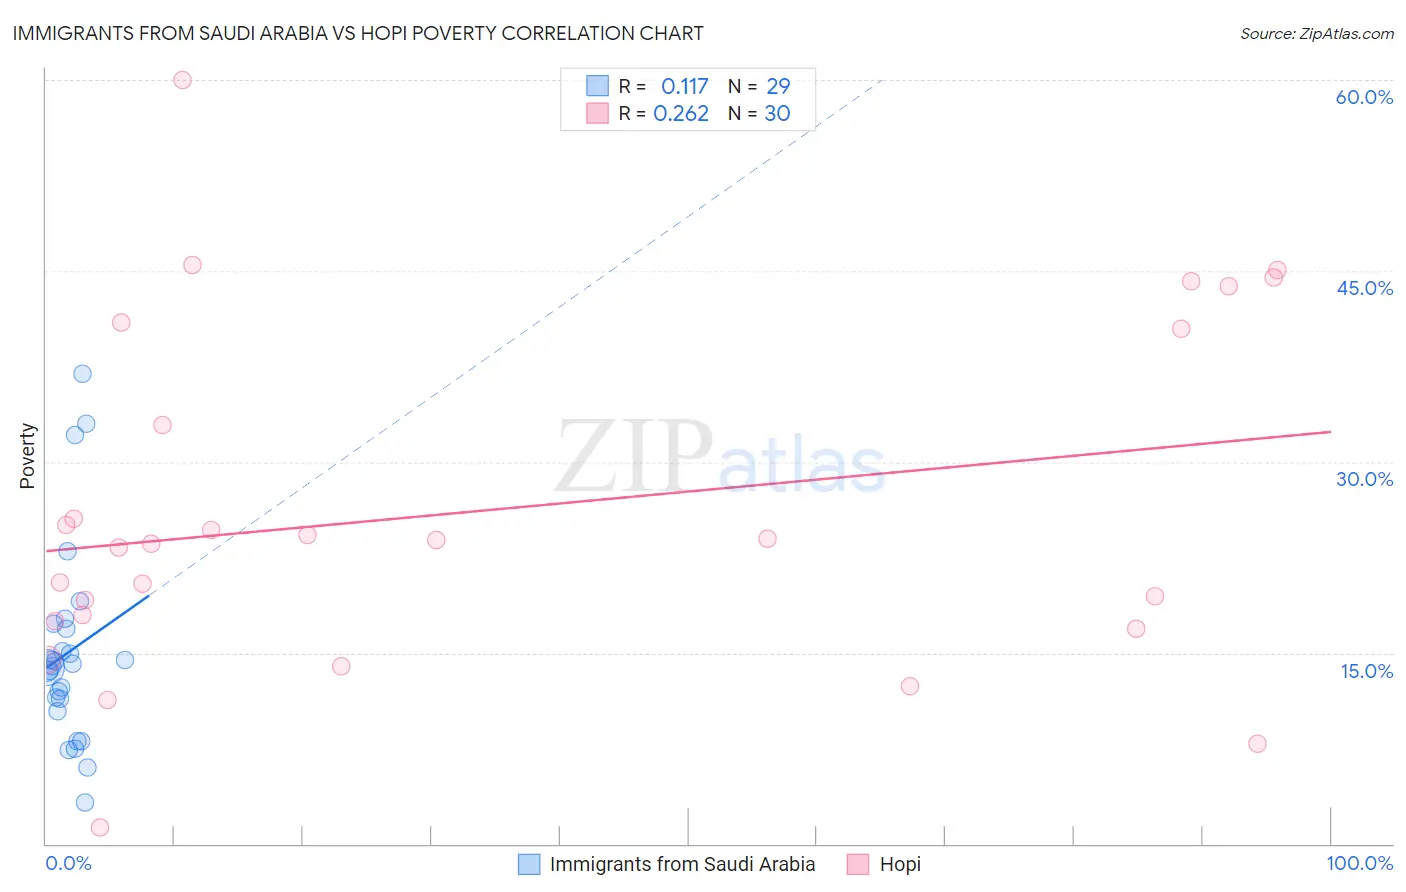
Immigrants from Saudi Arabia vs Hopi Poverty Correlation Chart
The statistical analysis conducted on geographies consisting of 164,230,350 people shows a poor positive correlation between the proportion of Immigrants from Saudi Arabia and poverty level in the United States with a correlation coefficient (R) of 0.117 and weighted average of 13.8%. Similarly, the statistical analysis conducted on geographies consisting of 74,733,532 people shows a weak positive correlation between the proportion of Hopi and poverty level in the United States with a correlation coefficient (R) of 0.262 and weighted average of 20.8%, a difference of 51.4%.
Poverty Correlation Summary
| Measurement | Immigrants from Saudi Arabia | Hopi |
| Minimum | 3.3% | 1.3% |
| Maximum | 37.0% | 60.0% |
| Range | 33.7% | 58.7% |
| Mean | 15.0% | 26.2% |
| Median | 14.0% | 23.8% |
| Interquartile 25% (IQ1) | 10.9% | 17.4% |
| Interquartile 75% (IQ3) | 17.1% | 40.4% |
| Interquartile Range (IQR) | 6.2% | 23.0% |
| Standard Deviation (Sample) | 7.8% | 13.6% |
| Standard Deviation (Population) | 7.6% | 13.4% |
Similar Demographics by Poverty
Demographics Similar to Immigrants from Saudi Arabia by Poverty
In terms of poverty, the demographic groups most similar to Immigrants from Saudi Arabia are Immigrants from Laos (13.8%, a difference of 0.24%), Fijian (13.7%, a difference of 0.25%), Cuban (13.9%, a difference of 0.68%), Immigrants from Armenia (13.9%, a difference of 0.71%), and French American Indian (13.9%, a difference of 0.73%).
| Demographics | Rating | Rank | Poverty |
| Marshallese | 2.2 /100 | #226 | Tragic 13.4% |
| Alaska Natives | 2.1 /100 | #227 | Tragic 13.5% |
| Immigrants | Nigeria | 1.7 /100 | #228 | Tragic 13.5% |
| Osage | 1.5 /100 | #229 | Tragic 13.6% |
| Alaskan Athabascans | 1.5 /100 | #230 | Tragic 13.6% |
| Nigerians | 1.4 /100 | #231 | Tragic 13.6% |
| Fijians | 0.8 /100 | #232 | Tragic 13.7% |
| Immigrants | Saudi Arabia | 0.8 /100 | #233 | Tragic 13.8% |
| Immigrants | Laos | 0.7 /100 | #234 | Tragic 13.8% |
| Cubans | 0.6 /100 | #235 | Tragic 13.9% |
| Immigrants | Armenia | 0.5 /100 | #236 | Tragic 13.9% |
| French American Indians | 0.5 /100 | #237 | Tragic 13.9% |
| Ghanaians | 0.5 /100 | #238 | Tragic 13.9% |
| Nicaraguans | 0.4 /100 | #239 | Tragic 13.9% |
| Immigrants | Middle Africa | 0.4 /100 | #240 | Tragic 14.0% |
Demographics Similar to Hopi by Poverty
In terms of poverty, the demographic groups most similar to Hopi are Yup'ik (20.8%, a difference of 0.18%), Crow (20.7%, a difference of 0.93%), Immigrants from Yemen (21.5%, a difference of 3.2%), Yuman (20.2%, a difference of 3.2%), and Pima (21.9%, a difference of 4.8%).
| Demographics | Rating | Rank | Poverty |
| Houma | 0.0 /100 | #333 | Tragic 18.4% |
| Apache | 0.0 /100 | #334 | Tragic 18.4% |
| Cheyenne | 0.0 /100 | #335 | Tragic 18.9% |
| Pueblo | 0.0 /100 | #336 | Tragic 19.4% |
| Sioux | 0.0 /100 | #337 | Tragic 19.8% |
| Yuman | 0.0 /100 | #338 | Tragic 20.2% |
| Crow | 0.0 /100 | #339 | Tragic 20.7% |
| Yup'ik | 0.0 /100 | #340 | Tragic 20.8% |
| Hopi | 0.0 /100 | #341 | Tragic 20.8% |
| Immigrants | Yemen | 0.0 /100 | #342 | Tragic 21.5% |
| Pima | 0.0 /100 | #343 | Tragic 21.9% |
| Lumbee | 0.0 /100 | #344 | Tragic 21.9% |
| Navajo | 0.0 /100 | #345 | Tragic 23.1% |
| Puerto Ricans | 0.0 /100 | #346 | Tragic 23.7% |
| Tohono O'odham | 0.0 /100 | #347 | Tragic 24.4% |