Chickasaw vs Alaska Native Poverty
COMPARE
Chickasaw
Alaska Native
Poverty
Poverty Comparison
Chickasaw
Alaska Natives
14.7%
POVERTY
0.0/ 100
METRIC RATING
272nd/ 347
METRIC RANK
13.5%
POVERTY
2.1/ 100
METRIC RATING
227th/ 347
METRIC RANK
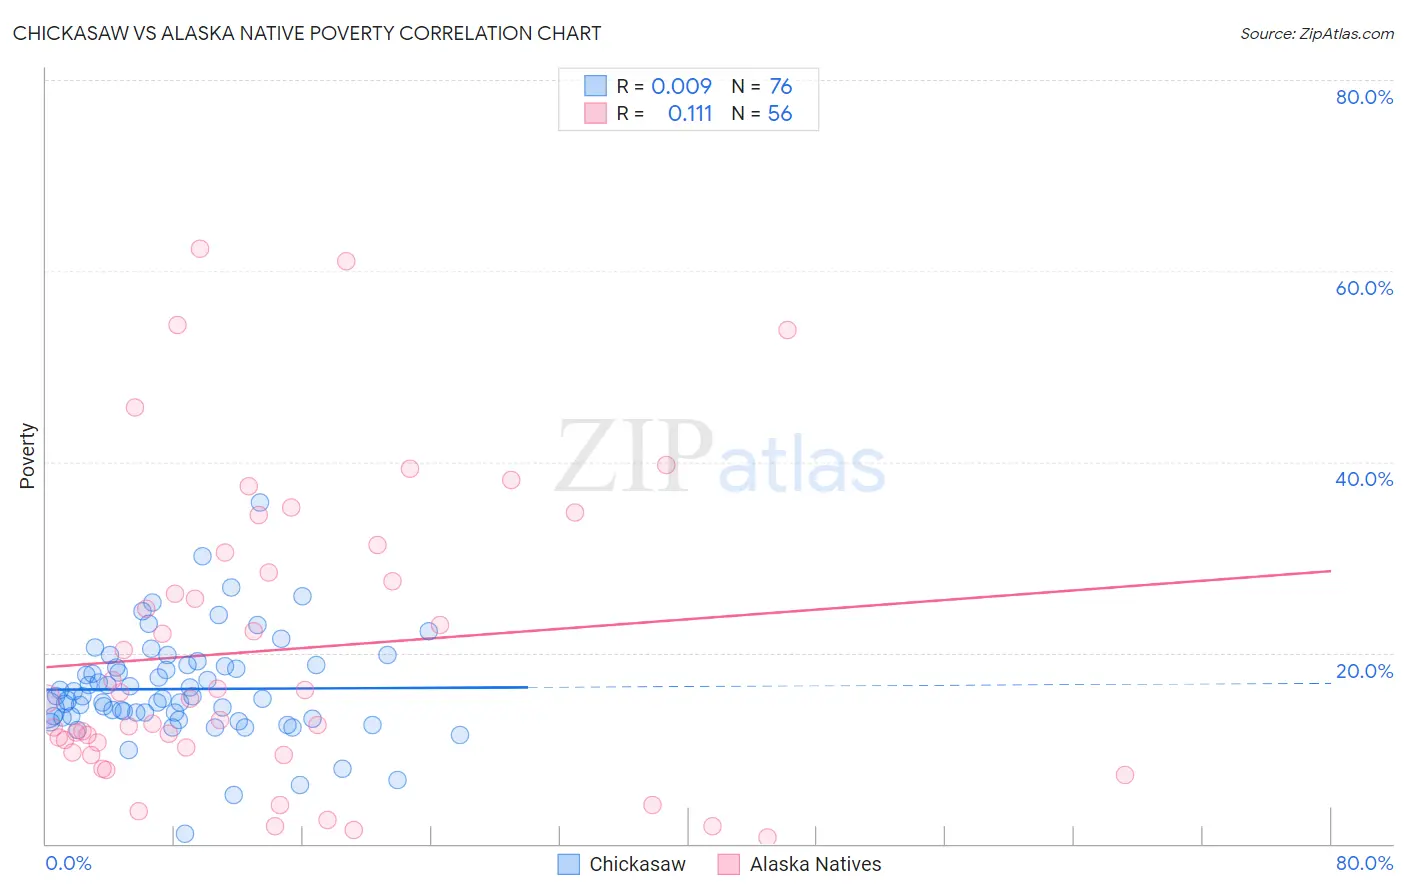
Chickasaw vs Alaska Native Poverty Correlation Chart
The statistical analysis conducted on geographies consisting of 147,672,043 people shows no correlation between the proportion of Chickasaw and poverty level in the United States with a correlation coefficient (R) of 0.009 and weighted average of 14.7%. Similarly, the statistical analysis conducted on geographies consisting of 76,760,249 people shows a poor positive correlation between the proportion of Alaska Natives and poverty level in the United States with a correlation coefficient (R) of 0.111 and weighted average of 13.5%, a difference of 8.9%.
Poverty Correlation Summary
| Measurement | Chickasaw | Alaska Native |
| Minimum | 0.99% | 0.63% |
| Maximum | 35.7% | 62.3% |
| Range | 34.7% | 61.6% |
| Mean | 16.2% | 20.3% |
| Median | 15.3% | 15.2% |
| Interquartile 25% (IQ1) | 13.3% | 9.8% |
| Interquartile 75% (IQ3) | 18.7% | 29.5% |
| Interquartile Range (IQR) | 5.4% | 19.7% |
| Standard Deviation (Sample) | 5.4% | 15.5% |
| Standard Deviation (Population) | 5.4% | 15.4% |
Similar Demographics by Poverty
Demographics Similar to Chickasaw by Poverty
In terms of poverty, the demographic groups most similar to Chickasaw are Shoshone (14.7%, a difference of 0.040%), Spanish American (14.7%, a difference of 0.53%), Central American (14.6%, a difference of 0.63%), Immigrants from Cuba (14.6%, a difference of 0.77%), and Subsaharan African (14.5%, a difference of 0.92%).
| Demographics | Rating | Rank | Poverty |
| Immigrants | Guyana | 0.1 /100 | #265 | Tragic 14.5% |
| Guyanese | 0.1 /100 | #266 | Tragic 14.5% |
| Iroquois | 0.1 /100 | #267 | Tragic 14.5% |
| Sub-Saharan Africans | 0.1 /100 | #268 | Tragic 14.5% |
| Immigrants | Cuba | 0.1 /100 | #269 | Tragic 14.6% |
| Central Americans | 0.1 /100 | #270 | Tragic 14.6% |
| Shoshone | 0.0 /100 | #271 | Tragic 14.7% |
| Chickasaw | 0.0 /100 | #272 | Tragic 14.7% |
| Spanish Americans | 0.0 /100 | #273 | Tragic 14.7% |
| Barbadians | 0.0 /100 | #274 | Tragic 14.8% |
| Immigrants | West Indies | 0.0 /100 | #275 | Tragic 14.8% |
| Immigrants | Bahamas | 0.0 /100 | #276 | Tragic 14.8% |
| Bangladeshis | 0.0 /100 | #277 | Tragic 14.8% |
| Belizeans | 0.0 /100 | #278 | Tragic 14.8% |
| Immigrants | St. Vincent and the Grenadines | 0.0 /100 | #279 | Tragic 14.9% |
Demographics Similar to Alaska Natives by Poverty
In terms of poverty, the demographic groups most similar to Alaska Natives are Marshallese (13.4%, a difference of 0.15%), German Russian (13.4%, a difference of 0.16%), Immigrants from Eritrea (13.4%, a difference of 0.38%), Immigrants from Nigeria (13.5%, a difference of 0.45%), and Immigrants from Africa (13.4%, a difference of 0.48%).
| Demographics | Rating | Rank | Poverty |
| Americans | 2.9 /100 | #220 | Tragic 13.4% |
| Alsatians | 2.6 /100 | #221 | Tragic 13.4% |
| Immigrants | Micronesia | 2.6 /100 | #222 | Tragic 13.4% |
| Immigrants | Africa | 2.5 /100 | #223 | Tragic 13.4% |
| Immigrants | Eritrea | 2.4 /100 | #224 | Tragic 13.4% |
| German Russians | 2.2 /100 | #225 | Tragic 13.4% |
| Marshallese | 2.2 /100 | #226 | Tragic 13.4% |
| Alaska Natives | 2.1 /100 | #227 | Tragic 13.5% |
| Immigrants | Nigeria | 1.7 /100 | #228 | Tragic 13.5% |
| Osage | 1.5 /100 | #229 | Tragic 13.6% |
| Alaskan Athabascans | 1.5 /100 | #230 | Tragic 13.6% |
| Nigerians | 1.4 /100 | #231 | Tragic 13.6% |
| Fijians | 0.8 /100 | #232 | Tragic 13.7% |
| Immigrants | Saudi Arabia | 0.8 /100 | #233 | Tragic 13.8% |
| Immigrants | Laos | 0.7 /100 | #234 | Tragic 13.8% |