Chickasaw vs Blackfeet Poverty
COMPARE
Chickasaw
Blackfeet
Poverty
Poverty Comparison
Chickasaw
Blackfeet
14.7%
POVERTY
0.0/ 100
METRIC RATING
272nd/ 347
METRIC RANK
15.2%
POVERTY
0.0/ 100
METRIC RATING
294th/ 347
METRIC RANK
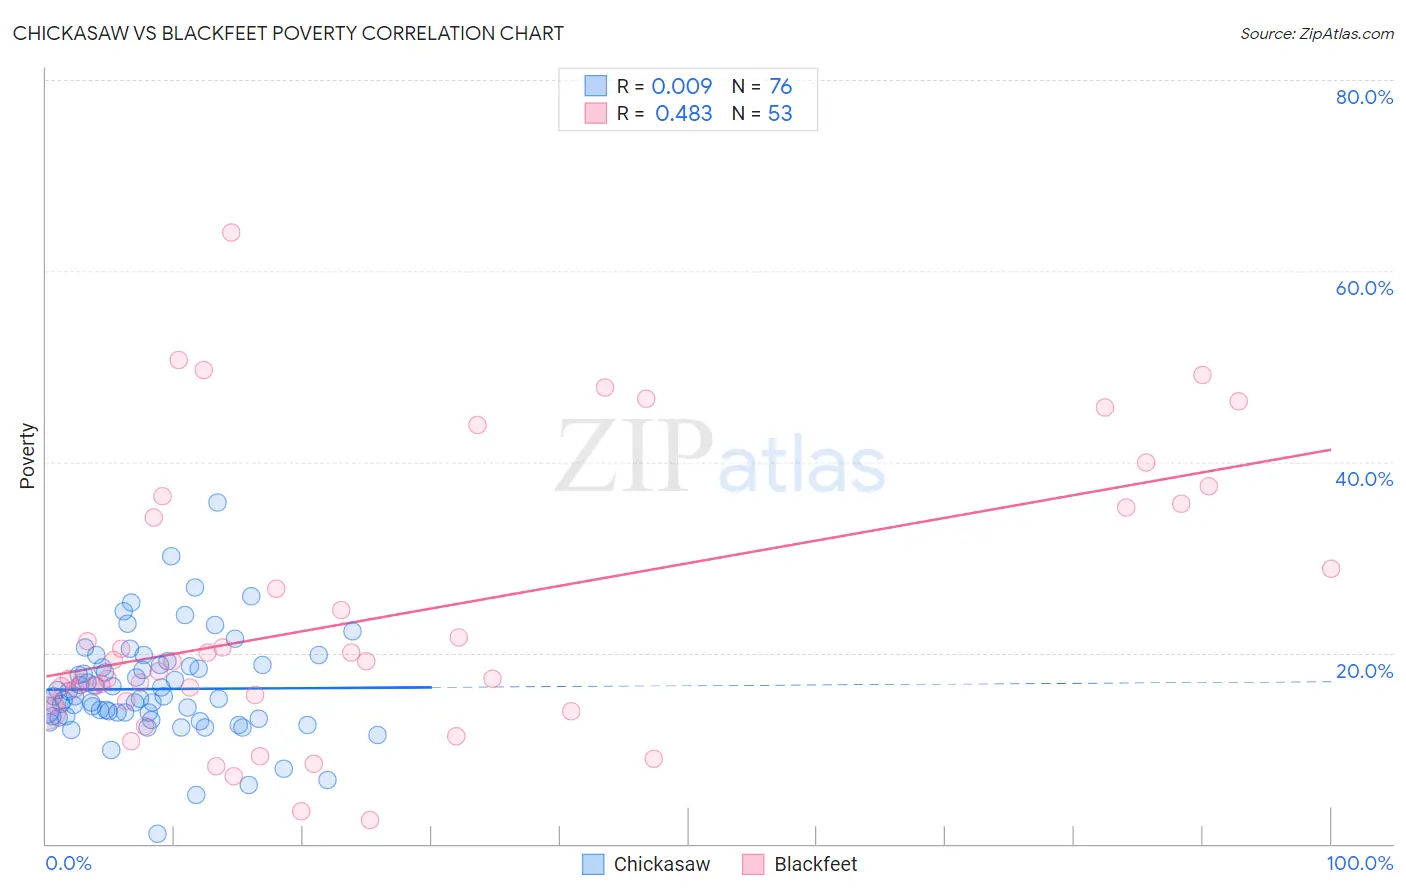
Chickasaw vs Blackfeet Poverty Correlation Chart
The statistical analysis conducted on geographies consisting of 147,672,043 people shows no correlation between the proportion of Chickasaw and poverty level in the United States with a correlation coefficient (R) of 0.009 and weighted average of 14.7%. Similarly, the statistical analysis conducted on geographies consisting of 309,474,623 people shows a moderate positive correlation between the proportion of Blackfeet and poverty level in the United States with a correlation coefficient (R) of 0.483 and weighted average of 15.2%, a difference of 3.6%.
Poverty Correlation Summary
| Measurement | Chickasaw | Blackfeet |
| Minimum | 0.99% | 2.5% |
| Maximum | 35.7% | 64.1% |
| Range | 34.7% | 61.6% |
| Mean | 16.2% | 23.9% |
| Median | 15.3% | 19.1% |
| Interquartile 25% (IQ1) | 13.3% | 14.7% |
| Interquartile 75% (IQ3) | 18.7% | 35.4% |
| Interquartile Range (IQR) | 5.4% | 20.7% |
| Standard Deviation (Sample) | 5.4% | 14.4% |
| Standard Deviation (Population) | 5.4% | 14.3% |
Similar Demographics by Poverty
Demographics Similar to Chickasaw by Poverty
In terms of poverty, the demographic groups most similar to Chickasaw are Shoshone (14.7%, a difference of 0.040%), Spanish American (14.7%, a difference of 0.53%), Central American (14.6%, a difference of 0.63%), Immigrants from Cuba (14.6%, a difference of 0.77%), and Subsaharan African (14.5%, a difference of 0.92%).
| Demographics | Rating | Rank | Poverty |
| Immigrants | Guyana | 0.1 /100 | #265 | Tragic 14.5% |
| Guyanese | 0.1 /100 | #266 | Tragic 14.5% |
| Iroquois | 0.1 /100 | #267 | Tragic 14.5% |
| Sub-Saharan Africans | 0.1 /100 | #268 | Tragic 14.5% |
| Immigrants | Cuba | 0.1 /100 | #269 | Tragic 14.6% |
| Central Americans | 0.1 /100 | #270 | Tragic 14.6% |
| Shoshone | 0.0 /100 | #271 | Tragic 14.7% |
| Chickasaw | 0.0 /100 | #272 | Tragic 14.7% |
| Spanish Americans | 0.0 /100 | #273 | Tragic 14.7% |
| Barbadians | 0.0 /100 | #274 | Tragic 14.8% |
| Immigrants | West Indies | 0.0 /100 | #275 | Tragic 14.8% |
| Immigrants | Bahamas | 0.0 /100 | #276 | Tragic 14.8% |
| Bangladeshis | 0.0 /100 | #277 | Tragic 14.8% |
| Belizeans | 0.0 /100 | #278 | Tragic 14.8% |
| Immigrants | St. Vincent and the Grenadines | 0.0 /100 | #279 | Tragic 14.9% |
Demographics Similar to Blackfeet by Poverty
In terms of poverty, the demographic groups most similar to Blackfeet are Guatemalan (15.3%, a difference of 0.42%), Hispanic or Latino (15.3%, a difference of 0.43%), Indonesian (15.1%, a difference of 0.44%), Immigrants from Zaire (15.1%, a difference of 0.44%), and Immigrants from Bangladesh (15.3%, a difference of 0.47%).
| Demographics | Rating | Rank | Poverty |
| Inupiat | 0.0 /100 | #287 | Tragic 15.1% |
| Yaqui | 0.0 /100 | #288 | Tragic 15.1% |
| Immigrants | Belize | 0.0 /100 | #289 | Tragic 15.1% |
| Mexicans | 0.0 /100 | #290 | Tragic 15.1% |
| Immigrants | Cabo Verde | 0.0 /100 | #291 | Tragic 15.1% |
| Indonesians | 0.0 /100 | #292 | Tragic 15.1% |
| Immigrants | Zaire | 0.0 /100 | #293 | Tragic 15.1% |
| Blackfeet | 0.0 /100 | #294 | Tragic 15.2% |
| Guatemalans | 0.0 /100 | #295 | Tragic 15.3% |
| Hispanics or Latinos | 0.0 /100 | #296 | Tragic 15.3% |
| Immigrants | Bangladesh | 0.0 /100 | #297 | Tragic 15.3% |
| Immigrants | Senegal | 0.0 /100 | #298 | Tragic 15.3% |
| Senegalese | 0.0 /100 | #299 | Tragic 15.3% |
| Immigrants | Central America | 0.0 /100 | #300 | Tragic 15.4% |
| Bahamians | 0.0 /100 | #301 | Tragic 15.4% |